Operational productivity and performance in English NHS Ambulance Trusts: Unwarranted variations - NHS Improvement
←
→
Page content transcription
If your browser does not render page correctly, please read the page content below
Operational productivity and performance
in English NHS Ambulance Trusts:
Unwarranted variations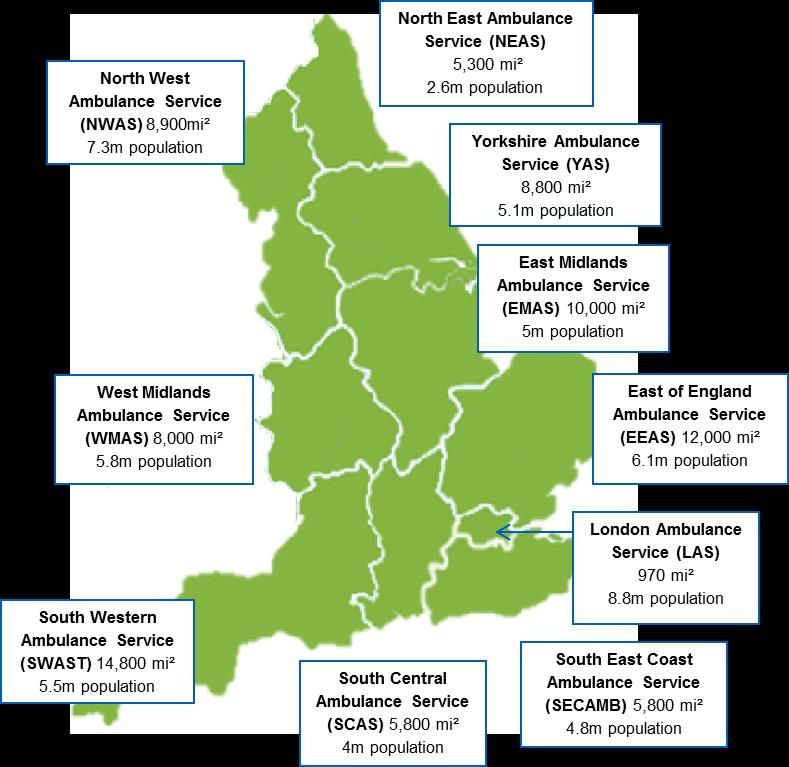
Foreword by Lord Carter of Coles
The ambulance service plays a pivotal role in saving lives and has a major influence on
the flow of patients to hospitals. Trusts answered 10 million 999 calls and responded to
over seven million separate incidents last year. Nine out of 10 of these calls were not
life-threatening but were lower acuity calls, often involving elderly patients, and nearly
60% of responses resulted in a patient being conveyed to A&E. Over two million patients
brought to A&E were admitted to wards and at any one time 40% of all patients in
hospital beds in England will have been taken to hospital in an ambulance.

The speed of response to stroke or cardiac arrest victims can be the difference between
life and death. Ambulance services are also at the forefront of responding to major
incidents. The tragic events at Manchester Arena last year saw the first call to the
ambulance service at 22.32, one minute after the bomb exploded. An advanced
paramedic, self-deployed, arrived on scene 10 minutes later. In this review I have been
struck by the dedication of all those working in the ambulance service.

The Five Year Forward View outlines an ambition to place care closer to home, but
further work is needed to make this a reality. In my review of community health services,
I identified that elderly patients, whose average length of stay in hospital for a non-
elective admission is 13 days, needed a focused approach. Nowhere is this more
evident than when looking at ambulances services. Being taken to hospital in an
ambulance is not always in the best interests of the patient and is sometimes expressly
against their wishes or their agreed care plan. In this review I have identified significant
unwarranted variation in the proportion of patients that ambulance services take to
hospitals across England. Tackling avoidable conveyances to hospital, particularly for
elderly patients, supports delivery of care closer to home, reduces unnecessary
pressures on our A&Es and wards and could release capacity equivalent to £300 million
in the acute sector. Ambulance trusts must play their role, but action is required to
ensure that alternative health services are in place and responsive to patients need.

Delivering effective urgent and emergency care

I consider that there are three structural issues in the provision of health services which
need to be strengthened to improve patient experience and reduce avoidable
conveyance.

1. Ability to access general practice and community services. To reduce avoidable
   conveyance, ambulance staff need to be aware of and able to easily access health
   services in the community. Plans to roll out evening and weekend GP appointments
   to 50% of the public by March 2018 have been met and NHS England are on track to
   deliver 100% by October 2018. However, providers of community services and
   mental health trusts consistently told us they would be able to do more to prevent
   admissions if the healthcare system was more joined up.

2. Urgent treatment centres. About 100 designated urgent treatment centres have
   been established, although this is lagging behind expectations and there are regional
   variations in the provision of these services. NHS England is working with local areas
                                                                                              1
to confirm their delivery plans, but action needs to be taken by strategic and
   transformation partnerships, working with ambulance services, to accelerate
   progress before winter.

3. Hospital handover delays. Ambulance services are well-placed to understand the
   performance of the hospitals as they, along with patients, suffer from unacceptable
   delays at A&E. This has a significant impact on the services ability to get to other
   patients and cost the ambulance service nearly £50 million last winter.

Operational improvement

Since January 2017 we have engaged with all 10 ambulance trusts in England and
talked to the teams and patients who use their services. We have analysed the
productivity of ambulance trusts over time and seen that there has been significant
divergence in their productivity. If all trusts implement the practice of the best, the scope
for greater productivity is around £200 million by 2021. These productivity benefits
should be reinvested in improving patient care to support the Government’s commitment
to return to delivery of key performance standards.

Our work has identified three important areas where operational improvement must be
made.

1. Staff. Ambulance staff do hugely challenging jobs day in, day out. Giving detailed
   attention to ensuring they receive the right level of support is critical. Levels of
   sickness and engagement across ambulance staff are some of the most problematic
   in the NHS and should be addressed culturally. Staff need greater clinical and
   managerial support to ensure they feel confident in treating a patient over the phone
   or on scene and are supported by effective rotas which match supply to patient
   demand.

2. The digital ambulance service. Ambulance services have been at the forefront of
   technological innovation for many years but there needs to be renewed emphasis in
   this area. Auto dispatch technology was proved to shave valuable seconds from
   responses to patients who suffered from cardiac arrest 12 years ago but is yet to be
   fully implemented across all ambulance trusts in England. New technology is not
   adopted rapidly across the service and this, plus the weakness identified in the
   control centre infrastructure, must be addressed. Ambulance services need to plan for
   tomorrow’s service today and develop robust plans to rapidly improve the resilience of
   the infrastructure.

3. Effective fleet management. It is simply unacceptable that trusts purchase different
   ambulances and stock them with different equipment and medicines. This
   demonstrably increases costs and there is an unarguable case to develop a common
   specification across England and move rapidly to centralised procurement for the
   ambulance fleet. Technology like black boxes and CCTV must become standard
   issue and make ready systems must be put in place across the country to drive
   productivity.

                                                                                            2
Throughout the review we identified areas of good practice and ‘what good looks like’.
The challenge to NHS Improvement, NHS England, ambulance trusts and the
Association of Ambulance Chief Executives is how to ensure the approach of the best is
rapidly industrialised across England. Implementation will require leadership, the right
infrastructure and the necessary capability and capacity to drive change.

During the review senior people in the ambulance service have raised questions around
the current model of 10 trusts. I have concluded that now is not the right time to revisit
this issue but that instead trusts should focus on moving to a common infrastructure and
operating model supported by new ways of working such as the alliance formed in the
North. This will deliver the benefits of scale but NHS England and NHS Improvement
should also consider where some aspects of the model will require mandation.
Successful delivery of the recommendations I have made will provide a foundation for
this question to be properly considered in the future.

I am grateful for the opportunity to extend my work and undertake this review. I would
like to thank all those in ambulance services who have devoted significant time to
supporting this review. I would also like to thank my team and those who advised and
supported me over the last 12 months. I am confident that if the recommendations in this
report are implemented, significant savings can be secured in the acute sector through
reduced pressure on A&E and admissions. In doing so, and in addressing some of the
underlying causes of productivity through targeted investment, ambulance trusts will be
able to improve their productivity and get on the path towards consistently achieving
constitutional performance standards across England.

Lord Carter of Coles

September 2018

                                                                                         3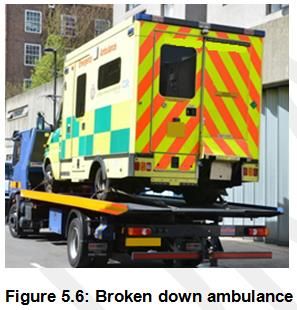
Contents

Executive Summary ............................................................................................................ 5
Chapter 1: Ambulance services ........................................................................................... 8
Chapter 2: Productivity of the ambulance service............................................................... 17
Chapter 3: Improving ambulance service productivity ........................................................ 28
Chapter 4: Workforce, leadership and human resource processes .................................... 37
Chapter 5: The ambulance fleet ......................................................................................... 47
Chapter 6: Control centres and the digital ambulance service ............................................ 57
Chapter 7: Optimising non-clinical resources ..................................................................... 69
Chapter 8: Securing effective implementation .................................................................... 75
Thanks and acknowledgements ...................................................................................... 80

                                                                                                                              4
Executive Summary
This document sets out our conclusions from the review into the operational productivity
of the 10 English ambulance trusts. The review commenced in June 2017 and has
received significant support from the trusts and many others. We have focused on the
urgent and emergency service, which makes up the bulk of trusts expenditure. NHS 111
and patient transport services are considered in the context of their impact on these
services. We have also looked at the impact that decisions ambulance staff make and
the significant variation between trusts in the number of patients conveyed to A&E.
Reducing avoidable conveyance could save £300 million across the wider health system
by treating these patients at home or directing them to more appropriate health services.
This requires significant improvements in the availability and accessibility of the urgent
and emergency care system.

The demand for ambulance services has risen significantly over the past five years and
is likely to continue to do so. Improvements in operational productivity will be key to
meeting this rising demand. We found that while the service’s overall productivity has
improved, the significant differences in the productivity of individual trusts indicates more
can be achieved. We identify the steps trusts can take to move to a common, more
efficient operating model. Effective implementation could be worth up to £200 million by
2021 and help improve performance. The review identified examples of good practice
across the service to help achieve this. We make nine recommendations over eight
chapters to improve the unwarranted variation in productivity across the ambulance
service and ensure better, more appropriate care for patients.

Chapter 1: Ambulance services

Ten ambulance trusts respond to 10 million 999 calls every year across England to
provide lifesaving urgent and emergency care. This costs around £1.8 billion, or £33 per
person, and services are contracted by 10 lead commissioners. We found the cost of
these services varied between trusts, some of which is caused by factors outside their
control, such as geography. Some trusts also provide NHS 111 and patient transport
services and over 40,000 people are employed across trusts. Demand has increased by
6% a year and there is no national forecasting. Maintaining effective relationships across
the wider health system is difficult for ambulance trusts due to their relatively small scale.
This means the impact of wider service reconfigurations on ambulance trusts is often not
considered. Performance has come under sustained pressure and new standards were
introduced in 2017 to provide a better, more appropriate service to the public. Some
trusts are performing well but others are not meeting the new standards.

Chapter 2: Productivity of the ambulance service

The ambulance service has become more productive over time but we found a
significant and increasing disparity between trusts in the key drivers of productivity: the
categorisation of calls; the model of care provided to patients; the length of time taken to
resolve an incident; and, the overall staff time this takes. Factors outside the ambulance
trusts control will impact productivity such as the ability to access suitable alternative

                                                                                            5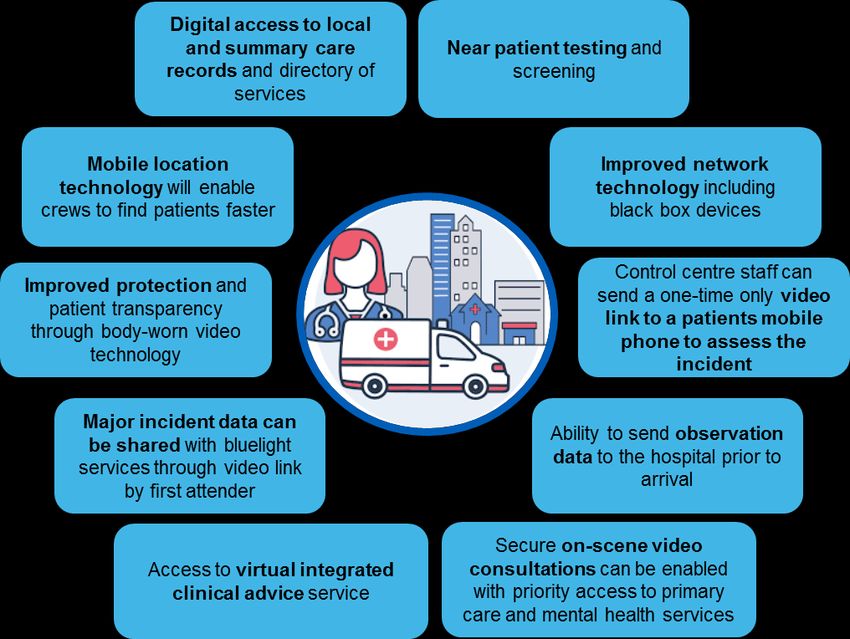
healthcare services and delays at A&E when handing over patients. Ambulance trusts
must be supported to identify productivity improvements by being routinely provided with
operational benchmarking data.

Chapter 3: Improving ambulance service productivity

Delivering the best outcome for patients and helping them stay at home can be achieved
by reducing avoidable conveyance and will also enable productivity improvements. NHS
England is leading a programme to strengthen the urgent and emergency care system
to support this aim. Ambulance trusts can enable improvements by: standardising
clinical assessment offers in control centres; enabling access to patient information;
empowering staff to make clinically appropriate decisions; and utilising a consistent
workforce skill mix. We found there is no standard frontline utilisation measure for the
ambulance service. Ensuring resources are used and monitored effectively is integral to
improving productivity, and trusts can improve this by: using demand modelling software;
optimising clinical support; improved rota and fleet management; adopting enabling
technologies and implementing a make ready system.

Chapter 4: Workforce, leadership and human resource processes

Ambulance staff have a vital part to play in improving productivity and providing better
care for patients. Significant investment has been made into improving pay and training
for paramedics to provide better care for patients. However, staff are not always
supported to do this as engagement is low across the service. We found sickness
absence was the highest of all NHS sectors at an average of 20 days per person per
year and work has begun to address this. Across the service there are recruitment and
retention issues, the highest levels of bullying and harassment in the NHS and
unacceptable violence towards staff. Workforce, recruitment and wellbeing plans must
tackle these issues and provide staff the support they need.

Chapter 5: The ambulance fleet

Over £200 million every year is spent on the service’s fleet of around 5,000 vehicles.
There is no standard ambulance across the country with 32 types of double crewed
ambulance in operation and no standard list of what is carried on board. There are
substantial differences in the average age of the fleet between trusts and different fuel
delivery methods are used. Fleet management can be strengthened through
improvements in the information systems and a greater focus by trust boards. Black box
technology and CCTV in ambulances has enabled significant savings in fuel and
accident reductions but less than half of them have this fitted. To drive efficiencies in this
area, a standard specification for an ambulance should be developed, supported by
effective fleet management systems and utilising black box technology. Trusts should
work together to leverage combined purchasing power through centralised procurement.

Chapter 6: Control centres and the digital ambulance service

Across the country there are 22 control centres with each trust having at least two in
case of a site failure. There is no standard operating procedure across trusts and there

                                                                                             6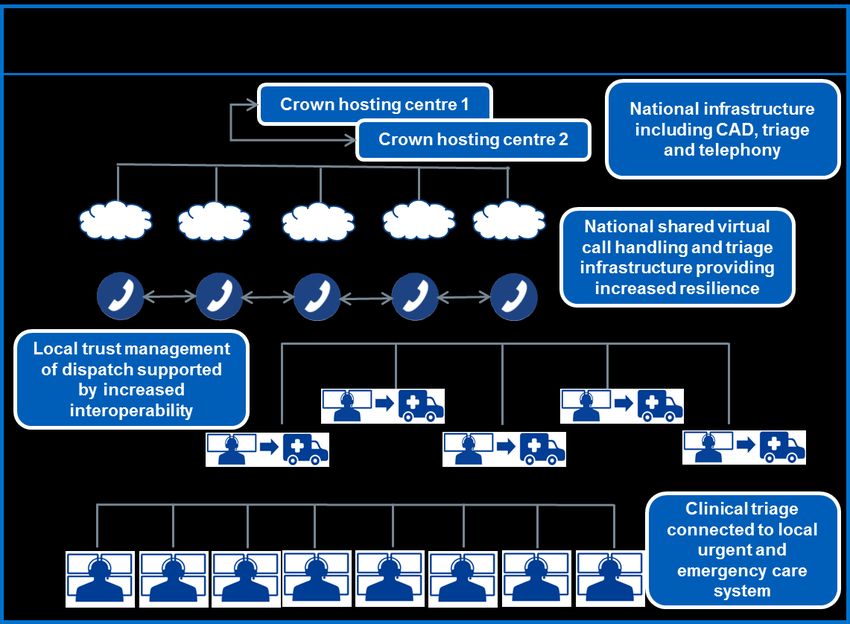
are significant differences in their performance. Resilience is an issue across the service
that must be addressed to ensure current and future demand increases can be met.
Staff recruitment and retention in control centres are challenges and wellbeing initiatives
must be shared. There is limited interoperability as trusts use different triage, computer,
and telephony systems. Ambulance trusts must improve performance and implement
more common systems. They should also exploit new technologies and develop
proposals to deliver a modern resilient infrastructure in the longer-term.

Chapter 7: Optimising non-clinical resources

Effective frontline care is enabled by efficient estates, procurement and corporate
services. Trusts estates are structured differently, partly to meet local demand, but there
are opportunities to rationalise and modernise this using the make ready system.
Ambulance services spend the highest on average in the NHS on corporate services as
a proportion of turnover, which may be partly due to their smaller size. However, we
found considerable variation between ambulance trusts. Trusts are paying significantly
different prices for the same goods and benchmarking data must be used to identify
potential opportunities. Aggregation and collaboration between trusts and the wider
health system should be exploited in these areas to enable savings.

Chapter 8: Securing effective implementation

To ensure successful implementation of the recommendations, NHS Improvement and
NHS England will provide the required support to trusts through the joint Ambulance
Improvement Programme. They must help trusts to identify opportunities for
improvement by presenting their data in a comparable way through the Model
Ambulance Service portal. Using this benchmarking data, trusts should work together to
improve performance and remove unwarranted variation in the current configuration. A
common operating model for the ambulance service can then be developed to ensure a
more consistent and better service for patients. To support delivery of the conclusions of
the review, we recommend building key requirements into the NHS business rules for
ambulance services, including the NHS Standard Contract, national tariff and
commissioning for quality and innovation (CQUIN), and support the development of
alliances across ambulance trusts.

During the review we analysed a significant amount of data and some of this is
represented in the report. In the report we used, where possible, publicly available data.
Where information was sourced directly from trusts we undertook a comprehensive
quality assurance, with trusts offered the opportunity to review and correct the data. A
representative from the National Ambulance Information Group also reviewed the overall
data set. This does not guarantee the data is perfectly accurate, however the process
we undertook with trusts means that we are confident that it is a fair reflection of the
overall position of ambulance services.

                                                                                          7
Chapter 1: Ambulance services
The ambulance service provides unplanned assistance 24 hours a day, 365 days a year
in response to 10 million 999 calls every year. Staff are trained and equipped to deal
with a wide variety of situations ranging from major incidents and life-threatening
conditions, to providing support for frail and elderly patients. They are supported by
control centre staff who receive and triage calls, dispatch the right vehicle and provide
clinical advice to patients over the phone. There are 10 NHS ambulance trusts in
England delivering services within defined boundaries as shown in Figure 1.11.
Figure 1.1: Geography of the English ambulance service 2
Ambulance crews deliver timely and lifesaving emergency care daily to people who
suffer from life changing conditions such as cardiac arrest, trauma and stroke.
Ambulance trusts are measured against key quality indicators and these demonstrate
1 Ambulance services on the Isle of Wight are delivered by the Isle of Wight NHS Trust
2 Figures sourced using data from Office of National Statistics, www.data.gov.uk and NHS England.
8that patients now get better quality care, for example: 97% of patients with a suspected
stroke now receive the right package of care compared to 92% in 20113.
The number of calls to the ambulance service has steadily risen over a number of years
and the profile of patients it cares for and supports has changed. Calls for life
threatening emergencies now only make up 10% of demand, with the remainder mostly
for patients with urgent primary, social or mental health care needs 4. This change in
demand has placed significant pressure on ambulance services. The service has
evolved from one that focused on conveying patients to hospital to ensuring patients
receive the right and appropriate care for their needs.
Figure 1.2: Ambulance response models of care now provided to patients,
NHSE England Ambulance Quality Indicator (AQI) data set 2017/18
Variation in the cost of delivering services
Ambulance trusts spent £1.8 billion last year providing urgent and emergency care.
Each face-to-face incident costs on average £267, which equates to about £33 for each
person in England. However, there is variation between trusts.
Cost per face-to-face incident Cost per head of population
£300 £40
£200 £30
£20
£100
£10
£0 £0
Figure 1.3: The variation in cost between ambulance trusts, Reference Costs
2016/17 and AQI data set 2016/17
3 https://www.england.nhs.uk/statistics/statistical-work-areas/ambulance-quality-indicators/
4 Department of Health (2005), Taking Healthcare to the Patient: Transforming NHS Ambulance Services
9These cost variations are caused by a range of factors, including: demographics,
performance, the geography of an area, and the underlying productivity of the trust.
Last year the total expenditure for ambulance services was £2.3 billion, with the
remaining £500 million spent delivering NHS 111 and patient transport services (PTS).
These services are subject to competitive tendering and this review has focused on the
productivity and efficiency of 999 urgent and emergency services. NHS 111 and PTS
were only considered in the context of their impact on the provision of urgent and
emergency services.
Ambulance workforce
The majority of expenditure is on pay. The 10 ambulance trusts employ over 40,000
people in over 70 different roles from several professional groups, including paramedics,
physiotherapists, nurses and administrative staff.
Figure 1.4: Ambulance service expenditure and workforce composition, NHS
Improvement summary data request, November 2017, and NHS Financial
returns, 2016/17
Around 85% of staff are directly involved in the delivery of operational services. Non-pay
areas include fleet, estates, procurement and privately contracted services.
How services are commissioned
Ten lead Clinical Commissioning Groups (CCGs) commission ambulance services. They
procure these on behalf of the 195 CCGs. Services are commissioned in different ways,
with seven trusts on block contracts, two on activity-based contracts, and one with a
10mixed contract. The National Audit Office report (2017) recommended that CCGs should
take a consistent approach to commissioning ambulance services 5.
Commissioning plays a significant role in the shape of the health service and ambulance
trusts need to be seen in the context of wider provision. Ambulance trusts and CCGs
must work together to co-design the system and develop effective pathways for urgent
and emergency care. This includes integrated 999 and NHS 111 call handling and triage
to ensure that the impact of decisions in local areas considers the effect on ambulance
services. Through this collaborative approach trusts will be able to manage demand
more appropriately and reduce avoidable conveyance to A&E.
This year’s report into the Operational Productivity of Mental Health and Community
Health Services highlighted the frictional cost of commissioning services and we
identified similar challenges for ambulance trusts in this review6. The 42 Sustainability
and Transformation Partnerships (STPs) across England enable NHS organisations and
local councils to work together to improve regional health and care. Each ambulance
trust covers between two to eight STPs, increasing the challenge of building and
maintaining relationships with stakeholders, particularly given their relatively small size.
One trust calculated that invitations to STP and CCG meetings stipulating executive
director attendance would take up over 65 hours in one month alone. STPs and others
need to work out effective mechanisms for managing their relationships with the
ambulance service.
Demand
Over the last five years there has been a sustained increase of 6% a year in the number
of 999 urgent and emergency calls7. Operational Research in Health, an organisation
that specialises in emergency service planning, forecasts that future demand is likely to
increase by at least a further 38% in the next 10 years8. We found that demand varies
significantly between trusts.
5 National Audit Office (2017), NHS Ambulance Services, https://www.nao.org.uk/wp-
content/uploads/2017/01/NHS-Ambulance-Services-Summary.pdf
6 Operational Productivity of Mental Health and Community Health Services, 2017
https://improvement.nhs.uk/about-us/corporate-publications/publications/lord-carters-review-unwarranted-
variations-mental-health-and-community-health-services/
7 Source: NHS England Ambulance Quality Indicator Data Set
8 Operational Research In Health ‘A decade of change: the capacity challenge’ presentation to the Ambulance
Leadership Forum, 20 March 2018. This increase is when population changes and trends in rates of access to
A&E are considered.
11Call volumes and NHS 111 Calls per 10,000 population
transfers
12,000 2,500
10,000 2,000
8,000
1,500
('000)
6,000
1,000
4,000
500
2,000
0 0
999 calls NHS 111 transfers
Figure 1.5: Demand has increased across ambulance services including
transfers from NHS 111. Variation exists in call demand between trusts. NHS
111 minimum data set and AQI data set 2016/17.
The public makes nearly three quarters of calls to the ambulance service, with the
remainder made by the police and healthcare professionals, including nursing homes
and GPs. Some trusts have analysed the future demand for their services, but demand
and the impact it will have on ambulance services is not nationally forecasted. This limits
the ability of the ambulance service, commissioners and the Department for Health and
Social Care to plan for the future.
Managing demand is an important part of delivering a productive and effective
ambulance service. High intensity users or frequent callers are usually defined as people
who contact the ambulance service five or more times a month. Often these callers have
chronic long-term physical health problems or mental health conditions but trusts also
highlighted that some of these calls may be inappropriate referrals from other agencies
and care homes.
Case study – Reducing avoidable demand
In 2017, North West Ambulance Service NHS Trust identified that some care homes
were calling 999 for patients that could be better cared for in alternative health services.
They built an evidence based model with clinicians for care home staff to identify which
service should be contacted depending on the patient condition. The assessment
model is now being used in over 200 care homes and has reduced the number of times
they call 999 by 30%.
While all trusts have approaches to manage demand, few know if their interventions are
having an impact. NHS RightCare is leading the rollout out of the high intensity user
12programme, now in place across 20% of the country, to ensure good practice guidance
is nationally available to assist ambulance trusts managing high intensity service users 9.
Performance
The performance of the ambulance service has been measured against a set of time-
based targets since 1975. These were based on the increased probability of survival if a
patient with a life-threatening emergency, such as a cardiac arrest, received a quicker
response. The delivery of operational performance against these standards has come
under increasing pressure across the service in recent years.
Response time performance
100%
90%
80%
70%
60%
2012/13 2013/14 2014/15 2015/16 2016/17
Red 1 & 2 responses within 8 minutes Red 19 responses within 19 minutes
Figure 1.6: Performance of the ambulance service against the highest acuity
categories has reduced over time, AQI data set 2016/17
The shift from mostly life-threatening to more urgent and emergency conditions,
combined with increasing demand, meant that the standards were no longer appropriate
for patients and were impacting performance. In 2017, NHS England led the introduction
of the new performance standards designed to provide the most appropriate response
the first time for each patient10.
9 NHS RightCare (2017), Setting up a High Intensity User Service, https://www.england.nhs.uk/rightcare/wp-
content/uploads/sites/40/2017/02/high-intensity-resource.pdf
10 NHS England, New ambulance standards, https://www.england.nhs.uk/urgent-emergency-care/arp/
13Figure 1.7: Ambulance service performance standards, NHS England 2017
Call handlers now have more time to identify the nature of the call before dispatching the
appropriate resource, except for category 1 calls that require the quickest response. A
Sheffield University study concluded that this change in approach could save over 250
extra lives every year across the country and it could also enable significant efficiencies
across the service11.
However, since the introduction of the new standards performance remains mixed.
Category 1 mean response times Category 2 mean response times
10:00 35:00
30:00
08:00
25:00
06:00 20:00
04:00 15:00
10:00
02:00 05:00
00:00 00:00
Figure 1.8: Ambulance service response times in minutes, where a trust below the
line are meeting the standard, AQI July 2018
In July 2018, eight of the 10 trusts did not meet the category 1 response standard.
Category 2 calls make up the majority of demand and eight trusts did not meet the 18
minute average standard during July 2018. The variation between trusts in the time they
11
The University of Sheffield, Ambulance Response Report,
www.sheffield.ac.uk/scharr/sections/hsr/cure/newsstories/arpreport
14took to respond to these emergency calls is significant from 13 to 33 minutes. The
current performance pressures highlight the importance of productivity improvements to
help bridge the gap.
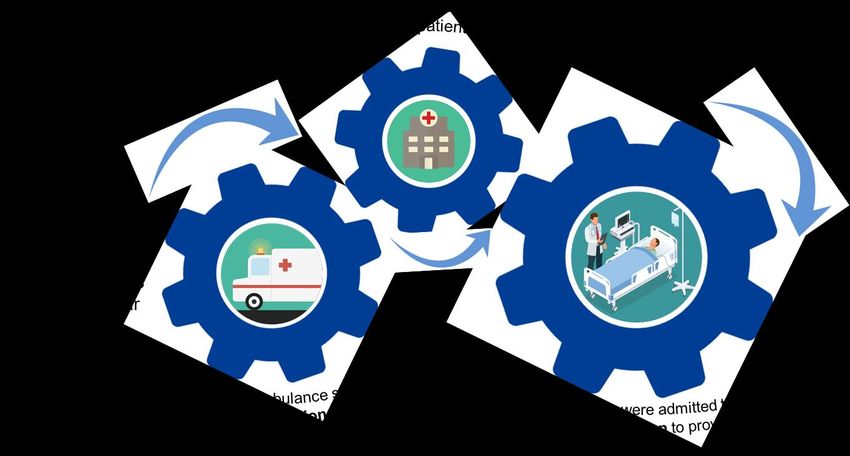
The ambulance service and the wider system – the ‘gearing’ effect
The decisions made by staff on the frontline of ambulance services, particularly whether
it is necessary to convey a patient to hospital, has a significant impact on the wider
health system. We analysed this impact and found that patients brought into hospital in
an ambulance occupy around 40% of hospital beds in England at any one time.
Figure 1.9: The wider system costs of patients conveyed to A&E by ambulance
The health system must ensure that patients’ best interests and preferences are met and
that they are treated as close to home as possible. However, sometimes ambulance
crews take patients to hospital when they could be better managed at home or by other
health services. These are known as avoidable conveyances. They are not poor
decisions made by ambulance crews as often they don’t have the information needed or
access to the right alternative health services, and taking the patient to A&E is the only
option.
Case study – Providing patient-centred care closer to home
Coordinate My Care is a service that trains clinicians to create advanced care plans to
improve end of life care. In March 2018, London Ambulance Service NHS Trust
introduced mobile devices for all crews to access advanced care plans. Paramedics
can then carry out patients personal wishes such as taking them to their preferred
place of care and death. These patients are then less likely to have emergency
hospital admissions in the final months of their life. Where advanced care plans are in
place, 80% of people die in their preferred place.
15Reducing avoidable conveyances to hospital can have a wide range of benefits,
including reducing costs for ambulance services, the wider system and supporting the
aim of delivering services closer to home for patients. NHS England has modelled that
savings equivalent to over £300 million could be seen if overall conveyances were
reduced to 50%. These are mainly from reduced costs of A&E attendance and
subsequent admissions. In the review, trusts told us they are working to reduce
avoidable conveyance but it requires a system wide approach to enable better access to
more appropriate services.
16Chapter 2: Productivity of the ambulance service
The review focused on understanding the overall productivity of ambulance services and
the variation between trusts. We analysed and benchmarked data from trusts’ Computer
Aided Dispatch (CAD) systems. This enabled us to isolate the key drivers of frontline
productivity and identify that the productivity of ambulance services is highly dependent
on other parts of the health service working effectively. The ambulance service holds
significant data in its systems, but this information is not standardised or accessible. This
means that trusts cannot easily benchmark and interrogate their frontline performance
against their peers.
Understanding productivity
It is not possible to directly compare the productivity of ambulance trusts through simple
calculations, such as the cost per incident or the cost per head of population. This is
because they do not take into account variations in the population or geography of a
trust, which can significantly impact the cost of providing ambulance services. For
example, it is relatively more expensive to ensure that ambulances can meet the time
standards in a sparsely populated rural area compared to a densely populated urban
area. In the review we found there was no single national measure that could be used to
benchmark the productivity between trusts.
We reviewed a number of different approaches that seek to analyse the productivity of
ambulance services, including the work of the Australian Government Productivity
Commission. Its 2017 report compared the productivity of individual ambulance state-
level organisations over time rather than against each other12. We adapted this
methodology to produce an indicative productivity index for all trusts in England. This is
calculated by dividing the number of calls by the cost and then adjusting for performance
over time. Figure 2.1 shows the productivity of the highest and lowest performing trusts.
12 Australian Government Productivity Commission (2017), Ambulance Services, page 11.17,
https://www.pc.gov.au/research/ongoing/report-on-government-services/2017/health/ambulance-services
17Ambulance productivity index
130
120
110
100
90
80
2013/14 2014/15 2015/16 2016/17
Highest performing trust Lowest performing trust Median
Figure 2.1: Indicative quality adjusted productivity index of the English
ambulance service where a higher score means a trust is more productive,
Reference Costs and AQI data set 2016/1713
This shows that on average the service has become more productive over time, but that
there has been a significant divergence between trusts. The highest performing trust
improved productivity by nearly 30% over the period, while the lowest performer reduced
by 15%. We repeated the analysis using the number of incidents instead of call volumes.
This showed a similar range in productivity between trusts. We found the trusts that
improved their productivity generally started at, and then maintained, higher levels of
performance and clinical standards. This shows that productivity can be improved
without impacting on quality and performance.
Further work is required to develop the methodology and improve data quality, but this
analysis is consistent with the view from trusts that there has been a significant
improvement in productivity in some services, but others require further support.
Understanding what drives variation in productivity between trusts, identifying what good
looks like and how to rapidly share this across the service forms the core of this review.
Key drivers of productivity
We reviewed performance across a number of related areas to analyse the underlying
productivity of ambulance services. These included: the way in which calls are
categorised; the type of response or model of care that is provided to the patient; the
time taken to resolve an incident involving a patient, known as the job cycle time; and
the overall staff time deployed for each incident. We found significant unwarranted
variation in all these areas.
Call categorisation
When someone calls the ambulance service, their call is triaged and placed in one of the
four categories set out in Chapter 1. This categorisation determines the level of urgency
of the response provided by the ambulance service. For example, category 1 calls
13The index was calculated by dividing the number of quality adjusted calls by inflation adjusted reference costs.
A 20% weighting was given for ‘quality’ based on call performance against the highest acuity call time
performance standards over the period. The data excludes 111 and other service transfers as these are not
currently available at trust level. The index may therefore underestimate productivity performance.
18should be responded to in a mean time of seven minutes whereas the service has three
hours to respond to the 90th percentile of category 4 calls. Ensuring calls are
appropriately triaged has a direct impact on the costs of providing services and
importantly preserves resources for patients with the most urgent health needs. We
found significant variation in the distribution of call categories between trusts.
Calls by category
YAS
EMAS
NWAS
EEAS
LAS
SWAST
NEAS
SCAS
WMAS
SECAMB
0% 10% 20% 30% 40% 50% 60% 70% 80% 90% 100%
Category 1 Category 2 Category 3 Category 4
Figure 2.2: The volume of calls trusts receive differ by call category, AQI data
set January 2018 to July 2018
Some trusts reported almost twice the level of category 1 calls compared to other trusts,
and generally those with a greater number of category 1 calls had a higher acuity of
triaged calls overall. This means an increased cost of providing responses because of
the required time targets for these calls. Across the ambulance service over half of all
calls are triaged as category 2. These are calls that are considered emergencies and
require a mean response of 18 minutes. Trusts triage between 49% and 66% of calls as
category 2. Category 3 calls are considered urgent but require a response within two
hours for the 90th percentile of calls. There is considerable variation in the number of
category 3 calls between trusts from 21% to 42%. Some trusts are triaging half the
amount of category 3 calls as compared to category 2. NHS England found that variation
in the way in which ambulance services determine the call categorisation is generally
unwarranted. We support their reconstitution of the Emergency Code Prioritisation
Advisory Group to reduce unwarranted variation in call categorisation and prioritisation.
As noted in Chapter 1, a growing proportion of calls to the ambulance service are triaged
and categorised by NHS 111. When these are passed to the ambulance service, trusts
cannot re-categorise calls unless there is new information on the patient’s clinical
condition. We observed significant differences in the number of calls that are passed
through by NHS 111 to ambulances trusts.
19Calls transferred from 111
20%
15%
10%
5%
0%
LAS SECAMB WMAS NWAS SCAS YAS SWAST EMAS EEAS NEAS
Figure 2.3: Variation in demand from NHS 111 across the ambulance service as
a proportion of total calls received, NHS Improvement Summary Data Request
Q1 & Q2 2017/18
Since March 2018, NHS England has required all NHS 111 providers to clinically
revalidate category 3 and 4 calls before passing them to the ambulance service. Within
the first two months the number of calls passed to trusts by NHS 111 from these
categories reduced by 40%. Moving to a standardised triage model will enable
efficiencies to be realised and ensure patients receive an appropriate level of care.
Model of care
After a call is categorised, the ambulance service provides an appropriate response or
model of care. There are three main models of care: hear and treat, see and treat, and
see and convey, as described in Figure 1.2.
Incident response types
NWAS
LAS
EMAS
YAS
EEAS
SECAMB
NEAS
WMAS
SCAS
SWAST
0% 10% 20% 30% 40% 50% 60% 70% 80% 90% 100%
Hear & Treat See & Treat See and convey to other service See and convey to A&E
Figure 2.4: Variation in the model of care provided by trusts, AQI data set
January 2018 to July 2018
Hear and treat and see and treat levels differ significantly between trusts. This leads to
substantial differences in the proportion of patients who are conveyed to A&E from 52%
to 64%. There is also considerable variation in the proportion of patients that are
transported to other services, mainly urgent treatment centres, from 3% to 12%. This
largely reflects the availability and accessibility of these alternative services to the trusts.
20The type of response the ambulance service provides to a patient will depend on their
presenting condition. We have explored the extent to which variation in the model of
care provided to a patient relates to the severity of the call.
Response type by category
Category 1 Category 2
NWAS NWAS
LAS LAS
YAS YAS
EMAS NEAS
NEAS SECAMB
EEAS EMAS
SCAS SCAS
SECAMB EEAS
WMAS WMAS
SWAST SWAST
0% 20% 40% 60% 80% 100% 0% 20% 40% 60% 80% 100%
Category 3 Category 4
NEAS NEAS
LAS NWAS
NWAS LAS
YAS EEAS
WMAS YAS
SECAMB SWAST
SCAS WMAS
EEAS SCAS
SWAST SECAMB
EMAS EMAS
0% 20% 40% 60% 80% 100% 0% 20% 40% 60% 80% 100%
Figure 2.5: The model of care provided by each trust shows the variation even
when the severity of the call is taken into consideration, NHS Improvement
Computer Aided Dispatch (CAD) data request December 2017 to May 201814
The likelihood of a patient requiring conveyance is directly linked to the category of call
and the most significant variation is seen between the lower acuity call categories.
Conveyance rates for category 4 calls are between 3% and 53% and indicate significant
scope to reduce avoidable conveyance. STPs and ambulance trusts should work
together to regularly review the effectiveness of change in the configuration and
accessibility of health services in the community and the impact on conveyance.
Job cycle time
An incident is when a call is connected to the ambulance service and a clinical response
is provided. The total time taken responding to an incident is known as the job cycle time
(JCT), the key stages of which are recorded on trust CAD systems.
14 Category 4 and category 4 H have been combined for this graph.
21Figure 2.6: The stages of the job cycle time
There is little trusts can do to influence some elements such as travel time, which is
largely dependent on the areas that they cover, and call connect to resource allocated
will be dependent on the availability of resources. The most significant elements of the
JCT that can be operationally influenced are the time trusts spend on scene and hospital
handover time. The latter element requires ambulance and acute trusts to work together
as it is a shared responsibility. We analysed the JCT and found variation between trusts.
See and convey job cycle time
EEAS
EMAS
SWAST
SECAMB
LAS
WMAS
YAS
NEAS
NWAS
SCAS
0 20 40 60 80 100 120
Call connect to allocated resource Travel to scene On scene Travel to hospital Hospital handover
Figure 2.7: The average time taken by trusts at each stage of an incident when
they convey a patient to A&E, CAD data request December 2017 to May 2018
We reviewed the JCT against the call category and found considerable variation
between trusts, again particularly for patients in lower categories.
22Job cycle time by category (see and convey)
Category 1 Category 2
EEAS EEAS
SECAMB EMAS
SWAST SWAST
LAS LAS
EMAS SECAMB
NEAS YAS
YAS NEAS
WMAS WMAS
NWAS NWAS
SCAS SCAS
0 25 50 75 100 125 150 0 25 50 75 100 125 150
Category 3 Category 4
EMAS
SWAST
EEAS NWAS
SECAMB EEAS
SWAST LAS
LAS SECAMB
NEAS YAS
YAS NEAS
NWAS EMAS
SCAS SCAS
WMAS WMAS
0 25 50 75 100 125 150 0 25 50 75 100 125 150
Figure 2.8: The category in which a call is placed will impact the see and convey
job cycle time, CAD data request December 2017 to May 2018
Overall JCT increases as the severity of the call decreases and the variation becomes
more pronounced as the categories reduce in acuity. Variation in call connect to
resource allocation will be affected by the availability of resource. On scene time is more
readily managed and the data shows considerable variation between trusts.
The model of care delivered also influences the overall JCT. When a patient is treated
on scene, the total JCT is shorter as the incident will not require any time spent
conveying them or handing them over to hospital. This means it is always more efficient
at an aggregate level for the ambulance service to deliver clinically appropriate see and
treat to a patient than to convey a patient despite the longer on scene times15.
15We have assumed a clinically appropriate see and treat will not result in the patient re-contacting the service
about the same condition. Further work is required to assess this relationship
23Job cycle time by response type
See and Treat
See and
Convey
0 25 50 75 100
Figure 2.9: The average time taken by trusts at each stage of an incident when
treated at scene against those conveyed to A&E for all call categories, CAD
data request December 2017 to May 2018
The data shows that trusts with longer on scene times generally see and treat more
patients. Overall, for every 10% reduction in the number of incidents conveyed, there is
an increase in on scene time of two minutes and 20 seconds. In simple terms, this
means that as trusts reduce avoidable conveyance, on scene times are likely to
increase. This will be important for trusts and commissioners to include in service
planning, but it is highly unlikely to outweigh the overall benefit of reducing avoidable
conveyance for patients, the ambulance service and the wider health system.
Reducing hospital handover delays
Handover of a patient to hospital should usually take no longer than 30 minutes. This is
made up of two 15 minutes stages: the pre-handover phase where the crew book the
patient into A&E; and a post-handover phase where they get the ambulance ready
before making themselves available to respond to the next incident. It is important to
note it is not always possible to be ready for a new case in 15 minutes. For example,
staff should be allowed time to emotionally recover if they need it after dealing with a
stressful incident. However, the 30 minute standard is now routinely breached.
Over the last decade, the time an ambulance spends at hospital has increased by 32%
from an average of 27 minutes to 35 minutes per patient16. This is largely caused by the
delays in the pre-handover stage. The additional time ambulances spent at hospital last
year was equivalent to £12 million a month in lost time across the service over the winter
period. More importantly this reduces the ability for trusts to respond to calls as their
crews are at hospitals waiting to transfer patients and the delays can be bad for patients
as it risks their condition deteriorating.
There is a disproportionate impact of handover delays across different trusts costing
from between 38,000 to 172,000 staff hours over six months.
16Operational Research In Health ‘A decade of change: the capacity challenge’ presentation to the Ambulance
Leadership Forum, 20 March 2018
24Handover hours lost
90,000
75,000
60,000
45,000
30,000
15,000
-
NEAS SCAS YAS WMAS SWAST SECAMB EEAS EMAS NWAS LAS
Pre-handover hours lost Post-handover hours lost
Figure 2.10: The number of hours lost to pre- and post-handover delays at
A&Es across the ambulance service, CAD data request December 2017 to May
2018
NHS England and NHS Improvement have set clear guidance for local A&E delivery
boards in how to tackle hospital handover delays. It sets out expectations around normal
working practice and the actions they must take if ambulances start to queue. Delays of
over 60 minutes should never be tolerated and action must immediately be taken to
tackle them, with all incidents escalated to the regional team. Boards should also
concentrate on reducing delays of between 30 minutes and one hour.
A&E boards should deliver improvement initiatives such as redirecting avoidable
demand by having senior clinicians at the front door to triage patients and having staff
maintaining ownership of handovers, rather than a hospital ambulance liaison officer.
NHS Improvement launched the ‘fit to sit’ initiative in 2017 to encourage frontline staff to
identify patients able to wait in a chair rather than on an ambulance stretcher, allowing
earlier help of release crews to respond to the next call17. All boards are expected to
agree local standard operating procedures to reduce these unacceptable delays for
patients and trusts.
Ambulance services supporting patients with mental health conditions
It is important that ambulance services respond appropriately and effectively to all urgent
and emergency calls and this includes those relating to mental health. We have
analysed data from the nature of call data set. It is a pre-triage system whose purpose is
to predict, as early as possible, what the likely triage category will be. The actual
disposition and severity will often change as the call proceeds. However, this data
provides a basis to examine the number of calls that relate to mental health.
The nature of call data set identifies mental health as the primary cause of around 2% or
340,000 calls every year to the ambulance service. Analysis showed there is significant
variation in the conveyance rates from 27% to 54%. We reviewed the job cycle time for
these calls which also shows significant variation between trusts at each stage.
17 https://improvement.nhs.uk/resources/are-your-patients-fit-sit/
25JCT for patients presenting with a mental health condition
LAS
EEAS
EMAS
SWAST
SECAMB
NEAS
WMAS
NWAS
SCAS
YAS
0 20 40 60 80 100 120 140
Minutes
Call connected to allocated resource Travel to scene
On scene Travel to hospital
Figure 2.11: Variation at each stage of an incident for patients who have been
identified with a mental health condition as the nature of call, CAD data request
December 2017 to May 2018
Call to dispatch times are significantly longer for these patients and we were told this is
mostly because they are generally triaged as category 3. The hospital handover for
patients with mental health conditions breaches the 15 minute target for almost every
trust on average and some trusts also have lengthy on scene times. This is likely to be
caused by the attending crew trying and failing to secure access to more appropriate
and alternative support. Conveyance rates are likely to be associated with the extent to
which paramedics can access 24/7 crisis services and NHS England are committed to
making sure these services are available across England by April 2019.
Some of the mental health patients the ambulance service respond to will have been
taken to a place of safety by the police under section 136 of the Mental Health Act.
Commissioners are required to ensure sufficient places of safety are available at all
times under this Act. In 2014 the Government published its Mental Health Crisis Care
Concordat with all public services agreeing to align and improve the response for those
experiencing a mental health crisis18. It set out that the use of police custody or vehicles
should be limited for patients for whom other mental health services are not available.
This means the ambulance service is required to take responsibility for such patients
from the police as soon as possible to complete their assessment. We support the NHS
England proposals for the mean and 90th percentile response times for Section 136 calls
to be reported.
18Department of Health and Concordat Signatories (2014). Mental Health Crisis Care Concordat,
https://assets.publishing.service.gov.uk/government/uploads/system/uploads/attachment_data/file/281242/36353
_Mental_Health_Crisis_accessible.pdf
26Trusts told us that often people with mental health conditions have frequent crises and
require a collaborative approach across the public service to ensure they are getting the
right support.
Staff minutes per incident
The JCT is an important measure of a trusts’ efficiency in responding to a patient but it
does not capture all the resources involved. Often more than one vehicle is sent to an
incident, sometimes unnecessarily. For example, an ambulance can be dispatched and
then stood down when a closer crew becomes available and can more appropriately
deal with the patient. This means that we need to consider the number of ‘activations’ –
the number and type of vehicles dispatched to the same incident, and the overall staff
minutes per incident. Figure 2.12 shows how differences in the way an incident is
managed can affect the efficiency of the response.
Figure 2.12: The impact of different response models on staff minutes per
incident. A double crewed ambulance (DCA) have two members of staff,
however a rapid response vehicle (RRV) has one.
We examined the differences in the number of activations between trusts. One trust only
sent on average 137 vehicles to deal with 100 incidents however another trust sent on
average over 174 vehicles. This is an important part of the 20% variation in the total
number of staff minutes per incident we observed between trusts. The new response
standards have helped reduce inappropriate activations as trusts now have longer to
triage a call and are able to send a more appropriate resource.
The data and information we have analysed is not routinely available to ambulance Trust
Boards in a form they can review and interrogate. This needs to change and Trust
27Boards should review their response models to ensure they are activating and
responding to incidents appropriately and making the best use of their resources.
Recommendation 1 – Enabling effective benchmarking
NHS Improvement should make operational data routinely available to
ambulance trusts to enable them to effectively benchmark their services
starting in autumn 2018, and trusts should take action to review levels of
variation.
Delivered by:
• NHS Improvement routinely providing operational productivity and performance
benchmarking data to ambulance trusts from autumn 2018, building on the
data used to support this review.
• A&E delivery boards developing comprehensive and agreed plans for
minimising ambulance handover delays in line with the guidance issued by
NHS Improvement and the Royal College of Emergency Medicine prior to
winter 2018.
• Ambulance trust boards working with A&E delivery boards to agree local
standard operating procedures for any hospital handover delays over 30
minutes by winter 2018.
• NHS Improvement and ambulance trust boards working together to identify the
most appropriate data source to enable effective benchmarking and
opportunities to improve the patient journey for those presenting with mental
health conditions by spring 2019.
28Chapter 3: Improving ambulance service productivity
Delivering the best outcome for patients is at the heart of improving both the productivity
of the ambulance service and the wider health system. A National Institute for Health
Research study concluded that the decisions frontline staff make are mainly influenced
by the following factors: demand; access to care services; performance targets; fear of
risk; training and education; communication and resources (staff and equipment)19.
Focusing on these areas will help staff on the frontline make the right decision for
patients and reduce avoidable conveyance.
Improving access to the wider health service
NHS England is leading the reform of urgent and emergency care to ensure patients get
the right care in the right place. This includes extending the availability of urgent
treatment centres (UTCs). These are GP-led, open at least 12 hours a day, every day,
and are equipped to diagnose and deal with many of the most common ailments that
people present with at A&E. The trust with the highest number of UTCs has the lowest
conveyance rate. Standardising the range of treatment options for patients is important,
as many end up calling 999 due to the confusing array of healthcare choices.
Effective hear and treat
Clinical advice is provided in around 5% of calls but there is variation between 4% and
8% across trusts (Figure 2.4). Clinical assessment teams have been established in all
ambulance control centres to increase the proportion of patients who can be
appropriately treated over the phone. They assess whether an ambulance is required,
give patients telephone advice on how to manage their symptoms, and put them in
contact with more appropriate services, such as a GP or pharmacy. There are about 500
staff, mostly paramedics, employed by trusts in clinical assessment teams. Some trusts
also employ other clinical staff including nurses, and more recently mental health
clinicians. We observed significant differences in the way in which these teams operate
and the apparent effectiveness of the approach.
19 O’Hara et al. (2014), A qualitative study of decision making and safety in ambulance service transitions,
https://www.journalslibrary.nihr.ac.uk/hsdr/hsdr02560/#/full-report
29You can also read