Ferratum Capital Germany GmbH - Investor Presentation - Contemplated Senior Unsecured Bond Issue - Ferratum Group
←
→
Page content transcription
If your browser does not render page correctly, please read the page content below

Ferratum Capital Germany GmbH –
Investor Presentation
Contemplated Senior Unsecured Bond Issue

                                           March 2019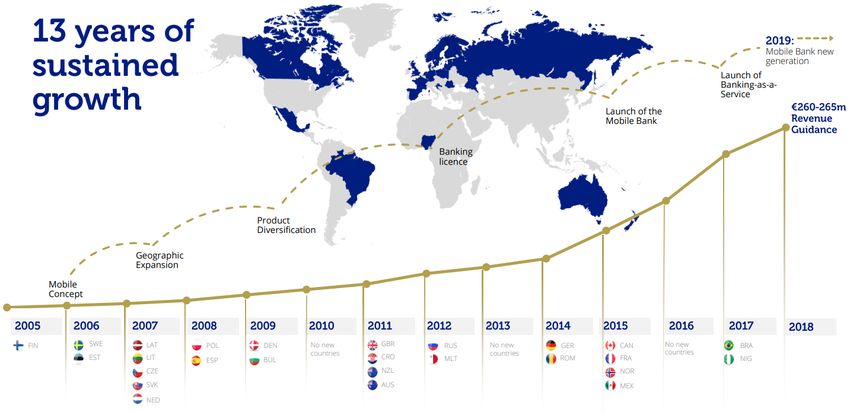
Disclaimer (1/2)
This Presentation (the "Presentation") has been produced by Ferratum Capital Germany GmbH (the "Issuer", or together with Ferratum Oyj (the "Guarantor") and their direct and indirect subsidiaries "Ferratum Group" or the "Group") solely for use in connection with the contemplated
offering of bonds (the "Bonds") (the "Transaction") and may not be reproduced or redistributed in whole or in part to any other person. The sole bookrunner for the Transaction is Pareto Securities AB (the "Sole Bookrunner" or "Pareto Securities"). This Presentation is for information
purposes only and does not in itself constitute an offer to sell or a solicitation of an offer to buy any of the Bonds. By attending a meeting where this Presentation is presented, or by reading the Presentation slides, you agree to be bound by the following terms, conditions and limitations.
No investment decision shall be made solely on the basis of this Presentation. All information provided in this Presentation has been obtained from the Group or publicly available material. Although, the Sole Bookrunner has endeavoured to contribute towards giving a correct and
complete picture of the Group, neither the Sole Bookrunner nor any of its parents or subsidiaries or any such company’s directors, officers, employees, advisors or representatives (collectively the "Representatives") shall have any liability whatsoever arising directly or indirectly from the use
of this Presentation. Moreover, the information contained in this Presentation has not been independently verified, only a limited due diligence by way of a management interview has been carried out and the Sole Bookrunner assumes no responsibility for, and no warranty (expressly or
implied) or representation is made as to, the accuracy, completeness or verification of the information contained in this Presentation. The Group or the Sole Bookrunner do not intend to, and do not assume any obligation to, update the Presentation. An investment in the Bonds involves a
high level of risk. Several factors could cause the actual results, performance or achievements of the Group to be materially different from any future results, performance or achievements that may be expressed or implied by statements contained in this Presentation. By attending a
meeting where this Presentation is presented, or by reading this Presentation, you acknowledge that you will be solely responsible for and rely on your own assessment of the market and the market position of the Group and that you will conduct your own analysis and be solely
responsible for forming your own view of the potential future performance of the Group, its business and the Bonds and other securities. The content of this Presentation is not to be construed as legal, credit, business, investment or tax advice. Each recipient should consult with its own
legal, credit, business, investment and tax advisers to receive legal, credit, business, investment and tax advice. Any binding terms and conditions relating to the Transaction will be included in a separate document. Any decision to subscribe for or purchase any of the Bonds mentioned in
this Presentation should be made only on the basis of the final terms and conditions of the bonds, and not this Presentation.
Only a limited due diligence by way of a management interview has been carried out with respect of the group in connection with the preparation of this Presentation. Thus, there may be risks related to the Group which are not included in this Presentation and which could have a negative
effect on the Group's operations, financial position, earnings and result.
We emphasize that investments in bonds can involve great risks. All investors must be prepared that such an investment can cause a partial or total loss of the investment. Investors who neither can nor want to incur such risk should not enter into these types of investments. Each potential
investor in the Bonds must determine the suitability of that investment in light of its own circumstances. In particular, each potential investor should:
(a) have sufficient knowledge and experience to make a meaningful evaluation of the Bonds, the merits and risks of investing in the Bonds and the information contained or incorporated by reference in this document or any applicable supplement;
(b) have access to, and knowledge of, appropriate analytical tools to evaluate, in the context of its particular financial situation, an investment in the Bonds and the impact other bonds will have on its overall investment portfolio;
(c) have sufficient financial resources and liquidity to bear all of the risks of an investment in the Bonds;
(d) understand thoroughly the final terms and conditions for the Bonds; and
(e) be able to evaluate (either alone or with the help of a financial adviser) possible scenarios for economic, interest rate and other factors that may affect its investment and its ability to bear the relevant risks.
Neither this Presentation nor any copy of it or the information contained herein is being issued, and nor may this Presentation or any copy of it or the information contained herein be distributed directly or indirectly, to or into Luxembourg, Canada, Australia, Hong Kong, Italy, New Zeeland,
the Republic of South Africa, Japan, the Republic of Cyprus, the United Kingdom or the United States (or to any U.S. person (as defined in Rule 902 of Regulation S under the Securities Act)), or to any other jurisdiction in which such distribution would be unlawful, except as set forth herein
and pursuant to appropriate exemptions under the laws of any such jurisdiction. Neither the Group nor the Sole Bookrunner, or any of their Representatives, have taken any actions to allow the distribution of this Presentation in any jurisdiction where any action would be required for
such purposes. The distribution of this Presentation and any purchase of or application/subscription for Bonds or other securities of the Group may be restricted by law in certain jurisdictions, and persons into whose possession this Presentation comes should inform themselves about,
and observe, any such restriction. Any failure to comply with such restrictions may constitute a violation of the applicable securities laws of any such jurisdiction. None of the Group or the Sole Bookrunner or any of their Representatives shall have any liability (in negligence or otherwise) for
any loss howsoever arising from any use of this Presentation or its contents or otherwise arising in connection with the Presentation. Neither the Group nor the Sole Bookrunner have authorised any offer to the public of securities, or has undertaken or plan to undertake any action to
make an offer of securities to the public requiring the publication of an offering prospectus, in any member state of the European Economic Area which has implemented the EU Prospectus Directive 2003/71/EC, as amended (the "Prospectus Directive") and this Presentation is not a
prospectus for purposes of the Prospectus Directive.
In the event that this Presentation is distributed in the United Kingdom, it shall be directed only at persons who are either (a) "investment professionals" for the purposes of Article 19(5) of the UK Financial Services and Markets Act 2000 (Financial Promotion) Order 2005, as amended (the
"Order"), (b) high net worth companies, unincorporated associations and other persons to whom it may lawfully be communicated in accordance with Article 49(2)(a) to (d) of the Order, or (c) persons to whom an invitation or inducement to engage in investment activity (within the meaning
of Section 21 of the Financial Services and Markets Act 2000) in connection with the issue or sale of any Bonds may otherwise lawfully be communicated or caused to be communicated (all such persons together being referred to as "Relevant Persons"). Any investment or investment
activity to which this Presentation relates will be available only to Relevant Persons and will be engaged in only with Relevant Persons. This Presentation is not a prospectus for the purposes of Section 85(1) of the UK Financial Services and Markets Act 2000, as amended. Accordingly, this
Presentation has not been approved as a prospectus by the Financial Conduct Authority (the "FCA") under Section 87A of the Financial Services and Markets Act 2000 and has not been filed with the FCA pursuant to the UK Prospectus Rules nor has it been approved by a person authorised
under the Financial Services and Markets Act 2000.
This Presentation does not constitute or form part of an offer or solicitation to purchase or subscribe for securities in the United States. In the event that this Presentation is distributed in the United States, it shall be directed only at persons who are “qualified institutional buyers” as
defined in Rule 144A promulgated under the Securities Act ("Rule 144A") ("QIBs") in reliance upon Rule 144A under the Securities Act. The Bonds have not been and will not be registered under the U.S. Securities Act of 1933, as amended (the "Securities Act"), or with any securities
regulatory authority of any state or other jurisdiction in the United States. Accordingly, the Bonds may not be offered, sold (directly or indirectly), delivered or otherwise transferred within or into the United States or to, or for the account or benefit of, U.S. Persons, absent registration or
under an exemption from, or in a transaction not subject to, the registration requirements of the Securities Act. The Bonds are being offered and sold only (i) outside the United States to persons other than U.S. persons (“non-U.S. purchasers”, which term shall include dealers or other
professional fiduciaries in the United States acting on a discretionary basis for non-U.S. beneficial owners (other than an estate or trust)) in reliance upon Regulation S under the Securities Act ("Regulation S") and (ii) in the United States to QIBs in reliance upon Rule 144A under the
Securities Act. As used herein, the terms “United States” and “U.S. person” have the meanings as given to them in Rule 902 of Regulation S under the Securities Act.
By accepting receipt of this Presentation, you warrant and represent that (i) if you are located within the United States and/or a U.S. person or in the United States, you are a QIB, (ii) if you are a non-U.S. person, you are a Qualified Investor (as defined in the Prospectus Directive (with cross-
references therein)), or a Relevant Person (as defined above).
This Presentation has been prepared exclusively for the benefit and internal use of the recipient and no part of this Presentation or the information it contains may be disclosed, reproduced or redistributed to any other party without the prior written consent of the Sole Bookrunner. This
Presentation is dated March 2019. Neither the delivery of this Presentation nor any further discussions of the Group or the Sole Bookrunner with any of the recipients shall, under any circumstances, create any implication that there has been no change in the affairs of the Group since
such date. The Group does not undertake any obligation to review or confirm, or to release publicly or otherwise to investors or any other person, any revisions to the information contained in this Presentation to reflect events that occur or circumstances that arise after the date of this
Presentation.

                                                                                                                                                                                                                                                                                                              2
Disclaimer (2/2)
Conflict of interest
The Sole Bookrunner and/or its Representatives may hold shares, options or other securities of the Group and may, as principal or agent, buy or sell such securities. The Sole Bookrunner may have other financial interests in transactions involving these securities or the Group.
The Issuer and any other member of the Group may, subject to applicable laws, purchase Bonds. It should be noted that the Group may have interests that conflict with other bondholders particularly if the Group encounters difficulties or is unable to pay its debts as they fall due.
Target market
Solely for the purposes of the manufacturer's (as used herein, "Manufacturer" refers to the Sole Bookrunner) product approval process, the target market assessment in respect of the Bonds has led to the conclusion that: (i) the target market for the Bonds is eligible counterparties,
professional clients and retail clients, each as defined in Directive 2014/65/EU (as amended, "MiFID II"); and (ii) all channels for distribution of the Bonds to eligible counterparties, professional clients and retail clients are appropriate.
Any person subsequently offering, selling or recommending the Bonds (a "Distributor") should take into consideration the Manufacturer's target market assessment; however, a Distributor subject to MiFID II is responsible for undertaking its own target market assessment in respect of the
Bonds (by either adopting or refining the Manufacturer's target market assessment) and determining appropriate distribution channels.
PRIIPs regulation
As the Bonds are not deemed to fall within the scope of Regulation (EU) No 1286/2014 (as amended, the "PRIIPs Regulation"), no PRIIPs key information document (KID) has been prepared. For the avoidance of doubt, the target market assessment does not constitute: (a) an assessment of
suitability or appropriateness for the purposes of MiFID II; or (b) a recommendation to any investor or group of investors to invest in, or purchase, or take any other action whatsoever with respect to the Bonds.
Placement fee
The Sole Bookrunner will be paid a fee by the Issuer in respect of the placement of the Transaction.
Forward looking statements
Certain information contained in this Presentation, including any information on the Group’s plans or future financial or operating performance and other statements that express the Group’s management’s expectations or estimates of future performance, constitute forward-looking
statements (when used in this document, the words “anticipate”, “believe”, “estimate” and “expect” and similar expressions, as they relate to the Group or its management, are intended to identify forward-looking statements). Such statements are based on a number of estimates and
assumptions that, while considered reasonable by management at the time, are subject to significant business, economic and competitive uncertainties. The Group cautions that such statements involve known and unknown risks, uncertainties and other factors that may cause the actual
financial results, performance or achievements of the Group to be materially different from the Group’s estimated future results, performance or achievements expressed or implied by those forward-looking statements
Claims and litigations
Claims or legal action may in the future be made or initiated against the Group which may have significant unfavourable effects on the Group's financial position, performance and market position or on the pricing of the Bonds.
Audit Review of financial information
Certain financial information contained in this Presentation has not been reviewed by the Group’s auditor or any other auditor or financial expert. Hence, such financial information might not have been produced in accordance with applicable or recommended accounting principles and
may furthermore contain errors and/or miscalculations. The Group is the source of the financial information, and none of the Group or the Sole Bookrunner or any of its Representatives shall have any liability (in negligence or otherwise) for any inaccuracy of the financial information set
forth in this Presentation.
The Bonds will be governed by the final terms and conditions
Any potential investor investing in the Bonds is bound by the final terms and conditions of the Bonds which the investor acknowledges having accepted by subscribing for such Bonds.
Governing law and jurisdiction
This Presentation is subject to Swedish law, and any dispute arising in respect of this Presentation is subject to the exclusive jurisdiction of Swedish courts.

                                                                                                                                                                                                                                                                                                    3
Transaction Structure Simplified Transaction Structure
and Use of Proceeds Ferratum Oyj
Guarantor
Introduction
Ferratum Capital Germany GmbH (“Ferratum The bonds will be guaranteed by the
Capital”, the “Issuer” or the “Funding SPV”) is Guarantor Ferratum Capital Germany GmbH
Operating subsidiaries
a subsidiary of Ferratum Oyj (the “Guarantor” Issuer and Funding SPV
and together with all its subsidiaries Listed on Prime Standard of the Frankfurt
“Ferratum Group”, “Ferratum” or the Stock Exchange with a market cap
“Group”) of EUR 260.7 million1
The Issuer functions as a funding SPV for the The Guarantor was founded in 2005 by the
Group as a whole and currently has two bonds current CEO and largest shareholder (~55%),
outstanding of a total of EUR 125 million Mr. Jorma Jokela New bond issue Refinance old bonds
Up to EUR 100m EUR 25m
The Issuer intends to issue new senior Remaining ~45% is free float2
unsecured bonds in an initial amount of up to
EUR 100 million under a total frame of EUR Summary of main terms available on next slide
150 million
Sources and uses (EURm)
The net proceeds from the Bond Issue will be
used to:
Sources Uses
repay existing bonds outstanding of the
Ferratum Capital Germany 4.875% 16/19
Issuer of EUR 25 million; and Senior Unsecured bond issue 100.0 25.0
Bond
finance general corporate purposes of the
General corporate purposes3 75.0
Group. The Funding SPV can finance
operations both under banking license and Total 100.0 Total 100.0
entities operating without banking license by
intra-group loans
Note: 1) As of close 18 March 2019 2) Including shares owned by Dorval and HSBC of 5.09% and 5.37%, respectively, and treasury
shares of 0.67% 3) May include partial repayment of other credit lines as liquidity management
4
Summary of Main Terms
Issuer Ferratum Capital Germany GmbH
Status Senior unsecured
Tenor 4 years
Initial issue volume Up to EUR 100 million
Subsequent issue volume EUR 50 million, increasing the outstanding amount to maximum EUR 150 million
Guarantor: BB- (stable), Fitch Ratings
Credit rating
Bond: BB- (expected), Fitch Ratings
Coupon / Pricing 3 month Euribor + [•]% p.a., quarterly interest payments. Euribor floor at 0%
Use of proceeds Repay existing bonds of EUR 25m and general corporate purposes
Guarantor Ferratum Oyj
Call structure (American) Callable @ 101.00% after 36-42 months and @ 100.50% after 42-48 months
Maintenance covenants: Cross default
Undertakings Net debt / equity ≤ 3.50 (for Group) Dividend restriction:
Negative Pledge 25% of previous year’s net profit of the Group
Change of control / De-listing (Guarantor) Put at 101% of par
Frankfurt Stock Exchange Open Market, on or about issue date
Listing Nasdaq Stockholm, within 30-60 days after issue date
Frankfurt Stock Exchange Prime Standard (provided volume requirement is met, best efforts basis)
Jurisdiction and agent Swedish law and Nordic Trustee and Agency
Sole Bookrunner Pareto Securities
Note: Please see Term Sheet for details
5Investment Highlights
Nearly 14 years of experience offering credit and payment products for consumers and small business, currently active in 25 countries primarily in Europe
Proven business model Specialist in online processes with a centralized technology infrastructure and sales experts
with banking license Self-learning Big Data Scoring System: State-of-the-art security for credit approvals and automatic processes
EU banking license – enables passporting of license to other EU countries
Profitable growth since establishment in 2005 – revenue and EBIT CAGR of 38.9% and 37.4% between 2014 and 2018
During FY 2018 the Group increased revenues with 18.3% while EBIT reached 14.4% of revenues
Profitable growth Future growth via mobile bank application (start up investments during 2016) and access to deposit funding
Net receivables have grown with a CAGR of 51.1% 2014-2018
Group equity ratio of 21.5% and net equity ratio of 27.9% as of December 2018
Conservative net debt to equity ratio of 2.58x and strong liquidity position of EUR 116 million as of December 2018
Solid financial position
Limited historical distributions, capped at maximum 25% of net profit going forward
and asset quality Strong asset quality with gross impairments of 4.9% of gross receivables and improving due to rigorous credit scoring
Conservative impairment policy with reserves of 31.5% of gross receivables, December 2018
Strong corporate EU banking license granted by Malta Financial Services Authority
governance and Prime standard listing on Frankfurt Stock Exchange with a market cap of EUR 260.7 million1
experienced team Board of directors and management team with extensive experience within consumer finance, banking, legal and other businesses
Note: 1) As of close at 18 March 2019
6Table of Contents
Introduction
Operations
Product portfolio
Asset Quality, Funding, Liquidity & Capital Base
Financials
Market Overview
Appendix
Owners, Board of Directors and Management Team
IFRS 9 adoption
Ferratum Bank
Risk Factors
7Ferratum Group in Brief Historical Financial Development (EURm)1
CAGR: 38.9%
Introduction 221.6
262.2 Revenue
154.1 EBIT
Ferratum Group is an international provider of unsecured digital consumer loans
111.0
and small business loans headquartered in Helsinki, Finland
70.5
21.1 31.8 37.8
Offer customers fast and easy to use mobile lending and banking services 10.6 16.5
Currently active in 25 countries 2014 2015 2016 2017 2018
The Group was founded in 2005 by the current CEO and largest shareholder (~55%),
Mr. Jorma Jokela
Revenue by Geography2 Loan Portfolio by Product
Listed on Prime Standard of the Frankfurt Stock Exchange since February 2015 2.4%
3.8% 9.1%
Business was initially focused on Finland, Sweden, and the Baltic countries 15.2% Microloan
Northern Europe
PlusLoan
FY 2018
FY 2018
31.8%
In 2007 and 2008 the Group expanded into Central and Eastern Europe as well as 42.7% Western Europe 25.3%
Credit Limit
certain Western countries and the international expansion is continuing Eastern Europe
Business (SME)
Rest of the World
Ferratum Group has enjoyed more than 13 years of profitable growth 47.9%
Mobile Bank
21.7%
CAGR of 38.9% and 37.4%, respectively, for revenues and EBIT since 2014
The Nordics contribute with the highest share of revenues – 42.7%
What we are… What we are not…
Mobile lender Expert for Big Data scoring, Mobile Bank with Payday lender Credit card company Traditional
and bank with mobile account opening, EU wide license retail bank
deposit business mobile contract conclusion
Source: Company filings. Note: 1) 2012 and onwards reported under IFRS and prior reported in accordance with FAS. 2) Northern
Europe = Finland, Sweden, Denmark, Norway; Western Europe = France, Germany, Netherlands, Spain, UK; Eastern Europe =
Bulgaria, Croatia, Czech Republic, Estonia, Latvia, Lithuania, Poland, Romania, Russia, Slovakia; Rest of the World = Australia, Brazil,
Canada, Mexico, New Zealand, Nigeria 8A Compelling Investment Case
Our business Innovation
& product
We provide financial services that enable and empower our diversification
customers
Our corporate strategy
Our Mobile Financial Platform Model that allows Sustainable
us and our partners to scale services globally profitable
growth
Our growth strategy
Innovation, geographic expansion and Geographic
global partnerships will generate sustainable, Expansion Mobile Platform
profitable growth
9More than
13 Years of
Profitable
Growth
Initial focus on Finland, Sweden, and the Baltic countries
In 2007 and 2008 the Group expanded into Central and
Eastern Europe as well as certain Western countries
In 2011 and 2012, the Group decided to expand
internationally and enter the markets in New Zealand and
Australia as well as Russia
With banking license obtained in 2012 and start of banking
operations in 2013, the Group could further expand within Net Receivables (EURm) Number of total customers (millions)1
EU through passporting of bank license
Banking license also provides valuable deposit funding 320.5 2.0
1.9
257.4 1.6
In 2015, the Group launched its mobile banking
184.3 1.2
platform enabling an efficient roll-out of services across 1.0
its active markets 0.8
106.8 0.6
0.5
44.0 61.5 0.3 0.3
As of December 2018, the Group had a total loan portfolio 23.0 38.0
7.9 14.0
of EUR 321 million with 2.0 million total customers1 and
792 thousand active customers2 2009 2010 2011 2012 2013 2014 2015 2016 2017 2018 2009 2010 2011 2012 2013 2014 2015 2016 2017 2018
Source: Company Filings.
Note: Malta has no local operations. 1) Active and former customers who have been granted one or several loans in the past or has an open mobile account. Implementation of GDPR led to deletions of 149,000
former customer records in 2018. 2) Customers with a Mobile Bank account and lending customers who have had an open balance in the last 12 months. If loans are >24m overdue, the customer is not
considered active 10SME and PrimeLoan expands the offering to longer-
term solutions & higher customer lifetime value
Digital lending – product category evolution
LOW LOAN AMOUNT HIGH
PRODUCT: SOLUTION:
All products are based on the same
principles: Full digital setup and high user
convenience, real-time, paperless
LONG
SME
SME – Business loan offering for small and medium
Primeloan size companies
PrimeLoan introduced in two countries, supports entering
MATURITY
bigger mass markets with lower pricing
Credit Limit
Credit Limit and Plus Loan continue to be main growth
drivers short term
Plus Loan MicroLoan strategically utilized primarily as a product
to enter new markets
SHORT
Microloan
HIGH APR LOW
11Table of Contents
Introduction
Operations
Product portfolio
Asset Quality, Funding, Liquidity & Capital Base
Financials
Market Overview
Appendix
Owners, Board of Directors and Management Team
IFRS 9 adoption
Ferratum Bank
Risk Factors
12Fast, Efficient and Easy Application
Process – 100% Online
Ferratum USPs
1 2 3 4 5 6
Loan Check Decision Approval Payment Repayment
application Customers credit and Instant loan decision1 Loan approval by Loan payout by Invoice via post, loan and
ID by Ferratum and via (online, mobile) customer (online, Ferratum handling fee payment by
external databases mobile) Contract is set Invoice via mail customer on due date
Customer Actions
Target: 15 minutes2
Tenor varies across products
Note: 1) A large number of loans are not approved and the process is stopped after such credit decision, 2) Subject to local characteristics
13Acquisition Strategy
Strong Networking of Customer and Platform
To attract new customers, the Group primarily employs
online marketing such as: Creating Demand
4 Repeat Business
1
Search engine marketing (SEM) TV, Radio, Outdoor
Branding, PR
Search engine optimization (SEO)
Sponsoring
Affiliate online partners marketing
Loan brokers
Social media
To a lesser extent, the Group also engages in offline 2 Collecting Demand
marketing through television, radio and newspaper SEO, SEM
advertisements Affiliates & Brokers
Referral Program 3 Converting Demand
Websites constructed and optimized to convert
maximum of demand into loan applications
Customer satisfaction creates repeat business and 5 Referrals
referrals
Easy and simple to use services in combination with 1 Active Demand
focus on customer service functions Searching for banking
related services
Customer are generated through online and offline
marketing as well as repeat business
4 Retention / Loyalty
14Credit Scoring, Identification and Credit Scoring
Acceptance levels and 1 2 3
Collection of Loans Digital identification
based on hard facts as
Effective check of the
customer by means of:
Credit decision
within seconds:
name and date of
Primarily digital identification via mobile and The Group’s stringent credit scoring and birth. Handled via: External data bases Less than 0.1% fraud
with information on cases
online bank with no physical meetings identification system resulted in an
Mobile technology credit-worthiness Professional frauds
required1 average approval rate of consumer loan
Online banking, Tested and dedicated even 0.0%
applications of 13% during 2018 internal scoring
Scoring and credit policies are centrally Face-to-face ID
verification FICO-tools
steered by the risk team Approved loans are paid out via bank
account money transfer within minutes
Self-learning software:
An application scorecard is used to Increasing approvals
from application while decreasing
assess new customers and a behaviour
charge-offs
scorecard The credit scoring and loan acceptance
is used to assess repeated customers process is highly effective
Based on credit score, customers are
From Q1-2015 to Q4-2018, the Group
grouped into risk classes that ultimately
has increased its customer base by an
affect the credit decision
average of 70 thousand customers per
In its credit scoring the risk team assess quarter Consumer loan approval rate
internal big data technology (see next slide),
Primarily internal collection employing a
public databases, national credit losses
series of text messages, letters, and phone
registers, statistics databases, and public
calls to encourage customer payment
tax databases if available
The scoring model is based on FICO
Collection processes are initiated in- 2016 2017 2018
house immediately when a payment is
analytics and further developed by the
overdue and most often outsourced to a 14% 15% 13%
risk team
third party collection company when the
Monitoring systems are in place to payment becomes more than 30 days
accommodate the early identification and delayed
management of deterioration in loan quality Impaired loans may also be sold to
(daily, weekly, and monthly checks) third parties
Source: Company Filings
Note: 1) In some instances, face-to-face identification is required due to lack of technology in some markets
15Big Data Optimizes
Credit Scoring
To support the credit scoring
system, the Group founded a Browser type Browsing behaviour
dedicated technology
company, Personal Big Data
Oy, for the purposes of
further researching and
developing the credit scoring
technology
Credit assessment based on
up to 10,000 data points
Proprietary and self-learning
algorithms based on 10 years Social Networks Geographic Data Financial Data
of experience
Fast and reliable risk Incl. account data
assessment through the use via balancion
of Big Data technology
16Ferratum Group’s Typical Customer
As at December 2018, the Group had a total Employment Age
customer base of 2.0 million customers1
Full-time
Among the Group’s customers, a majority of 6.0% 18-25
the customers are below 40 years and are 15.0%
7.0% Other 25.0%
predominantly full-time employed 26-30
8.0%
Pensioner
93% of the Group’s customers are employed 19.0% 31-40
Loan proceeds are primarily used to pay 16.0% Unemployed
63.0% 16.0% 41-50
invoices and consumption
Part-time 25.0% 51+
Customer acquisition is mainly conducted by
modern online marketing, selectively
supported by traditional PR
The Group uses 4 main methods of online Marital Status Net receivables vs. number of new customers
marketing namely SEO2, SEM3, affiliate
marketing and cooperation 103 321
294
88 270
Ferratum operates an in house team focusing 257 255
80 77 243 80
on increasing the customer base and acquires 35.0% 66
70
66
71 70
206
225 73
~70 thousand new customers per quarter 42.0% Singles 184 65 63
154 75 78
137 66
Couples without kids 122
107
94
71 81
Couples with kids
23.0%
Q1-15
Q2-15
Q3-15
Q4-15
Q1-16
Q2-16
Q3-16
Q4-16
Q1-17
Q2-17
Q3-17
Q4-17
Q1-18
Q2-18
Q3-18
Q4-18
Net receivables Number of new customers
Source: 2014 customer survey. No material change in customer composition according to management. Interim financials for FY 2018 restated.
Note: 1) Active and former customers who have been granted one or several loans in the past or has an open mobile account, 2) Search Engine Optimization, 3) Search Engine Marketing
17Growth driven via the Platform Model
Global scalability beyond Ferratum’s balance sheet: multiple sources of revenue
Mobile Financial Platform Model White Label Partners
A channel agnostic, flexible customer interface Ferratum‘s technology and licence platform
and back-end data engine, supported by a enables consumer-facing brands to offer financial
decision making centre and an API integration services:
channel to process third party data: Fees and/or profit sharing
Fees Cheap funding sources
Cheap funding sources Increased customer base
Interest on lending products
Mobile Financial Platform
Ferratum Operating System 1.0
Current accounts
Deposits
Loans
Innovation and Widget Partners Debit Card International Financial Partners
An ecosystem of services through the integration Payments A franchise model that combines Ferratum’s
of third party products and services: plug and play Mobile Financial Platform and
Fees and/or profit sharing our partners’ balance sheets
More attractive products Fees and/or profit sharing
Increased customer loyalty Access to more markets
and customers
18Navigating through Case study: Introduction of interest rate cap in Estonia
Index (Net sales 2014 = 100)
regulatory changes Interest cap
introduced in
Q4 2014
26.1%
17.8%
1,089
547
18.9%
Successful track record of adapting to interest cap regulation 301
9.2% 373
5.9%
219
100 105 138 128
In late 2014, Estonia introduced regulation for an upper limit to the cost of consumer loans 16
85
29 39 39 48
While this led to the average yield decreasing, Ferratum started targeting customers with
2014 2015 2016 2017 2018
lower credit risk, which in turn had a very positive impact on credit losses Net sales Credit losses Net AR Credit losses (% of Net AR)
Since introduction of the cap in 2014, Ferratum has seen strong profitable growth in its
loan book in Estonia Estonia shows successful conversion to new interest rate level
In September 2018, the Swedish government introduced an interest/cost cap on consumer
loans
The initial development seen in Q4 2018 shows that the adoption of the interest rate cap Case study: Introduction of interest rate cap in Sweden
in Sweden had little impact on the Group’s performance Index (Net sales 2014 = 100) Interest cap
introduced in
Credit losses are decreasing, new customers are being acquired and both revenues and Q3 2018
670
the loan book is still increasing in Sweden 646
566
In essence, interest rate caps result in Ferratum tightening its scoring, which leads to better 508
466 490 7.4%
payment behaviour 417
449 6.9% 6.6%
5.9% 6.2%
While the revenues per granted loan decrease on average, the impact on profitability is 5.0%
6.4%
mitigated through the de-risked profile of the customers, resulting in lower credit losses 3.5%
140 155 157
As evident from 14 years of previous experience and a strong track record, Ferratum is well 100 111 125 121 128
equipped to handle regulatory changes 25 26 29 24 34 36 45 23
While the operational parameters of a market may change, the Group has proven it is Q1-17 Q2-17 Q3-17 Q4-17 Q1-18 Q2-18 Q3-18 Q4-18
highly flexible and prepared to adapt to a new environment while retaining its growth Net sales Credit losses Net AR Credit losses (% of Net AR)
track and profitability
Sweden Q4-18 results indicate successful conversion as well
19Anticipated changes in legal environment
Active monitoring and dedicated resources to adapt and respond to regulatory change
SWEDEN FINLAND
A new law came into force in Sweden on 1 September 2018 capping effective interest A number of amendments to the Consumer Protection Act with regards to the maximum
rates for high cost loans at 40%. In line with its overall business strategy, Ferratum has interest rates that may be charged to consumers, as well as a cap on overall costs, have
stopped selling microloans in Sweden and switched to products with higher loan been approved and will enter into force in September 2019
principals, which can be offered at lower rates of interest in line with the new capping
ROMANIA
LATVIA
The National Bank of Romania has adopted adjustments to the relevant debt to income
A number of legislative changes were enacted in October 2018, which included rules on
ratio, which were applicable from 1 January 2019. Ferratum has adapted its processes in
creditworthiness assessments. Ferratum offers loans in compliance with these rules,
order to adhere to these legislative changes. In March 2019, Romania’s Constitutional
whilst it is also planning further changes in order to comply with additional changes –
Court invalidated a law capping interest rates on retail loans which was to be introduced;
which will come into force on 1 July 2019 – capping the daily total costs of loans and
Ferratum continues to monitor the situation
others which purport to limit certain advertising of loans
NORWAY POLAND
A new law was passed in February 2019 (coming into force in May 2019), the main focus Ferratum is closely monitoring news that new laws will be enacted in Poland in 2019
of which are creditworthiness assessments of consumers. Ferratum is working on aimed at regulating consumer lending, primarily in order to ensure Ferratum is ready to
implementing changes to its processes in order to meet these new requirements implement any changes necessary to continue adhering to the regulatory requirements
The Group will continue to monitor the global regulatory environment, in close co-operation with its local advisors, in every country in which it is active
with the aim to ensure the Group’s ongoing compliance with all applicable laws and regulations
20Leverage opportunities
and priorities Management progress to improve performance
Operating costs have stabilized while revenue growth is Accelerate growth of lending by improving risk & increase customer
intake
recovering
Improve conversion rate, scoring & underwriting
EUR’000
Processes for increasing customer intake and efficiency
80,000
Growth Reshape organisation
slowdown
70,000
Staff streamlining
Strengthen top management
60,000
Create five cylinders and responsibilities common to every product
50,000
Lead generation, conversion funnel, underwriting & collections,
CRM, product & pricing
40,000
Rebalance resources
Focus on lending in existing markets
30,000
More resources allocated to risk management and automation
20,000 Review geographies for profitability
Q1 2017 Q2 2017 Q3 2017 Q4 2017 Q1 2018 Q2 2018 Q3 2018 Q4 2018
Considering withdrawal from 1-2 non-performing countries ongoing
Revenue Total costs
21Risk modelling review programme
Programme is substantially completed
2018 2019
Scoring Risk & IT Risk & Marketing Intended benefits in 2019:
New scorecard implementation 5 cylinder model established – improving Increase number of new customers
New heads of data science and
tool implemented (Score Mada) handshaking between risk and other
credit management appointed Increase active customer base
functions, especially marketing and sales
New scorecard implementation
All credit decisions Optimize cost benefit of customer
process defined
under central monitoring acquisition
Documentation of risk relevant
Score cards for new and Increase the quality of the credit
features in IT systems completed
existing customers reviewed portfolio
Strong score card quality
1,000 credit policy rules reviewed
monitoring established
(mostly completed)
New Collection tool selected (Fico)
Mid term optimization plan defined in
order to even exceed current status
22Table of Contents
Introduction
Operations
Product portfolio
Asset Quality, Funding, Liquidity & Capital Base
Financials
Market Overview
Appendix
Owners, Board of Directors and Management Team
IFRS 9 adoption
Ferratum Bank
Risk Factors
23Overview of Product Loan Portfolio Breakdown by Product, Dec-18
Portfolio
2.4%
9.1% Microloan
15.2%
Revenue Split and Structure PlusLoan
25.3%
Microloans have historically been the core product since start of operations in 2005 however, with
Credit Limit
banking license in place since 2012, there has been more focus on traditional consumer loans
Currently the Issuer takes deposits in Sweden, Germany, Norway, France and Spain. Business
Average interest is 0.6% (SME)
47.9%
Credit limit represents 47.9% of the loan portfolio and 50.5% of revenues
In 2016, the Group launched its Mobile Bank platform offering interesting growth opportunities,
currently active in 5 markets
Revenue Revenues by Active
Average Amount and Duration of Different Loan Products1
Products
Share Product (€,000) Markets
Primeloan (incl. 2017 529 Average amount Average loan term
0.6% +178% y-o-y 2 (5)
Mobile Bank)2 2018 1,468
PrimeLoan EUR 6,004 4.9 years
2017 13,135
8.0%
Business (SME)
2018 21,008
+60% y-o-y 9 Business (SME) EUR 13,503 420 days
Credit Limit EUR 1,269 n/a
2017 103,774
Credit Limit 50.5% +28% y-o-y 10
2018 132,321 PlusLoan EUR 753 355 days
2017 60,315 Microloan EUR 210 29 days
PlusLoan 25.0% +9% y-o-y 9
2018 65,641
2017 43,886
Microloan 15.9% 13
-5% y-o-y
2018 41,709
Source: Company filings. Note: 1) Information as of December 31, 2018, 2) Mobile Bank, FerBuy, Primeloan and Ferratum P2P
24Product Area –
Credit Limit
Service Offering Credit Limit - Share of Revenue
The Credit Limit product was launched in Finland in June 2013 and is currently offered in 10
of Ferratum Group’s markets, including in the Nordics, Estonia, Latvia, Spain, Czech Republic,
the UK and in Brazil
Credit limits offered by Ferratum are up to EUR 3,000 and the product offering is similar to a 50.5%
flexible revolving overdraft facility
Customers can withdraw money within a certain limit over a month’s period and choose
which amount to pay back at the end of each month. Monthly minimum instalments covers
interest and some amortization is required
Hence, the product offers a very flexible solution from a customer point of view, enabling
Credit Limit – Revenue and Contribution (EUR thousands)
customers to withdraw and repay in accordance with their cash flow situation
Draw downs and repayments are allowed at any number of times until the expiration of the
arrangement 41% 132,321
p.a.
As at Dec-18, the average amount loan amount was EUR 1,269
103,774
The product segment has seen a rapid growth from initiation
Credit Limit comprised nearly 48% of the total loan portfolio as at Dec-18 and generated 66,444
Revenues
half of the Group’s revenues for FY 2018 24%
21% 19% Gross contribution margin (%)
The Group is planning on expanding the product offering to more of its markets
FY 2016 FY 2017 FY 2018
Source: Company filings
25Product Area –
Microloans
Service Offering Microloans - Share of Revenue
Short-term microloans with a nominal value below EUR 1,000 have historically been the
Group’s core product since it started its operations in 2005
However, the Group has decreased its focus on microloans over the last couple of years
with the product type comprising 9.1% of the total loan portfolio as at Dec-18 while 15.9%
representing 15.9% of revenues for FY 2018
This can be compared to 2016, when Microloans accounted for 34% of revenues
Microloans are currently offered in 13 countries
Microloans typically range between EUR 25-1,000 with durations of 7-90 days, depending on
the loan amount and regulatory framework of the customer’s country
Microloans – Revenue and Contribution (EUR thousands)
Average loan amount totalled EUR 210 with an average duration of 29 days as at Dec-18
Microloans are facilitated through the Group’s mobile phone application and customers are
-11%
in most cases able to obtain loans instantly p.a.
52,837
Given the varied regulatory requirements, payment cultures and overall credit risks within
43,886
different markets, the Group applies customized interest rates, fee structures and terms and 19% 41,709
conditions depending on market
Therefore, specific provisions for customer default, loan modification, technical repayment Revenues
processes and additional customer obligations differ from country to country 8%
Gross contribution margin (%)
In 2018, Microloans were discontinued in Canada and Sweden following the Group’s 5%
strategy, as higher customer lifetime value can be to achieved with other products
FY 2016 FY 2017 FY 2018
Source: Company filings
26Product Area –
PlusLoan
Service Offering PlusLoan - Share of Revenue
PlusLoan was included into the product offering in 2013 and serve to complement the
Microloan business
The product is offered to selected customer groups only and application is done separately
through an online application 25.0%
PlusLoans are primarily targeted to existing customers with a strong track record of
repayment ability
PlusLoan is a more flexible loan product outside the typical range of Microloans
As of FY 2018, PlusLoan constituted 25.3% of the Group’s total loan portfolio and
contributed 25.0% of revenues PlusLoan – Revenue and Contribution (EUR thousands)
PlusLoans are offered in larger amounts, typically between EUR 300-5,000 with maturities of
2-36 months 47%
p.a.
In FY 2018, the average loan amount and tenor amounted to EUR 753 and 355 days, 65,641
respectively 60,315
PlusLoans are practically regular instalment loans, further distinguishing them from the
Group’s Microloans
20%
As the product segment is rapidly growing, the margins are diluted by frontloaded credit Revenues
30,232
losses and marketing expenses 13%
Gross contribution margin (%)
9%
PlusLoans are currently offered in 9 markets
FY 2016 FY 2017 FY 2018
Source: Company filings
27Product Area –
Business (SME)
Service Offering Business (SME) - Share of Revenue
In 2015, business lending to Small and Medium-sized Enterprises (SMEs) were introduced in
Finland and Sweden
Currently, Ferratum Group offers its business lending services in 9 countries, including
Sweden, Finland, Lithuania, Denmark, the UK, the Netherlands, Czech Republic, Poland and
8.0%
Australia
The business offering offers established small businesses, with a strong track record of at
least two years, loans with a term of six to 18 months
Loans can be up to EUR 250,000 and can be applied through an online application process
Average loan amount and tenor amount to EUR 13,503 and 420 days, respectively Business (SME) – Revenue and Contribution (EUR thousands)
Loan proceeds are often used to finance working capital and bridge financing
122%
p.a.
21,008
13,135
20% Revenues
17%
Gross contribution margin (%)
4,251
9%
FY 2016 FY 2017 FY 2018
Source: Company filings. Only for Ferratum Group. Not part of Ferratum Bank’s product offering
28Product Area –
Mobile Bank1
Service Offering Mobile Bank - Share of Revenue
Mobile Bank includes the Group’s Mobile Banking operations (launched in 2016), FerBuy (to be
discontinued), Primeloan (started in 2017) and Ferratum P2P
The Group’s mobile banking offering is currently available in five countries in Europe, aiming to
offer customers a simple, real-time, global and mobile banking solution allowing customers to
0.6%
have current accounts, savings accounts and term deposits with Ferratum
Customers receive a free contactless debit card, allowing customers to withdraw cash across
Europe in any currency
In addition, a current account with Ferratum supports multi currencies, allowing customers to
move money between countries in real-time at attractive FX-rates and enabling cross-boarder
transactions Mobile Bank – Revenue and Contribution (EUR thousands)
Ferratum’s mobile offering will be renewed during 2019, with new services to be introduced
through a new enhanced Mobile Bank app. Customers will eventually have intelligent financial 101%
services (loans, credit, savings, investments and payments) available to address all financial p.a. 1,468
matters, with the services provided by Ferratum and Ferratum’s partners
Ferratum P2P lending and investment platform will be restructured during 2019
The platform will be closed to new retail customers, with existing principals and accrued
interest bought back, and relaunched to serve institutional investors in the first half of 2019 Revenues
529
In 2017, Ferratum launched Primeloans to Finnish private customers, with a subsequent
364
successful rollout in Germany in October 2018. This adds to the company’s growing suite of
consumer lending products
Under this product category, Ferratum competes with larger banks to offer loans in the range
of EUR 3,000-20,000 with maturities ranging from 1-10 years FY 2016 FY 2017 FY 2018
Source: Company filings Note: 1) Includes Mobile Bank, Ferratum P2P, Prime Loan and FerBuy (FerBuy is to be
discontinued). Only for Ferratum Group. Not part of Ferratum Bank’s product offering
29Product Offering per Market
Product area Microloan PlusLoan Credit Limit SME Mobile Bank Primeloan P2P
Finland ✓ ✓ ✓
Northern
Europe
Sweden ✓ ✓ ✓
Denmark ✓ ✓
Norway ✓ ✓
France ✓
✓ ✓ ✓
Western
Germany
Europe
Netherlands ✓ ✓ ✓
Spain ✓ ✓
UK ✓ ✓ ✓ ✓
Bulgaria ✓ ✓
Croatia ✓ ✓
Eastern Europe
Czech Republic ✓ ✓ ✓ ✓
Estonia ✓
Latvia ✓
Lithuania ✓
Poland ✓ ✓ ✓
Romania ✓ ✓
Russia ✓
Slovakia
Rest of the World
Australia ✓ ✓ ✓
Brazil ✓
Canada ✓
Mexico ✓
New Zealand ✓
Nigeria ✓
Live markets 13 9 10 9 5 2 0
Notes: P2P offering discontinued in 2018 – to be restructured and relaunched in 2019
30Table of Contents
Introduction
Operations
Product portfolio
Asset Quality, Funding, Liquidity & Capital Base
Financials
Market Overview
Appendix
Owners, Board of Directors and Management Team
IFRS 9 adoption
Ferratum Bank
Risk Factors
31Asset Quality – Portfolio Ageing Profile (net carrying value) (EURm)
Breakdown of Receivables IAS 39 IFRS 9
Non-comparable to historical figures
% of current
portfolio
Comments 320.5
15%
Due to the stringent loan application procedure and credit scoring applied by the Group, 257.4
47.0
10.0 3%
Ferratum ensures high quality customers from the outset 16.7
236.5
11.7
22.2 30.5 71.8 22%
184.3
Also, the Group constantly reviews its receivables portfolio and receivables that are overdue are 8.7
14.8 51.7
impaired in accordance to a statistical model, described on the following slide 8.1
15.3
106.8
As of December 2018, gross receivables amounted to EUR 468 million while the net amount on 10.9 206.8 191.7
60%
61.5 6.2
balance sheet amounted to EUR 321 million 9.7
12.0 146.1 145.6
3.5
13.3 77.7
Non-performing-loans (NPLs), defined as receivables that are more than 90 days past due, 35.0
amount to 17.8% of net receivables 31-Dec-14 31-Dec-15 31-Dec-16 31-Dec-17 1-Jan-18 31-Dec-18
Ferratum has been able to improve its asset quality due to improved and rigorous credit Not due 1-90 days due 91-180 days due > 181 days due
scoring over the years, however the adoption of IFRS 9 from 2018 had an impact on the Group’s
impairment and credit loss models, making the NPL evolution of FY 2018 incomparable to
earlier years (see slides 54-56 in appendix for further information)
NPL Evolution (% of NPLs of Net Receivables)
Adoption of IFRS 9
Adoption of IFRS 9 led to an instant additional EUR 21 million provision, as net receivables Non-comparable to
historical figures
decreased from IAS 39 compliant EUR 259 million to IFRS 9 compliant EUR 236 million 50%
37%
The NPL ratio would be significantly lower if taking into account that due to focus on short term 40% 33%
29%
lending the yearly lending volume is much higher than the portfolio on balance at year end
30% 21% 21%
Due to small average amounts, loans that are overdue by 180 days still have relatively high 19% 17% 18% 18% 18% 18%
16% 16%
20% 14% 14% 14% 12% 11% 13% 12%
market values and Ferratum seeks to sell older NPL portfolios and thus limit the volume in this 11%
overdue bucket 10%
0%
Collection processes are initiated immediately when a payment is overdue
30-Jun-14
30-Jun-15
30-Jun-16
30-Jun-17
30-Jun-18
30-Sep-14
30-Sep-15
30-Sep-16
30-Sep-17
1-Jan-18
30-Sep-18
31-Dec-14
31-Dec-15
31-Dec-16
31-Dec-17
31-Dec-18
31-Mar-14
31-Mar-15
31-Mar-16
31-Mar-17
31-Mar-18
In the first 60-90 days primarily internal soft collection employing a series of text messages,
letters, and phone calls to encourage customer payment
After the first 60-90 days, external debt collection partners take over collections
Impaired loans may also be sold to third parties through forward flow in Finland, Sweden,
Estonia and Latvia or through auction processes
Source: Company filings. Interim financials for FY 2018 restated. Note: Adoption of IFRS 9 makes historical figures non-comparable
to FY 2018 figures due to varying credit loss provisioning models
32Asset Quality – Impairment per Basket of Receivables, December 2018
Impairment Policy and In EUR ‘000 GBV
Provision for
NBV
Coverage
Credit Losses
Impairments ratio (%)1
Not overdue 205,616 (13,898) 191,718 6.8
Comments
1-90 days due 92,961 (21,127) 71,835 22.7
Overdue receivables are impaired in accordance to a mathematical model (Markov Chains) based
on actual performance of the loan portfolio
91-180 days due 23,234 (13,252) 9,982 57.0
All statistically expected credit losses based on this model (expected loss) are booked when
paying out a loan (group average 6.8%) (IFRS 9 compliant) >181 days due 145,998 (98,996) 47,002 67.8
Based on this risk provisioning model, credit losses come when paying out a loan and income on
the longer term periods only over the term of the products Total 467,811 (147,273) 320,538 31.5
In total, the Group has 31.5% in reserves of gross receivables as of December 2018
Breakdown over impairments per basket of receivables is expressed in the table on the right
The reserving ratio (impairments compared to gross receivables) increases as the likelihood of
Gross Impairments as % of Gross Receivables2
recovery decreases when the receivables are more overdue
Adoption of IFRS 9
Non-comparable to
When a receivable is impaired, the receivable’s carrying amount is reduced to the receivable’s historical figures
recoverable amount
6.4% 6.3% 6.3% 6.3% 6.1% 6.1% 6.3% 6.3% 6.3%
5.8% 5.8% 5.8% 5.7%
The amount of the loss is measured as the difference between the asset’s carrying amount and 5.3% 5.2% 5.0% 5.3%
4.9%
4.5% 4.8%
the present value of estimated future cash flows
The amount of the loss is recognized in profit or loss as an impairment
If the amount of the impairment loss decreases, the previously recognized provision for
impairment is reversed by adjusting the allowance account through profit and loss for the year
Quarterly gross impairments as percentage of gross receivables per corresponding point in time
Q1-14
Q2-14
Q3-14
Q4-14
Q1-15
Q2-15
Q3-15
Q4-15
Q1-16
Q2-16
Q3-16
Q4-16
Q1-17
Q2-17
Q3-17
Q4-17
Q1-18
Q2-18
Q3-18
Q4-18
have been fairly stable throughout the last few years, but has shown a slightly decreasing trend in
2018, ending at 4.9% for Q4 2019
Quarterly impairments for FY 2018 are not fully comparable to earlier years due to adoption of
IFRS 9
Source: Company filings. Interim financials for FY 2018 restated. Note: 1) Impairments / GBV (gross book value). 2) Adoption of IFRS
9 makes historical figures non-comparable to FY 2018 figures due to varying credit loss provisioning models
33Capital Ratio & Liquidity Equity Ratio Ferratum Group
63.3%
55.4%
Comments
Ferratum Group monitors its capital on the basis of its gearing ratio, calculated as net 39.5%
debt to equity 34.5%
31.3%
28.3%30.0% 28.9% 26.9%29.9% 29.7% 28.8% 28.1% 27.9%
21.8% 24.1%
As the deposit taking business has expanded, the borrowing base has increased 21.7% 19.3% 21.5%
18.9%
rapidly hence affecting total equity in relation to net debt
In 2015, the Group went public resulting in net proceeds of EUR 46.2 million
The adoption of IFRS 9 had a direct impact on the Group’s equity, as the required Dec-12 Dec-13 Dec-14 Dec-15 Dec-16 Dec-17 Mar-18 Jun-18 Sep-18 Dec-18
changes to the credit loss provision model led to an additional provision of EUR 20.9
million, of which the impact on equity was a negative EUR 15.1 million Equity ratio Net equity ratio
No transition rule applicable as for traditional banks; the entire adjustment was taken
at cost immediately
Total Equity in Relation to Net Debt (EURm)
The increase in cash over the past years is stemming primarily from the increase in
deposits, with EUR 183 million held in customer deposits as of December 2018
2.56 2.58
2.46 2.47
Cash position was also strengthened as Ferratum issued a EUR 100 million senior 2.33 2.35 Post
Ferratum IPO
unsecured bond in May 2018, which led to a surge in liquidity in Q2-2018 2.20
Hence, Ferratum Group has ample available liquidity to support the business of EUR 116 1.90
million as of December 2018
1.53
277.3
Liquidity Evolution (EURm) 230.9
251.7
171 159 199.5 209.8
132 135
116 116 134.8
72 73 79 45.0
65
39 31
23 17 39 0.58 105.2 98.4 107.4
13 10 9 8 50.3 87.9 95.4 93.4
11 30.6 38.6
13.2 15.7 21.4 77.6
Q1 Q2 Q3 Q4 Q1 Q2 Q3 Q4 Q1 Q2 Q3 Q4 Q1 Q2 Q3 Q4 Q1 Q2 Q3 Q4 Dec-12 Dec-13 Dec-14 Dec-15 Dec-16 Dec-17 Mar-18 Jun-18 Sep-18 Dec-18
2014 2015 2016 2017 2018 Total Equity Net Debt Net debt to equity ratio
Source: Company filings. Interim financials for FY 2018 restated.
34You can also read