A Structural Investigation of Quantitative Easing
←
→
Page content transcription
If your browser does not render page correctly, please read the page content below
A Structural Investigation of Quantitative Easing
                Latest version at http://gregorboehl.com/live/qe_bgs.pdf

                          Gregor Boehla,∗, Gavin Goyb , Felix Strobelc
                                          a Universityof Bonn
                                        b De Nederlandsche Bank
                                         c Deutsche Bundesbank

                                               August 13, 2020

Abstract
Did the Federal Reserve’s Quantitative Easing (QE) in the aftermath of the financial crisis
have macroeconomic effects? To answer this question, we estimate a large-scale DSGE
model over the sample from 1998 until 2020, including data of the Fed’s balance sheet. We
allow for QE to affect the economy via multiple channels that arise from several financial
frictions. Our nonlinear Bayesian likelihood approach fully accounts for the zero lower
bound on nominal interest rates. We find that QE increased output by about 1.2 percent,
reflecting a net increase in investment of nearly 9 percent accompanied by a 0.7 percent
drop in aggregate consumption. Both government bond and capital asset purchases
effectively improved financing conditions. Especially capital asset purchases significantly
facilitated new investment and increased the production capacity. Against the backdrop
of a fall in consumption, supply side effects dominated, leading to a disinflationary effect
of about 0.25 percent annually.
Keywords: Quantitative Easing, Liquidity Facilities, Zero Lower Bound, Nonlinear
Bayesian Estimation
JEL: E63, C63, E58, E32, C62

   ? The views presented are those of the authors and do not reflect the official position of the Deutsche

Bundesbank, De Nederlandsche Bank or the Eurosystem. We are grateful to Kenneth Judd, Keith
Kuester, Christian Matthes, Alexander Meyer-Gohde, Daniel Rees, Alexander Richter, Alexander Scheer,
Dominik Thaler, Sweder van Wijnbergen, and participants at the 2019 CEPR MMCN Conference,
the PASC 19, the 2019 Conference of the Society of Economic Measurement, the Computational Eco-
nomics and Finance Conference in Ottawa, 2019, the VfS Jahrestagung 2019, the 20th IWH-CIREQ-GW
Macroeconometric Workshop and seminars at the Deutsche Bundesbank, De Nederlandsche Bank, the
European Central Bank, the University of Bonn and the University of Lund for discussions and helpful
comments on the contents of this paper. Part of the research leading to the results in this paper has
received financial support from the Alfred P. Sloan Foundation under the grant agreement G-2016-7176
for the Macroeconomic Model Comparison Initiative (MMCI) at the Institute for Monetary and Finan-
cial Stability. Gregor Boehl gratefully acknowledges financial support by the DFG under CRC-TR 224
(project C01).
   ∗ Corresponding author. Address: University of Bonn, Adenauerallee 24–42, 53113 Bonn, Germany

     Email addresses: gboehl@uni-bonn.de, g.w.goy@dnb.nl, felix.strobel@bundesbank.de
1    Introduction

    The recent outbreak of the COVID-19 virus in Europe and United States has caused
severe turmoil on financial markets, last seen during the Global Financial Crisis (GFC) in
2007/08. The Federal Reserve (henceforth Fed) responded – then and today – by quickly
lowering its policy rate to levels near zero, providing liquidity to financial markets and
purchasing assets in large scale. The latter, so the commonly held view, can be seen as a
substitute for conventional monetary policy, if the short-term interest rate is constrained
by the zero lower bound (ZLB)1 . Such conclusions are reassuring as developed economies
increasingly find themselves in a “new normal” that is characterized by a low natural
rate of interest and low inflation, both of which increase the likelihood of future ZLB
episodes (Williams, 2016; Kiley, 2018). And indeed, over the past decade, several studies
showed that large-scale asset purchases (LSAPs) – the primary policy instrument at the
ZLB – were effective in easing financing conditions through compressing term, credit
and liquidity premia.2 Against this backdrop, unconventional monetary policy measures
in general, and LSAPs in particular, have become a permanent part of central banks’
toolkits.
    Despite their prominent role, however, the macroeconomic impact of LSAPs – in
particular, their effect on output, inflation and aggregate investment – remains subject
of an open debate. The empirical evidence that aims at answering this question is,
by and large, limited to evidence from Vector Autoregression models (including, e.g.
Kapetanios et al., 2012; Baumeister and Benati, 2013; Gambacorta et al., 2014; Weale
and Wieladek, 2016; Boeckx et al., 2017). While some studies, such as Andres et al.
(2004); Gertler and Karadi (2011, 2013); Chen et al. (2012) and Carlstrom et al. (2017),
develop structural models to study the effects of QE, in none of the studies, these models
are estimated over the relevant sample period due to the challenges posed by the ZLB
and the resulting nonlinear estimation. As such, a structural investigation of quantitative
easing is yet absent.
    In this paper, we close this gap by estimating a large-scale DSGE model over the
sample from 1998 until 2020 including data of the Fed’s balance sheet. Our model
incorporates different channels of the aforementioned literature thereby allowing QE to
affect the economy via multiple channels. First, three financial frictions ensure limits to
arbitrage between short and long-term assets. On the household side, we assume portfolio
adjustment costs for patient households and further assume that impatient households
are segmented from the market for short-term assets by being restricted to borrowing in
long-term private loans as in Chen et al. (2012). On the banks’ side, an agency problem
creates an endogenous constraint to the bank’s net worth by limiting their ability to
obtain funds from households. As a result, the balance sheet of the banking sector
becomes a critical determinant of the cost of credit. These assumptions give rise to
an extranormal term premium on government bonds, and similarly, extranormal credit
risk premia on loans and capital claims. Central bank asset purchases compress these

    1 To name a few, see e.g. Hamilton and Wu (2012); Gertler and Karadi (2013); Kiley (2018); Debortoli
et al. (2019); Doniger et al. (2019); Bernanke (2020); Sims and Wu (2020a,b)
   2 See e.g. Gagnon et al. (2011); Krishnamurthy and Vissing-Jorgensen (2011); d’Amico et al. (2012);

Bauer and Neely (2014); Swanson (2017) for the US, or e.g. Altavilla and Giannone (2017); Altavilla
et al. (2019); Eser et al. (2019) for the euro area

                                                   2
risk spreads, thereby easing financing conditions for firms and households in our model.
Importantly, through the portfolio rebalancing channel, these risk spreads are compressed
even if the specific asset under consideration is itself not purchased (d’Amico et al., 2012).
    Specifically, purchases of capital assets directly affect the real economy by increasing
investment.3 Moreover, through the portfolio rebalancing, also risk premia on loans to
households fall, thereby stimulating consumption of impatient households. Purchases of
government bonds similarly reduce the credit risk premia on capital assets and loans,
albeit by to a lesser extent. Ultimately, by purchasing government bonds, the central
bank frees up balance sheet capacity of the banks, which can then increase their supply of
credit. Finally, central bank liquidity provisions directly affect a bank’s supply of credit
by easing it’s incentive compatibility constraint.
    Our nonlinear Bayesian likelihood approach fully accounts for the ZLB on nominal
interest rates. In the context of large-scale DSGE models, the solution, filtering and
estimation of models with occasionally binding constraints poses a host of computational
challenges. In order to overcome these challenges, we use the solution method developed
in Boehl (2020b) together with the proposed nonlinear Bayesian filter and smoother.
The linearized model is solved with the ZLB as an endogenous occasionally binding
constraint. To allow sampling from possibly multi-modal, disjoined and high-dimensional
posterior distribution, we apply a tempered version of the differential evolution Monte
Carlo Markov Chain method which uses a large number of chains (ter Braak, 2006; ter
Braak and Vrugt, 2008). Different to e.g. Chen et al. (2012) or Carlstrom et al. (2017),
we do not have to cut the sample before the GFC when the short-term rate reached the
ZLB. Instead, our nonlinear Bayesian likelihood approach allows us to structurally assess
the effects of QE through the lens of a large-scale DSGE model during a period where
the QE measures were taken, but the ZLB was binding. This enables us to take a far
more in-depth account of the effects of these programs.
    We find that between 2009 to 2015, QE increased output by about 1.2%. Accord-
ing to our results, this reflects a net increase in investment of nearly 9 percent, that
was accompanied by a 0.7 percent drop in aggregate consumption. Both, government
bond and private security purchases were effective in improving borrowing conditions
for households and firms. Purchases of capital securities were the most expansionary
by significantly facilitating new investment, thereby increasing the productive capacity.
Against the backdrop of a fall in aggregate consumption, however, supply side factors
dominated which led to a disinflationary effect of about 0.25 percent annually. While
emergency liquidity provision measures sharply lowered the credit spread at the onset of
the crisis by around 100 basis points, their macroeconomic effects were negligible due to
their short-lived nature.
    Our finding of disinflationary effects of QE is well-aligned with recent findings on the
effects of financial shocks. Specifically, expansionary financial shocks can be disinflation-
ary if supply effects dominate demand effects. Demand effects dominate, for instance,
in models of Curdia and Woodford (2010) and Gertler and Karadi (2011). Consistent
with prevailing supply effects, Abbate et al. (2016) show that financial shocks that lower

    3 Following Gertler and Karadi (2013), we model the Fed’s purchases of mortgage backed securities

as the central bank buying claims on the productive capital stock. Despite this discrepancy, our model
captures the link between the financial and real economy as balance sheet policies of the central bank
affect extranormal credit risk and term premia and thereby lending rates.
                                                  3
firms’ funding costs and increase credit growth and stock prices indeed reduce inflation
in the short run. Similarly, but using granular micro-data, Gilchrist et al. (2017) show
that firms’ with binding liquidity constraints increased prices during the GFC, while
unconstrained firms lowered them. To rationalize this empirical finding, the authors
build a theoretical model where firms price goods above marginal costs in order to hedge
against the risk of relying on costly external finance. Relatedly, Boehl and Lieberknecht
(2020) show that a binding ZLB constraint can amplify the inflationary tendency of con-
tractionary financial shocks. Quantitative easing, in turn, can be interpreted as such
an expansionary financial shock that substantially lowers long-term interest rates. The
resulting surge in investment raises the capital stock in our model. Facing a higher pro-
duction capacity, firms lower the degree of capital utilization which pushes down the
associated marginal costs. This mechanism is similar to Acharya et al. (2020), who find
that cheap credit to impaired firms has a disinflationary effect by creating excess produc-
tion capacity. Against this backdrop, our results suggest that aggregate supply channels
dominated in determining the response of inflation to LSAPs.
    Our finding that QE can have undesirable effects on inflation and consumption chal-
lenges a number of recent findings on the conduct of monetary policy. Debortoli et al.
(2019) and Sims and Wu (2020a), among others, prominently argue that conventional
and unconventional monetary policy are perfect substitutes. Relatedly, Krippner (2013);
Wu and Xia (2016) provide shadow rates that are constructed to include the effects of
QE into a framework of standard interest rate setting. In contrast to these papers, we
document effects of QE that fundamentally differ from those of standard interest rate
policy. As such, our results imply that unconventional measures cannot be simply taken
to be a substitute for conventional policy. This cautions against the use of shadow rates
and from abstracting from the presence of the ZLB.
    Our results are robust to different specifications of the household side which affect
the channel of QE to consumption. We show this by estimating the representative agent
version of the model. In this model vintage, investment increases more in response
to a QE shock than in our benchmark model. The resulting increase in the produc-
tion capacity even further decreases utilization, inducing an even larger fall in inflation
and aggregate consumption. In a second vintage, we replace the impatient households
by hand-to-mouth consumers inspired by Kaplan et al. (2018). Other than impatient
households, hand-to-mouth consumers do not optimize but simply consume their period
labor income, which more closely ties consumption to investment. For this model version,
aggregate consumption again falls stronger than in our benchmark model, because falling
wages dominate any labor income gains from increased labor supply. As the capacity
channel that exerts downward pressure on inflation remains unaltered, the inflation re-
sponse remains consistent with our benchmark model. We also asses the robustness of
our results by estimating the Carlstrom et al. (2017) model the more recent data sample.
This confirms the drag on consumption to be a robust consequence of QE. In contrast to
our benchmark model, demand effects of LSAPs appear to outweigh their supply effects.
We take this result with a considerable degree of caution due to several caveats related
to the suitability of the CFP model to this exercise. For instance, we find that this
model lacks a demand side shock that allows a strict co-movement of consumption and
investment.
    The rest of the paper is organized as follows. Section 2 presents the core of our large-
scale dynamic general equilibrium model. The nonlinear Bayesian estimation methodol-
                                              4
ogy is explained in Section 3. Our posterior estimates are discussed in Section 4, together
with an empirical analysis of the GFC and its aftermath. Section 5 then presents our
main results in the form of counterfactual analysis of the Fed’s unconventional monetary
policy measures. Subsequently, in Section 6, we show that our results are robust with
respect to several model features. Finally, Section 7 concludes.

2   Model

    To study the macroeconomic effects of quantitative easing, we build a large-scale
New Keynesian model featuring patient and impatient households, banks, firms as well
as a fiscal and a monetary authority. Patient households consume, supply labor and
save. Their savings can take the form of short-term bank deposits, private securities
backed by firm’s capital and government bonds, where the latter two are long-term
assets and subject to convex portfolio adjustment costs. In turn, impatient households
borrow via long-term private loans from banks besides consuming and supplying labor.
Similarly to Chen et al. (2012), households are thus split into “savers” and “borrowers”.
Banks are modeled as in Gertler and Karadi (2013). They collect deposits from patient
households, which they lend on to impatient households, intermediate good producers
and the government in the form of long-term bonds and loans. A moral hazard problem
constrains their leverage, which creates the necessary limits to arbitrage for QE to have
an effect on the banks balance sheet.
    The production sector consists of three types of firms for reasons of tractability.
Intermediate good producers employ labor and capital to produce their goods. Each
period, after producing their output, they sell their used capital stock to the capital
goods producers. The latter repair it and invest in new capital. At the end of the period,
capital is re-sold to the intermediate good producers which use it for production in the
next period. Intermediate goods are purchased by retailers which repackage them and
sell them with a markup as final goods. Similarly, labor is differentiated by a union with
monopoly power that faces nominal rigidities.
    The government consumes final goods, collects taxes, and issues long-term govern-
ment bonds. Monetary policy sets the short-term interest rate according to a Taylor-type
rule which is constrained by the ZLB. In line with the literature on estimated DSGE mod-
els, our model also includes standard features such as habit formation in consumption,
investment adjustment costs, variable capital utilization, nominal rigidities as in Calvo
(1983) in both, price and wage setting, as well as price and wage indexation.
    We model large-scale asset purchases of treasury bonds and private capital assets to
follow exogenous AR(2) processes. This way, we allow for anticipation and stock effects
without necessarily having to specify a policy rule for unconventional monetary policy.
Arguably, the measures of QE came as much as a surprise to the US economy as the
crisis did. At the same time, once in action the future path of these measures was public
information. Our outlined setup approximates this structure. Liquidity injections by the
central bank to financial intermediaries are also exogenous.
    Finally, time is discrete and one period in the model represent one quarter. Below,
we will describe the financial sector and the household structure in more detail, while we
refer the reader to the Online Appendix for a full description of the model.

                                            5
2.1   The household structure
    The model is populated by two types of households. We assume a continuum of
impatient households with mass χ and a continuum of patient households of mass 1−χ. In
the spirit of Gertler and Karadi (2013), we impose that a constant fraction f of the patient
household works as banker, whereas the remaining fraction 1 − f consists of workers who
– like impatient households – supply labor to the intermediate good producers. While
workers receive their wage income every period, bankers reinvest their gains in asset
holdings of the bank over several periods. Only when a banker (exogenously) exits the
banking sector, she contributes to the patient households’ income by bringing home the
accumulated profits. Perfect consumption insurance within patient households ensures
that workers and bankers face the same consumption stream. The expected lifetime
utility of any household i is given by
                        ∞
                                        (Ci,t − hCi,t−1 )1−σc − 1                 σc − 1 1+σl
                        X
              Ut = E0         βit                                       exp             L           (1)
                        t=0
                                                 1 − σc                           1 + σl i,t

where parameters βi , h, σc , and σl are, respectively, the discount factor, the degree of
external habit formation in consumption, the coefficient of relative risk aversion, and a
weight on the disutility of labor. The discount factor has a household-specific subscript
i, because we assume the discount factor of impatient households βm to be smaller than
the discount factor of patient households, i.e. βm < βp . Finally. Ci,t and Li,t denote
consumption and hours worked of household i ∈ {m, p}, respectively.4

2.2    Patient households
    The patient household earns the real wage, Wt , for her supplied labor, Lp,t . She can
save in one-period bank deposits, Dt , that pay an interest rate, Rtd , in government bonds,
Bh,t , that yield an interest rate, Rtb , and in capital assets Kh,t with an associated interest
rate, Rtk . These interest rates are already in real terms, i.e. accounting for inflation. Cap-
ital claims, just like government bonds, are modeled as long-term assets. As for all stock
variables, we use the end-of-period notation, so that Dt denotes the household’s deposits
at the end of period t. The return on deposits, Rtd = vu,t Rt , includes a disturbance term,
vu,t which drives a wedge between the risk-free real rate and the return on deposits. We
assume vu,t to follow an AR(1) process in logs. Smets and Wouters (2007) label this
shock a risk-premium shock which they interpret as variations in the confidence in the
banking system. Patient households spend their funds on consumption Cp,t , and save in
new deposits, bonds and capital. Savings in government bonds and capital are, as in e.g.
Chen et al. (2012) and Gertler and Karadi (2013), subject to portfolio adjustment costs
with adjustment parameter κ, once portfolios exceed a level of Kh,t ≥ K̄h and Bh,t ≥ B̄h ,
respectively. The budget constraint of patient households, in real terms, reads
                   Dt              1                               1
          Cp,t +       + Qt [Kh,t + κ(Kh,t − K̄h )2 ] + Qbt [Bh,t + κ(Bh,t − B̄h )2 ]
                   Rtd             2                               2                                (2)
                   = Dt−1 + Wt Lp,t + Rtk Qt−1 Kh,t−1 + Rtb Qbt−1 Bh,t−1 − Tt + Pt .

  4 For the ease of notation, we only use subscripts i ∈ {m, p} indicating which type of household is

meant if necessarily needed.
                                                      6
Tt denotes lump sum taxes raised by the government to finance government spending,
and Pt are profits of monopolistic firms and banks that accrue to the patient households.
Maximizing (1) subject to the patient household’s budget constraint (2) and rearranging
the first order conditions yields the well-known Euler equation, a condition for the optimal
supply of labor and two no-arbitrage conditions:
                                                                         −σc
                              σc − 1 1+σl                 Cp,t+1 − hCp,t

              1 = βp Et exp          (Lp,t+1 − L1+σ
                                                p,t
                                                    l
                                                      )                        Rtd ,       (3)
                              1 + σl                      Cp,t − hCp,t−1
           Wth = (Cp,t − hCp,t−1 )Lσp,tl ,                                                 (4)
           k
       Et Rt+1   =   Rtd [1   + κ(Kh,t − Kh )],                                            (5)
           b
       Et Rt+1   =   Rtd [1   + κ(Bh,t − Bh )].                                            (6)

Ultimately, the no-arbitrage conditions (5) and (6) specify the patient household’s opti-
mal holdings of both capital claims and government bonds.

2.3   Impatient households
    There is a fraction of χ impatient households which consume, supply labor and borrow
long-term private loans from the banks which gives rise to the following budget constraint
in real terms
                        Cm,t + Rtp Qpt−1 Bm,t−1
                                          p                      p
                                                = Wt Lm,t + Qpt Bm,t ,                 (7)
                                                                                       p
where RtP and QP t denote, respectively, the interest rate and price of private loans Bm,t .
Price and yield of private loans are related through

                                                     ξ + κp Qpt
                                             Rtp =              ,
                                                       Qpt−1

where ξ is the coupon (or redemption) and κp denotes the decay factor (Woodford, 1998,
2001). Maximizing (1) subject to the impatient households budget constraint (7) yields,
after some rearranging, an Euler equation for the optimal borrowing and a condition for
the labor supply of impatient households:
                                                                            −σc
                                     σc − 1 1+σl             Cm,t+1 − hCm,t

          1 = βm Et exp                    (L        1+σl
                                                  − Lm,t )                        Rtp ,    (8)
                                     1 + σl m,t+1            Cm,t − hCm,t−1
        Wth = (Cm,t − hCm,t−1 )Lσm,t
                                  l
                                     .                                                     (9)

2.4   Banks
   The banking sector draws on Gertler and Karadi (2013) with the extensions that we
outline below. Banks collect deposits Dt from patient households and – together with
                                                             p
their own net worth Nt – use these funds to extend loans Bb,t  to impatient households,
purchase capital securities from intermediate good producers, Kb,t , and purchase govern-
ment bonds Bb,t . Given these financial operations, the balance sheet of a representative
bank then follows as

                              Qt Kb,t + Qbt Bb,t + Qpt Bb,t
                                                        p
                                                            = Nt + Dt + Lqt ,             (10)

                                                      7
where Lqt denotes exogenous emergency liquidity injections by the Federal Reserve. While
it can be argued that this might be an ad hoc way of modeling such injections, the
provision of central bank liquidity was a very important funding source when interbank
market dried up during the height of financial crisis. As such, these operations were
essential in preserving market functioning and preventing cascading fire sales which,
ultimately, might have led to a credit crunch (Bernanke, 2008; Fleming, 2012). In our
model, these liquidity injections directly support bank lending by increasing banks’ net
worth and easing their financial constraints as shown below. Despite their relatively short
duration, these liquidity injections have been sizable, and their effects have not yet been
assessed empirically in a structural context. For simplicity, we assume that central bank
liquidity is lent at a zero nominal interest rate (i.e. their real rate equals RtL = 1/Πt+1 ,
where Πt denotes gross inflation). Banks retain their earnings and add it to their current
net worth. This gives rise to the following law of motion for the bank’s net worth
                                                                       p
                  Nt = Rtk Qt−1 Kb,t−1 + Rtb Qbt−1 Bb,t−1 + Rtp Qpt−1 Bb,t−1
                                                                                        (11)
                                                     d
                                                   −Rt−1         L
                                                         Dt−1 − Rt−1 Lqt−1 .

Note that while the interest rate on deposits raised in period t − 1 is determined in the
same period, the return of assets is risky and only determined after the realization of
shocks at the beginning of period t.
    Bankers continue accumulating their individual net worth until they (involuntarily)
exit the business, which occurs randomly with exogenous probability, 1 − θ. Conversely,
bankers continue their operations with probability θ. Draws from this lottery are i.i.d.
and do not depend on the banker’s history. When a banker leaves the sector, she adds her
terminal wealth, Vt , to the wealth of the patient household she is member of. Therefore,
bankers seek to maximize the expected discounted terminal value of their wealth
                                      ∞
                                      X              Λp,t+1+i
                    Vt   =   max Et       (1 − θ)θi βpi+1     Nt+1+i ,
                                   i=0
                                                      Λp,t+i

                                       Λp,t+1
                         =   max Et βp        (1 − θ)Nt+1 + θVt+1 ,                     (12)
                                        Λp,t

where Λp,t denotes the patient household’s Lagrangian multiplier with respect to the
budget constraint.
    Banks operate under perfect competition. If financial intermediation was frictionless,
the risk adjusted return on the bank’s asset should equal the return on deposits. As in
Gertler and Karadi (2013), however, bankers can divert a fraction of their assets and
transfer it to their respective households. If they do so, their depositors will withdraw
their remaining funds and force the bank into bankruptcy. This moral hazard/costly
enforcement problem creates an endogenous limit to the amount of deposits that house-
holds are willing to supply. While the latter ensures that bankers earn a strictly positive
excess return, it also creates limits to arbitrage, as bankers can not scale-up their balance
sheet to arbitrage away any price differences. In order to prevent a banker from diverting
a fraction of assets, households keep their deposits at a bank only as long as the bank’s
continuation value is higher or equal to the amount that the bank can divert. Formally,
the latter condition is given by the following incentive compatibility constraint of the
                                               8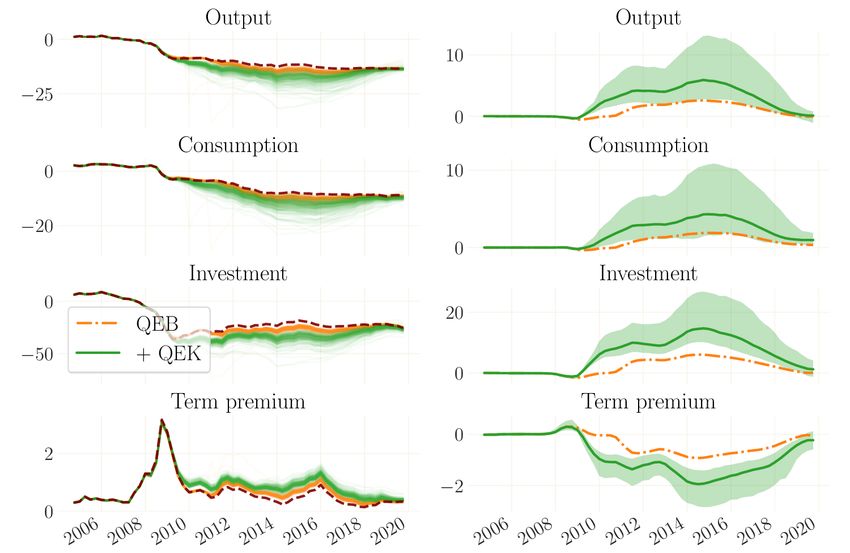
bank
                       Vt ≥ λk,t Qt Kb,t + λb Qbt Bb,t + λp Qpt Bb,t
                                                                 p
                                                                     − λL Lqt ,                   (13)
where λj for j ∈ {k, p, b} denotes the respective fraction of capital claims, government
bonds or private loans that the bank can diverted. Following Dedola et al. (2013) and
Gelain and Ilbas (2017), we allow λk,t to be time-varying, formally following an AR(1)
process in logs with mean λk . Ultimately, this shock triggers variations in the divertiblity
of capital assets and can be interpreted as variations in the trust depositors have in the
quality of banks’ capital assets.
    In steady state, the λj ’s for j ∈ {k, p, b} determine – together with other estimated
parameters such as the discount factor of patient households, βp , and the trend growth
rate, γ – the returns on capital claims and government bonds, Rk and Rb , as well as
the private loan rate Rp . We set the prior mean of the relevant parameters such that
the respective excess returns over the deposit rate are based on data for the US treasury
rate, Gilchrist and Zakrajšek (2012) corporate spread and mortgages rates for private
households. This results, a priori, in λb < λp < λk , which intuitively can be motivated
by the fact that, in general, the collateral value of government bonds is higher than that
of mortgage loans and capital claims.5 The reason is that treasury bonds enjoy higher
credit ratings and are subject to less liquidity risks than mortgage loans or capital claims.
Finally, the last term in the incentive constraint is due to the assumption that liquidity
injections serve to relax the incentive constraint of banks.
    To solve the bank problem, let an initial guess of the value function be of the form
                                                              p
                Vt = νk,t Qt Kb,t + νb,t Qbt Bb,t + νp,t Qpt Bb,t + νn,t Nt + νL,t Lqt ,          (14)

where νk,t , νb,t , νp,t , νd,t , and νL,t are time-varying coefficients. Maximizing (14) with
                                    p
respect to Kb,t , Bb,t and Bb,t       subject to (13) yields the following first order conditions
for capital claims, governments bonds, private loans, and µt , the Lagrangian multiplier
on the incentive compatibility constraint
                              µt
                 νk,t = λk,t        ,                                                             (15)
                            1 + µt
                             µt
                νb,t = λb        ,                                                                (16)
                          1 + µt
                             µt
                νp,t = λp         ,                                                               (17)
                          1 + µt
   νn,t Nt + νL,t Lqt = (λk,t − νk,t )Qt Kb,t + (λb − νb,t )Qbt Bb,t + (λp − νp,t )Qpt Bb,t
                                                                                        p
                                                                                            .     (18)

Given that the incentive compatibility constraint binds6 , we can rewrite this last equation
as
               νb,t − λb b         νp,t − λp p p    νL,t + λL q     νn,t
  Qt Kb,t =              Q Bb,t +            Q B +            L +            Nt .                 (19)
              λk,t − νk,t t       λk,t − νk,t t b,t λk,t − νkt t λk,t − νk,t

   5 In a similar vein, Meeks et al. (2017) use the same approach to distinguish between the collateral

values of loans and asset-backed securities.
   6 The constraint binds in the neighborhood of the steady state. For convenience, we make the as-

sumption that it is binding throughout all experiments.
                                                   9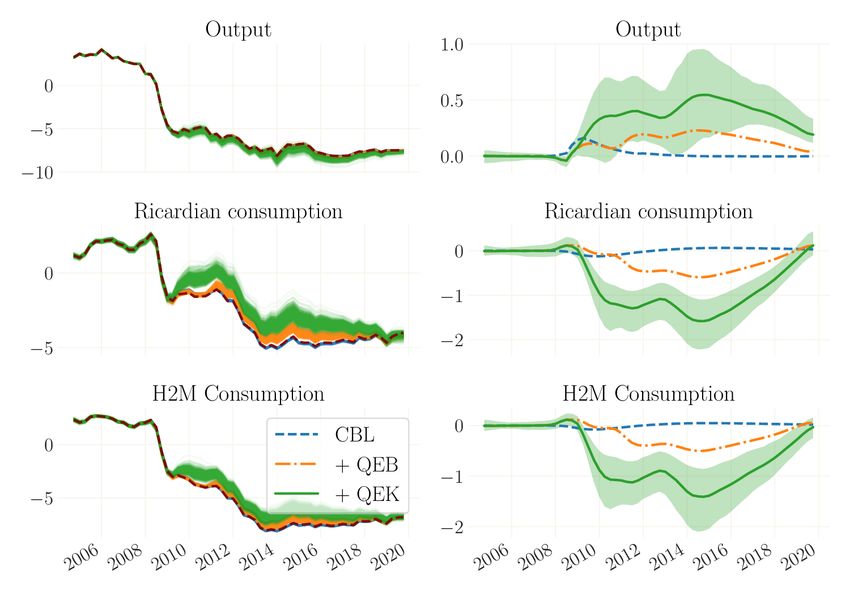
Intuitively, (19) states that banks’ demand for capital claims decreases in λj for j ∈
{k, p, b}, which regulate the tightness of the incentive constraint with respect to capital
claims, mortgage loans over government bonds. Central bank liquidity injections Lqt , on
other hand, support the demand for capital claims.
    Substituting the demand for capital claims into (14), and combining the result with (15)
one can write the terminal value of the banker as a function of its net worth

                          Vt = (1 + µt )νnt Nt + [(1 + µt )νL,t + µt λL ]Lqt                    (20)

A higher continuation value, Vt , is associated with a higher shadow value of holding
an additional marginal unit of assets, or put differently, with a higher shadow value
of marginally relaxing the incentive compatibility constraint. Then, define the bank’s
stochastic discount factor as
                                        Λp,t
                                Ωt ≡           (1 − θ) + θ(1 + µt )νn,t ,                       (21)
                                       Λp,t−1

and substitute (20) into the Bellman equation (12). Using the law of motion for net
worth (11), one can then write the value function as

                                   k
              Vt =βp Et Ωt+1 ((Rt+1     − Rtd )Qt Kb,t + (Rt+1
                                                           b
                                                                − Rtd )Qbt Bb,t

                            p
                       + (Rt+1               p
                                 − Rtd )Qpt Bb,t + (Rtd − RL,t )Lqt + Rtd Nt )

                                 Λp,t+1
                       + βp Et          θ[(1 + µt+1 )νL,t+1 + µt+1 ΛL ]Lqt+1
                                  Λp,t

Finally, verifying the initial guess for the value function yields
                                k
       νk,t   =    βp Et Ωt+1 (Rt+1 − Rtd ),                                                    (22)
                                 b
       νb,t   =    βp Et Ωt+1 (Rt+1      −   Rtd ),                                             (23)
                                 p
       νp,t   =    βp Et Ωt+1 (Rt+1      −   Rtd ),                                             (24)
       νn,t   =    βp Et Ωt+1 Rtd                                                               (25)
                                                   Λp,t+1
                   βp Et Ωt+1 (Rtd − RtL ) + θρcbl

       νL,t   =                                           [(1 + µt+1 )νL,t+1 + µt+1 λL ] ,      (26)
                                                    Λp,t

where the last equality follows from the fact that Lqt follows an AR(1) in logs with
persistence parameter ρcbl .

2.5   Monetary policies and the ZLB
    In response to the Great Recession, the Federal Reserve cut its policy rate to essen-
tially zero. We model conventional monetary policy as a standard reaction function with
the central bank responding to deviations of inflation from it’s target, the output gap
and its growth rate
                               s     ρ         φπ          φy       φdy 1−ρ
                  Rts

                              Rt−1           Πt           Yt            Yt
                      =                                              ∆                 vr,t ,   (27)
                  Rn           Rn            Π            Yt∗           Yt∗
                                                          10
with the ZLB constraint
Rtn = max R̄, Rts ,
(28)
s
where we refer to the unconstrained nominal rate Rt as the notional (or shadow) rate.
∗ Yt
Yt denotes the potential output and ∆ Y ∗ denotes the growth in the output gap. The
t
parameter ρR expresses an interest rate smoothing motive by the central bank over the
notional rate and φπ , φy and φdy are feedback coefficients. The max-operator in (28)
reflects the zero lower bound (ZLB) on the nominal interest rate Rtn , which we take into
account in our estimation procedure. For this purpose, R̄ denotes the exact level at
which the ZLB binds.7 When the economy is away from the ZLB, the stochastic process
vr,t – which follows an AR(1) in logs – represents a regular interest rate shock. However,
when the nominal interest rate is zero, vr,t may not directly affect the level of the nominal
interest rate. Instead, vr,t affects the expected path of the notional rate, first through it’s
own persistence and, second, through the persistence in the notional rate, and therefore
alter the expected duration of the lower bound spell. At the ZLB, it can hence be viewed
as a forward guidance shock.
At the onset of the Financial crisis, the Federal Reserve injected large amounts of
liquidity into the financial sector which is known as credit easing. We capture these
emergency liquidity injections with an exogenous variable that eases banks’ incentive
compatibility constraint (13) and thereby stimulates lending. In our estimation, we feed
the time series data on these liquidity injections into the model and assume that the
associated process follow AR(1) process. That is, formally
L̃t = ρcbl L̃t−1 + CBL,t , (29)
Lq
where L̃ ≡ Pt Yt t denotes central bank liquidity as percentage of GDP.
When the policy rate hit the ZLB in December 2008, the Federal Reserve further
started its large scale asset purchase program, under which it purchased different debt
instruments in order to suppress credit and term premia. In our analysis, we divide these
purchases into private (capital) security purchases and government bond purchases, both
which we assume to follow an AR(2) process in logs.
K̃cb,t =ρk,1 K̃cb,t−1 + ρk,2 K̃cb,t−2 + QEK,t , (30)
B̃cb,t =ρb,1 B̃cb,t−1 + ρb,2 B̃cb,t−2 + QEB,t . (31)
Similar to the liquidity injections, K̃ and B̃ denote, respectively, the central banks capital
claim and government bond purchases as a fraction of GDP. The advantage of an AR(2)
process is that it can capture the hump-shaped response of the asset purchases, thereby
also ensuring anticipation or stock effects at the moment the announcement was made.
3 Estimation and Methodology
The fact that our sample includes a long episode where the ZLB binds poses a host
of technical challenges. These are related to the solution, filtering and estimation of the
7 Given that, empirically, the Federal Funds rate remained strictly above zero, we choose R̄ to be
slightly above one in our estimation. Moreover, due to the fact that the Fed never implemented negative
rates, we use the term “zero lower bound” and “effective lower bound” interchangeably.
11model in the presence of an occasionally binding constraint (OBC). While solution meth-
ods for models with OBCs exists – as do nonlinear filters – the satisfactory combination
of both in the context of a large-scale DSGE model is computationally very expensive
and was so far deemed impossible. In this section, we first briefly sketch the set of novel
methods proposed by Boehl (2020b) that allow us to estimate such high dimensional
models in the presence of a binding ZLB. Subsequently, this section describes our choices
with regard to the data.
3.1 Solution method
Throughout this paper we apply the solution method for OBCs presented in Boehl
(2020b). We refer to the original paper for details. The model is linearized around its
steady state balanced growth path and thereby implicitly detrended. Respecting the
ZLB, the original model with the variable vector yt can be represented as a piecewise
one-sided first-order auxiliary model with
vt Et vt+1 vt v
N + h max p +m , r̄ = Et t+1 , (32)
wt−1 wt wt−1 wt
vt y
where = S t is an auxiliary representation. wt−1 contains all the (latent)
wt−1 εt
state variables augmented by the current shocks, and vt contains all forward looking
variables. N is the system matrix and r̄ is the minimum value of the constrained
variable
rt (here, the nominal interest rate). The constraint is included with rt =
Ev vt
max p t t+1 + m , r̄ . The vector h contains the effects of rt onto all other
wt wt−1
variables. Further, denote by the two integer values k and l respectively the expected
duration of the ZLB spell and the expected number of periods before the ZLB binds.
It can be shown that the rational expectations solution to (32) for the state s periods
ahead, (vt+s , wt+s−1 ), can be expressed in terms of wt−1 and the expectations on k and
l as
Ls (l, k, wt−1 ) =Nmax{s−l,0} N̂min{l,s} S(l, k, wt−1 ) (33)
−1 max{s−l,0}
+ (I − N) (I − N )hr̄ (34)
vt+s
= , (35)
wt+s−1
−1
where N̂ = (I − h ⊗ p) (N + h ⊗ m) and
vt
S(l, k, wt−1 ) = vt : QNk N̂ = −Q(I − N)−1 (I − Nk )hr̄ . (36)
wt−1
Here, Q = I −Ω for vt = Ωwt−1 represents the linear rational expectations solution
of the unconstrained system as e.g. given by Blanchard and Kahn (1980) or Klein (2000).
Finding the equilibrium values of (l, k) must be done numerically. One advantage
of the above representation is that the simulation of anticipated equilibrium paths can
be avoided when iterating over (l, k). The resulting transition function is a nonlinear
12state-space representation.8
3.2 Filtering and Estimation Method
Likelihood inference requires a nonlinear Bayesian filter (An and Schorfheide, 2007).
Given the high dimensionality of our model, the particle filter is not feasible.9 To fill this
gap, Boehl (2020b) introduces the transposed-ensemble Kalman filter (TEnKF) which
is a hybrid of the particle filter and the Kalman filter. For the transition t − 1 → t
an ensemble of particles is sampled from the state distribution at t − 1. Instead of re-
sampling (particle filter), the TEnKF applies statistical linearization to update the state
estimate represented by the ensemble to match each new observation vector. This allows
to efficiently approximate the distribution of states for large-scale nonlinear systems with
only a few hundred particles instead of several million or billion, as with the particle
filter, which is computationally advantageous.10 Boehl (2020b) also proposes a nonlinear
path-adjustment smoother (NPAS) for high-dimensional nonlinear models, which we use
obtain the smoothed/historic shock innovations.
We sample from the posterior distribution using a tempered version of the differen-
tial evolution Monte Carlo Markov chain method (ter Braak, 2006; ter Braak and Vrugt,
2008, DE-MCMC).11 The DE-MCMC sampler is a subclass of ensemble MCMC meth-
ods. Instead of using a single Markov chain (as e.g. the Metropolis algorithm), such
ensemble samplers use a large number of chains (as well called ensemble). Proposals
for each iteration are generated based on the state of the previous ensemble instead of
an explicit proposal distribution. The DE-MCMC sampler is hence self-tuning and the
ensemble structure make massive parallelization straightforward. This is in particular im-
portant as both the simulation and the filtering step are computationally expensive. The
combination of DE-MCMC with tempering (similar to Herbst and Schorfheide, 2014)
has the advantage that it is very robust to local maxima and odd-shaped or bimodal
distributions.12
3.3 Data and calibration
In order to quantify the effects of the large scale asset purchases and liquidity injec-
tions taken in the aftermath of the Financial Crisis of 2008-09, we estimate our model
on data from 1998:I to 2019:IV. Importantly, and different to earlier papers that also
8 We use the implementations of Boehl (2020a,c) which, for the model presented here, will solve for
the nonlinear state-space representation of about 80.000 particles draws per processor and second.
9 The inversion filter used in Guerrieri and Iacoviello (2017) and discussed in Cuba-Borda et al. (2019)
is also not an option as it is not a Bayesian filter and ignores uncertainty on the initial states and the
observations. This may not be crucial for small-scale models without endogenous state variables as in
Atkinson et al. (2019), but is important given the high dimensionality of our model and our relatively
short data sample.
10 For all estimations and for the numerical analysis, we use an ensemble of 350 particles. For our
model, the evaluation of the likelihood for one parameter vector would then take 1-2 seconds on a single
CPU.
11 We employ the Python package emcee provided by the authors at https://github.com/dfm/emcee.
The implementation of the tempering scale is a straightforward extension included in Boehl (2020c).
12 We initialize the posterior ensemble with 200 draws sampled from the prior distribution. We then
use 8 temperature steps with each 200 iterations. Finally, we let the sampler 2500 run iterations, of
which we keep the last 500 ensembles. The posterior parameter distribution is hence represented by
500 × 200 = 10000 parameter sets.
13attempt to assess the effects of large-scale asset purchases such as Chen et al. (2012)
and Carlstrom et al. (2017), we include the ZLB period and data on the Fed’s balance
sheet in our nonlinear estimation procedure. We find that including the period in which
QE was conducted to be crucial to properly assess the effects of QE.13 We abstain from
using a longer sample, which includes the Great Inflation and its conquest, because the
downward trend in the nominal interest rate observed since the 1980s would severely
distort the analysis.14 Stretching the sample further back in time also bears the risk of
misspecification given the large amount of parameters we estimate and, concomitantly, a
risk of biasing the effects of QE. For this, we chose the sample to adequately capture the
current low interest rate environment and potential structural changes in the economy,
like a flatter Phillips curve.15
We use a total of eleven observables in the estimation. GDP, consumption, investment
and wages are all in real terms and calculated as per capita growth rates. We follow
Justiniano et al. (2011) and add durable goods consumption into investment. To measure
labor supply, we use average weekly hours worked multiplied by the employment level and
divided by civilian noninstitutional population to measure the per capita labor supply.
Due to artificial dynamics in the civilian noninstitutional population series that arise
from irregular updating (Edge et al., 2013), we use a 4-quarter trailing moving average
instead. Inflation is measured as the log differences of the GDP deflator. We include
the Federal Funds Rate (FFR) and the Gilchrist and Zakrajšek (2012, henceforth GZ)
spread as quarterly rates. The latter is an average credit spread on corporate bonds,
very similar to Moody’s BAA spread, yet considers the entire spectrum of credit ratings
from “single D” to “triple A”. While the dynamics of both spreads is very similar over
our sample (the correlation of quarterly data reaches 0.9), the GZ spread peaks higher
during the Financial crisis but remains less elevated thereafter than the BAA spread,
both which is preferred by the model.
For the unconventional monetary policies, we use three observables that we feed into
the model as exogenous policy shocks. First, we take the total face value of U.S. Treasury
securities held by the Federal Reserve divided by nominal GDP as measure for the Fed’s
government bond purchases. Second, we add the current face value of mortgage-backed
obligations held by Federal Reserve to the net portfolio holdings of the Commercial Paper
Funding Facility, both as a fraction of nominal GDP, and use it as a measure for purchases
of private capital securities. Third, to measure the Fed’s emergency liquidity injections
in 2008/09, we add – in line with Fleming (2012) – the central bank liquidity swaps, the
current face value of federal agency obligations held by Federal Reserve, the term auction
credit held by the Federal Reserve and other loans held by the Federal Reserve, all as a
fraction of nominal GDP. The latter mainly includes the Asset-backed Commercial Paper
13 In the Online Appendix, we show that using the pre-crisis sample from 1983:I until 2008:III may
severely bias the effects of these measures.
14 Boehl and Strobel (2020) show that in the estimation of the canonical Smets and Wouters (2007)
model on data from 1983-2019, the downwards trend in the nominal rate is reflected by an artificially
elevated consumption series that even in the GFC does not drop below steady-state.
15 There is an extensive literature that documents a fall in the natural rate of interest and trend
inflation since the 1980s (see e.g. Laubach and Williams, 2003; Brand et al., 2018, 2020). Similarly,
the semi-structural estimates of Laubach and Williams (2003) and Brand et al. (2020) indicate weak
relationships between inflation and economic slack, in line with structural estimates of Del Negro et al.
(2015) and Kulish et al. (2017). Finally, a similar flattening has been documented for the wage Phillips
curve by e.g. Daly and Hobijn (2014).
14Figure 1: Unconventional monetary policy measures: The Fed’s balance sheet expansion.
Note: All variables are in % of GDP. See Appendix A for more details on their construction.
Money Market Mutual Fund Liquidity Facility and the Primary Dealer Credit Facility.
Figure 1 shows those three time series.
To facilitate the nonlinear filtering, we assume small measurement errors for all vari-
ables with a variance that is 0.01 times the variance of the respective series. Since the
Federal Funds rate is perfectly observable (though on higher frequency) we divide the
measurement error variance here again by 100. Except for labor supply, the data is not
demeaned as we assume the non-stationary model follows a balanced growth path that
we estimate in line with Smets and Wouters (2007). The measurement equations and
a detailed description of the data, as well as its treatment and sources is delegated to
Appendix A.
Finally, we fix several parameters prior to estimating the others. In line with Smets
and Wouters (2007), we set the depreciation rate to δ = 0.025, the steady state govern-
ment share in GDP to G/Y = 0.18, and the curvature parameters of the Kimball aggre-
gators for prices and wages to p = w = 10. The steady state markup in the labor market
is set to λw = 1.1. We set the decay factor for both government bonds and private loans
to 0.975, which implies an average maturity of 40 quarters. The quarterly coupon/repay-
ment is set to 0.04. Also, we calibrate the empirical lower bound of the nominal interest
rate for the U.S. to 0.05% quarterly. Setting it exactly to zero would imply that the ZLB
never binds in our estimations, as the observed FFR remained strictly above zero. Our
choice therefor maintains that the ZLB is considered binding throughout the period from
2009:Q1 to 2015:Q4. More precisely, it holds that r̄ = −100( (βγ)π−σc − 1) + 0.05. Lastly,
the Fed’s treasury holdings as percentage of GDP have neither been zero nor constant
in the years preceding the Financial crisis (see Figure 1). In order to not account these
holdings as QE measures, we fix the mean of the central bank’s treasury holdings in the
measurement equation to BYcb = 5.5%, and assume this was also the case prior to 2003:I
(the first data point observed). This implies that the percentage steady state deviation
of these time series where zero prior to 2007.
15Prior Posterior
dist. mean std mean std mode 5% 95%
σc normal 1.500 0.375 0.908 0.033 0.876 0.854 0.959
σl normal 2.000 0.750 1.160 0.351 1.046 0.581 1.721
βtpr gamma 0.250 0.100 0.201 0.058 0.186 0.105 0.292
h beta 0.700 0.100 0.799 0.033 0.804 0.748 0.853
S 00 normal 4.000 1.500 5.119 0.754 4.181 3.949 6.370
ιp beta 0.500 0.150 0.232 0.067 0.155 0.128 0.343
ιw beta 0.500 0.150 0.426 0.118 0.648 0.222 0.617
α normal 0.300 0.050 0.210 0.012 0.200 0.189 0.229
ζp beta 0.500 0.100 0.870 0.025 0.861 0.828 0.911
ζw beta 0.500 0.100 0.747 0.046 0.728 0.668 0.817
Φp normal 1.250 0.125 1.331 0.071 1.364 1.218 1.445
ψ beta 0.500 0.150 0.810 0.067 0.841 0.696 0.919
φπ normal 1.500 0.250 1.323 0.207 1.542 0.962 1.610
φy normal 0.125 0.050 0.171 0.022 0.168 0.136 0.207
φdy normal 0.125 0.050 0.181 0.041 0.239 0.111 0.250
ρ beta 0.750 0.100 0.829 0.031 0.850 0.777 0.879
γ normal 0.440 0.050 0.399 0.029 0.414 0.346 0.441
π gamma 0.625 0.100 0.624 0.058 0.688 0.534 0.718
l normal 0.000 2.000 1.246 0.488 0.701 0.416 2.013
κτ gamma 0.300 0.100 0.287 0.081 0.188 0.166 0.425
κ gamma 2.000 4.000 0.495 1.189 0.132 0.107 0.450
LEV normal 3.000 1.000 4.312 0.405 4.433 3.635 4.986
θ beta 0.950 0.050 0.815 0.034 0.747 0.761 0.870
λcbl gamma 3.000 3.000 0.229 0.207 0.086 0.001 0.519
χ beta 0.300 0.100 0.190 0.059 0.133 0.099 0.284
termspread gamma 0.500 0.100 0.594 0.106 0.427 0.418 0.773
ppremium gamma 0.100 0.030 0.083 0.020 0.110 0.049 0.114
spread normal 0.500 0.100 0.428 0.051 0.563 0.340 0.513
Table 1: Estimation results for the baseline model: model parameters
4 The Macroeconomic Context of Quantitative Easing
In this section we present our estimation results and use the estimated benchmark
model to give a general account of the US dynamics from 1998 to 2019. The in-depth
analysis of the quantitative easing measures is deferred to Section 5.
4.1 Priors and parameter estimates
Our priors and posterior estimates are shown in Tables 1 and 2. All prior distributions
are characterized by their mean and standard deviation. The priors for the parameters
that pertain to the real economy are chosen in line with Smets and Wouters (2007,
henceforth SW).16 The upper part of Table 1 – the parameters from σc to l – displays
16 In contrast to Gust et al. (2017), the computational efficiency of our approach allows us to use the
same priors as in SW instead of using tighter prior standard deviations.
16Prior Posterior
dist. mean std mean std mode 5% 95%
ρr beta 0.500 0.200 0.566 0.086 0.525 0.421 0.700
ρg beta 0.500 0.200 0.887 0.081 0.944 0.738 0.965
ρi beta 0.500 0.200 0.734 0.048 0.651 0.656 0.810
ρz beta 0.500 0.200 0.951 0.025 0.954 0.915 0.993
ρp beta 0.500 0.200 0.617 0.098 0.624 0.462 0.777
ρw beta 0.500 0.200 0.735 0.070 0.707 0.625 0.852
ρu beta 0.500 0.200 0.896 0.013 0.906 0.873 0.917
ρlk beta 0.500 0.200 0.934 0.027 0.936 0.893 0.977
ρcbl beta 0.500 0.200 0.762 0.036 0.762 0.704 0.826
rootb,1 beta 0.500 0.200 0.903 0.049 0.786 0.835 0.982
rootb,2 beta 0.500 0.200 0.880 0.054 0.973 0.794 0.966
rootk,1 beta 0.500 0.200 0.901 0.041 0.917 0.833 0.967
rootk,2 beta 0.500 0.200 0.926 0.037 0.902 0.870 0.982
µp beta 0.500 0.200 0.450 0.139 0.293 0.195 0.649
µw beta 0.500 0.200 0.517 0.102 0.485 0.345 0.679
ρgz normal 0.500 0.250 0.570 0.188 0.463 0.325 0.943
σg inv. gamma 0.100 0.250 0.260 0.029 0.235 0.214 0.307
σz inv. gamma 0.100 0.250 0.345 0.035 0.313 0.282 0.395
σr inv. gamma 0.100 0.250 0.147 0.031 0.164 0.096 0.194
σi inv. gamma 0.100 0.250 0.610 0.086 0.766 0.485 0.760
σp inv. gamma 0.100 0.250 0.235 0.070 0.190 0.125 0.341
σw inv. gamma 0.100 0.250 0.691 0.074 0.687 0.570 0.807
σu inv. gamma 0.100 0.250 0.482 0.086 0.454 0.339 0.617
σlk inv. gamma 0.100 0.250 0.272 0.040 0.244 0.208 0.339
σcbl inv. gamma 0.100 0.250 0.956 0.084 0.966 0.816 1.090
σqeb inv. gamma 0.100 0.250 0.197 0.014 0.186 0.175 0.220
σqek inv. gamma 0.100 0.250 0.176 0.015 0.183 0.152 0.198
Table 2: Estimation results for the baseline model: shock processes
the estimates of the parameters inherited from the SW backbone of our model. We
compare the posterior estimates for these parameters, among others, to those of Boehl
and Strobel (2020, henceforth BS), who estimate the SW model (and extensions) using
the same methodology and sample.17 This comparison seems to be more obvious than
the comparison with the results of Kulish et al. (2017), who use a different methodology
on a longer data sample. The bottom part of Table 1 contains the new parameters for the
financial sector, which are central for the transmission of the large-scale asset purchases.
We discuss these parameters mainly in Section 6.1.
Our estimates of the parameters inherited from SW are much aligned with those from
BS. The finding that intertemporal elasticity of substitution, σc , is close to unity (and
well below the prior mean) is widely shared in the literature (see e.g. Smets and Wouters,
2007; Gelain and Ilbas, 2017; Kulish et al., 2017; Boehl and Strobel, 2020). The posterior
mean of βtpr , the time preference rate, is close to the estimates by SW, BS, and others.
17 For convenience, their posterior estimates of the Smets and Wouters (2007) model for the sample
until 2020 are repeated in the Online Appendix.
17Similarly, BS also find a very high degree of habit formation in their re-estimation of
the SW model on the crisis sample (0.833 in BS vs. 0.799 here) as well as substantial
investment adjustment costs (S 00 = 5.287 in BS vs 5.119 here). Both the price and wage
Phillips Curves are estimated to be quite flat, with an estimated price Calvo parameter
of ζp = 0.87 in line with BS and Kulish et al. (2017). Similarly, values for wage and
price indexation ιp and ιw , as well as the the fixed cost parameter, Φp are in a standard
range, albeit notably higher than e.g. SW due to the more recent sample. The estimated
feedback coefficients of the policy rule as well as the interest rate smoothing parameter,
ρ, match the estimates in BS.
We follow Kulish et al. (2017) and BS in the choice of our prior for the common
trend γ and opt for a tighter prior of this parameter than in SW. Arguably, the economy
deviated strongly and persistently from its steady state during the Great Recession. In
order to dampen the data’s pull of the parameter down to the sample mean, we therefore
prefer the tight prior as well. This circumvents unrealistically low estimates of the trend
growth rate which would imply implausibly high levels of consumption and output after
2008. Our estimates of l and mean inflation, π are in line with BS.18 The impulse response
functions in Figure 6 in Section 5 illustrates that our choice of priors is quite agnostic
to the effects of QE, while slightly biased towards the conventional view in which asset
purchases induce a similar stimulus as regular interest rate shocks.19
For the non-SW part of our model, we estimate the steady state leverage of financial
intermediaries, LEV , their survival rate θ, the sensitivity of the incentive constraint to
liquidity injections λCBL , and the feedback coefficient for government debt in the tax rule,
κτ . Additionally, we estimate the AR(2) shock processes for the QE measures, which are
identified independently of the model choice. For the prior of LEV we choose a normal
distribution centered around 3, and with a standard deviation of 1. Intuitively, a high
leverage LEV implies a high initial vulnerability of the financial system to shocks that
affect its asset prices or funding costs. Conversely, it also implies that the small steady
state net worth that is associated with a high leverage will be replenished (reduced)
faster by increased (compressed) excess returns on banks’ assets such that the financial
system reverses more quickly to its original state. Depending on the nature of the shock
this can come either with an amplification or an attenuation of the effects on the real
economy. As we are not aware of prior estimates of this parameter in the context of
a structural model, we opt for choosing a rather wide prior.20 For θ, we choose a beta
distribution for the prior with a mean of 0.95, corresponding to an expected time horizon
of the bankers of 5 years. This value is only slightly below the value of 0.975 in Gertler
and Karadi (2011), but the standard deviation of 0.05 allows for significant departures
from the prior mean. Generally, a higher θ is associated with a higher stochastic discount
factor of financial intermediaries and therefore shapes the persistence of the effects of QE
18 Note that π not only is the constant in the measurement equation for inflation, but also the Fed’s
inflation target and the long-run trend in inflation. We, however, refrain from setting the prior value to
2% p.a. because we assume that the original SW prior better reflects the long-run trend while still being
flexible enough to allow for lower estimates if necessary. Moreover, note that the Fed targets headline
PCE inflation while, in the estimation, we use GDP deflator consistent with the one-good economy
structure of our model.
19 Additional impulse responses are provided in the Online Appendix.
20 Villa (2016) estimates a version of the model by Gertler and Karadi (2011) on US data, but calibrates
LEV and θ to fixed values.
18You can also read