Preventing plastic waste in Europe - EEA Report No 02/2019 - European Environment Agency
←
→
Page content transcription
If your browser does not render page correctly, please read the page content below
EEA Report     No 02/2019

Preventing plastic waste in Europe

                                   ISSN 1977‑8449

                      1994-2019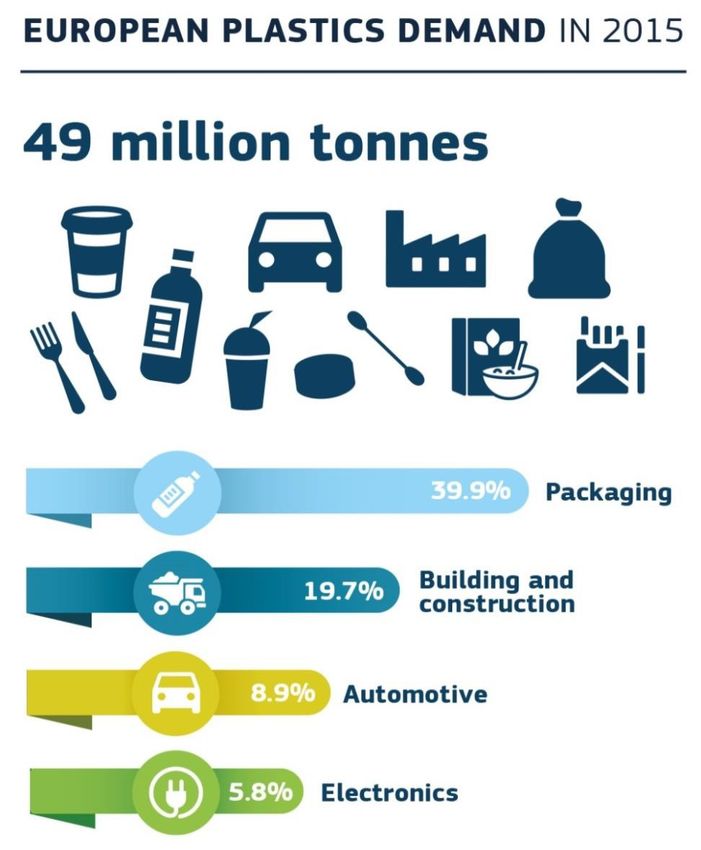
EEA Report   No 02/2019

Preventing plastic waste in Europe

                      1994-2019
Cover photo: © Allen Giuseppe Amore, Picture2050/EEA Legal notice The contents of this publication do not necessarily reflect the official opinions of the European Commission or other institutions of the European Union. Neither the European Environment Agency nor any person or company acting on behalf of the Agency is responsible for the use that may be made of the information contained in this report. Copyright notice © European Environment Agency, 2019 Reproduction is authorised provided the source is acknowledged. More information on the European Union is available on the Internet (http://europa.eu). Luxembourg: Publications Office of the European Union, 2019 ISBN 978‑92‑9480‑066‑4 ISSN 1977‑8449 doi:10.2800/812531 REG.NO. DK- 000244 European Environment Agency Kongens Nytorv 6 1050 Copenhagen K Denmark Tel.: +45 33 36 71 00 Web: eea.europa.eu Enquiries: eea.europa.eu/enquiries
Contents

Contents

Acknowledgements..................................................................................................................... 4

Key messages............................................................................................................................... 5

Executive summary..................................................................................................................... 6

1 Waste prevention and plastics............................................................................................. 8
     1.1 Environmental issues and plastics......................................................................................... 9
     1.2 Objective.................................................................................................................................... 9
     1.3 Review methodology.............................................................................................................10
     1.4 Policy background..................................................................................................................10
     1.5 Definitions...............................................................................................................................11

2 The plastics life cycle........................................................................................................... 12
     2.1 The plastics value chain.........................................................................................................12
     2.2 Plastic consumption in Europe and the world....................................................................13
     2.3 Plastic waste management in Europe.................................................................................14
     2.4 Plastic waste decoupling.......................................................................................................15

3 Plastic waste prevention in the waste prevention programmes of EEA countries                                                                      18
     3.1 Waste prevention programmes and plastic waste............................................................18
     3.2 Policy instruments and measures........................................................................................19
     3.3 Good practice examples........................................................................................................21
     3.4 Targets.....................................................................................................................................22
     3.5 Indicators.................................................................................................................................24

4 Key findings, policy options and future prospects........................................................... 28
     4.1 Key findings.............................................................................................................................28
     4.2 Conclusions and policy options............................................................................................28
     4.3 Future prospects....................................................................................................................31

Abbreviations and acronyms................................................................................................... 32
References.................................................................................................................................. 33
Annex 1....................................................................................................................................... 35
Annex 2....................................................................................................................................... 38
Annex 3....................................................................................................................................... 39
Annex 4....................................................................................................................................... 41

                                                                                                 Preventing plastic waste in Europe                        3
Acknowledgements
Acknowledgements
This report was prepared by the European The report has benefited greatly from the comments
Environment Agency (EEA) and the European Topic and feedback that were received from EEA member
Centre on Waste and Materials in a Green Economy countries, cooperating countries and other partners
(ETC/WMGE) in cooperation with the EEA and the during a survey conducted in 2018 and a final
European Environment Information and Observation consultation process that took place in early 2019.
Network (Eionet) countries.
Lead authors This is the fifth and last EEA report in a series of
annual reviews of waste prevention programmes
Henning Wilts (ETC/WMGE), in Europe, as stipulated in the European Union
Ioannis Bakas (EEA) (EU) Waste Framework Directive (EU, 2008). The
Directive was revised in 2018 and now frames
a different context for the EEA's work on waste
Contributions prevention, which will be reflected in a new series
of biannual waste prevention reports in the
Dirk Nelen, Kévin Le Blevennec, Ulrike Meinel, Bettina future. This year's review focuses on plastic waste
Bahn‑Walkowiak, Mona Arnold (all ETC/WMGE) prevention and covers 37 national and regional
waste prevention programmes that had been
Lars Fogh Mortensen, Almut Reichel, adopted by the end of 2018.
Daniel Montalvo (EEA)
4 Preventing plastic waste in EuropeKey messages
Key messages
The use of plastics is increasingly • Within the mapped measures, 25 are regulatory
recognised as a significant global and refer mainly to measures banning
environmental issue: micro‑plastics, micro‑beads and some types of
single‑use plastics.
• Demand for plastics is increasing rapidly worldwide.
In 2017, the demand for plastics in the 28 EU • The review of the measures taken by countries
Member States stood at almost 52 million tonnes, up revealed that 37 of the 173 measures identified
from 46 million tonnes in 2010. Global production of are market based. The majority of the
plastics reached 348 million tonnes in 2017, an extra market‑based instruments referred to fees for
13 million tonnes compared with the year before. plastic carrier bags.
• Plastic production has harmful impacts on the • A total of 30 voluntary agreements on plastic
environment and climate. Estimates put the waste prevention have been initiated in different
contribution of plastic production and plastic waste forms with different sets of stakeholders across
incineration globally at 400 million tonnes of the countries reviewed. They often include
carbon dioxide equivalent (CO2e) annually. specific targets that are monitored by internal or
external parties.
• Almost one fifth of the global plastics production of
335 million tonnes was produced in Europe. • Only nine countries have explicit waste
prevention targets included in their prevention
• Plastics are mainly used in packaging and in the programmes. Clear and common targets are
building and construction sectors. still lacking for most product groups and thus
the levels of activity and ambition clearly differ
• In 2016, 31.1 % of plastic waste was recovered in among the countries.
Europe — but only 63 % of the recovery took place
in Europe — and only about 6 % of the current • The good practice examples include both regulatory
European demand for plastics was covered by initiatives such as a ban on certain plastic
domestic recycled or secondary plastics. products and softer measures such as stakeholder
agreements to reduce the consumption of plastic
Plastic waste prevention can offer products (mainly packaging), and training and
solutions in reducing environmental capacity building. Unfortunately, there are very few
pressures from plastic consumption. cases in which the initiatives adopted have been
Countries are responding by taking waste properly evaluated.
prevention measures:
The road ahead involves intensifying
• Plastic waste is declared a priority waste stream by countries' waste prevention efforts:
nearly half of the countries investigated.
• Prevention of the most impactful plastic types,
• Of the 173 waste prevention measures identified, plastic products that are designed to be used once
105 cover the production phase of plastic products and for a very short time (the so‑called 'single‑use
and 69 cover the consumption phase. plastics') and non‑recyclable plastic products should
be prioritised.
• With the exception of national legislative
requirements, such as the levy on plastic carrier • Although the example of the fee placed on plastic
bags, the majority of the identified prevention carrier bags in many countries has borne impressive
measures refer to voluntary agreements and results, countries should be encouraged to
informative instruments. diversify their implemented measures.
Preventing plastic waste in Europe 5Executive summary
Executive summary
Waste prevention is at the centre of EU waste recycling of this material takes place outside Europe.
legislation as it delivers the most effective results in In 2016, only 6 % of European plastic production was
dealing with environmental issues around waste. EU based on recycled material.
or national strategies and legislation around waste,
therefore, routinely place waste prevention at the top A circular economy refers to an economic model
of their objectives. in which the value of the products and materials is
kept as high as possible and for as long as possible.
Waste prevention can be implemented in any waste This principle can be implemented by considering
stream, but it needs to be customised to reflect each the design, manufacturing, consumption and waste
stream's particularities. This report focuses on plastic management stages of the products' life cycles.
wastes, as there is potential for substantial mitigation Under the circular economy context, some of the
of the environmental issues raised by increased plastic plastics' inherent characteristics are in conflict with this
consumption through the use of waste prevention main principle (see Figure 1.1).
instruments and mechanisms.
Already, managing plastic waste generation presents
multiple challenges, and this will increase in the future.
The scale of plastic production and plastic As waste prevention is the preferable option in the
waste generation waste hierarchy, prevention can play a fundamental
role in curbing plastic waste generation. Waste
Demand for plastic products is increasing worldwide prevention measures are suitable for addressing
and in Europe in particular. In 2017, total demand issues around increasing consumption, reducing
in Europe reached 52 million tonnes, representing recirculation of hazardous substances present in plastic
around 15 % of global demand. The use of plastic in products and difficulties faced by waste management
products keeps increasing because of its low price and in recovering a substantial amount of plastic resources.
the useful properties of the various plastic types, which In this report, we aim to map waste prevention
make them effective in a wide variety of applications. initiatives in Europe targeting plastics, with a view to
Packaging is the sector that uses most of the plastic understanding:
produced, followed by the construction, automotive
and electronics sectors. 1. What is their main focus?
Different applications of plastics have different 2. To which policy structures (targets, indicators,
consequences for waste management. Plastics become measures) do they belong?
waste almost instantly if used for packaging but do
so only after up to 50 years if used in construction. 3. What are the best practice examples in the area?
Therefore, different approaches for implementing
waste prevention are needed for the different plastic 4. What potential for improvement can be identified
products and types. For example, prevention measures on the basis of this analysis?
targeting short‑lived plastics can be more effective
in both reducing waste generation and alleviating Looking into data on plastic packaging waste
environmental impacts from their consumption. generation helps us understand the effectiveness of
waste prevention on plastic packaging to date. The
The increasing consumption of plastics is reflected effectiveness is primarily assessed by comparing rates
in plastic waste generation, which is also increasing. of increase for waste generation and for the economy
However, recovery of plastic waste is also on the rise, as a whole. Absolute decoupling indicates negative
with plastic waste recycling reaching 31.1 % in 2016. A rates for waste generation and positive rates for gross
significant share of plastic waste generated in Europe domestic product (GDP). Relative decoupling indicates
is traded to other regions of the world and a lot of the lower rates for waste generation comparedwith GDP.
6 Preventing plastic waste in EuropeExecutive summary
Data from 2007 to 2016 for the 28 EU Member States Specific and concrete prevention targets addressing
show a recent relative decoupling of plastic packaging plastic waste are not widespread in Europe. Only
waste generation from economic growth. However, nine countries have explicit targets for plastic waste
there are great differences in the development of prevention. However, most countries have included
plastic packaging waste generation per capita in indicators or monitoring schemes to assess progress
the individual countries over the same time period. in their waste prevention programmes. These
Of the 28 EU Member States, nine managed to schemes are in many cases qualitative, but indicators
decouple (absolutely or relatively) plastic packaging based on specific data flows have also been adopted.
waste generation from economic growth. However,
the economic level, structure and development of
the countries plays an important role in the level Best practice and information sharing
of waste generation, making it difficult to attribute
changes in waste quantities to waste prevention This report has identified a range of good practice
measures alone. examples that go beyond the average prevention
status in Europe. The examples include both
regulatory initiatives such as bans on certain plastic
Scope and methodology products and softer measures such as stakeholder
agreements to reduce the consumption of plastic
Based on a review of available waste prevention products (mainly packaging), and training and
programmes, supplemented by a direct country capacity building. Unfortunately, there are very
consultation, 173 plastic waste prevention measures few cases in which the initiatives adopted have
were identified as implemented, or planned for been properly evaluated; therefore, most of
immediate implementation, by European countries. the good practice examples identified lack the
At the same time, the analysis was supported by evaluation element that could help determine
identifying good practice examples. their effectiveness.
State of play of waste prevention in Europe The road ahead
Around 60 % of the measures identified address It is very likely that the plastic consumption and waste
plastic production, while the rest refer to consumption issues and challenges will remain and intensify in the
patterns of plastic products. The vast majority of future as plastic products become an even more vital
measures aim to reduce the amount of plastic waste, part of our consumption habits. It is therefore important
which reveals an imbalance compared with other to employ effective waste prevention measures so that
types of waste prevention such as eco‑design and some of the environmental and climate impacts of these
measures to reduce the presence of hazardous developments are mitigated. Countries need to intensify
substances in discarded products. The majority of their efforts and design more precise and concrete
policy instruments employed by countries are soft measures by giving priority to the most impactful plastic
measures such as informative/public communication types or plastic products that are designed to be short
measures (42 % of all measures identified) and lived and non‑recyclable. More diversity is needed
voluntary agreements. Market‑based instruments in the measures to address various aspects of waste
are also a substantial group of measures and most prevention, beyond waste reduction, such as better
of them refer to legal obligations to reduce the design requirements, increased durability or reducing
consumption of plastic carrier bags. the content of hazardous substances.
Preventing plastic waste in Europe 7Waste prevention and plastics
1 Waste prevention and plastics
Waste prevention is at the centre of EU waste waste prevention at the top of their objectives.
legislation, as it delivers the most effective results Waste prevention can be implemented in any waste
in dealing with environmental issues around waste. stream, but it needs to be customised to reflect each
Prevention measures aim either to reduce the stream's particularities.
amount of waste generated by our economies
or to minimise the environmental impacts from In recent years, various elements of EU environmental
waste management. EU or national strategies and legislation have focused on plastics. Plastics are
legislation around waste, therefore, routinely place addressed by various strategies, action plans and
Figure 1.1 Environmental issues arising along the plastics value chain
Most plastics are designed Plastics are largely used
to be used once only for short-lived products
(limited recyclability)
PRODUCTION
AND DISTRIBUTION
TE, REFUR
IBU BI
STR S
ECO-DESIGN I
H,
D
RE
RE
, REPAIR,
MAN FACTUR
U
The share of recycled
B i ol o g
Technic
CONSUMPTION
USE
plastics in new products AND STOCK
i c al
RE
is very low
al m
Leakage to the environment,
E
ma
a
high persistence,
ter
ter
ial
ial
hazardous substances
s
s
WASTE
MATERIALS
EMISSIONS
Plastics are mainly
based on fossil fuels Very low recycling rates,
downcycling prevails
Minimise
INCINERATION LANDFILL
EXTRACTION AND IMPORT OF NATURAL
RESOURCES, INCLUDING ENERGY CARRIERS
Source: EEA.
8 Preventing plastic waste in EuropeWaste prevention and plastics
dedicated directives, spanning from the circular Therefore, prevention of plastic waste would, by
economy package through the European strategy for reducing demand for plastic products, subsequently
plastics in a circular economy to the Single Use Plastics reduce CO2 emissions.
Directive (EC, 2018b).
Waste prevention and corresponding measures
The increased focus on plastics can be explained by address the majority of issues around the
the identification of various environmental issues and consumption of plastic products. As such, plastic
challenges associated with plastic consumption and waste prevention is the focus of this report. The
plastic waste generation. As waste prevention is the main goal of the report is to map and analyse the
preferred option for dealing with plastic waste and countries' efforts to address plastic waste generation
the one yielding the highest environmental benefits, through waste prevention measures.
it is interesting to examine the specific measures
countries are taking to tackle plastic waste generation The scope of the report includes all plastic types,
and the effects, if any, on plastic waste quantities and except biodegradable plastics, although, due to
on the environment. information and data limitations, the report focuses
on plastic packaging. The properties, consumption
patterns, and subsequent waste management
1.1 Environmental issues and plastics systems and technologies are very different for
biodegradable plastics and are outside the scope
The current plastics value chains have some inherent of this report. The scope of the report addresses all
characteristics that are not compatible with the main aspects of waste prevention, namely both qualitative
objectives of the EU waste prevention and circular and quantitative prevention.
economy initiatives. Figure 1.1 shows a schematic
representation of products' life cycle stages from a
circular economy point of view. The figure also shows 1.2 Objective
the challenges that plastics pose to increasing product
circularity: Waste prevention measures are ideal for addressing
many of the issues illustrated in Figure 1.1. Initiatives
• Many single‑use products, with very short life spans, such as increased durability or reduction of packaging
are made of plastic and in many cases without have the potential to significantly curb the increasing
considering their reuse potential. demand for plastic products. Better design of such
products can increase recyclability and reduce the
• Plastics are used, in very significant quantities, for presence of hazardous substances in plastic waste. It is
short‑lived products (mainly packaging). therefore important to look at the actions countries are
taking, or planning to take, to prevent plastic waste and
• Plastic products may contain hazardous substances identify areas where increased efforts are required.
that may be recirculated in the economy
through recycling. More specifically, the main objective of this report is to
identify and map countries' policy efforts in the area
• Recycling rates are low. of waste prevention that targets plastic wastes. This
mapping aims to analyse efforts at European level to
Demand for plastics is increasing worldwide due to answer the following questions:
the materials' very useful properties. In 2017, the
demand for plastics in the 28 EU Member States 1. What is the main focus of plastic waste prevention
(EU‑28) stood at almost 52 million tonnes, up from initiatives across the countries?
46 million tonnes in 2010, following a stable increasing
trend (Plastics Europe, 2018). Global production of 2. What are the principal policy structures around the
plastics reached 348 million tonnes in 2017, an extra issue (targets, indicators, measures)?
13 million tonnes compared with the previous year
(Plastics Europe, 2018). 3. What are the best practice examples in this area?
Production of plastics is also environmentally costly. 4. Which areas of improvement can increase the
Estimates for 2012 put the contribution of plastic effectiveness and efficiency of implementing plastic
production and plastic waste incineration globally waste prevention?
at 400 million tonnes of carbon dioxide equivalent
(CO2e) (EC, 2018a), which is the equivalent of the Through this process, the report attempts to highlight
annual emissions of Poland in the same year. good practice in the sense of concrete initiatives
Preventing plastic waste in Europe 9Waste prevention and plastics
Figure 1.2 The EU waste hierarchy
that may be applicable to other European countries.
The report also offers solid recommendations for
improving and intensifying efforts to prevent plastic Product Prevention
waste. The recommendations build upon existing (non-waste)
Waste
practice, respect the current and planned policy Preparing for re-use
context and are forward looking.
Recycling
Recovery
1.3 Review methodology
Disposal
In order to achieve the main objectives of the report,
as outlined above, we will investigate how preventing
plastic waste is addressed in the waste prevention
Source: EU (2008).
programmes and in other programmes, strategies and
initiatives, and provide data on the status of, and trends
in, recent measures and initiatives in Europe. the circular economy, and has especially highlighted
the field of plastic waste prevention as a specific
In order to obtain the information, as a first step, priority (EU, 2018).
the available national waste prevention programmes
were screened for policy approaches and concrete The Directive provides flexibility regarding the nature
initiatives to reduce plastic use and plastic waste. of waste prevention implementation. This flexibility is
Given the recent prominence of the topic, however, reflected in countries' waste prevention programmes
it was decided to give countries the opportunity to and requires that objectives and qualitative or
flag new activities that may not have been captured quantitative benchmarks are set. The EEA will need to
in the waste prevention programmes as published, or publish periodic reports on waste prevention, according
that have evolved since. Therefore, as a second step, to Article 30 of the amended Waste Framework Directive,
an additional survey was conducted, to verify and every 2 years. These reports will contain 'a review of the
augment the information drawn from the national progress made in the completion and implementation of
waste prevention programmes and to highlight good waste prevention programmes, including an assessment
practice in preventing plastic waste. The survey was of the evolution as regards the prevention of waste
conducted by the European Topic Centre on Waste generation for each Member State and for the Union
and Materials in a Green Economy (ETC/WMGE) in as a whole, and as regards the decoupling of waste
cooperation with the EEA and addressed all European generation from economic growth and the transition
Environment Information and Observation Network towards a circular economy'.
(Eionet) countries.
In April 2015, Directive 94/62/EC on packaging and
The report's geographical scope covers all EU Member packaging waste, was amended by Directive 2015/720
States (except Cyprus, which has not adopted a waste (EU, 2015) on lightweight plastic carrier bags. The
prevention programme), Iceland, Norway, Switzerland amended Article 4 urges Member States to 'take
(which are also subject to the obligations under the measures to achieve a sustained reduction in the
Waste Framework Directive) and Turkey. The review consumption of lightweight plastic carrier bags on their
also covers the waste prevention plans available for territory'. Such measures should ensure (1) an annual
these countries and their regions, as national waste consumption of a maximum of 90 lightweight plastic
prevention programmes may not exist (e.g. Belgium carrier bags per person by 31 December 2019 and
has three regional waste prevention programmes and 40 per person by 31 December 2025, and/or (2) the
the United Kingdom has four but no central plans). levying of charges on lightweight plastic carrier bags at
the point of sale of goods or products before 2019. In
addition, the Directive establishes reporting obligations
1.4 Policy background on the annual consumption of lightweight plastic carrier
bags.
The amended Waste Framework Directive (EU)
2018/851 reiterated the importance of waste Besides the prevention perspective in waste legislation,
prevention by confirming its place as a top priority in 2018 the European Commission published its strategy
for waste legislation, according to the so‑called waste for plastics in a circular economy. In the strategy, plastic
hierarchy (Figure 1.2). In the revised Directive, the waste prevention is placed in the context of a circular
European Commission has confirmed the strategic economy and it is supported with specific measures
importance of waste prevention, also in the context of and objectives targeting various aspects of plastic waste
10 Preventing plastic waste in EuropeWaste prevention and plastics
generation, such as reducing consumption of plastic 1.5 Definitions
bags and reducing marine litter. Overall, the main
objective of decoupling waste generation from economic The Waste Framework Directive (EU, 2008) defines
growth is underlined. waste prevention as 'measures taken before a
substance, material or product has become waste
Plastic packaging is addressed in the strategy by that reduce:
exploring ideas related to extended producer
responsibility schemes, considerations about a) the quantity of waste, including through the reuse
overpackaging, green public procurement, awareness of products or the extension of the life span of
campaigns and financial instruments that can help products;
reduce packaging or replace single‑use with reusable
packaging. Another important aspect of the strategy, b) the adverse impacts of the generated waste on
related to prevention, is promoting reuse. The the environment and human health; or
European Commission will take action so that all plastic
packaging is reusable or recyclable in a cost‑effective c) the content of harmful substances in materials
manner by 2030. and products.'
The Single Use Plastics Directive contains extensive Waste prevention is thus applicable to products
elements of waste prevention. EU Member States that are still in use, or that will be produced
are encouraged to implement waste prevention in the foreseeable future. Prevention relates
measures, especially for single‑use plastic items for only indirectly to waste management by (1)
which a more sustainable product alternative does reducing the quantity of waste that would have
not yet exist. The Directive suggests appropriate to be managed in the future, often referred to as
waste prevention measures to be taken against quantitative prevention, or (2) facilitating future
single‑use plastic products such as providing waste management operations by avoiding the
information to consumers, market‑based instruments presence of undesired substances, the so‑called
and product design requirements. qualitative prevention.
The impacts of leaked plastic waste, especially into the For the scope of this assessment, plastic is defined
marine environment, have also been the key drivers for according to the Single Use Plastics Directive
the Helcom regional action plan for marine litter in the (EC, 2018b), stating that ' 'plastic' means a material
Baltic Sea (Helcom, 2015), the G20 action plan on marine consisting of a polymer within the meaning of
littering (G20, 2017) or United Nations (UN) initiatives Article 3(5) of Regulation EC No. 1907/2006, to
and resolutions on marine litter, single‑use plastics and which additives or other substances may have
fighting plastic pollution (UNEP, 2018). Industry and been added, and which can function as a main
private initiatives (e.g. by the Ellen MacArthur Foundation structural component of final products, with the
or the International Solid Waste Association) have also exception of natural polymers that have not been
initiated a broad range of activities that, inter alia, aim to chemically modified.
reduce plastic waste generation.
Preventing plastic waste in Europe 11The plastics life cycle
2 The plastics life cycle
2.1 The plastics value chain heated and formed, they cannot be re‑melted and
reformed, but they may be chemically recycled back
Successful plastic waste prevention and the design of to feedstock or used as a fuel in cement kilns.
appropriate policy measures for this purpose require
an in‑depth understanding of the complex plastics Of the total global production of plastics of
value chain. It is important to note that, although 335 million tonnes, almost one fifth was produced
plastics are usually referred to as a single, specific in Europe. Plastics are produced by a relatively small
material, they are not. Instead, plastics should rather number of globally active and large petrochemical
be seen as a big family of chemicals, composed of a companies. In the next stage of the value chain, the
great variety of materials designed to meet the very plastics produced are supplied to plastic converters,
different needs of thousands of end applications. which are smaller in size and much greater in number
Flexible material design has resulted in a huge series than plastics producers. They convert the plastic resins
of plastics and combinations of different plastics and into plastic products. This step might involve using a
other materials, such as fibres, each of them with highly series of additives that allow converters to achieve the
specific, customised functionalities. required user specifications.
Two main categories of polymers can be clearly The vast majority of plastics are composed of polymers
distinguished: thermoplastics and thermosets: of carbon and hydrogen, either alone or with oxygen,
nitrogen, chlorine, fluorine or sulphur in the backbone
• Thermoplastics are defined as polymers that (Professional Plastics, 2018). Plastics contain a main
can be melted when heated and hardened when polymer and a bespoke load of additives to improve
cooled. These characteristics are reversible (it can specific properties (e.g. hardness, softness, resistance
be reheated, reshaped and hardened repeatedly). to ultraviolet light, flame formation resistance) or their
This feature allows the mechanical recycling of behaviour during manufacturing (lubricants, catalysts,
thermoplastics, converting plastic recyclate into new stabilisers, solvents, polymerisation aids and recycling
plastic products. aids). The content of additives in plastics varies widely,
from less than 1 % in polyethylene terephthalate (PET)
• Thermosets, in contrast, are polymers that undergo bottles to up to 50‑60 % in polyvinyl chloride (PVC),
a chemical change when heated. After they are often striking a balance between technical properties
Box 2.1 A cross‑value chain collaboration example
An example of the intended cross‑value chain collaboration is provided by the 'New Plastics Economy' initiative, launched
in 2016. By the end of 2018, more than 250 organisation have signed for a global commitment to:
-- Design out problematic and unnecessary plastics.
-- Promote new business models that transform the way plastics are used.
-- Make sure that all plastics are safely re‑used, recycled or composted into new packaging and products.
The report 'The New Plastics Economy — Rethinking the Future of Plastics' (Ellen MacArthur Foundation, 2017) states that by
fostering an 'explicitly systemic and collaborative approach, the New Plastics Economy aims to overcome the limitations
of today's incremental improvements and fragmented initiatives, to create a shared sense of direction, to spark a wave
of innovation and to move the plastics value chain into a positive spiral of value capture, stronger economics, and better
environmental outcomes.'
The global Plastics Pact that fosters collaboration across value chains is supported by national Plastics Pacts such as the UK
Plastic Pact and the French Pacte Nationale sur les emballages plastiques.
12 Preventing plastic waste in EuropeThe plastics life cycle
and economics, as some additives are considerably which had already become waste (Geyer et al., 2017).
more expensive than the main polymers, while others Of that waste total, only 9 % was recycled, 12 % was
are inexpensive (e.g. inorganic fillers such as limestone incinerated and 79 % accumulated in landfills or the
or talc). natural environment. If current trends continue, roughly
12 billion tonnes of plastic waste will be in landfills or
Considering this complexity of the plastics value the natural environment by 2050. The durability of many
chain, the 2018 European strategy for plastics in a plastics is one of the key strengths of this material;
circular economy highlights the relevance of increased however, as a consequence, most of this plastic waste is
cross‑value chain collaboration, due to the many not expected to biodegrade significantly and will remain
interlinkages of the value chain actors, to promote in the environment for years to come. Global production
plastic waste prevention throughout the entire plastics of plastics increased from 2 million tonnes in 1950 to
life cycle. Global consumer goods companies, retailers, over 400 million tonnes in 2015, outgrowing most other
polymer producers, plastics manufacturers, consumers, human‑made materials. Of the total amount of plastics
governments, cities and businesses involved in plastics produced from 1950 to 2015, roughly half was produced
collection, sorting and reprocessing are the main actors in the last 13 years and will become plastic waste in
and stakeholders in the plastics value chain. the near future. Against this background, Figure 2.1
highlights the urgent need for effective prevention of
plastic waste.
2.2 Plastic consumption in Europe and
the world Taking into account that most plastic value chains are
based on fossil fuel resources such as natural gas, oil
Waste prevention can be achieved through measures or coal, it is estimated that about 5 % of all the oil and
that affect products' life cycles before these become gas consumed in Europe is used in the production of
waste. It is therefore useful to have an overview of the plastic materials (Plastics Europe, 2018). About half of
consumption of plastic products in Europe so that the the fossil fuel resources are needed to provide energy
challenge of applying waste prevention to plastics is to the production process; the other half are used as
properly assessed. feedstock (World Economic Forum, 2016). Most plastics
are produced from natural gas, feedstocks derived from
Globally, humans had produced 8.3 billion tonnes natural gas processing and feedstocks derived from
of plastics by the year 2015, 6.3 billion tonnes of crude oil refining.
Figure 2.1 Cumulative global plastic waste generation and disposal
Million metric tons
25 000
20 000
15 000
10 000
5 000
0
1950 1960 1970 1980 1990 2000 2010 2020 2030 2040 2050
Primary waste generated All waste discarded All waste incinerated All waste recycled
Source: Adapted from Geyer et al. (2017).
Preventing plastic waste in Europe 13The plastics life cycle
Figure 2.2 Demand for plastic products broken
plastic demand but for as much as 60 % of the total
down to industrial sectors in 2015
(28 EU Member States, Norway and plastic waste generation.
Switzerland)
These differences in life‑time need to be taken
into account and will require very different
waste prevention strategies to be prepared and
implemented. Prevention targeting packaging waste
can be more effective and can yield immediate results,
while tackling significant and short‑term environmental
impacts. Moreover, the potential for preventing
packaging waste is much higher than, for example,
construction materials that perform a necessary
function in a building.
2.3 Plastic waste management in Europe
A part of the waste prevention definition refers to
actions taken on products' life cycles that reduce
the environmental impacts arising from their waste
management (e.g. eco‑design, design for recycling).
There is indeed considerable potential for plastic waste
management systems in Europe to improve and to
reduce the environmental impacts stemming from
them by moving up the waste hierarchy from disposal
to recycling and preparing for re‑use.
The European strategy for plastics in a circular
economy (EC, 2018a) notes that plastic recycling has
Source: EC (2018a). not kept pace with the increasing global production
of plastics. Currently, in Europe, only 30 % of plastic
Figure 2.2 shows the share of the European industrial waste is collected for recycling. In addition, most
sectors that demand plastic products, highlighting that, recycling operations take place outside Europe, where
within Europe, plastics are mainly used in packaging environmental practices and standards may differ.
and in the building and construction sectors. One of The plastic waste that is collected but not recycled
the main differences between these applications for is landfilled or incinerated, with the consequent
plastics is the life‑time before the product is discarded irrecoverable loss of non‑renewable resources
as waste. It can vary from hours for plastic packaging and of material value. Both plastic production and
— for example a single‑use plastic shopping bag — to plastic waste incineration contribute significantly to
more than 50 years for plastic products in building and the generation of greenhouse gas emissions. The
construction, such as PVC ceiling tiles (Baitz et al., 2004). European strategy highlights the growing consumption
This difference in the life span of products leads to a of 'single‑use' plastics, including packaging, that are
situation where packaging accounts for 40 % of the especially prone to being littered and diluted into the
Box 2.2 Plastic waste prevention in the construction sector
Case study: Reuse in renovation of office buildings in Sweden.
Approximately EUR 2.8 billion is invested annually in renovating offices and shops in Sweden. The turnover of interior
materials and products is high, as is the potential for reuse. A Swedish study (Andersson et al., 2018) concluded that the
best potential for reuse was for office furniture and glass panels. The reuse of an office chair leads to the avoidance of, on
average, 8 kg of plastic waste and 6 kg of metal. An adjustable office desk contains on average 2 kg of plastic and 20 kg of
metal. In windows, the plastic content is around 5 %. The waste prevention potential of the renovation of a 2 000 m2 office
with 170 staff is 40 kt (combined with avoiding 69 tonnes of CO2 emissions and monetary savings of EUR 0.2 million). On a
national level, this translates into a 25 kt waste prevention potential, combined with a monetary saving of EUR 126 million
and 43 kt CO2 in Sweden alone.
14 Preventing plastic waste in EuropeThe plastics life cycle
environment, generating significant economic and waste is the single most important plastic waste
environmental burdens. Moreover, all plastics that are stream and it is used here as a proxy for analysis of
not captured by an appropriate waste management the plastic waste stream. Looking at developments
system will degrade into micro‑plastics that finally end in packaging waste, Figure 2.3 shows the increasing
up in marine or terrestrial ecosystems, including the amount of plastic waste that has to be collected and
human food chain (Gesamp, 2015). treated. Compared with 2007, the average waste
generation per capita in the EU‑28 in 2016 increased
In Europe, 27.1 million tonnes of plastic waste were from 30.1 kg to 31.9 kg — an increase of more than
collected for treatment in 2016 through official 6 %. Important drivers of packaging waste have been
schemes in the 28 EU Member States (EU‑28), together an increasing share of convenience food and food to
with Norway and Switzerland. According to Plastics go, smaller production units in the food sector and
Europe, for the first time, more plastic waste was the booming and especially waste intensive online
recycled than landfilled. A total of 31.1 % of plastic shopping sector (UBA, 2018, p. 43).
waste was recovered — but only 63 % of the plastics
recovery took place in Europe (the rest was exported
for recycling outside Europe) and only about 6 % of the 2.4 Plastic waste decoupling
current European demand for plastics was covered by
recycled or secondary plastics (Plastics Europe, 2018). As outlined previously, the EEA is required to
specifically analyse the decoupling of waste
Data on generation of plastic waste are not available generation from economic growth. Against this
at European level. However, due to the EU Member background, waste intensity — the link between
States' obligations towards the Packaging and waste generation and gross domestic product (GDP)
Packaging Waste Directive, data on plastic packaging — becomes a key indicator, as depicted in Figure 2.3,
waste are available and credible. Plastic packaging again taking the example of packaging
Figure 2.3 Plastic packaging waste generation (kg per capita) and plastic waste generation intensity
(kg per capita and gross domestic product), EU‑28 (1)
%
108
106.05
106
103.89
104 102.90
101.39 101.37 102.32
101.22
100.40
102 100.47 100.42
100 100.83
99.53
99.44
100 98.94
99.53
100
97.81 98.50
98 96.74
96
0
2007 2008 2009 2010 2011 2012 2013 2014 2015 2016
Waste intensity (index) Plastic packaging waste (index)
Source: Based on Eurostat (2018a, 2018b).
(1) Waste intensity is defined as the waste generation divided by GDP.
Preventing plastic waste in Europe 15The plastics life cycle
waste. The increase of 2.9 % in waste intensity from According to Eurostat data (Eurostat, 2018a), the
2007 to 2016 is lower than the increase in total plastic development of plastic packaging waste generation
packaging waste generation, indicating a relative per capita in the countries from 2007 to 2016
decoupling of waste generation from economic ranges from an increase of 96 % (Poland) to a
growth. Nevertheless an increase in GDP still leads to decrease of 36 % (Greece). The economic level,
an increase in plastic waste generation, which means structure and development of the countries play an
that absolute decoupling of waste generation has not important role, but also looking at plastic packaging
yet been achieved. waste intensity shows a very mixed picture: of the
28 EU Member States, nine managed to at least
The overall EU‑28 trends result from diverging decouple plastic packaging waste generation from
national trends, as depicted in Figures 2.4 and 2.5. economic growth.
Figure 2.4 Percentage change in plastic packaging waste generation (per capita) between 2007 and 2016
Poland 96.0
Estonia 76.3
Slovakia 57.5
Hungary 44.9
Malta* 29.6
Finland 20.0
Germany 17.0
Croatia** 16.0
Austria 15.6
Sweden 14.9
Lithuania 14.6
Latvia 14.5
Bulgaria 12.3
Ireland 7.2
Denmark 6.7
Czechia 6.4
EU-28 6.0
Belgium 4.2
Netherlands 3.8
Portugal 2.2
Luxembourg 1.0
Romania* 0.8
United Kingdom -0.4
Slovenia -0.9
Cyprus* -1.0
France -1.6
Italy -6.0
Spain -11.5
Greece* -36.4
-60 % -40 % -20 % 0% 20 % 40 % 60 % 80 % 100 % 120 %
Notes: *Percentage change between 2007 and 2015; **percentage change between 2012 and 2016.
Source: Based on Eurostat (2018a).
16 Preventing plastic waste in EuropeThe plastics life cycle
The plastic packaging waste generation fluctuations deeply affected by the economic crisis that started
in the various EU countries cannot necessarily be in 2008. That is not to say that waste prevention
attributed to waste prevention measures. Municipal is ineffective: many examples with measures
waste generation (including packaging) is affected targeting plastic carrier bags have shown impressive
by different factors such as household income, results (see Chapter 3). A systematic analysis and
expenditure and household size per capita. Changes evaluation of the implementation of waste prevention
in these econometric factors might influence waste measures can reveal their effectiveness and their
generation more than waste prevention measures. impact on waste generation. Until this type of
For example, some of the countries that demonstrate evaluation becomes widely available, data such as
a relative decoupling of plastic packaging waste those presented in Figures 2.4 and 2.5 should be
generation from economic growth in Figure 2.5 were interpreted with caution.
Figure 2.5 Percentage change in waste intensity (per capita) between 2007 and 2016
Estonia 71.2
Poland 48.8
Hungary 33.3
Finland 29.0
Slovakia 28.4
Cyprus* 15.1
Austria 14.3
Sweden 8.7
Croatia** 8.6
Germany 8.6
Denmark 7.8
Latvia 6.2
Luxembourg 4.3
Italy 4.2
Malta* 4.0
Portugal 4.0
EU‑28 2.9
Belgium 2.4
Netherlands 2.3
Slovenia ‑0.4
Czechia ‑2.0
France ‑2.2
United Kingdom ‑2.6
Lithuania ‑6.4
Bulgaria ‑8.3
Spain ‑8.9
Romania* ‑14.6
Greece* ‑15.5
Ireland ‑18.4
‑60 % ‑40 % ‑20 % 0% 20 % 40 % 60 % 80 % 100 % 120 %
Notes: *Percentage change between 2007 and 2015; **percentage change between 2012 and 2016.
Source: Based on Eurostat (2018a, 2018b).
Preventing plastic waste in Europe 17Plastic waste prevention in the waste prevention programmes of EEA countries
3 Plastic waste prevention in the waste
prevention programmes of EEA countries
This chapter provides an analysis of how plastic 1. plastic waste declared as a priority waste stream in
waste is dealt with in countries' waste prevention the waste prevention programmes;
programmes. The assessment follows the
structure below: 2. concrete measures taken or planned to address
plastic waste prevention;
1. the extent to which plastic waste is addressed in the
prevention programmes; 3. objectives, quantitative targets and indicators of
plastic waste prevention adopted by countries'
2. measures envisaged for implementing prevention waste prevention policies and strategies.
of plastic waste;
The second and third elements are examined in the
3. mapping of targets and indicators for plastic waste following sections.
prevention.
With regard to prioritising plastic waste, the results
To support the assessment, a combination of of the survey conducted show that plastic waste is
publicly available information (as it appears in declared as a priority waste stream by around half of
countries' prevention programmes) and the results the countries investigated. Thus, 14 countries and five
of the European Environment Information and regions (i.e. Brussels‑Capital Region and Flanders, as
Observation Network (Eionet) survey were used. Waste well as Scotland, England and Wales) have declared
prevention programmes have been officially adopted plastic waste as a priority waste stream within their
by 31 EEA countries: the EU Member States (except waste prevention programmes, while 15 countries
for Cyprus) and also four non‑EU countries that are and two reporting regions did not. Table 3.1 depicts
members of the EEA (i.e. Norway, Iceland, Switzerland the survey results.
and Turkey).
The survey results suggest that plastic waste
By addressing the above three aspects of prevention is considered a priority issue for many
implementing plastic waste prevention, the EEA countries, although a significant number of
assessment aims to identify deficiencies and countries did not articulate a focus on plastics as a
successes in the entire policy chain with a view to priority material with specific chapters in their waste
providing solid recommendations for improvement, prevention programmes. An increase in the strategic
on the one hand, and underline the success stories and and policy attention given to plastics at EU level,
best practices, on the other. In this way, the analysis such as the recent development of a plastics strategy
has a broader objective, that of providing feedback and the Single Use Plastics Directive may enhance
to countries on how to best implement plastic waste efforts to prevent plastic waste in the countries.The
prevention by respecting the overarching EU waste survey results suggest that plastic waste prevention
prevention legislation. is considered a priority issue for many EEA countries,
although a significant number of countries did not
articulate a focus on plastics as a priority material
3.1 Waste prevention programmes and with specific chapters in their waste prevention
plastic waste programmes. An increase in the strategic and policy
attention given to plastics at EU level, such as the
To assess the position of plastic waste within ountries' recent development of a plastics strategy and the
waste prevention policies (including the waste Single Use Plastics Directive may enhance efforts to
prevention programmes), the following elements prevent plastic waste in the countries.
were examined:
18 Preventing plastic waste in EuropePlastic waste prevention in the waste prevention programmes of EEA countries
Table 3.1 Prioritisation of plastic or packaging waste within waste prevention programmes
Austria Luxembourg
Belgium
Malta (a)
(Brussels‑Capital Region)
Belgium (Flanders) Netherlands (a)
Belgium (Wallonia) Norway (a)
Bulgaria (a) Poland
Croatia Portugal
Czechia Romania
Denmark Slovakia
Estonia Slovenia
Finland Spain
France Sweden
Germany Switzerland
Greece Turkey
United Kingdom
Hungary
(Northern Ireland) (a)
Iceland United Kingdom (Scotland)
Ireland ( ) a
United Kingdom (England)
Italy (a) United Kingdom (Wales)
Latvia ( ) a
Cyprus n/a
Lithuania
Packaging or plastics mentioned as priority waste stream/priority sector
Packaging or plastics may be addressed but not mentioned as priority waste stream/priority sector
Notes: (a) No data available based on Eionet survey; data obtained based on desktop research
n/a, data not available.
3.2 Policy instruments and measures • map where interventions are anticipated in
terms of supply chains;
All waste prevention programmes include measures
that either directly address plastic waste prevention • correlate the three parts of the waste prevention
or are horizontal measures that also refer to avoiding definition and the different types of measures;
plastic waste. In addition, a variety of countries have
initiated targeted measures with regard to specific • understand the type of interventions these
plastic products such as plastic bags (see Box 3.1), measures reflect.
single‑use plastics or micro‑plastics. Several countries
(e.g. Denmark and Belgium) have developed or are This assessment aims to better analyse the
currently developing comprehensive plastic strategies prevention measures with the goal of identifying
that contain dedicated policy instruments on plastic areas of intervention where sufficient measures are
waste prevention. taken (among which, best practice examples can be
identified) and areas that are not well covered by the
Through the review of the published and adopted waste countries' initiatives.
prevention programmes, supplemented by the country
responses to the Eionet survey, a total of 173 plastic Of the 173 measures, 61 % cover the production
waste prevention measures have been identified. The phase of plastic products and 39 % cover the
measures are not in most cases presented as supporting consumption phase. Production‑oriented measures
concrete targets but rather as generic objectives of waste may refer to reducing production by, for example,
prevention as a whole, namely reducing the amount of smart packaging design or banning specific plastic
waste generated. In this chapter, the type and nature of products, while consumption‑oriented measures
these measures is analysed in order to: can be, for example, information campaigns or fees
Preventing plastic waste in Europe 19Plastic waste prevention in the waste prevention programmes of EEA countries
Figure 3.1 Distribution of measures identified Figure 3.2 Distribution of measures identified
according to waste prevention type according to instrument type
25 36
14
5
30
69
150
3
Reduce waste amounts Informative Voluntary agreements
Amount of measures Reduce impacts from waste Amount of measures Regulatory Financing
Reduce hazardous substances Market based
for specific plastic products such as plastic bags. of plastic waste prevention. This analysis has,
The balance between these two types of measures of course, to take into account that the number
is in line with the European Commission's plastics of measures is not necessarily related to their
strategy, which in its Vision 2030 highlights the role effect on plastic waste generation or reduced
of an innovative and sustainable plastics industry. environmental burdens. Nevertheless, it hints
at the clearly expressed will of policymakers to
With respect to the three parts of the waste effectively address the issue of plastic waste in the
prevention definition (see Section 1.4), the majority seas and oceans as well as onshore.
of prevention measures set forth by the countries
deal with quantitative prevention (Figure 3.1). Only
14 measures can be identified as directly relating 3.3 Good practice examples
to the second part of the definition and they mainly
address eco‑design. Regarding the reduction of This section identifies good practice examples from the
hazardous substances in plastic products (part three information gathered during the review behind this
of the definition), only five measures explicitly mention report. The good practice examples are presented per
this objective. It is clear that the countries consider type of policy measure (i.e. regulatory, market based,
waste reduction, in terms of volumes generated, financing, voluntary and informative). The selection of
as the most important aspect of waste prevention, examples aims to highlight the broad range of activities
and the countries therefore support this objective with regard to different products or waste streams
with a wide variety of policy measures. It should and the different actors who initiated such measures
be mentioned that in conducting this analysis only or actively support them, as well as the large number
dedicated waste prevention measures were taken of countries that implement plastic waste prevention
into account; countries might have measures in place measures. Many of these measures are implemented in
that address eco‑design or the presence of hazardous various countries and the following examples obviously
substances in other pieces of legislation such as acts cannot give a comprehensive overview but aim to
and ordinances for hazardous waste management. showcase especially inspiring approaches.
With regard to the choice of different types Regulatory instruments are mandated by law and
of policy instrument, Figure 3.2 differentiates cover, for example, bans, prohibitions and standards.
between regulatory, market‑based and informative National and EU‑wide regulations can contribute to
instruments as well as voluntary agreements and plastic waste prevention in several ways: they can, for
financing schemes. instance, manage chemical content in plastic products,
especially with threshold and authorised substances.
Overall, countries show a clear focus on They can also regulate access to the market by
informative instruments (42 % of all measures) restricting production and commercialisation of specific
but, compared with the analysis in previous waste plastic products. Of the measures mapped, 25 fall
prevention progress reports, the share of more into this category, and they refer mainly to measures
stringent and binding regulatory and market‑based banning micro‑plastics, micro‑beads and some types of
instruments is significantly higher in the field single‑use plastics. With regard to the product groups
20 Preventing plastic waste in EuropeYou can also read