GLOBAL CLIMATE RISK INDEX 2021 - Who Suffers Most from Extreme Weather Events? Weather-Related Loss Events in 2019 and 2000-2019 - Germanwatch eV
←
→
Page content transcription
If your browser does not render page correctly, please read the page content below
BRIEFING PAPER

GLOBAL CLIMATE RISK INDEX 2021
Who Suffers Most from Extreme Weather Events?
Weather-Related Loss Events in 2019 and 2000-2019

David Eckstein, Vera Künzel, Laura Schäfer
Global Climate Risk Index 2021                                                                                                        GERMANWATCH

                 Brief Summary
                 The Global Climate Risk Index 2021 analyses and ranks to what extent countries and regions have been
                 affected by impacts of climate related extreme weather events (storms, floods, heatwaves etc.). The most
                 recent data available for 2019 and from 2000 to 2019 was taken into account.

                 The countries most affected in 2019 were Mozambique, Zimbabwe as well as the Bahamas. For the period
                 from 2000 to 2019 Puerto Rico, Myanmar and Haiti rank highest.

                 This year’s 16th edition of the Climate Risk Index clearly shows: Signs of escalating climate change can no
                 longer be ignored – on any continent or in any region. Impacts from extreme-weather events hit the poor-
                 est countries hardest as these are particularly vulnerable to the damaging effects of a hazard, have a lower
                 coping capacity and may need more time to rebuild and recover. The Global Climate Risk Index indicates
                 a level of exposure and vulnerability to extreme weather events, which countries should understand as
                 warnings in order to be prepared for more frequent and/or more severe events in the future. The storms
                 in Japan show: Also high-income countries are feeling climate impacts more clearly than ever before. Ef-
                 fective climate change mitigation and adaptation to prevent or minimize potential damage is therefore in
                 the self-interest of all countries worldwide.

              Imprint
              Authors: David Eckstein, Vera Künzel, Laura Schäfer
              Contributors: Emma Opfer and Rixa Schwarz
              Editing: Joanne Chapman-Rose, Janina Longwitz
              The Climate Risk Index is based on data from Munich RE. Germanwatch particularly thanks Petra
              Löw for her support.

              Publisher:
              Germanwatch e.V.
              Office Bonn                                              Office Berlin
              Dr. Werner-Schuster-Haus
              Kaiserstr. 201                                           Stresemannstr. 72
              D-53113 Bonn                                             D-10963 Berlin
              Phone +49 (0)228 / 60 492-0, Fax -19                     Phone +49 (0)30 / 28 88 356-0, Fax -1

              Internet: www.germanwatch.org
              Email: info@germanwatch.org

              January 2021
              Purchase order number: 21-2-01e
              ISBN 978-3-943704-84-6
              This publication can be downloaded at: www.germanwatch.org/en/cri

                                                                          This publication is financially supported by Bread for the World
                                                                          – Protestant Development Service. Germanwatch is responsi-
                                                                          ble for the content of this publication.

              Comments welcome. For correspondence with the authors, please contact: kri@germanwatch.org

                                                                      1
Global Climate Risk Index 2021 GERMANWATCH
Content
How to Interpret the Global Climate Risk Index ............................................ 3
Key Messages .............................................................................................. 5
1 Key Results of the Global Climate Risk Index 2021 ................................ 6
2 Effects of Climate Change on Extreme Weather Events and Ways to Deal with
the Related Impacts........................................................................... 16
The effects of climate change on tropical cyclones ............................................. 19
Exemplary approaches to address the impacts of tropical cyclones............... 21
Loss and damage: when adaptation and risk management reach their limits
................................................................................................................................ 23
3 Status Quo of International Resilience Policy .......................................... 24
International climate policy developments and expectations for 2021 .......... 27
4 Methodological Remarks ........................................................................ 29
5 References ............................................................................................. 33
Annexes .................................................................................................... 39
2Global Climate Risk Index 2021 GERMANWATCH
How to Interpret the Global Climate Risk
Index
The Germanwatch Global Climate Risk Index is an analysis based on one of the most
reliable data sets available on the impacts of extreme weather events and associ-
ated socio-economic data, the MunichRe NatCatSERVICE. The Global Climate Risk
Index 2021 is the 16th edition of this annual analysis. Its aim is to contextualise on-
going climate policy debates – especially the international climate negotiations –
looking at real-world impacts over the last year and the last 20 years.
However, the index must not be mistaken for a comprehensive climate vulnerabil-
ity 1 scoring. It represents one important piece in the overall puzzle of climate-re-
lated impacts and the associated vulnerabilities. The index focuses on extreme
weather events such as storms, floods and heatwaves but does not take into account
important slow-onset processes such as rising sea levels, glacier melting or ocean
warming and acidification. It is based on past data and should not be used as a
basis for a linear projection of future climate impacts. More specifically, not too far-
reaching conclusions should be drawn for the purpose of political discussions re-
garding which country or region is the most vulnerable to climate change. Also, it is
important to note that the occurrence of a single extreme event cannot be easily
attributed to anthropogenic climate change. Nevertheless, climate change is an in-
creasingly important factor for changing the likelihood of the occurrence and the
intensity of these events. There is a growing body of research that is looking into the
attribution of the risk 2 of extreme events to the influences of climate change 3 (see
chapter 2).
The Climate Risk Index (CRI) indicates a level of exposure and vulnerability to ex-
treme events, which countries should understand as warnings in order to be pre-
pared for more frequent and/or more severe events in the future. In the CRI 2021,
data from 180 countries were analysed. However, not being mentioned in the CRI
1
According to IPCC (2014b) we define vulnerability as “the propensity or predisposition to be adversely affected. Vulnerability
encompasses a variety of concepts and elements including sensitivity or susceptibility to harm and lack of capacity to cope
and adapt”.
2
According to IPCC (2012) we define disaster risk as “the likelihood over a specified time period of severe alterations in the
normal functioning of a community or a society due to hazardous physical events interacting with vulnerable social condi-
tions, leading to widespread adverse human, material, economic, or environmental effects that require immediate emer-
gency response to satisfy critical human needs and that may require external support for recovery.
3
See, for instance: American Meteorological Society 2018, Herring et al. (2018), Trenberth et al. (2018), Zhang et al. (2016);
Hansen et al. (2016); Haustein et al. (2016) & Committee on Extreme Weather Events and Climate Change Attribution et al.
(2016); Stott et al. (2015)
3Global Climate Risk Index 2021 GERMANWATCH
does not mean there are no impacts occurring in these countries. Due to the limita-
tions of the available data 4, particularly long-term comparative data, including so-
cio-economic data, some very small countries, such as certain small island states,
are not included in this analysis. Moreover, the data only reflects the direct impacts
(direct losses and fatalities) of extreme weather events, whereas, indirect impacts
(e.g. as a result of droughts and food scarcity) are not captured. The results of this
index must be viewed against the background of data availability and quality as well
as the underlying methodology for their collection. Data quality and coverage may
vary from country to country as well as within countries. This has led to an un-
derrepresentation of, for example, African countries when it comes to heatwaves.
Finally, the index does not include the total number of affected people (in addition
to the fatalities), since the comparability of such data is very limited.
4
See also the Methodological Remarks in Chapter 5.
4Global Climate Risk Index 2021 GERMANWATCH
Key Messages
● Mozambique, Zimbabwe and the Bahamas were the countries most affected by the impacts of ex-
treme weather events in 2019.
● Between 2000 and 2019, Puerto Rico, Myanmar and Haiti were the countries most affected by the
impacts of extreme weather events.
● Altogether, between 2000 and 2019 over 475 000 people lost their lives as a direct result of more
than 11 000 extreme weather events globally and losses amounted to around US$ 2.56 trillion (in
purchasing power parities).
● Storms and their direct implications – precipitation, floods and landslides – were one major cause
of losses and damages in 2019. Of the ten most affected countries in 2019, six were hit by tropical
cyclones. Recent science suggests that the number of severe tropical cyclones will increase with
every tenth of a degree in global average temperature rise.
● In many cases, single exceptionally intense extreme weather events have such a strong impact that
the countries and territories concerned also have a high ranking in the long-term index. Over the
last few years, another category of countries has been gaining relevance: Countries like Haiti, the
Error! Philippines
Bookmark and Pakistan
not that are recurrently affected by catastrophes continuously rank among the
defined.
most affected countries both in the long-term index and in the index for the respective year.
● Developing countries are particularly affected by the impacts of climate change. They are hit hard-
est because they are more vulnerable to the damaging effects of a hazard but have lower coping
capacity. Eight out of the ten countries most affected by the quantified impacts of extreme weather
events in 2019 belong to the low- to lower-middle income category. Half of them are Least Devel-
oped Countries.
● The global COVID-19 pandemic has reiterated the fact that both risks and vulnerability are systemic
and interconnected. It is therefore important to strengthen the resilience of the most vulnerable
against different types of risk (climatic, geophysical, economic or health-related).
● After the international climate policy process stalled in 2020 due to the Covid-19 pandemic expecta-
tions regarding progress on the long-term finance goal and adequate support for adaptation and
L&D lie in 2021 and 2022. The process needs to deliver: a) a decision on how the need for support
for vulnerable countries concerning future loss and damage is to be determined on an ongoing ba-
sis; b) the necessary steps to generate and make available financial resources to meet these needs;
and c) strengthening the implementation of measures for adapting to climate change.
5Global Climate Risk Index 2021 GERMANWATCH
1 Key Results of the Global Climate
Risk Index 2021
People all over the world are facing the reality of climate change – in many parts of
the world this is manifesting in an increased volatility of extreme weather events.
Between 2000 and 2019, over 475 000 people lost their lives worldwide and losses
of US$ 2.56 trillion 5 (in PPP) were incurred as a direct result of more than 11 000 ex-
treme weather events. Slow-onset processes are already adding an additional bur-
den and will increasingly do so in the future. According to the UNEP Adaptation Gap
Report 2016, increasing impacts will result in increases in global adaptation costs:
By 2030 it is estimated that these costs will amount to between US$ 140 billion and
US$ 300 billion annually and by 2050 to between US$ 280 billion and US$ 500 bil-
lion. 6 Costs resulting from residual risks or unavoidable loss and damage are not
covered in these numbers. Current estimates of climate finance needs for residual
loss and damage in developing countries range between US$ 290 billion to US$ 580
billion in 2030. 7 Similarly, the Intergovernmental Panel on Climate Change (IPCC)
estimates in its Special Report “Global Warming of 1.5°C” that the "mean net present
value of the costs of damage from warming in 2100 for 1.5°C and 2°C (including costs
associated with climate change induced market and non-market impacts, impacts
due to sea level rise, and impacts associated with large scale discontinuities) are
US$ 54 trillion and US$ 69 trillion, respectively, relative to 1961–1990". 8 This indi-
cates that the gap between the necessary financing to deal with climate-induced
risks and impacts is even greater than earlier projected. On the other hand, the re-
port highlights the importance of enhanced mitigation action towards limiting a
global temperature increase to well below 2°C or even to 1.5°C, which could avoid
substantive costs and hardships. 9
5
Note: Contrary to previous years, the underlying database for the calculation of the CRI 2021 does NOT include data for the
United States of America. This results in a significantly lower number for the overall losses in PPP for the 20-year period,
compared to, for instance, the number presented in the CRI 2020 (overall losses of US$ 3.54 trillion). As a comparison: Ex-
cluding the United States of America, the overall losses in the CRI 2020 amounted to US$ 2.51 trillion.
6
UNEP 2016, p. 40ff
7
Markandya/González-Eguino 2018 - Their figures depend on the climate scenario, the discount rate, the assumed parame-
ters of the climate model and the socioeconomic model. The analysis is based on the case where equilibrium temperatures
increase by 2.5–3.4 °C, implying some mitigation, but less than is required under the Paris accord. They note that the uncer-
tainties regarding these sources are very large and meaningful projections of residual damage in the medium to long-term
are not possible
8
IPCC 2018a, p 153
9
Ibid. 2018a
6Global Climate Risk Index 2021 GERMANWATCH
The Global Climate Risk Index (CRI) developed by Germanwatch analyses quan-
tified impacts of extreme weather events 10 – both in terms of the fatalities as well as
the economic losses that occurred. The index is based on data from the Munich Re
NatCatSERVICE 11, which is considered worldwide as one of the most reliable and
complete databases on this matter. The CRI examines both absolute and relative
impacts to create an average ranking of countries in four indicative categories, with
a stronger emphasis on the relative indicators (see chapter 4 “Methodological Re-
marks” for further details on the calculation). The countries ranking highest (figuring
in the “Bottom 10” 12) are the ones most impacted by extreme weather events and
should consider the CRI as a warning sign that they are at risk of either frequent
events or rare but extraordinary catastrophes.
The CRI does not provide an all-encompassing analysis of the risks of anthropo-
genic climate change, but should be seen as one analysis, which contributes to ex-
plaining countries' exposure and vulnerability to climate-related risks based on the
most reliable quantified data available – alongside other analyses. 13 It is based on
data reflecting the current and past climate variability and also on climate change
– to the extent that it has already left its footprint on climate variability over the last
20 years.
Countries Most Affected in 2019
Mozambique, Zimbabwe and the Bahamas were the most affected countries in
2019 followed by Japan, Malawi and the Islamic Republic of Afghanistan. Table 1
shows the ten most affected countries (Bottom 10) in 2019, with their average
weighted ranking (CRI score) and the specific results relating to the four indicators
analysed.
10
Meteorological events such as tropical storms, winter storms, severe weather, hail, tornados, local storms; hydrological
events such as storm surges, river floods, flash floods, mass movement (landslide); climatological events such as freezing,
wildfires, droughts.
11
For further information visit https://www.munichre.com/en/solutions/reinsurance-property-casualty/natcatservice.html
12
The term "Bottom 10" refers to the 10 most affected countries in the respective time period.
13
See e.g. analyses of Columbia University; Maplecroft's Climate Change Vulnerability Index
7Global Climate Risk Index 2021 GERMANWATCH
Table 1: The 10 most affected countries in 2019
Ranking Country CRI Fatalities Fatalities per Absolute Losses Human De-
2019 score 100 000 losses per unit velopment
(2018) inhabitants (in million GDP in % Index 2020
US$ PPP) Ranking 14
1 (54) Mozambique 2.67 700 2.25 4 930.08 12.16 181
2 (132) Zimbabwe 6.17 347 2.33 1 836.82 4.26 150
3 (135) The Bahamas 6.50 56 14.70 4 758.21 31.59 58
4 (1) Japan 14.50 290 0.23 28 899.79 0.53 19
5 (93) Malawi 15.17 95 0.47 452.14 2.22 174
Islamic Republic
6 (24) 16.00 191 0.51 548.73 0.67 169
of Afghanistan
7 (5) India 16.67 2 267 0.17 68 812.35 0.72 131
8 (133) South Sudan 17.33 185 1.38 85.86 0.74 185
9 (27) Niger 18.17 117 0.50 219.58 0.74 189
10 (59) Bolivia 19.67 33 0.29 798.91 0.76 107
PPP = Purchasing Power Parities. GDP = Gross Domestic Product.
In March 2019, the intense tropical Cyclone Idai hit Mozambique (1), Zimbabwe (2)
and Malawi (5), causing catastrophic damage and a humanitarian crisis in all three
countries. Quickly becoming the deadliest and costliest tropical cyclone in the
South-West Indian Ocean, Idai was labelled as “one of the worst weather-related
catastrophes in the history of Africa” by United Nations Secretary-General António
Guterres. 1516 The torrential rains and destructive winds with top speeds of 195 kilo-
metres per hour 17 caused flash floods and landslides, which caused economic
losses amounting to US$ 2.2 billion. Overall, the cyclone affected three million peo-
ple and caused over 1 000 fatalities. 18 19
In Zimbabwe (2) Idai affected more than 270 000 people, leaving over 340 dead and
many others missing. 20 The cyclone pummelled the eastern parts of Zimbabwe
mainly Chimanimani and parts of Chipinge at night, with less preparedness by the
14
UNDP 2020
15
United Nations Secretary-General Official Twitter Account
16
United Nations Secretary-General 2019.
17
GDACS
18
Reliefweb 2019a
19
AON 2019a
20
Reliefweb 2019b
8Global Climate Risk Index 2021 GERMANWATCH
local communities as well as the government. 21 The road infrastructure was grossly
damaged with more than 90% of the road networks in Chimanimani and Chipinge
being negatively affected, including 584 km of the roads being damaged by land-
slides. 22 Overall, the cyclone impacted 50 000 households and displaced over
60 000 people in the country, causing as much as US$ 622 million worth of dam-
age. 23
For Malawi (5) the year 2019 started with heavy rainfalls, which led to an increased
risk of floods. When Idai hit Malawi in March, it directly affected 975 000 people and
left over 125 000 homeless. 24 Due to the heavy rainfalls and floods caused by Idai,
60 people were killed and over 650 injured. 25 Malawi’s economy is heavily depend-
ent on agriculture, employing nearly 80% of the population, and it is therefore vul-
nerable to external shocks, particularly climatic shocks. 26
Six weeks after the devastation of Cyclone Idai, Mozambique (1) was hit by another
cyclone when category 4 Cyclone Kenneth made landfall in Northern Mozambique.
Kenneth was the strongest cyclone ever recorded on the African continent with
wind speeds peaking at 220 kilometres per hour and floods with a height of 2.5 me-
tres. 27 Overall, Idai and Kenneth led to the deaths of over 600 people and over 1 600
were injured. 2.5 million people were in need of humanitarian services and over
200 000 houses were destroyed. 28 The overall damage amounted to more than US$
3.2 billion (approximately as high as half of Mozambique’s national budget), mostly
in the manufacturing, infrastructure and social sectors. 29 30
Hurricane Dorian made landfall on the Bahamas (3) in September 2019 as a cate-
gory 5 hurricane – the most powerful hurricane on record to hit the island state. 31
Dorian reached sustained wind speeds of 300 kilometres per hour 32 causing heavy
rainfalls of 914 millimetres (about 80% of the annual average) of rain within a few
hours. 33 74 people were killed. Overall, the hurricane caused damage of US$ 3.4 bil-
lion and damaged or destroyed 13 000 houses. On Grand Bahama and Abaco,
21
Ibid.
22
Ibid.
23
Reliefweb 2019c
24
Reliefweb 2019d
25
Reliefweb 2019e
26
World Bank 2020a
27
UN News
28
Reliefweb 2019f
29
World Bank 2020b
30
Oxfam 2020b
31
Reliefweb 2020a
32
Miami Herald
33
Cambridge
9Global Climate Risk Index 2021 GERMANWATCH
which were the two most affected islands, about 45% of the homes were damaged
or destroyed. 34 Moreover, during the storm an oil spill occurred at an oil port of the
Norwegian state oil and gas company Equinor on Grand Bahama, which polluted
the soil and negatively impacted the marine life. 35
In October 2019, Japan (4) was hit by Typhoon Hagibis, the most powerful typhoon
in Japan in more than 60 years. With top wind speeds reaching 250 kilometres per
hour, Hagibis was classified as “very strong”, which is equivalent to a category 5 hur-
ricane. In Tokai, Kanto, and Tohoku regions, the total rainfall in 72 hours was up to
between 750mm and 1 000mm (between 50% to 70% of the annual average). 36
Overall, nearly 100 people died, over 230 people were injured, and 13 000 houses
were damaged, destroyed or exposed to water. In September, Japan had already
been hit by Typhoon Faxai, which made landfall near Tokyo, leaving more than
900 000 homes without power. With winds of up to 210 kilometres per hour, Faxai
has been one of the strongest typhoons to hit the Japanese capital in a decade. 37
The economic damage caused by the two typhoons is estimated at US$ 25 billion. 38
Moreover, Japan experienced a heatwave in August 2019, causing over 18 000 heat-
related hospitalisations and killing 57 people. 39 But Japan was also hit by other
types of extreme weather: In May 2019, the temperatures in the prefecture of Hok-
kaido had already gone up to 39.5°C, the highest figure ever recorded in the month
of May anywhere in Japan. 40
The Islamic Republic of Afghanistan (6) experienced several floods and landslides
throughout the year, caused by heavy rainfall. The floods in March 2019 were the
most devastating - approximately 120 000 people were affected, and 12 000 homes
were either destroyed or damaged by the floods and mudslides. 41 Over 75 people
died. In April and May 2019 another 40 people died because of deadly flash floods. 42
Furthermore, landslides occurred in January and December, killing a total of 35
34
Guardian
35
Zeit Online
36
Reliefweb 2019g
37
BBC 2019a
38
AON 2019b
39
The Japan Times
40
South China Morning Post
41
Reuters 2019
42
Floodlist 2019a
10Global Climate Risk Index 2021 GERMANWATCH
people. 4344 Due to severe droughts in 2018, the coping capacity of the people af-
fected was already very low. 45
India (7) was affected by the yearly monsoon season, which typically lasts from
June to early September. In 2019, the monsoon conditions continued for a month
longer than usual, with the surplus of rain causing major hardship. From June to
end of September 2019, 110% of the normal rainfall occurred, the most since 1994. 46
The floods caused by the heavy rains were responsible for 1 800 deaths across 14
states and led to the displacement of 1.8 million people. 47 Overall, 11.8 million peo-
ple were affected by the intense monsoon season with the economic damage esti-
mated to be US$ 10 billion. 48 Furthermore, with a total of eight tropical cyclones,
the year 2019 was one of the most active Northern Indian Ocean cyclone seasons
on record. Six of the eight cyclones intensified to become “very severe”. 49 The worst
was Cyclone Fani in May 2019, which affected a total of 28 million people, killing
nearly 90 people in India and Bangladesh and causing economic losses of US$ 8.1
billion. 50
South Sudan (8) suffered because of abnormally severe flooding following heavy
rainfalls lasting from June 2019 until the end of the year. These affected over 900 000
people; 620 000 of whom required immediate humanitarian assistance. The floods
damaged 74 000 hectares of cultivated land, which amounts to a loss of over 70 000
metric tons of cereal. 51 South Sudan required US$ 61.5 million to respond to imme-
diate flood-induced damage. 52 Despite the floods, bush fires intensified and spread
due to strong winds and hit four villages in South Sudan’s Western Bahr el Ghazal
region, causing 50 fatalities and injuring over 60 more people. 53 The fires destroyed
138 houses and killed 10 000 cattle. 54
Heavy rains caused massive flooding in Niger (9), mainly in the regions Maradi,
Zinder and Agadez. The Niger River reached an alarming water level of 640 centime-
tres (the normal level being 550 centimetres), damaging houses as well as various
43
The Washington Post
44
Reliefweb 2019h
45
Reliefweb 2019i
46
Earth Observatory
47
Reliefweb 2020b
48
AON 2019b
49
The Weather Channel
50
AON 2019a
51
Anadolu Agency
52
Reliefweb 2019j
53
Reliefweb 2019k
54
Africanews
11Global Climate Risk Index 2021 GERMANWATCH
crops and hydro-agricultural developments. 55 56 The floods were responsible for 57
fatalities and over 16 000 destroyed houses, affecting more than 210 000 people –
of which 123 000 were children. 57
Bolivia (10) suffered due to wildfires that destroyed two million hectares of forest
and grassland with almost half of the losses being protected areas with high biodi-
versity. It is estimated that the regeneration of the local ecosystem will take about
300 years. 58 Furthermore, Bolivia experienced heavy rainfalls and flooding through-
out the year. In April 2019, 79 of the 338 municipalities were under a state of disaster
and 25 were under a state of emergency. In total, 34 people died and over 23 000
families became homeless. 59 In January 2019, the Isiboro River near Gundonovia
stood at 9.35 metres – about one metre above the danger mark. 60
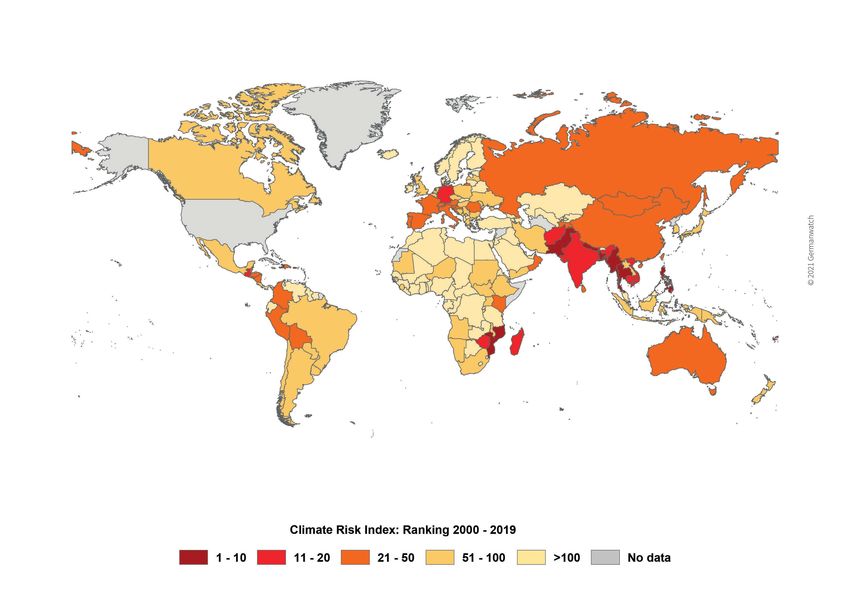
Countries Most Affected in the Period 2000-2019
Puerto Rico, Myanmar and Haiti have been identified as the most affected coun-
tries 61 in this twenty-year period. They are followed by the Philippines, Mozam-
bique and the Bahamas. Table 2 shows the ten most affected countries over the
last two decades with their average weighted ranking (CRI score) and the specific
results relating to the four indicators analysed.
55
Floodlist 2019b
56
IOM
57
Reliefweb 2020c
58
BBC 2019b
59
Reliefweb 2020c
60
Floodlist 2019c
61
Note: Puerto Rico is not an independent national state but an unincorporated U.S. territory. Nevertheless, based on its
geographical location and socio-economic indicators Puerto Rico has different conditions and exposure to extreme
weather events than the rest of the USA. The Global Climate Risk Index aims to provide a comprehensive and detailed over-
view of which countries and regions are particularly affected by extreme weather events. Therefore, Puerto Rico was con-
sidered separately to rest of the USA in our analysis.
12Global Climate Risk Index 2021 GERMANWATCH
Table 2: The Long-Term Climate Risk Index (CRI): The 10 countries most affected from 2000 to
2019 (annual averages)
CRI Country CRI Fatalities Fatalities Losses in Losses per Number of
2000-2019 score per 100 000 million US$ unit GDP events
(1999-2018) inhabitants PPP in % (2000–2019)
1 (1) Puerto Rico 7.17 149.85 4.12 4 149.98 3.66 24
2 (2) Myanmar 10.00 7 056.45 14.35 1 512.11 0.80 57
3 (3) Haiti 13.67 274.05 2.78 392.54 2.30 80
4 (4) Philippines 18.17 859.35 0.93 3 179.12 0.54 317
5 (14) Mozambique 25.83 125.40 0.52 303.03 1.33 57
6 (20) The Bahamas 27.67 5.35 1.56 426.88 3.81 13
7 (7) Bangladesh 28.33 572.50 0.38 1 860.04 0.41 185
8 (5) Pakistan 29.00 502.45 0.30 3 771.91 0.52 173
9 (8) Thailand 29.83 137.75 0.21 7 719.15 0.82 146
10 (9) Nepal 31.33 217.15 0.82 233.06 0.39 191
Compared to the long-term CRI 2020, which considered the period from 1999 to
2018 62, two new countries have entered the Bottom 10, while most countries have
ranked similarly to the year before. Puerto Rico, Myanmar and Haiti have remained
the three most affected countries over the past two decades. These rankings are
attributed to the aftermath of exceptionally devastating events such as Hurricane
Maria in Puerto Rico in 2017 and Hurricanes Jeanne (2004) and Sandy (2012) in Haiti.
Likewise, Myanmar was struck hard by Cyclone Nargis in 2008, which was responsi-
ble for the loss of an estimated 140 000 lives as well as the loss and damage of prop-
erty of approximately 2.4 million people. 63 Mozambique and the Bahamas, which
are the countries that are new to the Bottom 10, also feature in a high position in
the ranking as a consequence of exceptionally devastating storms. In 2019, Cyclone
Idai and Kenneth made landfall in Mozambique and Hurricane Dorian hit the Baha-
mas.
These results emphasise the particular vulnerability, particularly in relative terms,
of poor countries to climatic risks, despite the fact that the absolute monetary
62
See Eckstein et al. 2019
63
See OCHA 2012
13Global Climate Risk Index 2021 GERMANWATCH
losses are much higher in richer countries. Loss of life, personal hardship and exis-
tential threats are also much more widespread in low-income countries. 64
Exceptional Catastrophes or Continuous Threats?
The Global Climate Risk Index 2021 for the period 2000–2019 is based on average
values over a twenty-year period. However, the list of countries featured in the long-
term Bottom 10 can be divided into two groups: firstly, those which were most af-
fected due to exceptional catastrophes and secondly, those which are affected by
extreme events on an ongoing basis.
Countries falling into the first category include Myanmar, where Cyclone Nargis in
2008 caused more than 95% of the damage and fatalities over the past two decades,
and Puerto Rico, where more than 98% of the damage in both categories was
caused by Hurricane Maria in 2017. With new superlatives like Cyclone Idai in March
2019 being the deadliest and costliest cyclone on record in the Indian Ocean, and
one of the worst tropical cyclones ever to affect Africa and the Southern Hemi-
sphere, it seems to be just a matter of time until the next exceptional catastrophe
occurs. 65 The severe 2017 hurricane season had already made 2017 the costliest
year ever in terms of global weather disasters. 66
Over the last few years, the second category of countries has been gaining rele-
vance: Countries like Haiti, the Philippines and Pakistan, that are recurrently af-
fected by catastrophes, continuously rank among the most affected countries both
in the long-term index and in the index for each respective year. Furthermore, some
countries were still in the process of recovering from the previous year’s impacts.
One example is the Philippines, which is regularly exposed to tropical cyclones such
as Bopha 2012, Hayan 2013 and Mangkhut 2018, due to its geographical location.
The appearance of some European countries among the Bottom 30 countries 67 can
to a large extent be attributed to the extraordinary number of fatalities due to the
2003 heatwave, in which more than 70 000 people died across Europe. Although
some of these countries are often hit by extreme events, the relative economic
losses and the fatalities are usually relatively minor compared to the countries' pop-
ulations and economic power due to their high coping capacity.
64
See World Bank country classifications: https://blogs.worldbank.org/opendata/new-world-bank-country-classifications-
income-level-2020-2021
65
New York Times 2019a, World Bank 2019
66
MunichRe 2018
67
The full rankings can be found in the Annexes.
14Figure 1: World Map of the Global Climate Risk Index 2000 – 2019 Source: Germanwatch and Munich Re NatCatSERVICE Countries most affected by extreme weather events (2000-2019) 1 Puerto Rico 2 Myanmar 3 Haiti 4 Philippines 4 Mozambique 6 The Bahamas 7 Bangladesh 8 Pakistan 9 Thailand Italics: Countries where more than 90% of the losses or deaths occurred in one year or event
Global Climate Risk Index 2021                                                                          GERMANWATCH

              2 Effects of Climate Change on
              Extreme Weather Events and Ways to
              Deal with the Related Impacts
              Extreme weather events and how they are formed is complex. Numerous interre-
              lated factors must be taken into account when seeking to explain the causes. How-
              ever, science has been able to sufficiently demonstrate that climate change has a
              significant effect on extreme weather events, increasing their frequency, intensity
              and duration. Understanding the relation between the human-induced climate cri-
              sis and extreme weather events is essential for being able to mitigate the risks and
              prepare for these types of events.

              Back in its “Fifth Assessment Report”, which was published in 2014, the Intergovern-
              mental Panel on Climate Change (IPCC) had already stated that the risks associated
              with extreme events will continue to increase as the global mean temperature
              rises. 68 Linking particular extreme weather events to human-induced and natural
              climate drivers remains a scientific challenge which attribution science is trying to
              tackle. The field has recently taken huge leaps forward – even though gaps in
              knowledge and especially in data remain. In general, many studies conclude that
              “the observed frequency, intensity, and duration of some extreme weather events
              have been changing as the climate system has warmed”. 69 Nevertheless, it is not
              trivial to investigate the impact of climate change on a single weather event as dif-
              ferent regional circumstances need to be taken into account and data might be very
              limited. 70 Over the past few years, substantial research has been conducted on the
              attribution of extreme events to climate change, i.e. to what extend anthropogenic
              climate change has contributed to the events’ likelihood and strength. 71 In the field
              known as Probabilistic Event Attribution (PEA), based on climate model experi-
              ments, studies compare the probability of an extreme weather situation, in today’s
              world with human-caused greenhouse gas emissions, to a world without anthropo-
              genic climate change. 72 Due to methodological improvement, “fast track attribu-
              tion” is now more feasible and can be undertaken within months of the event (as
              opposed to decades). 73 Additionally, more knowledge has been generated on how
              underlying factors contributing to extreme weathers are influenced by global warm-
              ing. For example, higher temperatures intensify the water cycle, leading to more

              68
                 IPCC 2014a, p.12
              69
                 Committee on Extreme Weather Events and Climate Change Attribution et al. 2016, p. 2
              70
                 Hansen et al. 2016
              71
                 Stott et al. 2015
              72
                 Carbon Brief 2014
              73
                 Haustein et al. 2016
                                                                        16
Global Climate Risk Index 2021 GERMANWATCH
droughts as well as floods due to drier soil and increased humidity. 74 Of course,
these approaches can only lead to statements about the change in probability of a
certain event happening.
Considering this, the report “Explaining Extreme Events of 2017 from a Climate Per-
spective” offered findings from 17 peer-reviewed analyses. The American Meteoro-
logical Society has published such a report in its bulletin on an annual basis since
2012, analysing selected extreme weather events. Out of the 146 research findings,
70% “identified a substantial link between an extreme event and climate change”. 75
Again, “scientists have identified extreme weather events that they said could not
have happened without the warming of the climate through human-induced cli-
mate change.” 76 Among others, one of the cited studies concluded that the intense
marine heatwaves in the Tasman Sea off Australia in 2017 and 2018 would have
been “virtually impossible” without climate change. 77 Another study in the report of
the following year “Explaining Extreme Events of 2018 From a Climate Perspective”
took a closer look at the heatwave in South Korea in the summer of 2018. It con-
cluded that the likelihood of a 2018-like extreme heat wave with that intensity and
maximum duration had increased by four times due to anthropogenic climate
change. 78 For its part, the “Fourth Climate Assessment Report” (2018) considers,
with a high level of confidence, a future increase in the frequency and intensity of
extreme high temperature and precipitation events as the global temperature in-
creases as being “virtually certain”. 79
The data on the countries in the CRI 2021 demonstrate how destructive extreme
precipitation can be – namely through the floods and landslides, which have hit
many regions in South and South East Asia and Africa – regions which now feature
in the Bottom 10. Extreme precipitation is expected to increase as global warming
intensifies the global hydrological cycle. Thereby, single precipitation events are ex-
pected to increase in intensity at a higher rate than global mean changes in total
precipitation as outlined by Donat et al. (2016). Furthermore, those increases are
expected in wet as well as dry regions. 80 A study by Lehmann et al. (2015) strength-
ens the scientific link between record-breaking rainfall events since 1980 and rising
temperatures. According to the scientists, the likelihood of a new extreme rainfall
event being caused by climate change reached 26% in 2010. 81 A study by Blöschel
74
WMO 2017
75
American Meteorological Society 2018, without page number
76
Ibid.
77
Perkins-Kirkpatrick et al 2018, p54
78
Wang et al. 2018
79
Wuebbles el al. 2017
80
Donat et al. 2016
81
Lehmann et al. 2015
17Global Climate Risk Index 2021 GERMANWATCH
et al. (2017) concludes that the timing of floods is shifting due to climate change.
The research focuses on Europe and shows that floods occur earlier in the year,
posing timing risks to people and animals. Flooding rivers affect more people
worldwide than any other natural disasters and result in multi-billion dollars of
damage annually. 82 Nevertheless, the study is not fully able to single out human-
induced global warming as a cause – a problem researchers on extreme weather
attribution are still facing.
Researchers explained that the sea surface temperature plays a key role in increas-
ing storms, wind speeds and precipitation. 83 They conclude that Hurricane Harvey
in 2017 would not have been able to produce such an enormous amount of rain
without human-induced climate change. 84 Moreover, a study shows that torrential
rains like those in 2016 in Louisiana, USA, are now 40% more likely than in pre-in-
dustrial times. The rainfall was increased because the storm was able to absorb ab-
normal amounts of tropical moisture on its way to the US coast, releasing three
times the precipitation of Hurricane Katrina in 2005. 85
Another example is a regional model used to analyse the occurrence of heatwaves
in India, finding causalities regarding the 2016 heatwave and climate change. The
model indicated that sea surface temperatures influence the likelihood of record-
breaking heat. 86 Other studies have found similar results. A publication regarding
the 2015 Southern African droughts also found causalities with regards to sea sur-
face temperatures causing reduced rainfall, increased local air temperatures and
more evaporation. 87
Furthermore, there is increasing evidence on the link between extreme El Niño
events and global warming. Cai et al. (2018) found that the robust increase in the
variability of sea surface temperatures is “largely influenced by greenhouse-warm-
ing-induced intensification of upper-ocean stratification in the equatorial Pacific,
which enhances ocean-atmosphere coupling.” 88 As a consequence, the frequency
of strong El Niño events increases as well as extreme La Niña events. This finding is
considered a milestone in climate research 89 and confirms past research in the
field. 90
82
Blöschl et al. 2017
83
Trenberth et al. 2015; Zhang et al. 2016
84
Trenberth et al. 2018
85
Climate Central 2016a
86
Climate Central 2016b
87
Funk et al. 2016
88
Cai et al. 2018, p. 201.
89
Ham Y-G 2018
90
Cai et al. 2014, Cai et al. 2015, Yeh et al. 2009
18Global Climate Risk Index 2021 GERMANWATCH
Extreme weather events and the related risks are not the only type of risks aggra-
vated by the influences of climate change. In addition, slow-onset processes and
the related hazards, like the rising sea levels, desertification or the loss of biodiver-
sity, are triggered or reinforced. In its latest reports, the IPCC (2019) 91 focuses on the
effect of climate change on the desertification and degradation of land. It suggests
that climate change will accelerate several desertification processes and that, in the
future, the risks of desertification will increase. This has various implications, such
as the loss of biodiversity and an increase in the likelihood of wildfires.
The effects of climate change on tropical cyclones
In the Climate Risk Index 2021 tropical cyclones led to six countries being listed
among the Bottom 10. Mozambique (1), Zimbabwe (2) and Malawi (5) were struck
by Cyclone Idai (and Kenneth), the Bahamas (3) were hit by Hurricane Dorian, in
Japan (4) Typhoon Hagibis caused massive destruction, and various cyclones af-
fected India (7).
The following info-box highlights the role of climate change in increasing the inten-
sity of tropical cyclones and in increasing precipitation.
91
IPCC 2019
19Global Climate Risk Index 2021 GERMANWATCH
How will climate change affect tropical cyclones?
There is little doubt that climate change will bring about the following challenges:
Illustration: Germanwatch
If the increase in the global mean temperature is limited to 1.5°C or even 2°C, the total number of tropical
cyclones is actually expected to decrease. However, we also have to note that this might differ regionally. Ac-
cording to the IPCC 1.5°C Special Report, the intensity of the storms is likely to increase and more of the highest
category tropical cyclones will occur. This is due to warmer oceans acting like fuel: The heat provides more
energy to feed the storms, hence making them stronger and thus potentially more damaging. In addition,
warmer air can absorb more moisture leading to an increase in the precipitation associated with the storms.
Tropical cyclones are also getting slower. Consequently, they can release more rain on the affected area,91
although scientific debate on this matter continues.92 Peak wind speeds and precipitation will therefore most
likely increase more significantly if average temperatures rise by 2°C compared to if they only rise by 1.5°C.93
Further rises in sea levels will result in more severe storm surges. In 2020 the Atlantic hurricane season was so
active that it has exhausted the regular alphabetical list of storm names. New storms were named after Greek
letters. The Greek alphabet was used for only the second time on record.
Tropical cyclones have different names depending on where they occur. In the At-
lantic and Northeast Pacific, the weather phenomenon is described as a hurricane
whereas the term cyclone is used when the storm occurs in the South Pacific and
Indian Ocean. The term typhoon describes the same weather event in the North-
west Pacific. Moreover, such storms have different scales to classify their intensity
depending on the region in which they occur. There are at least five common trop-
ical cyclone scales, and all are based on wind speeds. The line between storms and
tropical cyclones is drawn very differently in different regions of the world, which
makes it difficult to compare the storms based on these categories. For example, a
cyclone in Australia and Fiji starts at 63 km/h, while a hurricane in the Caribbean will
only be defined as such from 119 km/h upwards. Then again, the highest category
of hurricanes – category five – starts at 252 km/h. In Australia and Fiji, a cyclone has
to reach 280 km/h to reach the highest classification, which is also named category
five. The box below describes how tropical cyclones form.
20Global Climate Risk Index 2021 GERMANWATCH
How tropical cyclones form
Vast amounts of water evaporate; humid air ascends spinning around an eye, creating a self-reinforcing
process fueled by ever warmer humid air. Once tropical cyclones hit the shore, this supply is interrupted
and the storm weakens. Highest wind speeds are reached directly around the eye at the so-called eye-
wall. Precipitation is most intense in that area as well. Huge storms can have several eyewalls.
Illustration: eskp.de/CC-BY (modified).
For a tropical cyclone to form, several conditions need to be fulfilled. Usually sea temperature has to
reach 26.5°C down to 50 metres below sea level. The atmosphere needs to be unstable i.e. there has to
be a significant difference in air temperature at different altitudes allowing for convection. In contrast,
the (vertical) wind shear should be low, otherwise the energy will be scattered over an area too large to
form a strong storm. This is the main reason why tropical cyclones are extremely rare in the Southern
Atlantic Ocean (NASA, 2004). High humidity in the lower to middle levels of the troposphere – the lowest
layer of the Earth's atmosphere and the one where most weather takes place – contributes to the con-
vection of air masses. Furthermore, sufficient Coriolis force is needed. Last but not least, tropical cy-
clones do not form out of nowhere. They need at least some form of disturbance close to the surface
with a horizontal inflow of air (convergence) and a certain degree of horizontal circulation (vorticity)
(NOAA 2018).
Exemplary approaches to address the impacts of
tropical cyclones
The impact of the tropical cyclones in 2019 again sends a stark signal that
knowledge about and pre-hazard responses to existing vulnerabilities and risk ex-
posure remains a critical issue – even more so with climate change playing an in-
creasing role in the intensity of tropical cyclones. Countries and communities that
have been hit by cyclones are often left more vulnerable to other hazards and the
impacts of climate change. In order to ensure better protection of the affected pop-
21Global Climate Risk Index 2021 GERMANWATCH
ulations, adaptation measures and integrated risk management strategies are re-
quired that include the key steps of risk assessment, risk reduction, risk retention
and transfer, preparedness, as well as response and recovery. 92
Strategies to successfully deal with tropical cyclones include a variety of measures
from the fields of disaster risk reduction, preparedness, adaptation and financial
protection: Community-based adaptation projects, for example, can contribute to
building better flood barriers 93. An example of such a project is the planting of man-
grove trees which can prevent coastal erosion 94; a solution that is now used in
Puerto Rico for instance. 95 In case of an emergency, awareness and preparation are
key for people to be able to react swiftly. Training and checklists can support this, 96
and evacuation plans are essential. 97 In Bangladesh, a country particularly vulnera-
ble to tropical cyclones, a dense network of small cyclone shelters, early warning
systems, evacuation plans, reforestation schemes and increased communication
has contributed to reducing cyclone-related mortality by more than 100-fold over a
period of 40 years (reducing deaths from 500 000 in 1970 to 4 234 in 2007). 98 Another
strategy in Bangladesh is growing crops on floating rafts, which can at least help to
minimise flood damage. 99 Furthermore, regulations play a key role in addressing
risks posed by tropical cyclones. To give an example, Australia has noted successes
by tightening building codes: buildings are required to be constructed in a way that
makes them less vulnerable to extreme winds. 100
Furthermore, large-scale engineering projects like floodgates and dams can con-
tribute to reducing damage. Such measures, however, are expensive, and often
have adverse impacts on ecosystems.
There are already some ambitious initiatives, which aim to increase the financial
resilience of the countries affected by tropical cyclones. Through pre-arranged
funding that will be paid out in case of a disaster, the fiscal balance of (sub-) national
governments, households and businesses can be protected. For example, the “Car-
ibbean Catastrophe Risk Insurance Facility” (CCRIF SPC) is a regional catastrophe
fund for the Caribbean and Central American governments to limit the financial im-
pacts of devastating tropical cyclones, excessive rainfall and earthquakes. In order
92
Le Quesne et al. 2017
93
IIED 2018
94
Reid 2016
95
U.S. Climate Resilience Toolkit 2017
96
American Red Cross 2018
97
Haque et al. 2012
98
Haque et al. 2012
99
Huq 2008
100
Mason & Haynes 2010
22Global Climate Risk Index 2021 GERMANWATCH
to do so, the insurance facility provides financial liquidity to the respective member
state when a threshold is triggered. Following Hurricane Dorian, CCRIF paid out US$
10,936,103 to the Bahamas. CCRIF’s payouts are made within 14 days of an event,
but in this case CCRIF made an ‘advance payment’ of 50% of the preliminary esti-
mated payout within 7 days to allow the government to begin to address its most
pressing needs – with the remaining 50% being paid within the 14-day window
which applies to all the CCRIF payouts. 101
Another example is the “Pacific Catastrophe Risk Assessment and Financing Facil-
ity” (PCRAFI), a regional risk pool in the Pacific, which aims to provide disaster risk
management and finance solutions to help increase the resilience of Pacific Island
states. Countries can insure themselves against tropical cyclones, earthquakes and
tsunamis. In parallel, disaster risk management work is being conducted under the
Pacific Resilience Program, which aims to strengthen early warning systems and
preparedness and improve countries’ post-disaster response capacities.
While these initiatives are an important step forwards in addressing the particularly
vulnerable countries and can help to provide the necessary financial backup in case
of tropical cyclones and other extreme events, direct access to international climate
finance through national entities is still fairly limited for some of the most affected
countries.
Loss and damage: when adaptation and risk
management reach their limits
As extreme weather events like tropical cyclones are likely to increase in quantity
and/or severity with ongoing climate change, it is extremely important that more
emphasis be put on the issue of loss and damage. The term loss and damage refers
to the “adverse impacts of human-induced climate change that cannot be avoided
by mitigation or adaptation, or that will not be avoided in the future by adaptation
due to insufficient resources”. 102 A main distinction can be made between economic
and non-economic loss and damage. Climate change hazards cause loss and dam-
age of, for example, resources, goods and services that are commonly traded in
markets. Examples include buildings and services such as telecommunications and
power. But those people who are affected also experience the loss of material and
non-material items that cannot be traded. Loss and damage can be caused by ex-
treme weather events as described in this Index, but in order to form a complete
101
The Caribbean Catastrophe Risk Insurance Facility 2019
102
Mace/Verheyen 2016. Mace, M./ Verheyen, R. 2016: Loss, Damage and Responsibility after COP21: All Options Open for the
Paris Agreement. In: Review of European, Comparative & International Environmental Law 25 (2), 197-214.
23Global Climate Risk Index 2021 GERMANWATCH
picture of the climate risk, slow-onset processes (rises in sea levels, glacier melting,
etc.) also need to be included. 103
In the international climate policy process, the topic of loss and damage is highly
controversial. Particularly the question of how financing to deal with such losses
and damages should be provided has so far remained unanswered (see Chapter 3).
3 Status Quo of International
Resilience Policy
The Climate Risk Index 2021 clearly shows that the effects of climate change are
already being felt worldwide and that increasingly intense and frequent extreme
weather events are a major driver of disaster losses. However, the Index also shows
that developing countries are particularly affected by the impacts of climate
change. Eight out of the ten countries most affected by the quantified impacts of
extreme weather events in 2019 belong to the category low to lower-middle in-
come. Five of them fall into the category Least Developed Countries. A similar pic-
ture emerges from the long-term index: Six of the ten countries most affected from
2000 to 2019 belong to the category low to lower-middle income. Climate impacts,
such as increasingly intense and frequent extreme weather events, affect people in
developing countries disproportionately, threatening lives and livelihoods, human
security and sustainable development. These countries, and especially the most
vulnerable parts of the population, are particularly affected by the damaging effects
of a hazard (as, for example, their livelihood depends on fewer assets) and have a
lower coping capacity (e.g. they cannot rely on savings to buffer the impacts and
may need more time to rebuild and recover).
Moreover, the year 2020 has demonstrated that these countries are vulnerable to a
variety of risks – Including climatic and geophysical hazards but also economic, so-
cial and health risks. The Covid-19 pandemic has led to an unprecedented human-
itarian crisis. This is a particular problem for developing countries, as disaster man-
agement systems are often overburdened and the already scarce emergency funds
have been exhausted. The World Bank estimates that the Covid-19 crisis could
plunge up to an additional 115 million people into extreme poverty in 2020 – and
103
Schäfer et al. 2021
24Global Climate Risk Index 2021 GERMANWATCH
this number could rise to 150 million in 2021. 104 Moreover, the Covid-19 crisis, similar
to the climate crisis, will lead to a higher indebtedness of vulnerable countries. 105
The Covid-19 pandemic has reminded us of the fact that both risk-affectedness and
vulnerability are systemic and interconnected. 106 A recent study by the Red Cross
Red Crescent Movement shows that of the 132 extreme weather events that oc-
curred between January and September 2020, 90 overlapped with the Covid-19
pandemic. Globally, 51.6 million people had to simultaneously deal with the im-
pacts of floods, droughts or storms whilst trying to contain the pandemic and deal
with its consequences. It is therefore important to strengthen the resilience of the
most vulnerable against different types of risk (i.e. climatic, geophysical, economic
and health-related risks).
Comprehensive disaster risk reduction strategies can play a key role in increasing
resilience to different types of risks. As part of its global targets, the Sendai Frame-
work 107 aims to substantially increase the number of countries with national and
local disaster risk reduction strategies by 2020. Only 40 of the 195 countries of the
Sendai Framework have achieved this so far. Looking at the Bottom 10 of both the
annual and the long-term Climate Risk Index, Japan is the only country which ap-
pears on both these lists and which has also achieved this goal. Other Bottom 10
countries like Malawi, India, Niger, the Philippines, and Nepal are working on na-
tional and local disaster risk reduction strategies; for the other countries, no specific
details were available.
Adaptation efforts also help to mitigate climate impacts. In 2019, eighteen countries
completed and submitted their National Adaptation Plans (NAPs) to the Secretariat
of the United Nations Framework Convention on Climate Change (UNFCCC), five of
them being Least Developed Countries (LDCs) and four being Small Island Develop-
ing States (SIDS). Moreover, at least 120 developing countries were in the process of
formulating and implementing the NAPs. 108
104
World Bank 2020c
105
This is true for many different countries. Mozambique was forced to take US$ 118 million in debt for responding to the
cyclone-induced damages due to the lack of own funds (as the sixth poorest country worldwide) and support (see CARE et
al. 2019). AOSIS raised awareness for the difficult situation SIDS: “Small Island Developing States are sinking: not just from
climate-induced sea level rise and other impacts, we are sinking in debt,” (see https://www.aosis.org/wp-content/up-
loads/2020/09/AOSIS-Media-Briefing-Press-Release.pdf)
106
Künzel/Schäfer 2020.
107
The Sendai Framework aims to achieve the substantial reduction of disaster risk and losses in lives, livelihoods and health
and in the economic, physical, social, cultural and environmental assets of persons, businesses, communities and countries
over the next 15 years.
108
United Nations 2020
25You can also read