Simulating the Potential Impacts of COVID-19 School Closures on Schooling and Learning Outcomes - World Bank Document
←
→
Page content transcription
If your browser does not render page correctly, please read the page content below
Public Disclosure Authorized

 Policy Research Working Paper 9284
Public Disclosure Authorized

 Simulating the Potential Impacts
 of COVID-19 School Closures
 on Schooling and Learning Outcomes
 A Set of Global Estimates
Public Disclosure Authorized

 João Pedro Azevedo
 Amer Hasan
 Diana Goldemberg
 Syedah Aroob Iqbal
 Koen Geven
Public Disclosure Authorized

 Education Global Practice
 June 2020
Policy Research Working Paper 9284

 Abstract
 School closures due to COVID-19 have left more than a bil- or $1,408 in yearly earnings. In present value terms, this
 lion students out of school. This paper presents the results amounts to between $6,472 and $25,680 dollars in lost
 of simulations considering three, five and seven months of earnings over a typical student’s lifetime. Exclusion and
 school closure and different levels of mitigation effective- inequality will likely be exacerbated if already marginalized
 ness resulting in optimistic, intermediate and pessimistic and vulnerable groups, like girls, ethnic minorities, and
 global scenarios. Using data on 157 countries, the analysis persons with disabilities, are more adversely affected by the
 finds that the global level of schooling and learning will school closures. Globally, a school shutdown of 5 months
 fall. COVID-19 could result in a loss of between 0.3 and could generate learning losses that have a present value of
 0.9 years of schooling adjusted for quality, bringing down $10 trillion. By this measure, the world could stand to lose
 the effective years of basic schooling that students achieve as much as 16 percent of the investments that governments
 during their lifetime from 7.9 years to between 7.0 and make in the basic education of this cohort of students. The
 7.6 years. Close to 7 million students from primary up to world could thus face a substantial setback in achieving
 secondary education could drop out due to the income the goal of halving the percentage of learning poor and be
 shock of the pandemic alone. Students from the current unable to meet the goal by 2030 unless drastic remedial
 cohort could, on average, face a reduction of $355, $872, action is taken.

 This paper is a product of the Education Global Practice. It is part of a larger effort by the World Bank to provide open access
 to its research and make a contribution to development policy discussions around the world. Policy Research Working Papers
 are also posted on the Web at http://www.worldbank.org/prwp. The authors may be contacted at jazevedo@worldbank.org.

 The Policy Research Working Paper Series disseminates the findings of work in progress to encourage the exchange of ideas about development
 issues. An objective of the series is to get the findings out quickly, even if the presentations are less than fully polished. The papers carry the
 names of the authors and should be cited accordingly. The findings, interpretations, and conclusions expressed in this paper are entirely those
 of the authors. They do not necessarily represent the views of the International Bank for Reconstruction and Development/World Bank and
 its affiliated organizations, or those of the Executive Directors of the World Bank or the governments they represent.

 Produced by the Research Support Team
Simulating the Potential Impacts of COVID-19 School Closures on Schooling and Learning
 Outcomes: A Set of Global Estimates*

 João Pedro Azevedo, Amer Hasan, Diana Goldemberg, Syedah Aroob Iqbal, and Koen Geven ♦

JEL Classification Codes: O12, O15, I21, I24, I25
Keywords: COVID-19, Learning Losses, Schooling

*
 This work has been developed under the technical guidance of Omar Arias, Harry Patrinos, and Cristian Aedo, and
the overall supervision of Jaime Saavedra. The authors would like to thank participants of the Quality Enhancement
Review seminar where a preliminary version of this work was presented. We are also grateful to those who attended
three internal World Bank clinics on the methodology and accompanying excel tool. We would like to thank Samer
Al-Samarrai, Kehinde Funmilola Ajayi, Marta Carnelli, Cristobal Cobo, Paul Corral, Michael F. Crawford, Asli
Demirguc-Kunt, Roberta Gatti, Caren Grown, Igor Kheyfets, Aart Kraay, Eliana Carolina Rubiano Matulevich, Rafael
E. De Hoyos Navarro, Julia Liberman, Misha Lokshin, Reema Nayar, Monica Yanez Pagans, Adelle Pushparatnam,
Halsey F. Rogers, Yevgeniya Savchenko, Renaud Seligmann, Venkatesh Sundararaman, Ivan Torre, and Ingo
Wiederhofer for comments on earlier stages of this work. Pedro Cerdan-Infantes, Jose Cuesta, Deon Filmer, Dilip
Parajuli, and Waly Wane provided thoughtful peer review comments. In addition, conversations with a growing
number of World Bank country teams from Brazil to the Western Balkans to Pakistan and Vietnam have helped
improve the tool. The findings, interpretations, and conclusions expressed in this paper are entirely those of the
authors. They do not necessarily represent the views of the International Bank for Reconstruction and
Development/World Bank and its affiliated organizations, or those of the Executive Directors of the World Bank or
the governments they represent.
♦
 Education Global Practice, World Bank.
Highlights
The simulation representing an intermediate scenario – where schools are closed for 5
months, mitigation effectiveness is moderate, and returns to schooling are 8% per year in all
countries – suggests that:
 • COVID-19 could result in a loss of 0.6 year of schooling adjusted for quality, bringing
 down the effective years of basic schooling that children achieve during their schooling
 life from 7.9 years to 7.3 years.
 • Put another way, in the absence of effective remedial action, each student from today’s
 cohort in primary and secondary school could face, on average, a reduction of $872 in
 yearly earnings. This is approximately equivalent to $16,000 over a student’s work life at
 present value.
 • Without effective remedial policy action when students return to school, approximately
 $10 trillion of lifecycle earnings (at present value in 2017 PPP) could be lost for this cohort
 of learners – because of their lower levels of learning, their lost months in school closures,
 or their potential for dropping out of school. This is approximately 16% of the investments
 governments have made in this cohort’s basic education.
 • While school closures could lead to falling test scores on average, in the intermediate
 scenario there may be as much as a 25% increase (from 40% to 50%) in the share of lower
 secondary-aged children who are below the minimum level of proficiency. This highlights
 the importance of increasing the readiness of education systems to teach children at the
 right level.
 • Before the COVID-19 outbreak, the world was already tackling a learning crisis, with 53
 percent of children in low- and middle-income countries living in Learning Poverty –
 unable to read and understand a simple text by age 10. Unless drastic remedial action is
 taken, the effects simulated here will likely create a substantial setback to the goal of
 halving the percentage of learning poor by 2030.
 • The combination of being out of school and the loss of family livelihoods caused by the
 pandemic may leave girls especially vulnerable and exacerbate exclusion and inequality –
 particularly for persons with disabilities and other marginalized groups.
 • These simulated effects should be used to inform mitigation, recovery, and “building back
 better” strategies. This includes effective remote learning strategies to provide learning
 continuity while schools are closed using multiple education technology solutions (radio,
 television, mobile phones, digital/online tools, and print) with support to students, teachers
 and parents. Governments should also implement appropriate actions to ensure the safe
 reopening of schools consistent with each country’s overall COVID-19 health response 1,
 and to accelerate learning by building more equitable and resilient post-COVID education
 systems, that enable children to learn continuously both in schools and at home.

1
 Framework for Reopening Schools. Available online at https://www.unicef.org/media/68366/file/Framework-for-
reopening-schools-2020.pdf.
1. Introduction
The world is undergoing the most extensive school closures ever witnessed. To combat COVID-
19, more than 180 countries mandated temporary school closures, leaving, at its peak in early
April, close to 1.6 billion children and youth out of school. By the end of May 2020, 20 school
systems had opened partially, and about 1.2 billion students remained out of school. 2 Most
countries are projecting school closures to last through the summer (or winter break). The
education system is witnessing an extraordinary twin shock: school closures needed to fight the
pandemic and a widespread global economic recession. 3 Unemployment numbers are on the rise,
family incomes are falling, and government fiscal space is shrinking. Moreover, this shock is being
observed simultaneously across the planet 4, and most likely, international aid budgets will also be
affected.
This crisis is making a dire situation worse. Before COVID-19 shut schools down, the world was
already in the midst of a global learning crisis that threatened countries’ efforts to build human
capital – the skills and know-how needed for the jobs of the future. Data from the World Bank and
UNESCO showed that 53% of children at the end of primary in low- and middle-income countries
suffer from learning poverty (World Bank, 2019). And progress in reducing it was far too slow to
meet the aspirations laid out in SDG4 – to ensure inclusive and equitable quality education.
At the rate of improvement that prevailed prior to COVID-19, about 43% of children will still be
learning-poor in 2030. Figure 1 shows that prior to COVID-19, if countries were to reduce learning
poverty at a more ambitious yet achievable pace, the global rate of learning poverty could drop to
27%. This would have meant on average nearly tripling the then-prevalent global rate of progress.

2
 World Bank. Education Systems’ Response to COVID-19. Brief. May 10, 2020.
3
 World Bank, 2020b
4
 As per the latest World Bank Global Economic Prospects (World Bank, 2020b), as many as 90% of the 183
economies it examined are expected to suffer from falling levels of gross domestic product (GDP) in 2020, even more
than the 85% of nations suffering from recession during the Great Depression of the 1930s.

 2
Figure 1: The global target for halving Learning Poverty was premised on country systems
improving their ability to deliver learning

Source: Authors’ calculations using data from World Bank, 2019.
This paper presents simulations of the potential range of impacts school closures might have on
schooling and learning, in both the short term and the long term. It takes into account some of the
initial estimates of the potential impact that the ensuing economic recession might have on
household incomes – and thus on children’s ability to continue their schooling – and makes
assumptions about how long school closures might last.
These simulations use two global datasets with levels of learning today, namely, the World Bank’s
Learning Adjusted Years of Schooling (LAYS) component of the Human Capital Index (HCI)
database and the Organization for Economic Cooperation and Development’s (OECD) Programme
for International Student Assessment (PISA). 5 We combine information about school productivity
in terms of learning gains between grades 6 with assumptions on how long school closures might
last (drawing on the most-recent available information), the reach of remote learning mitigation
measures, and the expected effectiveness of mitigation strategies. We use data on global growth
projections (as of early June 2020) to simulate the effects of income shocks on schooling.
Given that the COVID-19 situation is on-going, most of these data are being updated on a rolling
basis. The range of estimates presented in this paper is subject to the uncertainty inherent in the
situation and will be revised as more information is made available. 7 The paper acknowledges this

5
 The 2018 HCI database is used and contains 157 countries, or 97 of the world population aged 4-17. For PISA, most
recent available data from PISA and PISA-D are used, and this combined database contains data on 93 economies,
which represent 75% of the early secondary students of the world (for more information on the population coverage,
by regions, income levels, and World Bank lending categories, please see Table A.3.9 in the Annex).
6
 As will be discussed later, this measure is net of any school summer loss.
7
 All dollar amounts are expressed in 2017 PPP values.

 3
fluid situation by presenting a range of estimates that come from simulations based on three
scenarios: 8
 1. Optimistic – schools are closed only for 3 months of a 10-month school year, and the
 effectiveness of mitigation measures put in place by governments (such as remote learning)
 is high.
 2. Intermediate – schools are closed for 5 months, and the mitigation measures have a middle
 level of effectiveness.
 3. Pessimistic – schools are closed for 7 months, and the mitigation measures have low levels
 of effectiveness.
The goal is to provide a reasonable range of estimates that can help ministries of education and
their development partners plan recovery strategies when schools reopen. Such strategies, if well
planned and executed, can prevent these learning losses from becoming permanent. 9
This paper differentiates between the mitigation strategies that countries have put in place during
school closures and the steps they may take to provide compensatory education to students once
schools open. It does not focus on remediation, and the results here should be seen as evidence of
its importance. 10 The policy responses for the various phases of coping with the pandemic,
transitioning back to open schools, and having schools operating are laid out well in Rogers and
Sabarwal (2020).
The paper is structured as follows. Section 2 provides a brief review of relevant literature. Section
3 describes the analytical framework and empirical methodology. Sections 4 and 5 present the
results and discuss the main findings, respectively. Section 6 concludes. Methodological details
and a detailed description of the main indicators are outlined in the annexes.
 2. Literature Review
Related simulations of the impact of COVID-19 on educational outcomes
A number of teams have recently undertaken analysis of likely learning losses stemming from
COVID-19. Most have focused on the United States and other high-income countries 11 but
estimates have also been developed for a selection of low- and middle-income countries. 12 These
analyses have focused on a range of grades and subjects. The effects of these analyses have mostly

8
 In all three scenarios the paper utilizes a conservative estimate of school dropouts based exclusively on expected
losses to national income derived from global macro projections such as the World Bank Macro Poverty Outlook
(MPO) from June 2020. These dropout-income elasticities are computed for children 4-11 as well as for children 12-
17. This dropout effect would likely be higher if it were to include non-income related channels such as school safety
concerns and school disengagement. However, available data do not allow either of these channels to be quantified
convincingly at a global level. We are also making assumptions on availability, take-up, and effectiveness of remote
learning, which are based on the scarce literature on the effectiveness of remote learning and household information
on access of alternative learning modalities such as television and internet using the PISA, DHS, and MICS household
questionnaire. In addition, we are also making assumptions regarding the expected learning observed in one school
year, these are made based on the literature on school productivity, unexpected school closures, and summer learning
loss (for more information see Annex A.1).
9
 See for instance the policy response options described in Rogers and Sabarwal, 2020.
10
 Although much of the same framework used here would still hold, allowing for a future extension to include an
explicit component of remediation.
11
 Kuhfeld and Tarasawa (2020), Kuhfeld et al. (2020) and Dorn et. al (2020).
12
 Cummiskey et al. (2020).

 4
been cast in terms of lost schooling attainment or lost learning or losses to earnings or gross
domestic product. 13 This paper builds on these analyses by not only looking at the impact of school
closures but also considering the channel of household income loss and its effects on school
dropout. In addition, this paper examines not only what might happen to schooling and learning
on average but also what might happen to the shape of the learning distribution. We express these
estimated impacts in monetary terms, both as estimated individual losses and as total economic
loss of future earnings at present value.
Efforts to mitigate school closures and their effectiveness
Students around the world are having very disparate experiences as schools are closed. Education
systems try to mitigate this by providing remote learning. 14 From Kenya 15 to the United Kingdom16
to Australia 17 evidence is slowly emerging of a great deal of inequality both within and across
countries in the supply of, access to, and effectiveness of mitigation strategies. 18 Rapid telephone
surveys have been fielded in Ecuador to unpack not only the remote-learning experience, but also
to shed light on student’s time use and mental health. 19
While mitigation strategies in the time of COVID-19 are often referred to as remote learning – it
is important to note that in reality what many school systems rolled out was emergency response
teaching. 20 This in turn was delivered via a variety of modalities – such as via paper-based
homework sheets, radio, TV, mobile phones, text messages, and the internet, both instructor-
directed and self-paced.
The evidence on the effectiveness of remote learning in the past appears mixed at best. In the
United States, studies find everything from unambiguously positive (US DoE, 2010 and Allen et
al. 2004) to negative and null effects (Bernard et al, 2004). Kearney and Levine (2015) find
evidence to suggest that exposure to Sesame Street when it was first introduced improved school
readiness, particularly for boys and children living in economically disadvantaged areas but that
the impact on ultimate educational attainment and labor market outcomes was inconclusive.
Different studies consistently find that digital technology is associated with moderate learning
gains. One lesson learned from those studies is that technology should supplement teaching, rather
than replace it. In particular, technologies are unlikely to bring changes in learning directly, but
some have the potential to enable changes in teaching and learning interactions (Education
Endowment Foundation, 2019). Effective use of digital technology is driven by learning and
teaching goals rather than a specific technology. New technology does not automatically lead to
increased attainment. An important finding is that educational production does not appear to fit a
situation in which teachers and students can simply substitute between computer assistive learning
and traditional learning at any level with the same result (Bettinger et al., 2020). Students’

13
 Psacharapoulos et al. (2020).
14
 In this paper mitigation refers to what governments are doing while schools are closed. Remediation refers to what
governments might do once schools reopen.
15
 Kihiu (2020).
16
 Andrew et al. (2020).
17
 Baker (2020).
18
 Carvalho and Hares (2020).
19
 Asanov et al. (2020).
20
 Hodges et al. (2020).

 5
motivation to use technology does not always translate into more effective learning, particularly if
the use of technology and the desired learning outcomes are not closely aligned.
In developing country contexts, 21 researchers have examined the effectiveness of remote learning
in Anglophone Africa. Bosh (1997) presents an assessment of interactive radio instruction based
on 23 years of operational history. Muralidharan et al. (2019) find that well-designed technology-
aided personalized instruction programs can improve productivity in delivery of education. 22
When integrating adaptive technology at a national scale, especially in a context where the basic
enabling conditions have been addressed, it is possible to find promising results. A recent national
study conducted in Uruguay shows a positive effect of 0.20 standard deviations in the gain of
mathematics learning among children who had used an adaptive math platform compared with
students who had not. In addition, higher effects were observed in students from lower
socioeconomic status (Perera & Aboal, 2019). A common underlying theme in all studies is that
there are many moving pieces that must be in place and well-aligned for remote learning to deliver
on its promise.
COVID-19 has forced governments to rapidly roll-out or scale-up remote learning programs, and
it is unlikely that the ideal pre-conditions for such a rapid roll-out were in place across the world.
As such our estimations rely on assumptions on the effectiveness of alternative learning modalities
that governments are providing during school closures.
While we reference this literature, it is important to point out that this body of work did not assess
the impact of interventions rolled out at full scale as an emergency response. This literature also
did not measure the effectiveness of these programs at a time when the welfare and emotional
wellbeing of families were deteriorating as rapidly as we are experiencing with the COVID-19
crisis. The twin shocks to health and the economy are unprecedented. For instance, we know that
this crisis has affected the socio-emotional and mental well-being of families. Domestic abuse
charities have reported a spike in calls made to helplines since lockdown measures were announced
(Nicola et al., 2020; Alradhawi et al., 2020). Student learning is highly likely to be further
adversely impact due to this socio-emotional effect of COVID. The twin shocks to health and the
economy are unprecedented.
What do we know about disruptions to schooling and their effects on learning?
Variation in instructional time – be it planned changes in the school day 23 or unscheduled
closings 24 – have been documented to have an effect on student performance. The empirical
literature has documented the impacts that teacher strikes 25 and crises ranging from pandemics26
to famines 27 and floods 28 to hurricanes 29 and earthquakes 30 and to the Asian financial crisis31 and

21
 Murphy and Zhiri, eds. (1992).
22
 Muralidharan et al. (2019)
23
 Cattaneo et al. (2016).
24
 Marcotte and Hemelt, (2008).
25
 Belot and Webbink (2010), Wills (2014), and Jaume and Willén (2019).
26
 Meyers and Thomasson (2017).
27
 Dercon and Porter (2014).
28
 Thamtanajit (2020).
29
 Sacerdote, (2012).
30
 Andrabi et al. (2020) and Ceyhan and Ceyhan (2007).
31
 Cameron (2009).

 6
2008/09 recession 32 have had on learning and labor market returns in the short and long term
respectively. School enrollment and achievement can fall sharply. Any recovery can take many
years, 33 and adolescent girls stand to be particularly adversely affected 34 – as do marginalized
groups.
As COVID-19 plays out much of this looks poised to be repeated – particularly in countries with
the weakest safety nets. On the demand side, income shocks could lead families to put their
children to work. Many may never go back to school. This is a particular problem for girls, persons
with disabilities, and marginalized groups. 35 On the supply side, governments are showing signs
of becoming cash strapped as they attempt to bolster funding to the frontlines of a nationwide
disaster. In countries where many students are enrolled in low-fee private schools, the income
shock to households coupled with shrinking possibilities for government support could put their
very survival at risk. 36 As families cannot afford any fees, pressure on a cash strapped public
system increases.
School closures may lead to a jump in the number of dropouts and an erosion of learning
Increased dropout rates are one important channel linking emergency school closures and other
educational disruptions to losses in average lifetime educational attainment. In general, as children
age, the opportunity cost of staying in school increases. This may make it harder for households
to justify sending older children back to school after a forced interruption, especially if households
are under financial stress. In the 1916 polio epidemic, researchers hypothesize that children of
legal working age (13 in most U.S. states at that time) were more likely to leave school
permanently following epidemic-related shutdowns. Such effects are not restricted to public-health
emergencies. Reduced enrollment rates were also observed in Indonesia after economic adjustment
in the 1980s. 37
Evidence indicates that any interruption in schooling, including scheduled vacations, can lead to a
loss of learning for many children. Cooper et al. (1996) find that, on average, U.S. students’
achievement scores decline by about a month’s worth during the three-month summer break. Kim
and Quinn (2013) find that students from low income background are particularly affected by
summer learning loss. Similarly, Alexander, Pitcock, and Boulay (2016) find that around 25 to 30
percent of learning achieved over the school year is typically lost during summer holiday periods.
Moreover, interruptions during critical schooling stages of life can lead to much worse outcomes.
For example, an interruption during third grade, when students are mastering how to read, may
lead to higher dropout rates and worse life prospects including poverty. 38
The long-term effects of COVID-19 are unknown, but past disruptions suggest they will be large
and lasting
Beyond estimates of immediate impacts, the literature also provides some insights on the long-
lasting impacts of shocks and resulting parental concerns around school safety. Meyers and

32
 Shores and Steinberg (2017).
33
 World Bank (1998).
34
 Bandiera et al. (2019).
35
 McClain-Nhlapo, (2020).
36
 Yousafzai, (2020).
37
 World Bank (1998)
38
 Lloyd (1978); Hernandez (2011)

 7
Thomasson (2017) document that even after schools reopened, many parents were reluctant to let
their children attend. The authors found that young people who were aged 14-17 during the
pandemic, later showed lower overall educational attainment compared to slightly older peers.
Similarly, four years after the 2005 earthquake in Pakistan, children who lived near the fault line
and were of school age performed worse in school. 39 What makes this result more worrisome is
the fact that households who lived close to the fault line received considerable cash compensation
and after 4 years adult height and weight outcomes or infrastructure near and far from the fault
line showed no discernible differences. On the channels, the authors argue that school closures
alone could not have accounted for the loss in test scores, so that children in the earthquake affected
regions learned less every year after returning to school, and raise the hypothesis that every child
had to be promoted in the new school year, and if teachers taught to the curriculum in the new
grade, they could have fallen farther behind, aligned with the literature which suggests that
teaching at a higher level compared to where children were reduces how much children learn. 40
 3. Analytical Framework and Empirical Methodology
The effects simulated here are forward looking and do not consider any government response to
remediate the negative effects of school closures once lockdowns lift and schools reopen. These
simulations can be used to help motivate the importance and need for an education sector response
strategy and should not be used to guide decisions for reopening schools.
As articulated in the UNESCO, UNICEF, the World Food Programme, and the World Bank
Framework for reopening schools, “[s]chool reopenings must be safe and consistent with each
country’s overall COVID-19 health response, with all reasonable measures taken to protect
students, staff, teachers, and their families.” 41
We expect that some of the questions that can be addressed by these simulations are:
 • What is the expected learning loss due to school closure and income shock, according to
 different mitigation assumptions?
 • What is the expected learning loss at early secondary that can be attributed to school
 closures, as measured by PISA score and PISA level?
 • What are the expected distributional effects of school closures on PISA scores by welfare
 quintile?
 • What are the expected impacts of school closures according to different assumptions on
 how this shock will affect the learning distribution?
 • What are the life-cycle earnings effects of this shock?
It is important to keep in mind that:
 • There is no precedent for pandemic shocks of this size or for a twin shock of extended
 school closure coupled with a sharp global economic recession
 • In systems with a severe learning crisis pre-COVID, learning losses in terms of mean scores
 will not necessarily be high.

39
 Andrabi, Daniels, and Das (2020)
40
 Banerjee et al. (2016)
41
 Framework for Reopening Schools. Available online at https://www.unicef.org/media/68366/file/Framework-for-
reopening-schools-2020.pdf.

 8
• Income shocks mostly affect enrolment of older children –those in junior secondary or
 higher.
 • The choice of measure is highly relevant. In countries with very high share of children
 below a minimum proficiency level (MPL), such as Learning Poverty and PISA Level 2,
 the effect of this shock might change learning scores but does not translate directly to
 Learning Poverty; in those cases, it is likely that most of the impact of COVID will be on
 children who were already below the MPL threshold; in those cases, a distributional
 sensitive measure, such as a learning gap or learning severity, in the spirit of FGT1 and
 FGT2, is likely to be more meaningful.
 • We also do not make any adjustment for when in the school year the shock occurs (i.e. at
 the beginning vs the end of the school year). This will dramatically affect each individual
 country impact, as in the northern hemisphere this shock hit in the final quarter or bimester
 of the school year. In the southern hemisphere, it hit at the beginning of the school year
 which might impact differently the number of months lost. Calendars though vary a lot
 from country to country.
3.1 Analytical framework
Conceptually, we think about the expected learning loss in two ways, (1) as learning that will not
take place while schools closed, which is directly linked to schooling adjusted for quality, and (2)
as the already acquired learning that will be lost or forgotten when students lose their engagement
with the educational system. In addition, our framework also captures the impact of school
dropouts through the income shock channel. 42
For purposes of illustration, we conceptualize the current cohort of students 43 as a panel of students
who we observed just before the crisis, and whom we can observe again the moment that schools
reopen. Figure 2 below shows the learning path of the current cohort of students. We assume that
for a given level of quality of education, learning (l), for this cohort of students, is a linear function
of the amount of time t spent at school. The length of school closures (s), assuming no mitigation,
will reduce the amount of time students will be exposed to learning opportunities from the
educational system. Thus if schools close between t1 and t2, and assuming no mitigation, we no
longer expect any new learning to take place 44, and at t2, the student will be in principle at l2’.
However, this is not the whole effect. We expect that as students disengage from the educational
system, part of the student’s stock of learning (l1) will be forgotten. This loss will bring students
from l2’ to l2’’. So, in Figure 2, the area of the triangle A (bounded by l1, l2 to l2’) corresponds to the
learning that will not take place while schools are closed s (or t2-t1), while the triangle B (bounded
by l1, l2’, and l2’’) corresponds to the learning that will be lost due to school disengagement and

42
 This second point is in line with the literature on summer ‘learning loss’ cited above, and the Forgetting Curve
which suggests much of the what is taught during the school year can be forgotten, unless reinforced during the
summer. The Forgetting Curve pioneered by psychologist Ebbinghaus in the 1880s, measures how much we forget
over time, and shows that without reinforcement, information can be quickly forgotten. Ebbinghaus experiments have
recently been replicated successfully by Murre and Dros (2015), suggesting that his insights hold true today.
Extrapolating from his findings to summer learning, we would expect students to forget a large part of what they have
learned during the summer, unless that knowledge is used and reinforced during the summer break.
43
 This cohort can be students at any particular grade level, given that schools have been typically closed across all
grade levels.
44
 Or at the very least, not at the same rate as when schools remained open, in which case the line may also slope
slightly upwards.

 9
dropouts 45. The learning loss due to each one of these mechanisms will be a function of how
effective mitigation strategies might be.
To provide a measure of learning loss across the entire student cohort, we summarize the effects
using the concept of Learning Adjusted Years of Schooling (LAYS). Following Filmer et al.
(forthcoming), we conceptualize countries or school systems as having a certain level of learning
outcomes, which can be represented numerically as LAYS. LAYS are the product of the amount
of schooling that children typically reach and the quality of that schooling, relative to some
benchmark. Although this benchmark can be constructed in different ways, we follow the approach
that sets the benchmark that takes a proficiency level in international student assessments (Kraay,
2018).
Figure 2: Analytical framework for an individual student

 l2

 A
 l1 l2'

 B
 l2''

 t2 t
 t1

LAYS represent the distribution of the entire cohort of students by construction, given that LAYS
represent the learning levels achieved by a schooling system of an entire country. In tandem, our
results from the LAYS figures will represent a loss on average, even if the typical cohort of
students will have made some gains throughout the past school year, or even during this period of
school closures. The intuition behind this is that all students would have, on average, needed to
learn a given amount for a country or school system’s LAYS to remain at the same level as before;
and that in the absence of mitigation, all those same students will also forget some of the learning
they have accumulated.
3.2 Empirical methodology
In this paper. we conduct three simulation exercises. The first uses the Learning Adjusted Years
of Schooling (LAYS) measure. 46 This is one of the components of the World Bank Human Capital
Index, launched in 2018. 47 In many respects, this is our preferred simulation. One, it is the only

45
 For the purposes here, we do not discuss the long-term effects of these dropouts on learning, which may very well
be more dramatic.
46
 Filmer et al. (forthcoming).
47
 Kraay (2018).

 10
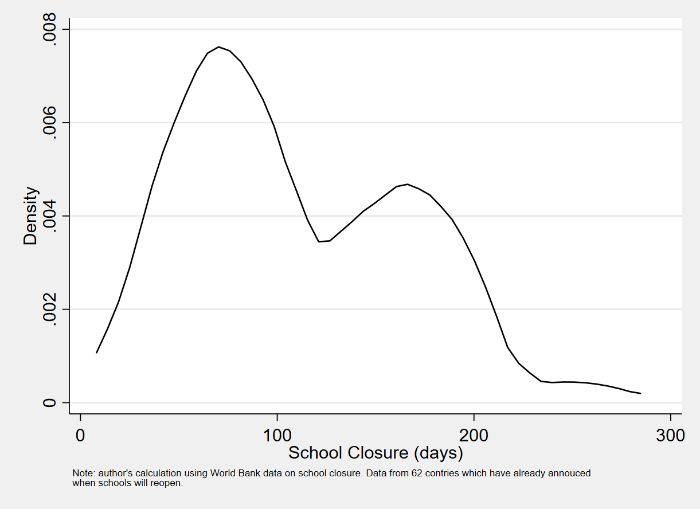
simulation that encompasses all levels of basic education, since the LAYS is designed to capture
the education life of students from 4 to 17 years of age. Two, it has the largest country coverage,
with 157 countries and 97% of the world’s population aged 4–17. And three, it combines access
(including dropout rates) with quality.
The second simulation exercise focuses exclusively on the expected learning losses at early
secondary, as measured by PISA and defined in terms of an average PISA score. The third, and
last, simulation translates the impact of a PISA mean score shock into the share of children
performing below the minimum proficiency level, as defined by OECD and UIS in the context of
the SDG 4.1.1c. 48
One important element in these simulations is the possibility to present results in monetary terms.
In order to do that we use expected earnings information from ILO (2020) and World Bank
(2020c), and the expected long run return to education. We also compute aggregate results by
bringing all expected earnings losses to their present value, assuming a work life of a 45 years and
a 3% discount rate. In order to make these results more realistic, we also adjust the aggregate loss
by the expected adult survival rate (following the World Bank HCI), and the fact that not all
workers will always be in gainful employment (following the measure of Human Capital
Utilization described in Pennings, 2019).
We propose three global scenarios for the construction of our lobal simulation (Table 1). In the
optimistic scenario, we assume that the length of school closures (s), as defined above, is an
average of 3 months. In the intermediate scenario, we expect schools to be closed for 5 months. In
the last, and most pessimistic scenario, we expect schools to be closed for 7 months, or 70% of the
school year.
These scenarios are aligned with what we have been observing with the existing data on school
closures from both UNESCO and the World Bank. As of June 8h, school systems were closed on
average 79 days, or 2.6 months 49 (Figure 3). If we include in this school closure estimate the
announcement of several countries that they will only reopen their schools by August or
September, the average expected school closure will increase to 110 days, or 3.6 months, and those
are mostly northern hemisphere countries (Figure 4). 50 In the optimistic scenario, we are not
assuming that schools might close again, nor that the summer learnings loss will be significantly
larger than usual. Our intermediate scenario, with an average 5 months of school closure, and our
pessimistic scenario with 7 months of school closure extends the length of the expected school
closure.

48
 PISA defines minimum reading proficiency as a score below level 2 which is 407.47 points.
49
 School closure days were only counted until June 8th, 2020, using the UNESCO school closure monitoring database,
available at https://en.unesco.org/sites/default/files/covid_impact_education.csv (as of June 8th 2020).
50
 3.6 months of school closures includes a subset of 62 economies which have already reopened their schools, or
announced a date in which their educational system will be re-open; the 2.6 months average school closures is the
measure of actual number of days systems have been closed until June 8th, 2020. In this later case, the 150 economies
in which schools are still closed, were censored at June 8th.

 11
Table 1: Parameters for Global LAYS estimates and scenarios
Parameters by income level LIC LMC UMC HIC
A. Learning gains or school productivity (in HLO points/year) 20 30 40 50
Optimistic Scenario
 B1. School closure (share of a school year) 30% 30% 30% 30%
 C1. Mitigation effectiveness (0 to 100%) 20% 28% 40% 60%
 D1. HLO decrease (points) = A*B1*(1-C1) 4.8 6.5 7.2 6.0
Intermediate Scenario
 B2. School closure (share of a school year) 50% 50% 50% 50%
 C2. Mitigation effectiveness (0 to 100%) 10% 14% 20% 30%
 D2. HLO decrease (points) = A*B2*(1-C2) 9.0 12.9 16.0 17.5
Pessimistic Scenario
 B3. School closure (share of a school year) 70% 70% 70% 70%
 C3. Mitigation effectiveness (0 to 100%) 5% 7% 10% 15%
 D3. HLO decrease (points) = A*B3*(1-C3) 13.3 19.5 25.2 29.8
Macro Poverty Outlook* (GDP per capita growth %) [g] -2.5 -3.3 -5.0 -4.4
Notes: (*) Macro Poverty Outlook June 8th 2020 update (https://www.worldbank.org/en/publication/macro-poverty-outlook),
with the regional average imputed if no country value was available for 2020. For robustness we have also ran the
simulation using MPO Private Consumption per capita and IMF/WEO GDP per capita projections

 Figure 3: Empirical distribution of school Figure 4: Empirical distribution of school
 closures for 211 economies, truncated at closures for 62 economies that have
 June 8h 2020 announced their school reopening days

A second important assumption is the expected school productivity (p), or how much students are
expected to learn as they move from one grade to the next. These are made based on the literature
on school productivity, unexpected school closures, and summer learning loss (for more
information see Annex A.1). It is important to note that most countries were already experiencing
a learning crisis prior to COVID-19, and one of its symptoms is precisely that students were not
obtaining significant learning gains from the existing educational systems. For that reason, we
assume that learning gains will vary from 20 to 50 learning points depending on the country’s
income level, this is equivalent to 0.2 to 0.5 of a standard deviation. 51

51
 There is a vast literature documenting the heterogeneity of schooling productivity. In OECD countries, learning
gains on most national and international tests during one school year are between 0.25-0.33sd (Woessman, 2016). A

 12
A third set of assumptions are related to the effectiveness of mitigation (m) strategies. We assume
that remote learning is never as effective as classroom instruction. It is hard to keep children
engaged cognitively with all the distractions in the household, devices have to be shared between
siblings, and it can be hard for families to decipher television programming. Moreover, access to
a television or internet (the main channels of delivering remote learning) is highly unequal. We
also assume that the economic shock that families are experiencing will also have detrimental
effects on the ability of children to make effective use of any available mitigating strategies,
especially as family incomes drop, family and child food security worsen, and household stress
increases.
In our simulation, we bring together three elements, the government supply (or expected coverage)
of alternative education modalities (G), the ability of households to access (or take-up) these
alternative modalities (A), and the effectiveness of the alternative modalities (E). Building on
existing household surveys, such as the MICS, DHS, and other multitopic household surveys, we
were able to identify the share of households with access to internet, computer, mobile phones,
land lines, radio, and television (Table 2). This information helped us shape some of our main
scenarios. We assumed that all governments (G) were offering some type of alternative modality,
but household access (A) and the effectiveness (E) of these modalities were heterogenous
depending on the income of the country.
Table 2: Household access to technology

 Share of households possessing:
 mobile internet personal
 Income Level Indicator telephone radio telephone television access computer
 HIC share (%) 78.8 80.8
 countries 48 48
 UMC share (%) 92.1 51.2 18.7 83.3 41.2 43.5
 countries 12 12 12 12 41 42
 LMC share (%) 84 43.7 7 58.5 19 20.9
 countries 23 23 23 23 33 33
 LIC share (%) 74.8 49 3.1 34.8 6 6.6
 countries 24 24 24 24 20 21
 Column Average share (%) 81.8 47.3 7.8 53.9 43.8 45.3
 Column Total countries 59 59 59 59 142 144
Source: UNICEF as of May 28th 2020 (https://public.tableau.com/profile/unicefdata#!/vizhome/EduViewv1_0/home)
In many lower-income countries, online learning options have limited utility. Not only do many
households lack internet connections, but when available, these may not be fast enough for
downloading. 52 In addition, households may have no computer or, might not have a sufficient
number for the parents and children to use, or for multiple children to use. We use the information

similar range is observed in developing countries. Singh (2019) estimates a much higher productivity in Vietnam
(0.45sd) than in Peru (0.2sd), and intermediate values for India and Ethiopia. Jones (2017) estimates schooling
productivity of 0.2-0.3sd in Tanzania, Uganda, and Kenya. In Brazil, both states and municipalities have responsibility
for education within their jurisdictions, with the municipality being the dominant provider of primary education. For
Brazil, Azevedo, and Goldemberg (2020) estimate schooling productivity at the municipal level, finding a range of
0.04-0.56sd and an average of 0.3sd, also in line with the literature.
52
 1.5M bps are needed according to the EdTech team of the World Bank.

 13
on household access to technology (Table 1) to calibrate our assumptions on mitigation
effectiveness (Table 2).
If ICT in education policies lack the basic enabling factors (connectivity, access to devices, quality
content, and teacher training, monitoring, and support), it is more likely that teachers and students
will not have the minimum conditions to integrate the technology to support their learning. When
basic infrastructure is in place, the evidence shows promising results. For instance, a publication
from the Office of the European Union (2017) concludes:
 “Students from low socio-economic backgrounds tend to have fewer opportunities to
 access education, fewer chances of completing education, and lower educational outcomes,
 such as reflected in PISA [Programme for International Student Assessment] scores.
 Digital technologies may, in theory, help to reduce this gap, by enabling access to
 additional learning resources and facilitating pedagogical strategies that could be beneficial
 to the students. This is especially true if schools compensate for the limited access to and
 use of digital technologies that disadvantaged students typically have at home. Digital
 technologies can support the move from a teacher-centered model to a student-centered
 instructional approach. This may be of special benefit to students at risk of dropping out.
 Moreover, the use of computers can help to adjust levels of difficulty and learning speed
 to the capabilities of disadvantaged students” (Rodrigues and Biagi, 2017).
A successful remote learning strategy relies on multiple delivery approaches. COVID-19 has
exposed the digital divide and the differences that disproportionately impact poor countries and
poor communities within countries.
In no case do we expect the mitigation to fully compensate for school closures and the
accompanying learning losses. For high-income countries, mitigation effectiveness could range
from 15% to 60%, also reflecting both greater household access to technology and the expected
effectiveness of what is offered. In lower-middle and upper-middle income countries, the ability
of governments to mitigate this shock may be higher, ranging from 7% to 40%, since household
access to computers, the internet, and mobile phones are significantly better. In low-income
countries, we argue that the combination of low household access to computers and internet,
around 7 and 6 percent, respectively, and the low effectiveness of radio and television programs
in these countries will limit the governments’ ability to mitigate this shock in all scenarios. Our
simulations assume that mitigation effectiveness in low income countries could range from 5% to
20% -- approximately one-third of what we assume for high income countries.
Going forward, COVID-19 provides an opportunity for reimagining education, addressing
inequality, and reducing learning poverty. We have known that education and schools will need to
change to better prepare our children for the future and make sure that all children are learning.
COVID-19 has dramatically underscored the need for this change by exposing the fragility of
education systems and their inherent inequalities. The investments being made right now in remote
learning – for example, in multi-media content, in remote training and support of teachers, and in
remote learning assessment systems – are a launchpad for a new a more personalized and resilient
way of providing education.
In addition, we also expect that some of the loss will take place in terms of the total quantity of
education that students are expected to receive throughout their school life. If no action is taken,
the actual expected years of schooling among the student population should fall. In practice, this
might be hard to observe, as many countries are likely to adopt automatic grade promotion

 14
practices. Nevertheless, the actual amount of schooling of the student cohort affected by COVID-
19 will be compromised if no mitigation or remediation takes place. In addition, the economic
shock is likely to affect student drop out, and we should expect long term consequences.
We used microdata from the latest available household survey for 130 countries to estimate
country specific dropout-income elasticities using the observed cross-sectional variation between
educational enrollment and welfare. Following the HCI framework, we estimated this relationship
for pre-school and primary-age students (4-11) and secondary-age students (12-17) separately (for
more information see Annex A.2). If a country did not have a household survey, we used the
average values from the countries in the same income level classification. In alignment with the
existing literature, on average, older-age students seem to be more vulnerable to income shocks
than younger students. The patterns for high and upper middle income countries are distinct from
those of low- and lower-middle income countries.
The primary pathway for this is the income shock (γ) from reduced economic activity. Given the
dropout-income elasticity (d), this will lead to more families pulling their children out of school to
work (which particularly affects children in the secondary school age group), or because they
cannot afford schooling.
There are important differences across countries in terms of gender and being out of school. In
low- and lower-middle income countries, girls are more likely to be out-of-school especially at the
12-17 age range. In contrast, in upper-middle and high-income countries boys are more likely to
be out of school. Despite this, the estimations of dropout-income elasticities show no systematic
differences between boys and girls (see Figure A.2.1).
As more data become available in terms of policy actions taken by government, the behavior of
households, and the effectiveness of the proposed alternative modalities, we will be able to refine
some of these assumptions. The availability of additional data is particularly important to better
understand the intrahousehold dynamics and school safety concerns, both of which are likely to
have significant effects of school dropouts and gender differences. Figure 5 illustrates the main
transmission channels described in this section:

 15
Figure 5: Pathways of learning loss and simulation parameters

where,
 • p, learning gains (school productivity) or what children learn when they go to school 53;
 • s, number of months schools are closed for and children are not learning. This is an
 exogenous parameter based on the country context;
 • m, mitigation effectiveness is an exogenous parameter determined by:
 o (G) Government coverage of remote learning, varying from 0-100%, 0 if the
 government is not providing any alternative learning modality; to 100% if a
 government is supplying alternatives to the entire student population. Intermediate
 values can be considered if the government is only provided content for a subset of
 the languages of instruction of the country; or if supply only covers certain
 geographical locations of the country, leaving a share of students without any
 provision; 54
 o (A) Access to alternative learning modalities, reflects the share of leaners with
 access to the remote learning material offered by the government, varying from 0-
 100%. 0 if no student has access, to 100% if all students have access. Table 2
 presents the share of student with access to different modalities, such as radio,
 mobile phone, landline, TV, internet and computer. This indicator can also capture
 the take-up of what is being offered by the government through G.
 o (E) Effectiveness of remote learning. This parameter ranges from 0-100%, 0 if the
 remote learning solutions are expected to have no effect, and 100% if those
 solutions are expected to be fully effective. This parameter is the one in which the

53
 For more information regarding the baseline value of this parameter please see the discussion of school productivity
and grade effect in annex A.1.
54
 According to the Education Global Practice of the World Bank 120 countries have provided multiple modes of
remote learning. Education Systems’ Response to COVID‐19 Brief: June 12th, 2020.

 16
greater amount of evidence needs to be built, and ideally we would like to have the
 expected effectiveness of the alternative modalities offered through G.
 Hence, m = G * A * E
In the context of our global simulations, the parameter m is used as a single parameter which
combines all three elements described above:
 • γ, families are losing income. The income loss is an exogenous parameter, as is determined
 by existing GDP projections, from the World Bank and IMF.
 • d, countries have age group specific income elasticities to schooling 55, which will lead
 some children to drop out.
 • Learning, measured in terms of Harmonized Learning Outcomes (HLO); PISA score; and
 PISA Level.
 • Schooling, measured in Expected Years of Schooling (EYS).
 • LAYS, Learning Adjusted Years of Schooling.
Simulation 1: Effect on LAYS (years)
This analysis examines the impacts of school closures on the stock of earning Adjusted Years of
Schooling (LAYS) as well as on Harmonized Learning Outcomes across country income groups.
Additionally, we combine data on the projected GDP per capita change provided by the MPO
(Macro Poverty Outlook, WBG) with the Global Monitoring Database (collection of globally
harmonized household survey data, WBG) to estimate how much dropout is likely to occur as a
result of COVID-19. The HCI 2017 database is used as the baseline for these calculations.
 ∆LAYSc = f(∆ HLOc , ∆ EYSc)
changes in the LAYS of country c is a function of changes in both the HLO and EYS of country
c, where,
 HLO, Harmonized Learning Outcomes of country c
 EYS, Expected Years of Schooling of country c
Hence, we simulate the impact of COVID-19, both in terms of school closures and household
income, on both the HLO and EYS as per the equations below:
 ∆ HLOc = f(sc , mc , pc)
 ∆ EYSc = f(sc , mc , dc,w,a , gc,w)
where,
 sc, school closure (as a share of the school year) of country c
 mc, mitigation effectiveness of country c
 pc, learning gains (school productivity) of country c
 dc,a,w dropout-income elasticity of children that have attended school by age group (a) and
 welfare quintile (w) from country c

55
 For more information regarding this parameter please see the discussion on school enrollment-income elasticity in
annex A.2.

 17
a, age groups 4-11 and 12-17
 gc,w, income shock projection of country c, if and when available, the simulation can
 accommodate this parameter by welfare quintile (w)
 c, country
For simplicity, in each scenario, the Global simulation assumes the same sc for all countries within
a particular scenario, and mc and pc vary only by country income level. We assume a uniform
income shock across welfare quintile at the global level, since there is no better number available.
Simulation 2: Effect on mean (score)
This analysis builds on scenarios used to estimate the learning losses from simulation 1 and
provides an estimate of how much learning will be lost during school closures necessitated by
COVID-19 in terms of PISA scores. Estimates are based on (i) typical test score gains from one
grade to the next, (ii) data on availability of alternative schooling modalities, (iii) assumptions on
the effectiveness of these alternative modalities, and (iv) assumptions on duration of school
closures. Results are provided by country and are disaggregated by socio-economic status. The
PISA and PISA-D databases are used for these calculations, 2018 or the latest available PISA year.
 ∆PISAc = f(sc, mw, pw)
where,
 sc, school closure (as a share of the school year) for country c
 mw, mitigation effectiveness by welfare quintile (w)
 pw, school productivity or learning gains by welfare quintile (w)
 w, welfare quintile proxied by Social Economic Status (SES)
 c, country
Note: For simplicity, the basic simulation assumes that, within a country, children have the same
school productivity regardless of socio-economic status.
Simulation 3: Effect on share of students below a minimum proficiency threshold
This analysis builds on scenarios used to estimate the learning losses from simulation 2, and
provides an estimate of how the share of children performing below minimum proficiency (PISA
Level 2) will change as a result of school closures. 56 Borrowing an analogy from poverty estimates
– results are presented in terms of headcount of students (aka poverty rate of FGT0), a learning
gap (or FGT1), and a learning gap severity (or FGT2). Results are provided for the following
scenarios: (i) baseline, (ii) all children are effected identically (the whole distribution of test scores
shifts to the left while maintaining its shape), (iii) inequality worsens (the distribution flattens with
those at the top of the distribution moving ahead and those at the bottom falling behind), (iv) those
who were already behind fall further behind while those at the top are unaffected (the distribution
becomes left skewed). The PISA and PISA-D databases are used for these calculations, 2018 or
the latest available PISA year.

56
 UNESCO (2019a), Paper 4, Table 1.

 18
You can also read