WASH IN HEALTH CARE FACILITIES - UNICEF Scoping Study in Eastern and Southern Africa
←
→
Page content transcription
If your browser does not render page correctly, please read the page content below
WASH IN HEALTH CARE FACILITIES
UNICEF Scoping Study in Eastern and Southern Africa

                                                      1
WASH in Health Care Facilities
UNICEF Scoping Study in Eastern and Southern Africa

August 2019

© United Nations Children’s Fund

UNICEF Eastern and Southern Africa Regional Office (ESARO)
Nairobi, Kenya

Author: Magdalene Matthews Ofori-Kuma, UNICEF ESARO

Co-Author: Tsion Gebreyesus, UNICEF Ethiopia Country Office

Cover Image: ©UNICEF/UN0318391/Ramasomanana
Mother and newborn baby, Moramanga Hospital, Madagascar

Reviewers and Contributors: Samuel Godfrey, Bernard Keraita, Gabriele Fontana, Fatima Gohar, Lara Burger and Shem Okiomeri.

The ESARO Team extends its gratitude to the governments, line ministries, technical resource persons and dedicated UNICEF WASH and health
colleagues working to advance WASH in health care facilities in the 21 UNICEF programming countries in Eastern and Southern Africa Region for
their valuable contributions, insights and inputs to the study.

Special acknowledgements to the following UNICEF staff for their contributions of time, content, knowledge and experience to the enrichment
of the final publication:

Angola			                          Tomas Lopez de Bufala, Edson Monteiro
Burundi			                         Daniel Spalthoff, Yves Shaka, Remegie Nzeyimana
Comoros			                         Sylvain Bertrand, Maarouf Mohamed
Eritrea			                         David Tsetse, Hanna Berhe, Yirgalem Solomon
Eswatini			                        Boniswa Dladla
Ethiopia			                        Kitka Goyal, Jane Bevan, Netsanet Kassa, Getachew Hailemichael
Kenya			                           Andrew Trevett, Maya Igarashi Wood, Agnes Makanyi
Lesotho			                         Nadia AlHarithi, Ubong Ekanem, Anthony Asije
Madagascar		                       Brigitte Pedro, Bodovoahangy Andriamaroson, Tata Venance (Ministry of Public Health),
			                                Ranarison Volahanta Malala (WHO)
Malawi			                          Michele Paba, Blessius Tauzie, Chimwemwe Nyimba
Mozambique		                       Chris Cormency, Mayza Tricamegy, Jesus Trelles
Namibia			                         Matheus Shuuya
Rwanda			                          Cindy Kushner, Jean Marie Vianney Rutaganda
Somalia			                         Mahboob Ahmed Bajwa, Charles Mutai
South Sudan		                      Victor Kinyanjui, Robert Taban Lominsuk, Prakash Raj Lamsal
Uganda			                          Shiva Narain Singh, Mary Nawembe
United Republic of Tanzania        Amour Seleman, John Mfungo, Francis Odhiambo
Zambia			                          Murtaza Malik, Lavuun Verstraete
Zimbabwe		                         Aidan Cronin, Shelly Chitsungo, Moreblessing Munyaka, Jennifer Barak, Mitsuaki Hirai
WASH IN HEALTH CARE FACILITIES
UNICEF Scoping Study in Eastern and Southern Africa
4
    © UNICEF/UN0306399/Abdul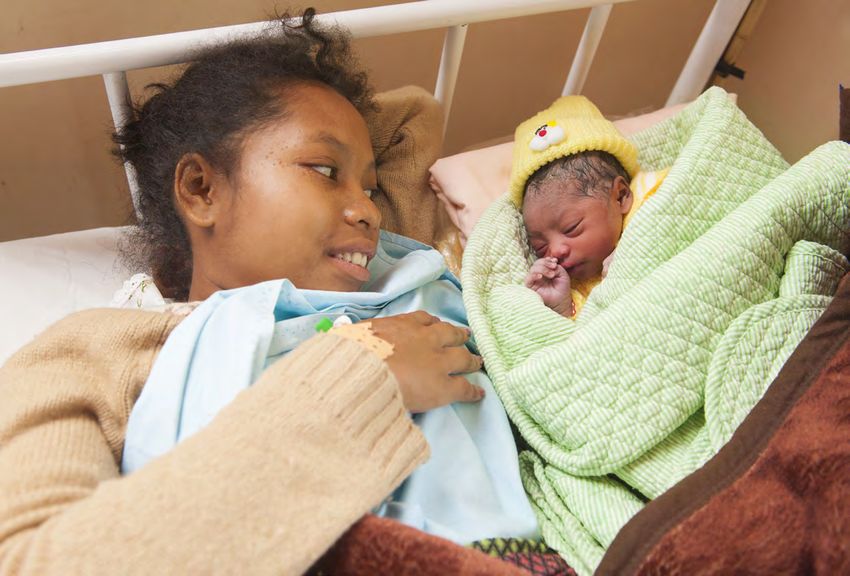
Table of Contents

LIST OF FIGURES & TABLES										VI
ABBREVIATIONS AND ACRONYMS									VII
INTRODUCTION											1
1. WASH AND HEALTH: CURRENT CONTEXT								4
1.1 GLOBAL FRAMEWORK FOR WASH IN HEALTH CARE FACILITIES						                    4
1.2 UNICEF’S VISION FOR WASH IN HEALTH CARE FACILITIES						                     6
1.3 WASH IN HEALTH IN EASTERN AND SOUTHERN AFRICA							                         8
2. WASH COVERAGE IN HEALTH FACILITIES								9
2.1 JOINT MONITORING PROGRAMME SERVICE LADDERS FOR WASH IN HEALTH				            9
2.2. GLOBAL BASELINE FOR WASH IN HEALTH CARE FACILITIES						                    10
2.3 WASH IN HEALTH COVERAGE IN EASTERN AND SOUTHERN AFRICA					                  12
3. THE ENABLING ENVIRONMENT FOR WASH IN HEALTH CARE FACILITIES IN EASTERN AND
SOUTHERN AFRICA											14
3.1 DEFINITION AND SCOPE										14
3.2 METHODOLOGY											15
3.2.1 REGIONAL SURVEY AND ANALYSIS									15
3.2.2 CASE STUDIES											16
3.3 SOURCES OF INFORMATION										17
3.4 SPECIAL ACKNOWLEDGEMENT									17
4. FINDINGS												20
4.1 REGIONAL ENABLING ENVIRONMENT FOR WINHCF IN ESAR						                       20
4.2 SECTOR POLICY/STRATEGY										22
4.3 INSTITUTIONAL ARRANGEMENTS									24
4.4 SECTOR FINANCING											25
4.5 PLANNING, MONITORING AND REVIEW								27
4.6 BUILDING CAPACITY FOR WASH IN HEALTH CARE FACILITIES						                   29
5. CROSS-CUTTING & EMERGING ISSUES								32
5.1 WASH AND MATERNAL, NEWBORN AND CHILD HEALTH (MNCH)					                      32
5.2 GENDER INCLUSIVITY AND MENSTRUAL HEALTH AND HYGIENE						                    32
5.3 DISABILITY INCLUSION IN WINHCF POLICY FRAMEWORKS						                       33
5.4 ANTIMICROBIAL RESISTANCE										33
5.5 CLIMATE-RESILIENCE PROGRAMMING FOR WASH IN HEALTH CARE FACILITIES				        33
5.6 COUNTRY PERSPECTIVES										34
6. DESCRIPTIVE CASE STUDIES										35
UGANDA												35
KENYA													39
ERITREA													42
7. RECOMMENDATIONS										45
REFERENCES												48
ANNEX 1: SUMMARY OF WHO PUBLICATIONS ON HEALTH CARE AND WASTE				                50
ANNEX 2: SDG CORE QUESTIONS FOR MONITORING WINHCF						                          52
ANNEX 3: INDICATORS IN REGIONAL ENABLING ENVIRONMENT SURVEY				                  53
ANNEX 4: A CLOSER LOOK AT ETHIOPIA’S ENABLING ENVIRONMENT FOR WASH IN
           HEALTH CARE FACILITIES									54
ANNEX 5: STAKEHOLDER PERSPECTIVES ON BOTTLENECKS AND RECOMMENDED ACTIONS
           FOR WINHCF SCALE-UP									56
ADDITIONAL WASH IN HEALTH CARE FACILITIES RESOURCES						                        59

                                                                                 v
List of Figures and Tables

Figure 1: Map of the 21 Countries in Eastern and Southern Africa						                                        3
Figure 2: Multiple benefits of adequate WASH in health care facilities					                                   4
Figure 3: WASH FIT five step process for improving facility-level WASH Servicess				                          6
Figure 4: Causes of newborn deaths in the region								                                                      7
Figure 5: New JMP service ladders for global monitoring of WASH in health care facilities			                  9
Figure 6: Water services in health care facilities by SDG region 						                                       10
Figure 7: Proportion of health care facilities in sub-Saharan Africa with basic water supply			               11
Figure 8: Sanitation coverage in health facilities in select countries in ESAR					                           11
Figure 9: UNICEF’s Strategy for WASH (2016-2030): A Snapshot						                                            12
Figure 10: Water coverage in health facilities in selected countries in Eastern and Southern Africa		         13
Figure 11: Sanitation coverage in health facilities in selected countries in Eastern and Southern Africa 		   13
Figure 12: UNICEF’s Strategy for WASH (2016-2030): A snapshot						                                           14
Figure 13: WASH sector-strengthening building blocks and expected results					                                15
Figure 14: Regional WASH in health care facilities enabling environment scorecard for countries in ESAR       18
Figure 15: Regional enabling environment scorecard for WASH in health care facilities				                     19
Figure 16: Map of country performance for overall enabling environment indicators for WinHCF in ESAR          20
Figure 17: Country performance for enabling environment indicators on sector policy and strategy in ESAR      22
Figure 18: Proportion of countries with policy instruments and frameworks addressing WinHCF in ESAR		         23
Figure 19: Country performance for enabling environment indicators on institutional arrangements in ESAR      24
Figure 20: Country performance for enabling environment indicators on sector financing in ESAR 		             26
Figure 21: Country performance for enabling environment indicators on planning, monitoring and review         27
Figure 22: Proportion of countries in ESAR with HMIS indicators on usage and functionality for WinHCF		       28
Figure 23: Country performance for enabling environment indicators on capacity development in ESAR            29
Figure 24: JMP service ladders for water services in health care facilities in Uganda				                     36
Figure 25: KJMP service ladders for sanitation services in health care facilities in Uganda			                36
Figure 26: JMP service ladders for waste disposal in health care facilities in Uganda				                     36
Figure 27: Kenya Essential Package for Health (KEPH) Health Service levels, Source: Kenya HRH Strategy		      39
Figure 28: JMP service ladders for water services in health care facilities in Kenya 				                     40
Figure 29: Country scores for enabling environment indicators for WASH in healthcare facilities in Eritrea    42
Figure 30: WHO/UNICEF practical steps to achieve universal access to quality care 				                        46
Figure 31: SDG core questions for monitoring WinHCF							                                                    51

Table 1: Essential Environmental Health Standards in Health Care Facilities					               5
Table 2: Enabling environment survey response, score and colour-coding guideline 				          16
Table 3: Regional WinHCF Enabling Environment Scores by Sector Strengthening Building Blocks		 21
Table 4: Uganda’s referral health care system based on level and services provided 			35

 vi
List of Abbreviations and Acronyms

DHS      Demographic and Health Survey
DHIS     District Health Information Software
ESAR     Eastern and Southern Africa Region
ESARO    Eastern and Southern Africa Regional Office
HCWM     Healthcare Waste Management
HMIS     Health Management Information System
IPC      Infection Prevention and Control
JMP      Joint Monitoring Programme
MDGs     Millennium Development Goals
MHH      Menstrual Health and Hygiene
MICS     Multiple Indicator Cluster Surveys
M&E      Monitoring and Evaluation
MoH      Ministry of Health
MoW      Ministry of Water
O&M      Operations & Maintenance
RO       Regional Office
SDGs     Sustainable Development Goals
UNICEF   United Nations Children’s Fund
WASH     Water, Sanitation and Hygiene
WHO      World Health Organization
WinHCF   WASH in Health Care Facilities

                                                       vii
8
    © UNICEF/UN0306439/Abdul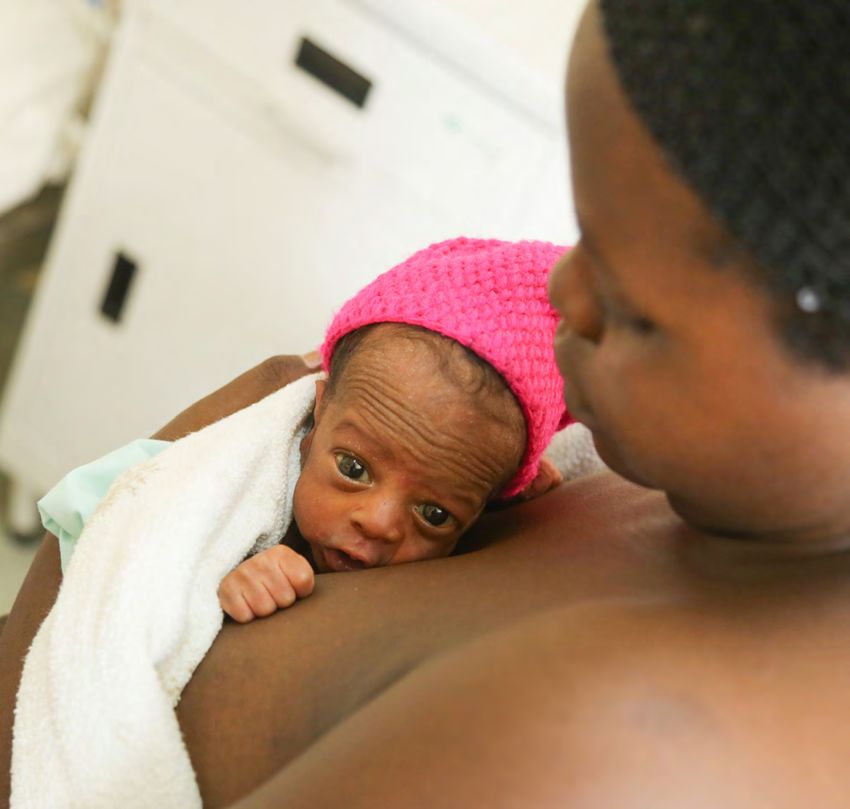
INTRODUCTION

Availability of sustainable water, sanitation and                                               a global issue, in his remarks, the Secretary General
hygiene (WASH) services is essential to quality of care                                         stated: “We must work to prevent the spread of disease.
and infection prevention and control in health care                                             Improved water, sanitation and hygiene in health
facilities. The linkage between safe water for hygiene                                          facilities is critical to this effort.”
and handwashing in health facilities and reduction
in disease transmission has long been established in                                            In April 2019, the WHO/UNICEF Joint Monitoring
literature. Given the importance of water availability and                                      Programme for Water Supply, Sanitation and Hygiene
good hygiene during childbirth in particular, WASH is                                           published the Global Baseline Report on WASH in Health
considered both a precondition and an entry point for                                           Care Facilities, the first ever harmonized estimates for
good quality of care.                                                                           water, sanitation, hand hygiene, health care waste
                                                                                                management and environmental cleaning services in
According to the World Health Organization (WHO), one                                           health care facilities across the world. The report findings
of the leading global actors working to improve WASH in                                         helped raised further awareness on the magnitude of
health care facilities, clean and safe healthcare facilities,                                   the problem on the global scale.
equipped with adequate WASH services, can: a) increase
demand for and trust in services; b) reinforce the role of                                      Meanwhile, at the 72nd World Health Assembly in
healthcare services and staff in setting societal hygiene                                       May 2019, Ministers of Health from Member States
norms; c) increase the motivation and retention of health                                       unanimously approved a resolution on WASH in Health
workers; d) result in cost savings from infections averted;                                     Care Facilities, committing to advancing WinHCF
and e) lead to more efficient service delivery. Sustainable                                     programming through: a) the development of national
Development Goal (SDG) 3 (ensure healthy lives and                                              roadmaps; b) the setting and monitoring of national
promote well-being) and SDG 6 (ensure availability and                                          targets; c) increased investments in infrastructure and
sustainable management of water and sanitation for all)                                         human resources; and d) targeted systems strengthening
reinforce the need to ensure safe management of water                                           to improve and sustain WASH services in health care
and sanitation, reduction in maternal mortality, ending                                         facilities.
preventable newborn deaths, and providing quality                                               In response to these unfolding developments, WHO and
universal health coverage.                                                                      UNICEF are co-leading global efforts on monitoring,
Despite the critical role that water, sanitation, hygiene,                                      standard setting, advocacy and learning. Under the
waste disposal and environmental cleaning services play                                         SDGs, the global targets are to ensure that at least 50
in the continuum of healthcare, access to WASH services                                         per cent of all health care facilities globally and in each
globally remains alarmingly poor. The gaps in current                                           SDG region1 have basic WASH services by 2022, 80 per
WASH services in health care facilities are significant.                                        cent by 2025, and 100 per cent by 2030. In countries
According to the 2019 Global Baseline Report on WASH                                            where WASH services exist, the target is advanced levels
in Health Care Facilities, one in four health care facilities                                   of service, with the aim of 100 per cent by 2030. As
lacks basic water services, and 896 million people have                                         a children-focused organization, UNICEF is committed
no water service at their health care facility. For children,                                   to helping every child gain access to drinking water,
this has far-reaching effects on their level of growth,                                         sanitation and hygiene, including in schools and health
development, morbidity and mortality, especially at the                                         centres, and in emergency/humanitarian situations
very start of life.                                                                             where children are most vulnerable. In the words of
                                                                                                UNICEF Executive Director Henrietta Fore: “Every birth
In recent times, several developments have helped                                               should be supported by a safe pair of hands, washed
strategically position WASH in health care facilities                                           with soap and water, using sterile equipment, in a clean
(WinHCF) as a priority on the global developmental                                              environment.”
agenda. In March 2018, at the Launch of International
Decade for Action, 2018-2028, United Nations Secretary                                          As part of UNICEF’s Global WASH Strategy (2016-2030),
General Antonio Guterres issued a global call to action                                         the organization will continue working with WHO and
for WASH in all health facilities. Elevating WinHCF as                                          ministries of health to formulate, promote and support

1
 SDG Regions: a) Sub-Saharan Africa; b) Northern Africa and Western Asia; c) Central and Southern Asia; d) Eastern and South-Eastern Asia; e) Latin America and the Caribbean; f) Oceania;
g) Europe and Northern America; h) Least Developed Countries (LDC); i) Landlocked developing countries (LLDC) and j) Small island developing States (SIDS).

                                                                                                                                                                                    1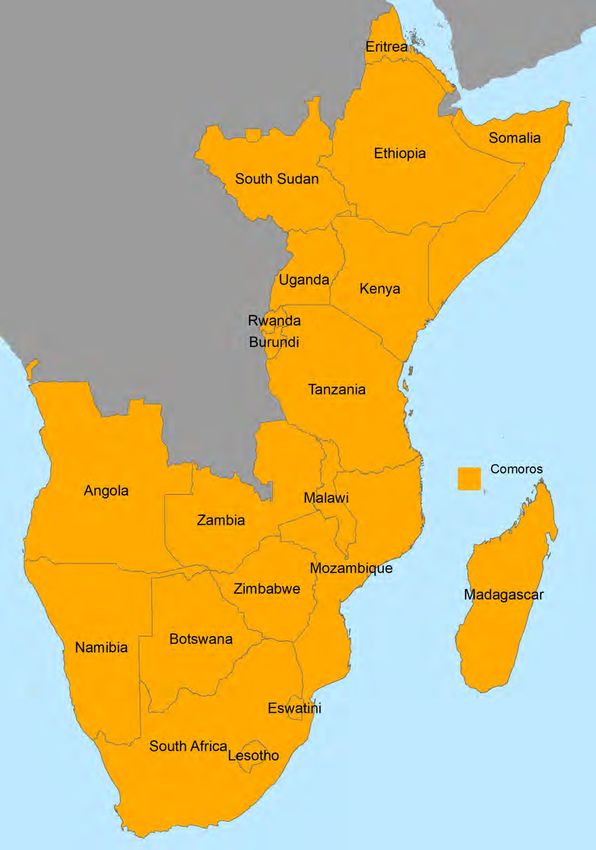
viable approaches for ensuring adequate WASH in                region (Eritrea, Uganda and Kenya). Assessment was
health care facilities, with a focus on facilities providing   based on UNICEF’s Enabling Environment Framework,
maternal and newborn health services. UNICEF’s                 using the five sector strengthening building blocks: a)
initiatives to improve water, sanitation and hygiene           Sector policy/strategy; b) Institutional arrangements; c)
practices in health care facilities will focus on improving    Sector financing; d) Planning, monitoring and review;
the safety and dignity of childbirth, with provisions made     and e) Capacity development.
to sponsor targeted research to improve the knowledge
base in the area for enhanced programme design and             The study forms part of evidence generation and
more effective advocacy.                                       knowledge sharing within the region and contributes
                                                               to UNICEF’s global strategic focus (2016-2030) as
On this premise, UNICEF Eastern and Southern Africa            well as to the 2018-2021 Regional Priorities for
Regional Office conducted a regional scoping study             Eastern and Southern Africa Region which call for the
and deep dive on the Enabling Environment for                  institutionalization of WinHCFs programming, the
WASH services in Health Care Facilities across its 21          prioritization of health facilities that provide maternal,
programming countries in Eastern and Southern Africa           neonatal and child health services; and the establishment
Region. The aim was to assess the status of the enabling       and enforcement of national standards for WASH
environment for WASH services in health facilities,            services in health care facilities.
identify related gaps and explore avenues to enhance
programming in the region. The objectives of the study         This report summarizes the findings of the study and
were:                                                          consists of five main parts:
1. To assess the status of the enabling environment for        1. A literature review of the current global,
    WinHCFs programming in the region;                             organizational and regional frameworks for WinHCF
                                                                   programming;
2. To document best practices on WinHCFs
    programming from selected countries for further            2. A summary of regional WASH coverage in health
    learning, and knowledge-sharing in the region; and             care facilities based on the 2019 Joint Monitoring
                                                                   Programme global baseline findings;
3. To increase awareness of WinHCFs programming
    through evidence generation for enhanced                   3. An analysis of the enabling environment for WinHCF
    programming and targeted advocacy.                             derived from an administered online survey;
                                                               4. Descriptive case studies of selected countries within
The study consisted of an online survey completed                  the region; and
through multi-stakeholder consultations in countries
                                                               5. Strategic       recommendations     for   advancing
in the region, followed by visits to health care facilities
                                                                   sustainable WinHCFs programming in the region.
in rural and urban settings in selected countries in the

 2
Figure 1: Map of the 21 Countries in Eastern and Southern Africa2
2
Swaziland is the current Kingdom of Eswatini.
3WASH AND HEALTH: CURRENT
Chapter 1
CONTEXT
1.1 GLOBAL FRAMEWORK FOR “the provision of water, sanitation, health care waste,
hygiene and environmental cleaning infrastructure, and
WASH IN HEALTH CARE FACILITIES services across all parts of a facility.” The organic role
As defined by the World Health Organization (WHO),3 WASH plays in ensuring quality of care, strengthening
the term ‘health care facilities’ refers to “all formally infection prevention and control, enhancing maternal,
recognized facilities that provide health care, including child and adolescent health and minimizing antimicrobial
primary (health posts and clinics), secondary, and resistance cannot be overemphasized (Figure 2). Research
tertiary (district or national hospitals), public and private shows that the benefits extend far beyond the point of
(including faith-run), and temporary structures designed care to boosting staff morale and the performance of
for emergency contexts (e.g., cholera treatment health care workers, minimizing the national health care
centers).” ‘WASH in health care facilities’ is defined as burden and providing a platform to promote improved
hygiene practices within the community.
Figure 2: Multiple benefits of adequate WASH in health care facilities, Source: WHO/UNICEF Factsheet4
Given the linkage between patient care service delivery and public health in any given context, several global guidance
documents have been developed to help streamline quality of care within health facilities, including WASH service
delivery. WHO and partners, including UNICEF, have, over the years, developed numerous frameworks to help reduce
the disease burden caused by inadequate infection prevention and control (IPC) measures and poor health care waste
management (HCWM) through enhanced safety standards. Annex 1 provides a summary of publications addressing
WASH, IPC and HCWM developed over the last decade and a half.5
3
WHO WASH in Health Care Facilities, www.who.int/water_sanitation_health/facilities/healthcare/en/
4
WHO/UNICEF Global WinHCF Action Plan Factsheet, www.wsscc.org/wpcontent/uploads/2015/11/WASHinHCFGlobalActionPlanOct20151.pdf
5
WHO Publications, www.who.int/water_sanitation_health/facilities/health-care-waste-publications/en/
4WHO Essential Environmental Health Standards in Health Care Facilities
One of the key guidance documents on WinHCF is the WHO Essential Environmental Health Standards in Health
Care Facilities. This was developed as guidance on essential environmental health standards required for health care
in medium- and low-resource countries to guide the development and implementation of national policies. It lists the
recommended minimum standards for water, sanitation and hygiene services in health facilities as follows:
Item Recommendation Explanation
Water 5–400 litres/person/day. Outpatient services require less water, while operating
quantity theatres and delivery rooms require more water. The
upper limit is for viral haemorrhagic fever (e.g. Ebola)
isolation centres.
Water access On-site supplies. Water should be available within all treatment wards
and in waiting areas.
Water quality Less than 1 Escherichia coli/ thermotolerant Drinking water should comply with WHO Guidelines
total coliforms per 100 ml. for Drinking-water Quality for microbial, chemical
Presence of residual disinfectant. and physical aspects. Facilities should adopt a risk
Water safety plans in place. management approach to ensure that drinking water is
safe.
Sanitation 1 toilet for every 20 users for inpatient setting. A sufficient number of toilets should be available for
quantity At least 4 toilets per outpatient setting. patients, staff and visitors.
Separate toilets for patients and staff.
Sanitation On-site facilities. Sanitation facilities should be within the facility grounds
access and accessible to all types of users (females, males,
those with disabilities).
Sanitation Appropriate for local technical and financial Toilets should be built according to technical
quality conditions, safe, clean, accessible to all users specifications to ensure excreta are safely managed.
including those with reduced mobility.
Hygiene A reliable water point with soap or alco- Water and soap (or alcohol-based hand rubs) should
hol-based hand rubs available in all treatment available in all key areas of the facility for ensuring safe
areas, waiting rooms and near latrines for hand hygiene practices.
patients and staff.
Table 1: Essential Environmental Health Standards in Health Care Facilities, Source: WHO6
WHO/UNICEF Water Sanitation and Hygiene Facility Improvement Tool (WASH FIT)
With several frameworks addressing different components of health care service delivery, to bridge the gap between
environmental health, IPC and health care waste management at facility level, in 2018, WHO and UNICEF jointly
published the Water and Sanitation for Health Facility Improvement Tool7 (WASH FIT) as a practical guide for
improving quality of care through WinHCF. WASH FIT is a risk-based approach for improving and sustaining water,
sanitation and hygiene and health care waste management infrastructure and services in health care facilities in low-
and middle-income countries (LMICs). It is designed as an improvement tool to be used on a continuous and regular
basis, to help HCF staff and administrators prioritize and improve services, and to inform broader district, regional
and national efforts to improve quality health care.
WASH FIT guides multi-sectoral teams through a continuous cycle of assessing and prioritizing risks, defining and
implementing improvements, and continually monitoring progress. WASH FIT provides a systematic approach to
improving WASH through a health lens. According to WHO, since it was first developed in 2015, WASH FIT, as a tool,
has been piloted in over 20 countries across the world.8 In eastern and southern Africa, Comoros, Ethiopia, Kenya,
Madagascar, Malawi, Rwanda, Uganda and the United Republic of Tanzania have all piloted WASH FIT to some extent
in health care facilities, making gains at facility level while learning implementation lessons along the way for further
scale-up.
WASH FIT implementation involves a five-step process beginning with the enabling environment and culminating in
the desired health-based objectives, thus emphasizing the role of the enabling environment as a starting point for
sustainable WinHCFs (Figure 3). A strong enabling environment at national, sub-national and facility levels, is key to
6
WHO (2008), Essential Environmental Health Standards in Health Care Facilities, www.who.int/water_sanitation_health/publications/ehs_hc/en/
7
WHO/UNICEF (2018), WASH FIT www.who.int/water_sanitation_health/publications/water-and-sanitation-for-health-facility-improvement-tool/en/
8
According to WHO, countries in which WASHFIT has been piloted are Bangladesh, Bhutan, Cambodia, Chad, Comoros, the Democratic Republic of the Congo, Ethiopia, Ghana, Guinea, India,
Indonesia, Iraq, Kenya, Lao People’s Democratic Republic, Liberia, Madagascar, Malawi, Mali, Nepal, the Philippines, Senegal, Tajikistan, the United Republic of Tanzania, Togo and Viet Nam.
5ENABLING ENVIRONMENT
Leadership, political commitment and community engagement
1. Assemble and train
the WASH FIT
team and hold
regular meetings
5. Continuously 2. Conduct an
evaluate and assessment of the
improve the plan facility
4. Develop and 3. Identify and
implement an prioritize areas for
improvement plan improvement
ANNEX 3
HEALTH-BASED OBJECTIVES
Make improvements to meet accreditation scheme or national quality standards
Figure 3. WASH FIT five-step process 47
Figure 3: WASH FIT five step process for improving facility-level WASH Services9
PRACTICAL STEPS TO ACHIEVE UNIVERSAL ACCESS TO QUALITY CARE
improving the quality of care and internal IPC measures Human Potential12 was developed. The Framework has
in health facilities, and to promoting overall well-being a special emphasis on early childhood development
within a given context. (ECD). To protect children’s health and support their
every six months) visits to the facility by local or national Mobile
development, application
it is essential that they have access to
Several other or
government global frameworks
supporting partnersspeak to WinHCF
can help guide andwith clean water and sanitation, good hygiene practices,
theencourage facilities through the WASH FIT process. with
aim of further integrating WASH interventions A clean
mobileair application
and a safe of WASH FIT is available
environment. and free Care
The Nurturing
maternal, newborn
These visits are also and child for
important health
data(MNCH),
collectionnutrition
and toFramework
download (www.washfit.org). The application
calls for an integrated, allows whole-
multi-sectoral,
and early childhood development (ECD).
evaluation of WASH FIT (see Practical Step 3, The end goal
Liberia facility teams toapproach
government track more toeasily and rapidly by
ECD supported andactions
follow from
is case
to secure a more profound impact on child health
study) (47). upthe
on health,
actions and government
nutrition, and partners
education, social to provide child
protection,
outcomes in the first 1,000 days of life. real-time
welfare,support. In addition,
agriculture, labour,it finance
can be used
andby facilitysectors,
WASH
teams to share
including theapproaches
availabilityonof overcoming
WASH serviceschallenges
in healthor care
Every Newborn Action Plan (ENAP)
WASH FIT training engage in friendly
facilities competitions.
at the time of birth and at community level for
Under the broader Every Woman, Every Child global mothers and newborns.
A set of training
movement modulesofis the
in support available
Unitedonline in English,
Nations Secretary-
French and Russian. The training modules
General’s Global Strategy for Women’s, Children’s, are provided and Related reading: VISION FOR WASH IN
1.2 UNICEF’S
as a guide andHealth
Adolescents’ should10be adapted to thethe
(2016-2030), local context,
Every for
Newborn
example swapping
HEALTH CARE FACILITIES
Action Plan (ENAP)photos with more It
was launched. relevant examples
calls for a reduction Water and Sanitation for Health Facility Improvement
infrom the regionnewborn
preventable and replacing technical
deaths with guidance
a focus on withsurvival
local Tool
The(WASH
UNICEFFIT): A practical
WASH guide(2016-2030)
Strategy for improving
standards,
and health,whereand applicable.
advocatesThe fortraining package
maternity also
facilities to quality of care through water, sanitation and hygiene in
beincludes an overview
equipped of the WASH infrastructure
with appropriate FIT methodology and
including The UNICEF
health Strategy
care facilities for Water,
[Internet]. Sanitation
Geneva, and Hygiene
World Health
a module for
electricity, eachsanitation
water, of the WHO Essential
and Environmental
hand-washing facilities, (2016–2030) articulates the organizational
Organization and UNICEF, 2018 [cited 1 March 2019]. thinking
clean
Healthtoilets,
Standardsappropriate
(e.g., water,spaces forenvironmental
sanitation, women to give Available from: http://www.who.int/water_sanitation_ WASH
and approach to WASH in health care facilities.
birth with health
cleaning, privacy,
careand dedicated
waste). Materials areas to manage
for running a sick in institutions – consisting of WASH in schools (WinS),
health/publications/water-and-sanitation-for-health-
newborns safely.11sample agendas, evaluation sheets, and
training, including WASH in health care facilities (WinHCFs) and WASH in
facility-improvement-tool/en/
a pre- and post-test quiz are also available. For technical early childhood care centres – is one of the five strategic
The Nurturing Care Framework results areas: 1) Water; 2) Sanitation; 3) Hygiene; 4)
assistance or to share experiences of using the tool, please
WASH in institutions; and 5) WASH in emergencies.
Incontact
2018,washinhcf@who.int
the Nurturing Care and visit www.washinhcf.org.
Framework for Helping
Children Survive and Thrive to Transform Health and
9
WHO/UNICEF (2019), WASH in health care facilities: Practical steps to achieve universal access to quality care, www.who.int/water_sanitation_health/publications/wash-in-health-care-
facilities/en/
10
The Global Strategy for Women’s, Children’s, and Adolescents’ Health, http://www.everywomaneverychild.org/wp-content/uploads/2017/10/EWEC_GSUpdate_Brochure_EN_2017_web.pdf
Every Newborn Action Plan, www.who.int/docs/default-source/mca-documents/advisory-groups/quality-of-care/every-new-born-action-plan-(enap).pdf?sfvrsn=4d7b389_2
11
Nurturing Care Framework (2018), https://apps.who.int/iris/bitstream/handle/10665/272603/9789241514064-eng.pdf
12
6To advance the global agenda on WinHCF programming, Every Child Alive
UNICEF commits to:
In addition, as part of its efforts on reproductive,
• Encouraging the institutionalization of WinHCF
maternal, newborn, child and adolescent health
within the national health sector;
(RMNCAH), UNICEF recently launched, Every Child Alive,
• Advocating for and supporting the inclusion of a priority organizational integrated campaign aimed at
WASH in health sector baseline studies and national significantly reducing morbidity and mortality at the very
surveys; start of life. Global statistics show that children face the
• Supporting the development of national standards highest risk of dying in their first month of life. In 2016,
for WinHCFs and evidence-based models for scaling there were 2.6 million newborn deaths, mostly within
up with quality; while promoting cost-effective the first week. About 1 million died on the first day
approaches; and and close to another million within the next six days.14
• Encouraging the implementation of hygiene Globally, while under-five mortality has fallen remarkably
protocols, including hygiene practices of health in recent decades newborn mortality remains a critical
workers. global challenge, predominantly in southern Asia and
sub-Saharan Africa.
The UNICEF Health Strategy (2016-2030)
In eastern and southern Africa, congenital (30 per cent)
UNICEF’s Strategy for Health (2016-2030), in turn, and intrapartum (29 per cent) neonatal causes and
stresses the importance of an integrated approach sepsis (16 per cent) rank as the three leading causes of
to early child health care, drawing on the diversity of neonatal mortality. Current literature strongly indicates
the organization’s programmatic scope (nutrition, that with 50-70 per cent of hospital-acquired infections
education, early childhood development (ECD), HIV, (HAIs), including sepsis, linked to poor hand hygiene, the
child protection, and WASH) and calls for nutrition transmission of healthcare associated sepsis and related
screening and intervention, improved community-level HAIs could be reduced by adherence to IPC measures,
health literacy, support to community-level interventions especially hand hygiene.15
related to early child development, and appropriate
support to community-level and health facility WASH
services and practices.13
Figure 4: Causes of newborn deaths in the region16
In line with SDGs 3.117 and 3.2,18 Every Child Alive seeks to accelerate UNICEF’s contributing efforts to achieving a
world in which no child dies of a preventable cause and in which no preventable stillbirths occur; a core advocacy
output being to work to guarantee the uninterrupted provision of electricity and clean water in all health facilities.
13
UNICEF Strategy for Health (2016-2030), www.unicef.org/health/files/161201_Strategy_for_health_2016-30_report.pdf
14
UNICEF (2017), Levels and Trends in Child Mortality Report 2017, p. 8.
15
A. Peters et al. (2018) International Journal of Infectious Diseases 70 (2018) 101-103
16
WHO (2018), Estimates generated by the WHO and Maternal and Child Epidemiology Estimation Group (MCEE), 2018
17
SDG 3.1 By 2030, reduce the global maternal mortality ratio to less than 70 per 100 000 live births.
SDG 3.2 By 2030, end preventable deaths of newborns & children under 5 years of age, with all countries aiming to reduce neonatal mortality to at least as low as 12 per 1000 live births,
18
under-5 mortality to at least as low as 25 per 1000 live births.
7UNICEF Health Systems Strengthening Approach • To design, implement and monitor synergistic WASH
models20 that promote cost-effective approaches
Under its Health Systems Strengthening Approach, and allow the health and WASH sectors to work
UNICEF also envisions contributing to evidence-based together efficiently and effectively to undertake
and equitable national strategic plans and policies for comprehensive, facility-based risk assessments
children’s and women’s health; leveraging national and implement context-specific critical actions to
and international resources, while linking with other improve WASH in health facilities and promote
UNICEF programming sectors including WASH. The behaviour change through community health
aim is to establish strong health systems which include worker outreach;
preventive and promotive services, curative care, family
practices and produces equitable health, nutrition and • To develop policies for institutionalizing WASH
development outcomes for infants, children, adolescents in healthcare facilities, prioritizing those health
and women of reproductive age.19 facilities that provide maternal, neonatal and
child health services; and establish and enforce
1.3 WASH IN HEALTH IN EASTERN national standards for WASH in healthcare facilities,
accompanied by adequate funding, human
AND SOUTHERN AFRICA resources and institutional arrangements to ensure
As stated in the 2018-2022 Regional Priorities, in that standards are implemented;
Eastern and Southern Africa Region (ESAR), UNICEF’s
• To support the development of national WASH
commitment is to support countries in the region to
targets that prioritize the most vulnerable (areas
improve access to basic service levels of drinking water
with high maternal and newborn mortality rates,
and sanitation, reduce open defecation and promote
cholera outbreaks and so on) and take into account
good hygiene practices, including menstrual health
human, financial and technological capabilities;
and hygiene (MHH), especially for the most vulnerable
populations, in emergency/humanitarian settings, • To advocate for including WASH indicators in
urban/rural households, communities, schools and key health sector studies and national surveys
health facilities. and health sector real-time monitoring systems,
and strengthen joint monitoring for WASH in
The 21 UNICEF programming countries in ESAR are:
health facilities, through the WHO–UNICEF Joint
Angola, Botswana, Burundi, Comoros, Eritrea, Eswatini,
Monitoring Programme.
Ethiopia, Kenya, Lesotho, Madagascar, Malawi,
Mozambique, Namibia, Rwanda, Somalia, South Africa, • To promote implementation of hygiene protocols,
South Sudan, Uganda, the United Republic of Tanzania, including hygiene practices for health workers
Zambia and Zimbabwe. WASH programming, with the in health facilities and in the community, and
presence of WASH staff, occurs in all these countries strengthen the capacity of medical staff and
except Botswana and South Africa. community health workers to adopt and promote
good hygiene behaviours.21
UNICEF Eastern and Southern Africa Regional Office
(ESARO) will continue to support country offices (COs) The indicator of success is the number of countries
to develop enhanced models and partnerships for in which 80 per cent of health centres and facilities
evidence-based WASH in institutions programming at have basic WASH services by 2022. Given that this is
scale. Regarding WASH in health care facilities, the focus programmed as a regional priority for 2018-2022,
areas and critical actions are: judging from the current JMP findings significant efforts
will have to be made by all countries within the next two
years to meet the 80 per cent target.
19
The UNICEF Health Systems Strengthening Approach (2016), https://www.unicef.org/health/files/UNICEF_HSS_Approach.pdf
20
Synergistic programming models maximize the potential for synergy between different sectors’ activities. Synergistic models achieve this by securing a common vision and agreement to
work together, joint planning and aligned financing and monitoring; and strengthened accountability and capacity. Emphasis is placed on removing bottlenecks in the enabling environment
to minimize the practice of delivering sector-based interventions and services in silos.
21
UNICEF Eastern and Southern Africa Regional Priorities (2018-2022)
8WASH COVERAGE IN HEALTH
Chapter 2
FACILITIES
Annex 1 . Key Definitions
2.1 JOINT MONITORING facilities (e.g. hospitals) in urban areas.
PROGRAMME SERVICE LADDERS In 2019, the WHO/UNICEF Joint Monitoring Programme
FOR WASHBasic WASH services in
IN HEALTH
health care facilities
the(JMP)
JMP “Core
forquestions
Waterand indicators
Supply, for monitoringand Hygiene released
Sanitation
WASH in health care facilities in the Sustainable
the first comprehensive global baseline report on WASH
Development Goals” (39) and the 2019 JMP SDG
In 2015, WHO and WHO hasUNICEF
developedjointly published
a set of minimum, the first
global standards in health
Baseline care
report for WASHfacilities,
in health carepresenting
facilities (1). the first harmonized
for environmental
multi-country review of WASH healthinin health
health carecare
facilities (38).
facilities, picture of water, sanitation, hand hygiene, health
Deriving from this standards, a “basic” level of service At the national level, countries are encouraged to define
focusing on 54haslow andandmiddle-income
been defined countries
is achieved when key conditions
care waste management, and environmental cleaning
more ambitious, higher levels of service and to set and
(LMICs) across the
aresix
met global WHO
in five areas: water, regions. 22
According
sanitation, hygiene, waste services
monitor in health
corresponding care
indicators. facilities
Higher across the world. JMP
levels of service
management
to the review, data were and moreenvironmental
numerous cleaning.
on access to may consider further
estimates areimportant
arrived aspects, including
at from water
national data sources and
quality (e.g. legionella, pseudomonas), including medical-
water than for sanitation and hygiene
To allow for inter-country in LMICs.
comparability and globalLarge
a linear regression model, to
grade water, water efficiency, safe plumbing, climate
generate estimates for all
variations were also observed
monitoring WHO and at sub-national
UNICEF have created setlevel,
of by yearsofwithin
resilience water andthe reference
sanitation services,period. The methodology used
sustainability
(including non-burn estimates
waste destruction
formethods), and safe
settings and by questions
type ofthathealthclassify facilities in relation to “service
care facility within the to produce WinHCFs builds on established
ladders” (see Figure 2). For more information on how collection, transport and treatment and the quality of
same country, with smaller
the service facilities
ladders are defined inandrural areasrefer
measured, having
to methods developed
disposed wastewater. by the JMP for monitoring WASH
disproportionally fewer WASH services than larger services in households and schools.
ANNEX 1
WASTE ENVIRONMENTAL
WATER SANITATION HYGIENE
MANAGEMENT CLEANING
Higher levels of Higher levels of Higher levels of Higher levels of Higher levels of 41
service service service service service
To be defined at To be defined at To be defined at To be defined at To be defined at
PRACTICAL STEPS TO ACHIEVE UNIVERSAL ACCESS TO QUALITY CARE
national level national level national level national level national level
Basic Water is available from Improved sanitation Functional hand Waste is safely Basic protocols
service an improved source6 facilities7 are usable, hygiene facilities segregated into at for cleaning are
on the premises. with at least one toilet (with water and least three bins, and available, and
dedicated for staff, at soap and/or sharps and infectious staff with cleaning
least one sex-separated alcohol-based hand waste are treated and responsibilities have
toilet with menstrual rub) are available at disposed of safely. all received training.
hygiene facilities, points of care, and
and at least one toilet within five metres
accessible for people of toilets.
with limited mobility.
Limited An improved water At least one improved Functional hand There is limited There are cleaning
service source is within sanitation facility is hygiene facilities separation and/ protocols and/
500 metres of the available, but not are available either or treatment and or at least some
premises, but not all all requirements for at points of care or disposal of sharps and staff have received
requirements for basic basic service are met. toilets but not both. infectious waste, but training on cleaning.
service are met. not all requirements for
basic service are met.
No Water is taken from Toilet facilities are No functional hand There are no separate No cleaning
service unprotected dug wells unimproved (e.g. pit hygiene facilities bins for sharps or protocols are
or springs, or surface latrines without a slab are available either infectious waste, available and no
water sources; or an or platform, hanging at points of care or and sharps and/or staff have received
improved source that is latrines, bucket toilets. infectious waste are training on cleaning.
more than 500 metres latrines) or there are not treated/disposed
from the premises; or no toilets. of.
there is no water source.
2. Service ladders for WASH in health care facilities
Figure 5: New JMP Figure
service ladders for global monitoring of WASH in health care facilities23
6
Improved water sources are those which by nature of their design and construction have the potential to deliver safe water. These include piped water, boreholes or tubewells, protected
Under the SDG framework, the JMP redefined ‘improved’ services from the Millennium Development Goals (MDG)
dug wells, protected springs, rainwater, and packaged or delivered water.
Improved sanitation facilities are those designed to hygienically separate human excreta from human contact. These include wet sanitation technologies – such as flush and pour flush
7
terminology, according to specific service levels, or benchmarks of no, limited, basic, and advanced service levels. The
toilets connecting to sewers, septic tanks or pit latrines – and dry sanitation technologies – such as dry pit latrines with slabs, and composting toilets.
purpose of the new service ladders (Figure 5) is to enable countries to track progress towards the SDG targets and to
facilitate the benchmarking and comparison of progress across countries globally and regionally. The JMP introduced
service ladders for the five core indicators for WASH in health care facilities: water, sanitation, hygiene, health care
waste management and environmental cleaning in health care facilities (Figure 5), along with core questions to
facilitate data collection and streamline monitoring during health facility surveys.24 (Annex 2)
WHO (2015), Water, sanitation and hygiene in health care facilities Status in low- and middle-income countries and way forward, https://apps.who.int/iris/bitstream/
22
handle/10665/154588/9789241508476_eng.pdf?sequence=1
WHO/UNICEF (2018) Core questions and indicators for monitoring WASH in Health Care Facilities in the Sustainable Development Goals, https://washdata.org/report/jmp-2018-core-
23
questions-monitoring-winhcf-en
24
Ibid., p.9
9Given the critical need for water for hand hygiene and toilets at all. Notably, sub-Saharan Africa was the only
infection prevention and control in administering care, SDG region with estimates for basic sanitation services
for a health facility to classify as having met the ‘basic; in health care facilities. Meanwhile, in least developed
service ladder for water, water had to be available from countries (LDCs), only 27 per cent of health care facilities
an improved source on the premise of the facility. As had basic health care waste management services.
defined by the JMP, ‘improved water sources’ are
sources which, by nature of design and construction, The 2019 Global Baseline Report compiles and
have the potential to deliver safe water, i.e. piped water, analyses existing monitoring data that countries have
boreholes or tube wells, protected dug wells, protected already collected and reviewed. It includes national
springs, rainwater, and packaged or delivered water. data from 125 countries, drawing on assessments
‘Unimproved sources’ refer to unprotected dug wells of over 560,000 health care facilities, extracted from
or springs and surface water (e.g. lakes, rivers, streams, 260 nationally representative facility assessments and
ponds, canals and irrigation ditches). A basic sanitation mapped to a standardized set of global indicators for
service is one in which improved sanitation facilities are water, sanitation, hygiene, waste management and
usable with at least one toilet dedicated for staff, at environmental cleaning services in health care facilities.
least one sex-separated toilet with menstrual hygiene For all indicators, the data gaps were quite significant.
facilities, and at least one toilet accessible for people
Due to insufficient evidence, the global picture on the
with limited mobility.
indicators for basic sanitation, hygiene, waste disposal
Basic hygiene refers to functional hand hygiene facilities and environmental cleaning in health care facilities could
Globally, 38 countries, with a combined population notInbe established.
2016, estimates ofGlobally,
basic water18 countries
services in health and only one
(with water and soap and/or alcohol-based hand rub)
of 2.6 billion people, had enough data to make
SDG care facilities
region – were available for
sub-Saharan Africa38 countries,
– had sufficient data to
which are availablenationally
at points of care,
representative and for
estimates within five
basic water representing 2.6 billion people
metres of toilets. The health
services care
in health carefacility
facilitiesis said (Figure
in 2016 to have 15). estimate coverage of basic sanitation services in health
More countries had data on other
basic waste disposal only if waste is safely segregated indicators, with 69 care facilities Basic (Figure 8). In 2016, 2.6 only 38 countries and
services (n=38)
countries, representing 61% of the global population, three of the eight SDG regions had sufficient data to
into at least three bins, and sharps and infectious waste
able to report on the proportion of health care facilities
are treated and disposed
with no waterof service.
safely.TheA JMPbasic service
produces forand
regional
estimate coverage of basic water services in health care
Improved and
data are facilities (Figure 6); 14 countries had sufficient data to
2.6
environmental cleaning is one21inforwhich
global estimates basic provided
new indicators, protocols available (n=40)
available for at least 30% of
for cleaning are available, and staff with cleaning the relevant population. 22
estimate coverage of basic hygiene services in health care
facilities, meaning that functional hand hygiene facilities
WATER SERVICES IN HEALTH CARE FACILITIES
responsibilities haveGlobally,
all received training.
in 2016, 74% of health care facilities had basic
Improved and
on premises (n=53) 3.1
were available both at points of care and at toilets;
water services (Figure 16). One in eight (12%) health
2.2. GLOBALcare BASELINE FOR
facilities had no water service, and the remaining 48 countries had sufficient data to estimate coverage
WASH
14% of health care facilities had limited services, of basic
No services waste
(n=69) management 4.6 services in health care
IN HEALTH CARE meaning they FACILITIES
either had access to an improved water facilities; and just 4 countries worldwide had enough
source that was off the premises (but within 500 metres)
data to estimate coverage of basic environmental
Findings from the JMP Global
or from Baseline
which water was notReport
availableshow thatof the
at the time Any data (n=73)
assessment. Regionalcare
valuesfacilities
for basic water services cleaning services in health care 4.6
facilities.
in 2016, 74 per cent of health globally
ranged from 51% in sub-Saharan Africa to 87% in
had basic water services, 21 per cent had no sanitation
Eastern and South-Eastern Asia (see Annex 2 for lists of Like the findings
Data coverage for water services in health care facilities, by
from the 2015 LMICS study, data on
indicator (and number of countries with data available) and
service and 16 perthe cent had no hygiene service.
countries making up the eight SDG regions).
25
One access to water
FIGURE 15
were more readily available than for all
population with data available (billions), 2016
in five health care facilities had no sanitation service other indicators. Variations were also observed at the
16
in 2016, meaning they had unimproved toilets or no sub-national, geographic and health facility levels.
WASH IN HEALTH CARE FACILITIES
Globally, one quarter of health care facilities lacked basic water services in 2016
100
6 5 10
10 12 12
18
3 26 23
80 24 14
23
22 36
23
60
■ INSUFFICIENT DATA
87 ■ NO SERVICE
40 ■ LIMITED
70 65 74
■ BASIC
51 55
46
20
0
ia
As nd
e d
As ca
lo rie d
es
a
es
ia
ld
d
a
ric
ric
nd ibb an
ve nt ke
an
As
an
or
at
tri
i
ia
ut an
ng s
ia
rn a
rn fr
e
De ou loc
Af
al
W
St
ce
a
te rn
un
te A
rn
Am
Ze
Ca ric
O
as te
n
g nd
es rn
he
Co
ra
nt the me
-E Eas
n
w
W e
pi
r
a
ha
er
d rth
Isl pin L
Ne
ed
C
So
A
rth
Sa
op
an o
tin
d
N
b-
No
n
el
th
La
a
la
Su
all elo
ev
d
u
d
lia
ra
an
So
an
tD
Sm Dev
ra
pe
as
st
Ce
Au
Le
ro
Eu
FIGURE 16 Regional water service coverage in health care facilities, 2016 (%)
Figure 6: Water services in health care facilities by SDG region, Source: 2019 Global Baseline Report, WinHCF
21
To prevent countries in a single region from having a disproportionate impact on global estimates, global estimates are calculated from regional estimates. See Annex 1: JMP Methods for more details.
25
2019 WHO/UNICEF Global Baseline Report on WASH in Health Care Facilities, https://washdata.org/sites/default/files/documents/reports/2019-04/JMP-2019-wash-in-hcf-launch.pdf
22
Since the global population in 2016 was 7.47 billion, global estimates can be made provided data are available for countries representing at least 2.24 billion people. Note that regional
and global estimates are produced using national (or urban and rural) populations as weights, rather than the number of health care facilities (which would be more appropriate),
because population data are more readily available than data on numbers of different types of health care facilities. For further details see Annex 1: JMP Methods.
10In sub-Saharan Africa, based on data from 2016 (i.e. the beginning of the SDG era), 51 per cent of health care
facilities had basic water services, 23 per cent had limited services, and 26 per cent had no service at all. Of the 51
per cent overall coverage, basic water coverage was found to vary widely between countries, with Zimbabwe (81 per
cent), Burundi (73 per cent), Kenya (66 per cent) and United Republic of Tanzania (65 per cent), having the highest
basic coverage in health care facilities of the countries listed from eastern and southern Africa.
Basic water coverage varies widely between countries
Comoros 21
Ethiopia 30
Uganda 31
Congo 37
Zambia 40
Senegal 46
Nigeria 50
Côte d’Ivoire 57
SUB-SAHARAN AFRICA Togo 58
United Republic 65
of Tanzania
Kenya 66
Ghana 71
Burundi 73
Benin 74
Burkina Faso 79
Mauritania 81
Zimbabwe 81
LATIN AMERICA Peru 46
Figure 7: Proportion of health care facilities in sub-Saharan Africa with basic water supply, Source: 201958Global Baseline Report
AND THE Honduras
CARIBBEAN Paraguay 85
OCEANIA Papua 70
New Guinea
Globally, 21% of health care facilities had no sanitation service in 2016 51
Viet Nam
EASTERN AND
100 Indonesia 80
SOUTH-EASTERN ASIA 5
China 14 91
21 24 21
29 32
80 40
Maldives 55
CENTRAL AND
Bangladesh 45 70
■ INSUFFICIENT DATA
60
SOUTHERN ASIA
48
Sri Lanka 99
■ NO SERVICE
40 ■ LIMITED
Armenia 39 ■ BASIC
NORTHERN AFRICA Lebanon 61
SANITATION SERVICES IN HEALTH CARE FACILITIES
20 41
AND WESTERN
23 ASIA Azerbaijan 10
0 Kuwait 10
es
ia
pe
an
ia
es
ia
es
ia
d
ld
a
ric
an
As
As
an
As
or
tri
tri
at
be
ro
Serbia 96
Af
al
W
St
ce
un
un
Eu
n
rn
n
ib
Ze
er
er
O
n
r
ng
Co
Co
te
Ca
ra
h
d
st
Andorra 10
w
es
ut
an
pi
ha
ea
Ne
ng
ed
e
So
W
lo
th
Sa
ica
h-
pi
op
ve
EUROPE AND
d
d
Czechia 10
nd
ut
b-
lo
d
er
an
De
an
el
an
ve
la
So
Su
m
ev
ia
a
nd
De
ra
A
NORTHERN
ica
Estonia 10
tD
ric
d
l
ra
nt
an
sla
n
Af
er
ed
as
r
st
Ce
he
lI
ia
Am
Au
AMERICA
Le
ck
Lithuania 10
rn
al
As
rt
lo
he
Sm
No
tin
nd
n
rt
Montenegro 10
er
La
No
La
st
Ea
San Marino 10
FIGURE 28 Regional sanitation services in health0care facilities, 2016 (%) 20 40 60 80 100
Figure 8: Sanitation services in health care facilities by SDG region, Source: 2019 Global Baseline Report, WinHCF
FIGURE 19 Proportion of health care facilities with basic water services, by country and SDG region, 2016 (%)
Four SDG regions had estimates of no sanitation service, Coverage of basic sanitation services varied widely
ranging from 5% in Eastern and South-Eastern Asia to 40% among the 18 countries with estimates available in 29
in Central and Southern Asia. In sub-Saharan Africa (the 2016 (Figure 29). In 10 of these countries, fewer than
GLOBAL BASELINE REPORT 2019
only SDG region to have an estimate for basic services) one in four health care facilities had basic sanitation
less than one in four health care facilities (23%) had basic services.
services. Insufficient data were available to generate any
regional estimates for the other four SDG regions.
11
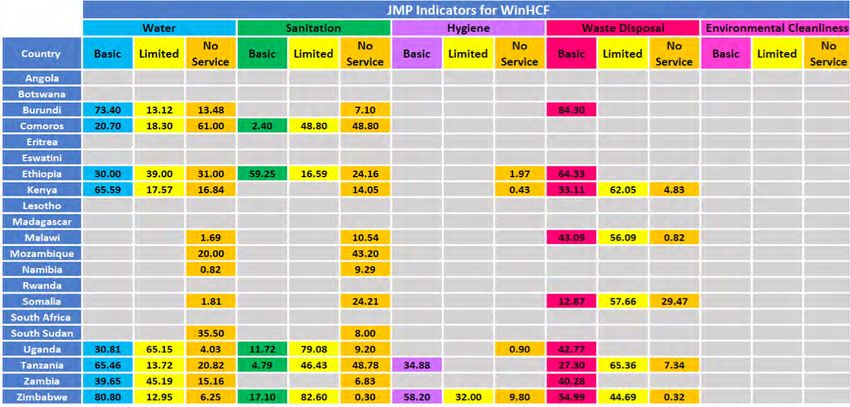
Estimates of basic sanitation services were available for 18 countries in 20162.3 WASH IN HEALTH COVERAGE IN EASTERN AND SOUTHERN AFRICA
In ESAR, Zimbabwe was the only country with complete coverage data across all service ladders for four out of the five WinHCF indicators, water, sanitation, hygiene and
waste disposal (Figure 9). Complete26 estimates across all water service ladders were available for just eight countries, complete sanitation and waste disposal estimates were
available for just five countries, complete hygiene estimates were available for just Zimbabwe, and there were no estimates at all for environmental cleanliness. Globally, only
four countries had data on environmental cleaning; as a result, this could not be assessed at all at the regional level.
Figure 9: Available coverage data for WASH in health care facilities for countries in UNICEF’s Eastern and Southern Africa Region, Source: 2019 Global Baseline Report
26
Complete: refers to data across all service ladders for a given indicator
12You can also read