Effective measures against eutrophication - Living Coast Project- a story about regaining good ecological status in coastal areas - BalticSea2020
←
→
Page content transcription
If your browser does not render page correctly, please read the page content below
Living Coast Project

Effective
measures against
eutrophication
– a story about regaining
good ecological status in coastal areas

Linda Kumblad & Emil Rydin

                                     Effective measures against eutrophication • 1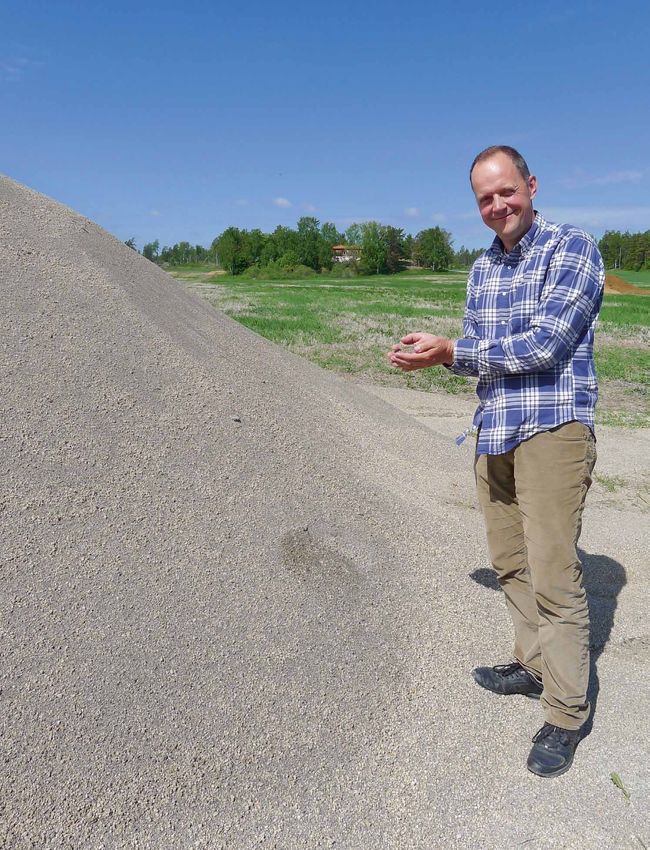
Seven years ago, Björnöfjärden in Värmdö Municipality was
      one of the most eutrophic bays in the Stockholm archipelago.
      Oxygen-free “dead zones” were widespread and nutrients were
      leaking from a number of different sources.

      After the implementation of remediation measures, Björnöfjär-
      den is now a healthy bay with clear water and rich plant and
      animal life and is on the way to having a natural fish community
      and oxygenated bottom waters with bottom dwelling animals.

      This is the Living Coast’s White Paper that describes the
      project’s implementation, results, costs, conclusions and re-
      commendations. If you want to learn more, see the complete
      White Paper on our website (in Swedish).
      www.balticsea2020.org.

      © Published bv BalticSea2020, June 2018
      Authors: Linda Kumblad and Emil Rydin
      Graphic design and original: Maria Lewander/Grön idé AB
      Illustrations: Anna-Lena Lindqvist/Lindqvist Grafik&InfoDesign AB
      Photos: Living Coast Project, unless otherwise stated.

2 • Effective measures against eutrophication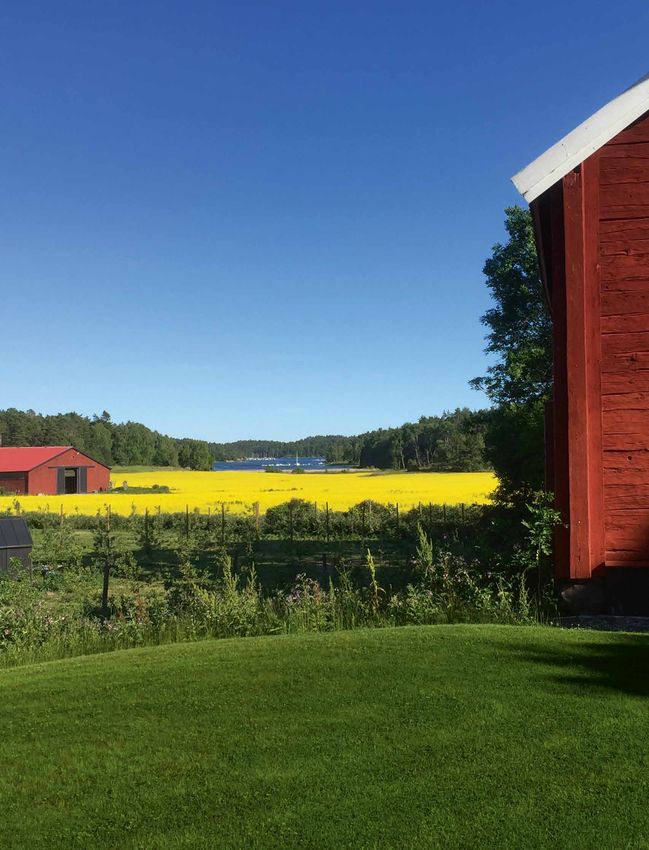
Clean water in Björnöfjärden again
                            During 2011, the BalticSea2020 Foundation initiated the Living Coast project. The objec-
                            tive was to show that it is possible to restore a eutrophic bay and to find out what it costs and
                            what other lessons can be learned from such a project. The project has been permeated by a
                            scientific approach and has had the goal to summarise and communicate results, approaches
                            and experiences.

                            The project was conducted in Björnöfjärden, a bay that can be described as a “miniature
                            Baltic Sea” because of extensive eutrophication, limited water exchange and large areas of
                            anoxic (oxygen depleted) bottom waters. Within the project we implemented measures that
                            reduce the supply of the nutrients nitrogen and phosphorus from land and bottom sediments
                            to the water, thereby regaining good water quality and an improved environment. The pro-
                            ject mainly focused on phosphorus as more measures have been developed to reduce the
                            phosphorus supply. In addition, it is often phosphorus that regulates eutrophication in Baltic
                            Sea archipelagos.

                            On the basis of the results in Björnöfjärden, we aimed higher and calculated what emission
                            reduction the measures could contribute if they were fully implemented, such as along the
                            whole of the Swedish Baltic Sea coast.

                            The objective of the project was achieved. This publication is the Living Coast’s White
                            Paper (1.0) which describes preparatory studies, implementation, actions, results, costs and
                            conclusions.

                            We hope that our work inspires and motivates to more remediation work and that this text
                            contributes to knowledge and experience on how the work can be done. The Water Fram-
                            ework Directive applies to the Baltic Sea coastal waters and the Living Coast project hopes to
                            strengthen the water management efforts with the knowledge and experience gained during
                            the work of restoring Björnöfjärden. On our website, www.balticsea2020.org, you can find
                            more information about the Living Coast project, the complete white paper, the project’s sci-
                            entific publications and other documentation.

                            /Linda Kumblad and Emil Rydin, BalticSea2020
Photo: Malin Holestad/SvD

                                                                             Effective measures against eutrophication • 3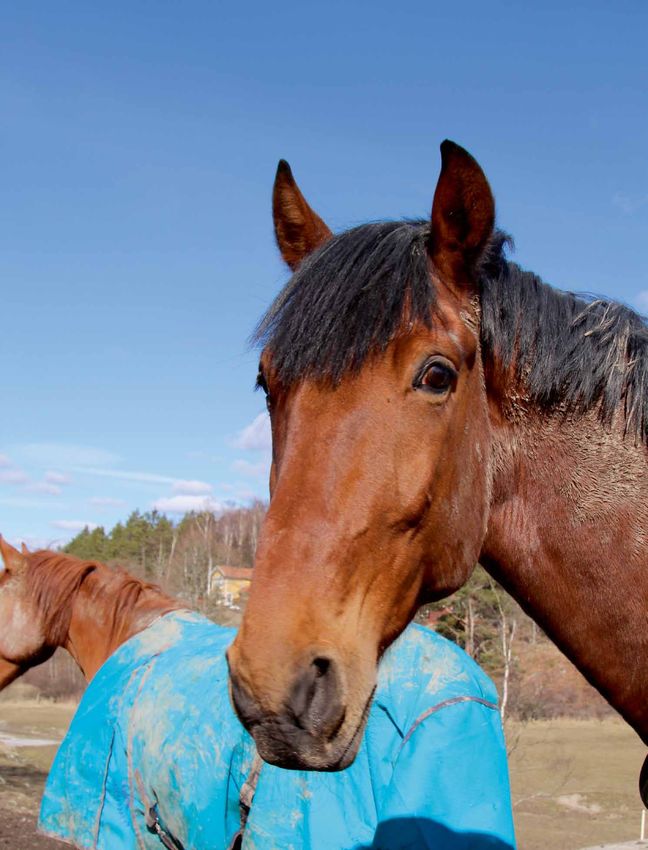
Contents
      Eutrophication a major challenge for the Baltic Sea…5

      Living Coast – a full-scale remediation project…9

      Preparation, evaluation and action…13

      Measures to reduce nutrient losses from agriculture…17

      Horse keeping also contributes to eutrophication…23

      Toilet waste must be removed from the coast…27

      Excess phosphorus is bound in the sediment…31

      Measures to strengthen predatory fish stocks…37

      Potential actions and effects…41

      Björnöfjärden has regained good water quality…47

      Living Coast from a Baltic Sea perspective…53

      Conclusions & recommendations…58

      References…60

4 • Effective measures against eutrophication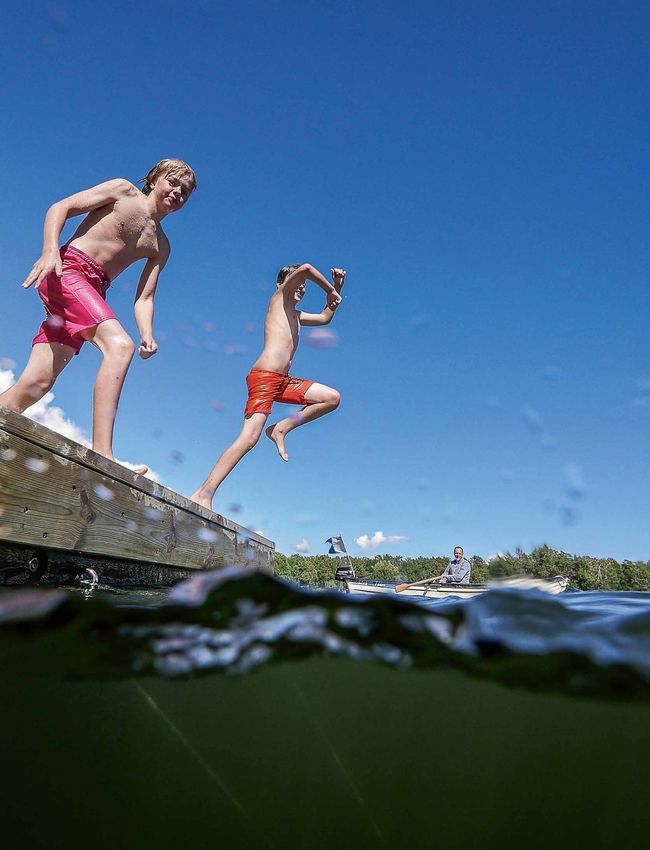
Eutrophication
                               – a major challenge
                               for the Baltic Sea
                               In the Baltic Sea, eutrophication is a widespread problem that degrades
                               water quality, affects plant and animal life and causes oxygen deficiency
                               in the bottom waters and sediments, both in the offshore areas and in
                               the coastal zone. The effects of eutrophication occur when there is an
                               excess of nutrients in the water. Some algae then grow unrestrained at
                               the expense of others, leading to consequential effects throughout the
Photo: Per Bengtson/Grön idé

                               ecosystem. Eutrophication also has a negative impact on recreation and
                               tourism.

                                                                                             Effective measures against eutrophication • 5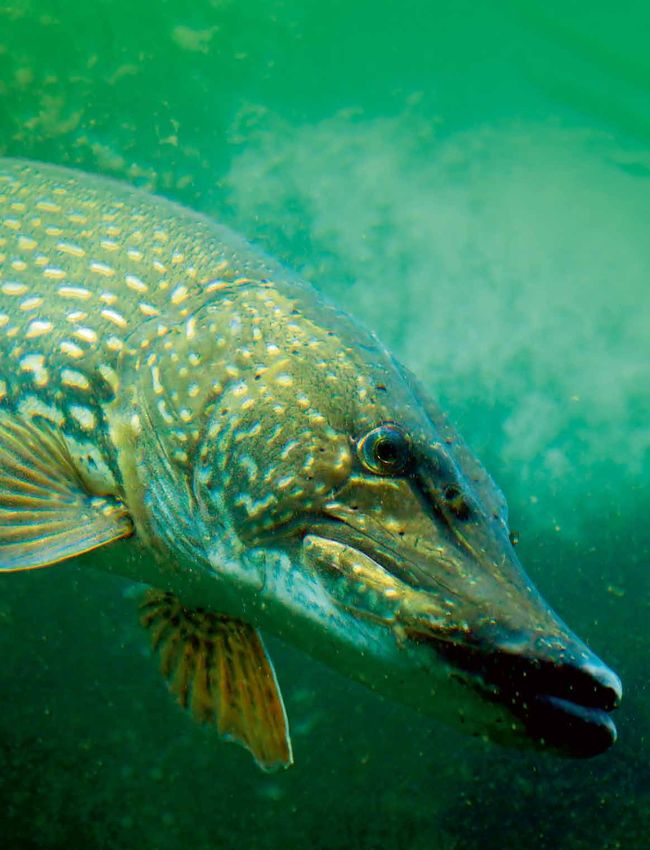
The Vicious circle
      Phytoplankton and other algae rely on nutrients such as nitrogen and phosphorus. When the
      algae die, they sink to the bottom where they are decomposed by bacteria and bottom fauna.
      During decomposition, oxygen is consumed in the bottom water and the nutrients are relea-
      sed again. If there is plenty of oxygen in the bottom water, phosphorus can bind to the iron in
      the sediment, but if the oxygen runs out, the iron loses its phosphorus-binding ability. Then
      the phosphorus leaks back into the water and becomes available for phytoplankton and other
      algae. More algae growth, in turn, contributes to even more organic material to be broken
      down, and even more anoxic bottoms; a ”vicious circle” arises.

      Where do the nutrients come from?
      About one third of the nitrogen and one tenth of the phosphorus that reaches the Baltic Sea is
      naturally supplied by rivers and streams1. The remainder is a result of human activities in the
      catchment area, such as discharge from sewage with poor treatment, wastewater treatment
      plants and industrial operations, agriculture and forestry, and reaches the Baltic Sea mainly
      via rivers (Figure 1). Nutrients from the catchment area mainly come from the areas where
      a lot of people live and where there is most farmland. However, the release of phosphorus
      from the sediment (the internal load) is the predominant source of phosphorus to the Baltic
      Sea waters.
         The nutrient supply from the Baltic Sea catchment area to the sea has decreased over the
      past thirty years, and is down to roughly the same levels as in the mid-20th century4 (Figure
      2). The eutrophication status throughout the Baltic Sea has gone from ”bad” (red) at the
      beginning of the 1980s to ”unsatisfactory” (orange) or ”moderate” (yellow)5 (Figure 3). The       Nutrients that reach the Baltic
      reason that eutrophication persists and the recovery takes a long time is the large amount of     Sea mainly enter via rivers
      nutrients that already are present the sea, where they are turned over year after year4, and      that bring nutrients from, for
                                                                                                        example, wastewater treatment
      the Baltic Sea’s limited water exchange that means that nutrients that end up in the sea, stay    plants, industrial operations,
      for a long time.                                                                                  forestry and agriculture.

                                                                                                                                          Photo: Stefan holm/shutterstock

6 • Effective measures against eutrophication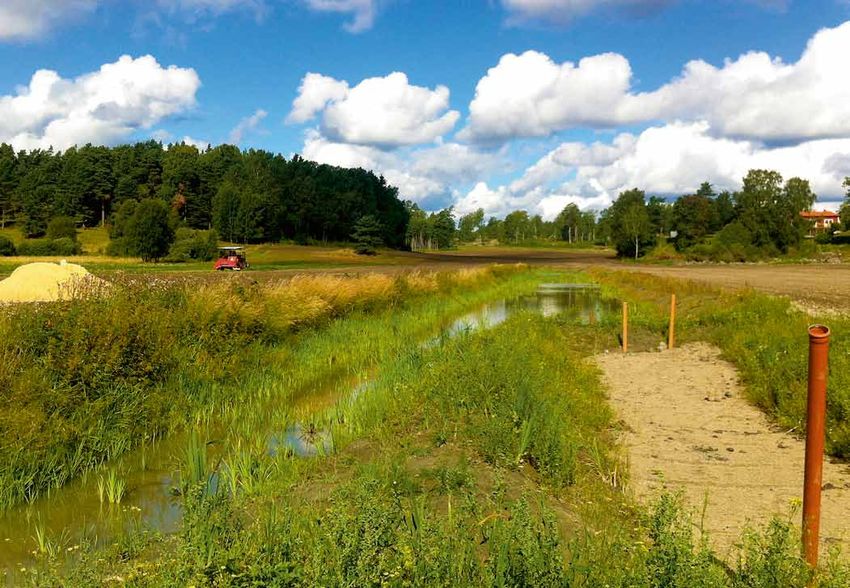
Sources of nutrients in the Baltic Sea
Phosphorus (%/year) Nitrogen (%/year)
Forests 19%
Agriculture 6%
Forests 1%
Small sewage Small sewage
systems 6% systems 8%
Internal load Agriculture 53%
80% Wastewater
treatment
plants 6% Wastewater
treatment
Other 1% plants 10%
Other 10%
Figure 1. Source distribution of phosphorus and nitrogen to Baltic Sea waters. The size of the external nutrient
load to the whole Baltic Sea (31 thousand tonnes of phosphorus/year and 826 thousand tonnes of nitrogen/year) is
from Helcom’s PLC-6 (2018)2 and the source distribution of the external nutrient load from Arheimer, et al. (2012)1.
The internal phosphorus load is estimated by Savchuk (2018)3 to 100–150 thousand tonnes of phosphorus/year.
The internal nitrogen turnover in the Baltic Sea is complex and is not in the diagram of nitrogen sources.
The load from the catchment area Eutrophication status in the Baltic Sea
10 Ecological status
Phosphorus (1,000 tonnes/year) Nitrogen (100,000 tonnes/year)
Nitrogen High
Good
Moderate
5 Unsatisfactory
Bad
0
Phosphorus
60
40
20
0
1850 1900 1950 2000 1920 1940 1960 1980 2000
Figure 2. The load of nitrogen and phosphorus in the Figure 3. The aim of the Baltic Sea Action Plan is for the Baltic
Baltic Sea from the catchment area increased significantly Sea to be unaffected by eutrophication. However, it takes time
from the 1950 to 1980, and then decreased as a result of to achieve positive results and it was only in recent years that
measures. Figure data from Gustafsson (2012)4. the ecological status has improved. The figure is from Andersen
et al. (2015)5 and the line represents a five-year average.
Effective measures against eutrophication • 7
BALTIC SEA CONVENTION AND BALTIC SEA ACTION PLAN
        The Baltic Sea Convention (Helcom) was established in 1974 to protect and im-
        prove the Baltic Sea environment. Helcom decided on an action plan, the Baltic
        Sea Action Plan (BSAP), where the necessary measures were identified to restore
        the Baltic Sea to good ecological status by 2021. In order to reduce eutrophication,
        Helcom has estimated how much nitrogen and phosphorus emissions from each
        country in the Baltic Sea catchment area will need to be reduced annually. Accor-
        ding to the latest agreement from 2013, Sweden needs to reduce its emissions by
        almost 10,000 tonnes of nitrogen and just over 500 tonnes of phosphorus per year.
        In Sweden, water authorities drew up 2015 ambitious action programmes for the
        EU Water Framework Directive, which would also meet the Swedish BSAP quota,
        but after a government decision in 20166 , the action programmes were strongly
        watered down. Although much has been done since 2013 and water quality is better
        in many places, much remediation work remains to be done, both for Sweden and
        other countries around the Baltic Sea.
        The BSAP does not take into account the nutrients that have already reached the
        sea from land, the so-called internal nutrient load. The commitments in the BSAP
        are not legally binding, which can be a contributing factor to the slow pace of the
        remediation work.

        EU Water Framework Directive – an incentive for the Living Coast project
        Under the EU Water Framework Directive (WFD), all surface waters must achieve
        good ecological status by 2027. An important component in order to do this is to re-
        duce eutrophication. In the work on the WFD, environmental quality standards and
        action programmes are decided every six years. The first management cycle ended
        in 2009, the following 2015 and the next 2021. A work cycle begins with the map-
        ping of the environmental status and assessment of the water status and impact.
        Based on this, action programmes, management plans and environmental quality
        standards are set. The action programmes are binding for authorities and munici-
        palities, but not for individual users or landowners.
        The water management work in Sweden is divided into five different water districts
        and is led by the water authorities in the respective districts under guidance from
        the Swedish Agency for Marine and Water Management (SWAM) and the Geological
        Survey of Sweden (SGU).
        The Water Framework Directive applies to the Baltic Sea coastal waters and the
        Living Coast project hopes to contribute knowledge and experience gained during
        the work of restoring Björnöfjärden to the water management efforts.

8 • Effective measures against eutrophication
Living Coast
– a full-scale
remediation project
Seven years ago, Björnöfjärden at Ingarö in Värmdö Municipality
was one of the most eutrophic bays in the Stockholm archipelago.
Oxygen-free “dead zones” were widespread and nutrients were
leaking from a number of different sources. Now Björnöfjärden
is healthy and has clear water, with a rich plant and animal life.
The bay is also on the way to having a natural fish community
and oxygenated bottoms with bottom-dwelling animals.

                                                              Effective measures against eutrophication • 9
Successful results after action against eutrophication
The project’s systematic remediation efforts have reduced the supply of phosphorus to
Björnöfjärden’s waters by around 70 per cent. Eutrophication was caused by nutrients leach-
ing from poor sewage systems, agricultural activities, horse keeping and from earlier dischar-
ges stored in the sediment of the bay. This phosphorus is released when the sediment becomes
oxygen-free. Björnöfjärden’s environment also improved due the fact that the water exchange
with the nutrient-rich bay outside is limited. If the water exchange were greater, the water
quality in the bay outside would control the water quality that can be achieved in Björnö
fjärden.
Where do the nutrients come from?
In the area around Björnöfjärden, there are almost 1,000 homes, a farm, some horse farms
and a conference centre with a cider press, brewery and distillery operations.
The nutrients (phosphorus and nitrogen) that reach the bay from the catchment area come
partly naturally from forests and open land, but mainly from human activities in the form
of leakage from agriculture and horse keeping, as well as emissions from homes with poor
treatment of toilet waste (Figure 4). The nutrient supply was reduced by various measures
described on pages 17–40. Y Nutrients from the catch-
ment area reach Björnöfjärden
Before the project started, the largest phosphorus source to the bay’s waters was from
mainly via ditches. The supply
the phosphorus emissions of earlier years stored in Björnöfjärden’s bottom sediment (Figure varies widely over the year.
4). The accumulated phosphorus leaked back to the water to a much larger extent when the Most will come during the
spring when the snowmelt
sediment became anoxic. This is because iron, which usually binds phosphorus in sediment,
brings nitrogen and phosphorus
loses its ability to bind phosphorus in anoxic conditions. with it in both dissolved form
The natural annual phosphorus load was estimated at 58 kg phosphorus, assuming relati- and bound in
vely low losses from forests (1075 hectares, 0.04 kg phosphorus/hectare, 43 kg phosphorus/
year) and open land/pasture (243 hectares, 0.06 kg phosphorus/hectare, 15 kg phosphorus/
year).
Phosphorus supply to Björnöfjärden
Before action: approx. 840 kg/year After action: approx. 240 kg/year
Figur 4. These figures show
Forest and open land 7% Forest and open land 24% where the phosphorus that
reached Björnöfjärden’s water
Agriculture 5%
Agriculture 7% came from at the start of the
Horse keeping 2% project 2011 and when the
measures implemented have
Internal Horse keeping 4%
Small reached full effect (% per year
sewage load 42% from the respective nutrient
systems 10% Small sewage source).
systems 17%
Säby manor farm 6%
Säby manor farm 5%
Internal load 71%
10 • Effective measures against eutrophicationBjörnöfjärden
Björnöfjärden’s surface area is 1.5
km2 and the catchment area (the land
area that supplies the bay with water
from, for example, precipitation) is 15
km2. The maximum depth of the bay
is 25 metres. At a depth of about six
metres, there is a strong stratification,
a thermocline, between two water
Sä
by
masses. Under the thermocline, it is
vi
ke
oxygen-free (highlighted) for most of
n
the year, and the area of the anoxic A limited water
exchange with
bottom area corresponds to about Nämdöfjärden
outside.
half the bay’s area. The bay’s water is
brackish, with a salinity that varies
between approximately 4.0 and 5.5 Nämdöfjärden
Bj
per mille. The water exchange with
ö
rn
öf
Nämdöfjärden outside is through a
jä
rd
narrow shallow strait, and the average
en
water exchange period is about three
To jär
In
months. This is a long enough holding
rp d e
f
e- n
time for local action to provide a mea-
surable local effect.
The corresponding nitrogen contribution was 1,560 kg of nitrogen/year (forests: 1,074 kg
nitrogen/year, open land/pasture: 486 kg nitrogen/year)7. In the calculations, it is assumed
that the land in the catchment area without modern human influence would consist of wood-
land and extensive pasture and would have no point sources.
The human phosphorus load (180 kg/year) consists mainly of sewage emissions and agri-
cultural leakage. There are just over 850 residential buildings without municipal sewage con-
nections, located both on moraine and on clay soil7. About 200 properties had illegal or de-
fective sewage solutions at the start of the project9. Originally, development consisted mainly
of summer cottages with small plots, but recently, more and more properties have been used
for accommodation year-round10.
Source distribution of nutrients from Björnöfjärden’s catchment area
Phosphorus (kg/year) Nitrogen (kg/year)
Figure 5. Before action Other sewage systems,
was taken, approximately 262 kg (8%)
240 kg of phosphorus and
over 3,000 kg of nitrogen per
year were estimated to have
Other sewage
reached Björnöfjärden from Forest and
the catchment area. Based systems,
45 kg (19%) open land,
on the average nutrient loss 58 kg (24%)
per unit area and land type,
and average nutrient emis- Forest and
Small sewage
sions from different types open land,
systems,
of small sewage systems. 1,560 kg (47%)
Small sewage Arable land and 1,079 kg (32%)
Figures from Erlandsson et
systems, horse keeping
al. (2013) 7.
83 kg (34%) 55 kg (23%)
Natural Arable land
impact (24%) and horse keeping,
439 kg (13%) Anthropogenic Natural
Anthropogenic impact (53%) impact (47%)
impact (76%)
Effective measures against eutrophication • 11Intensive agriculture of approximately 45 hectares of the catchment area and about thirty
horses kept in the area also contribute to Björnöfjärden’s eutrophication.
In addition to this is the nutrient load from Säby conference facility and Smakriket Säby with
its cider press, brewery and distillery operations in the north of the bay. A few years into
the project, when more information from the area became available, it was found that the
sewage systems of Säby conference and Smakriket Säby worked significantly worse than first
estimated10, which means that the annual load to the catchment area was about 20 per cent
higher than first estimated.
The load estimates are based on the source distribution analysis of eight different sources
aggregated into the four largest: forests, arable land, open land (incl. pasture and gardens)
and small sewage systems (incl. community facilities) (Figure 5).
Internal load dominant
Although nutrient leaching from Björnöfjärden’s catchment area is significant, the lar-
gest phosphorus supply to the water came from the bay’s sediment (Figure 4), which also
applies to nitrogen11. This is because the load to the bay exceeded the sediment’s ability to
store phosphorus for many decades. Phosphorus released when, for example, algae is broken
down, leaks back to the water instead of being bound in the sediment. The situation is exa-
cerbated by the sediments having been anoxic for decades, which reduces the phosphorus-
binding ability. The phosphorus inclined to leak, which is estimated to be unreleased to the
water over time, consists in Björnöfjärden’s sediments of organically bound phosphorus and
amounts to 1.5 g phosphorus/m2 (12).
Anoxic areas spread in the 20th century
Sediment cores examined to reconstruct the oxygen situation in the bay indicate that at
Björnöfjärden’s deepest point (25 m), oxygen deficiency has occurred for at least 200 years13.
However, the large increase in the spread of anoxic bottom waters occurred during the 20th
century, especially in the 1960s to 1970s (Figure 6). It was during this time that the nutrient
load from the bay’s catchment area by all indications accelerated, in pace with the expansion
of summer accommodations around the bay. During that period, the nutrient levels were also
very high in the entire Stockholm archipelago as a result of poor wastewater treatment14.
Strong algal blooms in the archipelago were common, unlike today when the algae blooms
often originate in the offshore areas, where the phosphorus that drives the blooms mainly
is released from the deep bottoms of the offshore areas. Imports of algal blooms from Näm-
döfjärden may have been a source of nutrients for Björnöfjärden, along with increased nu-
trient loads from the catchment area. The strait between Björnöfjärden and Nämdöfjärden
was dredged in 1968, which probably increased the influx of heavier and saltier bottom
waters. If the dredging led to a less frequent exchange of bottom water since then, meaning
that the exchange of oxygenated bottom water decreased, it may also have contributed to the
greater expansion of anoxic bottom areas15.
Anoxic bottom areas in Björnöfjärden 1920–2015
Percentage anoxic bottom areas % (> 8 metres)
100
Figure 6. The percentage of
bottom areas deeper than
80 8 metres in Björnöfjärden
that has been anoxic at
least during the summer in
60
the past.
40
20
0
1925 1935 1945 1955 1965 1975 1985 1995 2005 2015
12 • Effective measures against eutrophicationPreparation,
evaluation
and action
Before the remediation work started, the bay and the catchment area
were examined for a year in order to obtain a clear picture of the
baseline and thereby measure the effects of remediation. At the same
time, a nearby bay, Fjällsviksviken, with similar eutrophication pro-
blems was examined but no action was taken. The use of a “compa-
Photo: Sveriges Vattenekologer
rison bay” made it possible to distinguish the effects of remediation
from the results of variations in weather between different years. To
reduce nutrient supply to the bay, remediation measures were imple-
mented in the area around the bay and in the water. These measures
led to a significant improvement in the environment in Björnöfjärden.
Effective measures against eutrophication • 13Monitoring of Björnöfjärden and Fjällsviksviken
A sampling programme in which water chemistry, plankton and sedimentation traps were
studied on a continuous basis16 is supplemented once a year with studies of, for example,
extension of anoxic bottoms17, fish stocks18.19, benthic fauna20 and underwater vegetation21, 22,
23
. In addition, the water level is continuously measured in the bays16, as well as the water
exchange between Björnöfjärden and Nämdöfjärden outside. The sampling started in 2011
and is scheduled to last until 2022.
Water chemistry and plankton are measured between 15 and 20 times a year, both in
Björnöfjärden’s and Fjällsviksviken’s various sub-basins and also just outside the respective
bays. In order to detect the concentration differences between surface water in different parts
of the bay at the time for sampling, a so-called volume-weighted and depth-integrated samp-
ling procedure is used. Several surface water samples from the different parts of the bay are
mixed together into a sample that is analysed and represents the entire surface water above
the thermocline for the respective basin24. In addition, at the deepest point in each sub-basin,
three water samples are taken at specific depths, evenly distributed between the thermocline
and the bottom, for the measurement of nutrients and hydrogen sulphide. At the deepest
point of the bays, temperature, salinity and oxygen are measured at one-metre intervals from
surface to bottom. Sedimentation of nutrients and materials in the bays is also measured in
sedimentation traps placed above and below the thermocline.
The fish communities of the bays are monitored using multi-mesh gillnets18, trap nets
and juvenile fish sampling using small underwater detonations19. The density and species
composition of the benthic fauna are examined20 and the composition and depth spread of
the vegetation belt are inventoried in annual diving investigations21,22,23. Concentrations of
aluminium in bladderwrack, benthic fauna and perch are also measured annually to see if the
Photo: Fredrik Sederholm
aluminium treatment of the bottoms to stop the bay’s internal load contributed to increased
levels in plants and animals25.
Both Björnöfjärden and Fjällviksviken are also included in the Svealand Coastal Water
Management Association (SKVVF) surveys, in which a large number of stations are studied,
which form the basis for the status classification of Svealand’s coastal waters according to the
water management assessment program.
Water quality in Björnöfjär-
Björnöfjärden’s contributing water courses Y
den (above) and in the catch-
In order to identify nutrient sources and appropriate measures in the catchment area and to ment area (below) is examined
more than 15 times a year in
evaluate the effects of action, water samples are also taken in all major waterways26. In some
order to be able to monitor how
waterways, samples are taken only in the outlet, in others samples are taken at several points the environment changes as
to be able to distinguish the effects from different sub-areas or activities (Figure 7). New a result of reduced nutrient
supply due to remediation
sampling points were added when new sources were discovered or when measures were im-
measures.
plemented. Sampling is usually done once a month, but more often during high water flows
during spring and autumn. In order to calculate the transport of nutrients from different sub-
catchment areas, water flow calculations from SMHI are used. This type of study is the basis
for assessing the nutrient contributions of different sources and the effects of remediation
measures. It often needs to run for several years as differences in precipitation between years
affect when the nutrient transport takes place.
Figure 7. The Björnöfjärden
catchment area (thicker red line)
has been divided into ten smaller
sub-catchment areas (dashed
red lines). The levels of nitrogen
and phosphorus in the contribu-
ting waterways of these areas
Sä
by
are studied around 20 times a
v
ik
en
year (sampling points marked
A limited water in red).
exchange with
Nämdöfjärden
outside.
Nämdöfjärden
Bj
ör
nö
fjä
rd
en
To jär
In
rp de
f
e- n
14 • Effective measures against eutrophicationPhoto: Sveriges Vattenekologer
The ecosystem is studied
Y
each year in both Björnöfjär-
Measures to reduce eutrophication
den and in the comparison bay In order to reduce the nutrient supply to the water and to counteract the effects of eutrophica-
Fjällsviksviken. To be able to
tion, a number of measures were implemented, both in the Björnöfjärden catchment area and
identify changes, it is important
to both be able to compare with in the bay itself (Figure 8, page 16). The total supply of phosphorus from the various sources,
what it looked like before the external and internal, ranges from approximately 3 kg to 600 kg per year. All measures are
measures started and what
important, but the greatest effect on the total phosphorus reduction was from the aluminium
changes occur naturally, for
example due to variations in treatment of sediment, followed by improved private sewage systems.
temperature and precipitation. The next page summarises the measures implemented in and around Björnöfjärden. More
information on the prerequisites and implementation of the respective measures can be found
on pages 17–40.
All measures are important
Immediately after the aluminium treatment, phosphorus levels in the bay’s water decreased
read more about… and after just a few months the levels were cut in half. It has positively affected the underwa-
the project’s investigations ter environment in many ways, as described on pages 47–52.
and analyses in the Living Land measures are estimated to cut in half the nutrient transport from land to the bay in
Coast projects complete
White Paper. the long run. It will take a few years before the measures have been fully effective, because a
large amount of nutrients are stored in the soil and ditches for a long time.
Although the aluminium treatment binds the most phosphorus and provides a rapid effect,
it is very important to also minimise the nutrient supply from land; otherwise new nutrient
stores are built up in the sediment that begins to leak to the water again.
Effective measures against eutrophication • 15Larger sewage systems, 45 kg/ Pike wetland Small sewage systems, 80 kg/year
year Through a new sewage Through a new sewage Through increased supervision, sewage system
system at the conference system at the conference counselling and financial support, the
centre and cider press at Säby centre and cider press at phosphorus reaching the bay from
Manor Farm, these phospho- Säby Manor Farm, these small sewage systems has been
rus emissions to the bay are phosphorus emissions to cut in half. Compensation has
estimated to decrease by at the bay are estimated to been paid to private property
least 70%. decrease by at least 70%. owners who have switched
to a sewage solution where
toilet waste is collected and
transported away from the
area.
Agriculture, 38 kg/year
By liming the fields to improve soil structure,
installing phosphorus ponds with lime filter
beds and trench draining with lime in-
mixture, the phosphorus leakage
from the fields is estimated to
have decreased by just over 80%.
Implantation of bladderwrack
Bladderwrack has been planted
in several locations in the bay.
Seaweed belts are important
for fish fry and small animals
that live here, which in turn
provide important food for fish
and birds.
Horse keeping, 17 kg/year
Through the daily manure-clearing
of pastures, storage of manure on a
watertight manure plate, protec-
tion zones around ditches, soil sta-
bilisation and drainage of trampled
land, nutrient leaching from the
horse farms has been reduced by
around 70%.
Fishing ban Internal load, 600 kg/year Outdoor toilets in the nature reserve,
To regain a strong pike With aluminium treatment 3 kg/year By equipping the outdoor
population, fishing bans of deep and anoxic bottoms, toilets in Björnö nature reserve with
were introduced during phosphorus leakage from closed tanks, nutrients and infectious
the spawning season. the bay’s sediment has been agents from toilets are taken care of
stopped. Aluminium binds the instead of leaking out to the bay.
phosphorus to the sediment
and thus stops the phospho-
rus leakage to the water. The
measure has reduced the
phosphorus supply to water by after action
just over 80%. yet to be addressed
cannot be corrected
FIGURE 8. In order to reduce the nutrient supply to the water and to
combat the effects of eutrophication, a series of measures were imple-
mented, both in the Björnöfjärden catchment area, and in the bay itself.
The total supply of phosphorus from the various sources ranges from 3
to 600 kg per year. All measures are important, but the greatest effect
on the overall phosphorus reduction was from aluminium-treatment of
sediment, followed by improved private sewage systems. These diagrams
show the effectiveness of the measures to reduce the phosphorus
supply from the various sources. The size illustrates relative differences
in annual supply from the sources.
16 • Effective measures against eutrophicationMeasures to
reduce nutrient
losses from
agriculture
Agriculture is today the single largest source of nutrients from land to the Baltic
Sea and accounts for about half of the total nutrient supply2. Since the 1950s, the
agriculture in Sweden has undergone rapid development to intensify the produc-
tion on ever larger farms, which are often specialised in plant or animal produc-
tion27, 28. This development, combined with extensive trenching, has contributed to
nutrient losses from operations that reach the Baltic Sea to varying degrees, where
sensitive environments become eutrophic and are damaged28.
Effective measures against eutrophication • 17Measures have reduced the supply – but more needs to be done
Measures in areas such as wastewater treatment, industry, forestry and agriculture have redu-
ced the nutrient supply to the Baltic Sea, which today is judged to have returned to the levels
of the 1960s (for phosphorus)4. In agriculture, the measures have, for example, resulted in
improved manure handling, fertilisation restrictions and counselling to farmers, as well as
opportunities for financial support for certain environmental protection measures. Neverthe-
less, more efforts are needed, at the same time that a resource-efficient food production is
maintained.
Today, large quantities of nutrients are imported into the Baltic region in the form of
commercial fertilisers for plant production and feed for livestock30. The manure produced in
the region is poorly used; only half of the nutrients in the manure is converted to harvested
crops31. The rest remains in the ground or is lost to air or water, and contributes to eutrophi-
cation. The nutrient flow is largely one-way. For efficient nutrient utilisation without nutrient
leaching to the environment, the cycle of nutrients needs to be closed. It is also important to
take good care of the fields through careful crop selection, cultivation techniques, working of
the soil and manure yields, as well as to ensure that the soil has a good structure and good
drainage conditions so that crops can use the nutrients in the soil effectively.
Choice of measures
In order to increase nutrient utilisation and minimise the impact of agriculture on the Baltic
Sea, both short- and long-term measures are needed, both at the farm level and at the Baltic
Sea catchment level.
• Examples of large-scale/structural measures are to introduce economic incentives to re-
duce imports of commercial fertiliser and animal feed and thereby stimulate increased
recycling of livestock manure to plant production in order to close the nutrient cycle to a
greater extent.
• Examples of measures at the farm level are having safe manure handling, avoiding over-
dosing with fertilizer, using stored phosphorus in the soil, keeping the soil overgrown
during the autumn, liming the fields to improve soil structure, installing lime filter ditches,
protection zones along waterways, phosphorus ponds and lime filter beds.
It is crucial for a high action effect that the right measures are implemented in the right
order, at the right place and at the right time32. Often 90 per cent of the nutrient losses in a
catchment area are from 10 per cent of the area, during 1 per cent of the time. Consequently,
site-specific knowledge is important.
There are a number of different measures that can be implemented to minimise nutrient
leaching from agricultural activities. Within the Living Coast project, several different agricul-
tural measures were implemented: structure liming, phosphorus ponds with lime filter beds,
two-step ditches and lime-filter ditches, see pages 20 – 22.
READ MORE ABOUT…
How to reduce nutrient load in the Baltic Sea in the complete Living Coast White Paper and in
reports from SLU33,34 and the Swedish Board of Agriculture32. An action catalogue is availa-
ble in the water authorities’ Water Information System of Sweden (www.viss.lansstyrelsen.
se). The Goodla project has gathered readily accessible knowledge about environmental
measures in agriculture on film. The project is run by SLU and LRF and is financed by Formas
(https://www.slu.se/institutioner/mark-miljo/samverkan/goodla/).
Y For farm-level actions to be
successful, local involvement
and good knowledge of the site
are required. The agricultural
measures at Björnöfjärden
were implemented in coopera-
tion with the farmer of Säby
Farm.
18 • Effective measures against eutrophicationPrerequisites for agricultural measures
Responsibility
It is the farmers’ responsibility to ensure that the necessary environmental measures are im-
plemented. The county administrative board has responsibility for the activities for which a
permit is required, but the supervision is often delegated to the municipalities. The require-
ment for agricultural companies to reduce nutrient leaching to bodies of water that do not
achieve good ecological status is possible regardless of whether environmental aid from, for
example, the Rural Development Programme is obtained or not. However, such call for action
have not yet been made in Sweden.
For agricultural companies with activities subject to permits (with animal husbandry),
environmental improvement measures in accordance with the Environmental Code can be
binding for individual farmers. The instruments available for this are supervision and self-
inspection. For other agricultural companies (and horse keeping), the action potential is in
cooperation, consultations, recommendations, agreements and compensation, where opp-
ortunities for environmental aid and compensation in the rural development programme or
other funding have a crucial role in actions taking place.
Financing
Support for the financing of agricultural and horse keeping activities is mainly carried out
through the Rural Development Programme (administered by the Swedish Board of Agri-
culture) and LOVA grants (local water manangement projects administered by the county
administrative board). Both require co-financing.
Y To obtain high efficiency
of actions, t is crucial that the
Counselling
right measures are implemen-
ted in the right order, at the Counselling plays a key role in the remediation work in agriculture. The counselling project
right place and at the right time. Greppa Näringen [Getting hold of nutrients], which is a collaboration between the Board of
Agriculture, the Federation of Swedish Farmers (LRF) and the county administrative boards
(2001-2020), has led to an annual reduction in nutrient leaching by 790 tonnes of nitrogen
and 15-30 tonnes phosphorus, while at the same time helping to make every single farm more
resource-efficient, according to the project itself.
LIVING COAST on measures in the agricultural landscape
The pace of action in agriculture is too low to achieve the objectives of, for ex-
ample, the Water Framework Directive, Sweden’s national environmental targets
or the Baltic Sea action Plan (BSAP).
The municipal supervision of agricultural activity is inadequate. The fact that ac-
tion is not being required to a greater extent may be due to there not being enough
overview and knowledge to identify the main nutrients sources.
The individual farmer, with unique knowledge of his or her land, can often by small
means reduce nutrient losses to waterways. Clear incentives are needed that
reward farmers who minimise the nutrient loss from their activities.
Agricultural measures (and other measures) need to be carried out on the basis of
a catchment area perspective. The county administrative boards have an im-
portant role as initiators, coordinators, catalysts and driving forces, and the work
should be coordinated by a catchment officer or action coordinator.
The costs for a necessary pace of action need to be identified and distributed
between agricultural companies and the public sector, and a long-term plan for
investment needs to be developed. Short-term, unpredictable investments are at
risk of being ineffective, which is why better evaluation of action effects is neces-
sary.
There is room to reduce the impact of agriculture on the Baltic Sea without the
need to reduce production. Structure liming can even increase crop yield.
Effective measures against eutrophication • 193
Agricultural measures 2
within Living Coast 4 2
1
Before
1
Structure liming
After
Clayish soil is often compact (left).
In structure liming, burned lime or
quenched lime is mixed into the soil. It
makes the soil more porous (right), so that
the crop’s roots more easily access water
Water and nutrients. The crops grow better and
Nutrients phosphorus leaching can be reduced by up
to 50 per cent.
2
Phosphorus pond
c with lime filter bed
b A phosphorus pond with lime filter beds
3
can reduce nutrient transport by up to 60 per Lime filter ditch
cent for phosphorus and 25 per cent for nitro- In trench draining, excess water is di-
a gen. Water from the fields’ drainage system verted from the field into buried pipes.
is collected in the deep part of the pond (a) When the pipes are dug down, lime is mixed
where large phosphorus-rich particles sink into the soil. The lime is active for about 30
to the bottom. Smaller particles are trapped years and binds the phosphorus that is dis-
among aquatic plants in the shallow part (b). solved in the water into the soil around the
Phosphorus in dissolved form is trapped in pipes. Trench draining is necessary for the
the lime filter beds (c). Phosphorus that is crop to grow well. If it grows poorly, nutrients
trapped in the pond can be dug up and re- leach out of the field instead of being taken
used on the field. up in the crops.
1. STRUCTURE LIMING Figure 9. If the proper agri-
cultural methods are used,
Structure liming is a well-known agricultural measure that makes the soil structure of clay the harvest will be good, while
soil more fine-grained and porous, so that water and nutrients are kept in the soil and the leaching of nutrients and organic
material is minimised. In coope-
roots can grow deeper. The measure contributes both to a reduction in nutrient transport and ration with Säby Farm, located at
to a better growth of the crop, and does not require specific maintenance. Björnöfjärden, four agricultural
Structure liming is suitable in well-drained fields in the southern and central part of Swe- measures were implemented to
reduce the impact of the farm:
den where soils with a high clay content are common35. structure liming, phosphorus
ponds with lime filter beds, lime
Structure liming in figures filter ditches and two-stage
ditches.
• Structure liming can cut in half phosphorus losses from arable land that has a clay content
over 20 to 30 per cent36,37.
• In Sweden, the action potential is the largest in Östergötland, Uppsala, Västmanland and
Södermanland counties. So far, only just over 4 per cent of the country’s suitable arable
land has been structure limed38.
• Today, there is uncertainty about the long-term effect of structure liming. The duration af-
fects the treatment cost which varies between SEK 900 and 2,700 per kilogram of phospho-
rus, depending on whether the effect lasts for 30 or 10 years, respectively. It is uncertain
why the effect of the structure liming of some clay soils appears to fade within a decade,
as seen in the structure liming at Bornsjön.
20 • Effective measures against eutrophication4
Two-stage ditches Y At Säby Farm at Björnöfjärden, structure liming and phosphorus ponds with lime-filter beds, among
Two-stage ditches can other measures, have reduced the nutrient load from agriculture to the bay by just over 80 per cent. In
reduce nutrienttransport the middle of the picture, the narrow phosphorus pond is visible with the lime filter bed on the right. To
and promote biodiversity. the left of the pond is a pile of structure lime to be incorporated into the clay field.
At high water levels, water
spreads out on grass plateaus
where nutrients are absorbed
and particles are trapped. The Conditions for structure liming
risk for erosion decreases and
aquatic animals thrive in the
There are recommendations from, among others, the Board of Agriculture and the Greppa
middle trench. Näringen project on where and how to implement the structure liming. But it is up to the
individual farmer to take the initiative and implement the measure. Funding support can be
sought primarily from the county administrative boards’ LOVA grants, but also from the Board
of Agriculture’s Rural Development Programme.
READ MORE The structure liming in Sweden has mainly been carried out in the scope of major remedia-
ABOUT… tion projects. In order to increase the pace of action and to improve the structure liming of
Structure liming in “Soil-
individual farmers, the following are needed:
structure improvement • More targeted financing support for structure liming. The measure is often too expensive
measures – Structure without support financing.
liming of clay soil” (SLU), • Driving forces that coordinate and administer the measure for larger areas, as farmers find
at Goodla (SLU/LRF) it difficult and financing support is sometimes uncertain.
and the websites of the
Greppa Näringen project
• A quicker response to decisions on financing support so that the applicant can have time
and Project Born. for the structure liming during the short period of the year in which circumstances are
There is also more infor- suitable.
mation in the full Living
Coast White Paper and
the report ”Structure 2. Phosphorus pond with lime filter bed
liming on a large scale
Nutrient transports from arable land and land around livestock farms may be reduced if run-
– what is required and
what does it cost” 38. off water is led through a phosphorus pond with lime filter beds. The installations should be
located close to the source of the pollutant, preferably high up in the catchment area next
to agricultural land with high phosphorus losses. For the phosphorus pond to be effective,
it must be large enough to even out the flow so that most of the water flow is led through
the lime filter. At optimal placement, the installations are cost-effective measures, but they
require relatively extensive supervision and maintenance to maintain good functioning.
Effective measures against eutrophication • 21Phosphorus ponds with lime filter beds in figures
READ MORE
• For the most arable land inclined to leaching in the Baltic Sea coastal areas, phosphorus
ABOUT…
ponds with lime filter beds are estimated to be a suitable measure for about 15 per cent of
Phosphorus ponds with
the area, and lime filter beds alone are suitable for another 55 per cent39. lime filter beds in the
• The average treatment effectiveness seen over 20 years for the installations is up to 60 per complete Living Coast
cent for phosphorus and 25 per cent for nitrogen39. White Paper and the report
“Action potential in agri-
• Optimally placed installations can be cost effective, SEK 500-1,300/kg phosphorus assu- culture and the possibility
ming a life span of 20 years39. of reduction with lime filter
beds and phosphorus
Conditions for phosphorus ponds and lime filter beds ponds”39.
It is up to individual farmers to establish phosphorus ponds and lime filter beds. Financing
support can be applied for from the Rural Development Programme through the Swedish
Board of Agriculture. To increase the rate of action so that more phosphorus ponds with lime
filter beds are built, environmental aid compensation needs to be increased by around 20 per
cent. This is to cover the loss of income for arable land that is decommissioned and the cost of
establishment which is often higher than what the level of aid is calculated for. The payment
procedures for environmental aid also need to be streamlined and simplified39.
It is difficult to get an installation with optimal function, in part because the function is
affected by many factors:
• Water flow: Nutrient retention is only effective at low water flow rates.
• Size: The larger the pond, the lower the water flow and the greater capture of nutrients.
• Age: when vegetation in the shallow part of the pond is established, the purification ef-
ficiency increases.
• Extreme events: Downpours, pond embankment collapses, faeces from flocks of birds and
Y A phosphorus pond will not
more, can significantly impair the pond’s function. be effective at purifying the
• Establishment/adjustment: during excavation, surfaces are exposed to erosion, which for water until after a few years
a period increases turbidity and export of nutrients to waterways. when vegetation that prevents
erosion from the pond itself has
established.
3. Lime filter ditches
Good drainage of fields is necessary both for the crop to grow well, and for minimising fertili-
zer leaching from the field. If the crop grows badly, nutrients leach out of the field instead of
being taken up by the crop. In trench draining, excess water is diverted from the field into bu-
ried pipes that flow into ditches surrounding the fields. With lime filter ditching, lime is mixed
into the soil that surrounds the trench drainage pipes. The lime effectively binds phosphorus
that is dissolved in the water, and the measure is assumed to work for about 30 years. Within
the Living Coast project, lime filter ditches were built, but are not yet evaluated, as there is
not yet enough data.
4. Two-stage ditches
Fields are dependent on ditches for good drainage, but ditches speed up the transport of nu-
trients from the fields to the sea. Two-stage ditches can be built to reduce nutrient transport
while increasing the biodiversity of the agricultural landscape. The two-stage ditches have a
middle trench, which is surrounded by higher, plant-covered terraces. In normal flows, the Y When a lime filter ditch is
water goes into the middle trench and at higher flows, the water rises onto the terrace where installed, the lime is mixed into
the backfilled soil. The lime
nutrients are absorbed, nitrogen escapes to the air and nutrient-rich soil particles are trap- binds phosphorus that is dis-
ped among the vegetation. The risk of erosion from the edges of the ditch is small. Both the solved in the water.
middle trench and the terrace are good environments for plants and hiding places and fee-
ding areas for animals. Within the Living Coast project, two-stage ditches were built, but will
not be evaluated. This is because the two-stage ditch was built relatively late in the project
and it takes a few years before the ditch acquires the intended function.
22 • Effective measures against eutrophicationHorse keeping
also contributes
to eutrophication
In Sweden, horse keeping is an extensive
small-scale business often conducted by
private individuals as a leisure pastime40.
It is common for horse manure to be
handled carelessly and that pastures
are used so intensively that the
vegetation cover is worn down,
which leads to nutrient leaching and
eutrophication.
Effective measures against eutrophication • 23Living Coast’s 1
measures at
2
horse farms
3
4
7 cm Paddex
10 cm soil/sand
100%
20 cm Macadam
Soil weave
Dräneringsrör
50%
approx. approx. 35% approx.15%
1 2 3
Nutrient loss Daily manure clearing Protecting the soil Protection zones
from a horse farm The phosphorus loss from Avoid having more than two horses About half of the
can be reduced a horse farm can be cut in per hectare of pasture in order not remaining phospho-
by about 90 per half if the pastures are cleared to wear down the vegetation cover. With rus can be bound by plants
cent through four from manure daily, the ma- fewer horses in the pasture, stabili- in protection zones along
measures: nure is stored on a watertight sation and good drainage where the ditches and waterways.
manure plate and returned ground is easily trampled, for example The horses should be kept
to arable land where the nu- at gates and feeding locations, nutrient away from ditches with the
trients are recirculated. losses are further reduced. help of fencing.
Daily manure clearing and avoiding a bare soil-surface Figure 10. There are many
most important measures that can be done on
horse farms to reduce nutrient
An adult horse excretes as much nutrients as it receives through its feed41. The phosphorus losses. Horse breeders can do
several themselves through
leaves the horse mainly via its faeces, if it is not over-fed, then some also ends up in the uri-
changed routines and small
ne42. This often leads to high nutrient levels in soil where horses are kept 43, 44, 45,46. Some of the efforts on the farm, while
manure that is not removed from pastures is tied up in the soil, but the soil’s vegetation cover other measures require work by
contractors for various types of
needs to be complete in order to hold the nutrients from the horses. If the soil is saturated
installation work and construc-
with nutrients or the vegetation cover is worn down, the risk is very high for nutrient losses to tion.
waterways, lakes and the Baltic Sea. Measures are therefore most important where many hor-
ses are kept on a small area, especially if the horses are kept close to ditches and waterways.
Horse keeping in figures
• In Sweden, there are just over 100,000 properties where horses are kept47, most of which
(75 per cent) only have one to five horses48. About 75 per cent of the horses are in or near
larger towns49.
• The most horses are in Skåne, Västra Götaland and Stockholm counties47.
• At more than 2-3 horses per hectare, the soil is worn down and leaks nutrients50.
• Nutrient loss would decrease 20-30 per cent if the compound feed was excluded
for recreational horses51.
24 • Effective measures against eutrophicationThe four measures
reduce nutrient leaching
by about 90%.
Ground level
Vegetation layer
Sand+lime product
Geotextile
Lime bedd+Macadam
Drain pipe
approx. 10%
4
Lime filter
Ditch water down-
stream of a horse
farm can be further
purified if the water is led
through a lime filter bed
in s ditch where dissolved
phosphorus is bound.
Y If more than two to three horses are kept per hectare of pasture, the soil is at risk of being worn so
hard that the vegetation cover breaks down and the soil’s ability to bind nutrients deteriorates signifi-
cantly.
Conditions for measures on horse farms
Responsibility
Horse keepers are are responsible for ensuring their activities do not damage the environ-
ment or interfere with the surroundings. Small-scale horse activities are not covered by the
Board of Agriculture’s rules on animal husbandry in agriculture, but are by general rules of
consideration in the Swedish Environmental Code52. In addition, there are regulations and
general guidelines issued by the Swedish Board of Agriculture and the Swedish Environmen-
tal Protection Agency to be followed. The municipality may also decide on local regulations
for manure handling53. In practice, the regulation of the small-scale horse farm is unspecific
and the supervision of the horse farms is sparse or non-existent. This contributes to that the
pace of action is low.
Financing
So far, there has been no special support financing earmarked for measures that reduce nu-
trient losses from horse keeping. Within the new LOVA ordinance (Swedish Ordinance on lo-
cal water management projects)54, the possibility of support financing for measures on horse
farms should be considered.
Supervision & Counselling
It is the municipalities that are responsible for supervising to ensure that horse keeping is
carried out in accordance with the Environmental Code, regulations and general guidelines.
There is no advisory programme like ”Greppa Näringen” aimed at horse breeders. It would be
desirable to have an initiative from equestrian organisations.
Effective measures against eutrophication • 25Horses in summer grazing
contribute very little, if at all,
to the nutrient load on the sur-
rounding waters. They also help
keep the landscape open. If the
Photo: Malin Holestad/SvD
horses also are fed concentra-
tes, however, it entails a net
supply of nutrients that risk
contributing to eutrophication,
especially if the horses are kept
close together and the ground is
worn too hard.
Living Coast on measures at horse farms
The environmental impact of horse keeping is underestimated, the municipal
supervision is deficient and the rate of action is too low. The number of horses
in Sweden is growing and it has become obvious that horse activities contribute
to eutrophication. The problem is extensive, and what is crucial to the environ-
mental impact of horse keeping is the number of horses in relation to the area
they are kept on. Most important is to collect and manage manure right and to
ensure that the ground is not worn too hard. Nutrient losses from horse keep-
ing can be fixed relatively easily, but small-scale horse farms fall between the
cracks, both in terms of regulation and supervision, which is why the pace of
action is behind. In addition, horses are often kept by private individuals or as-
sociations with limited finances and environmental knowledge. They often lease
stables, which further complicates the implementation of measures.
To reduce the environmental impact of horse keeping, the following is needed:
• Information to horse owners: Horse breeders often do not know that horses
contribute to eutrophication. Horse owners are a large and diverse target group,
which can be difficult to reach. Readily available information and concrete
advice on measures are needed, preferably within the framework of an advisory
programme.
• Adapting legislation to small-scale horse keeping: Existing regulations are not
adapted to the prevailing reality, where many operators have a few horses, often
on a small area. In the Environmental Code, there is support for requiring action,
but this rarely happens. New regulations are needed, which clarifies that:
1) It is important to collect and manage manure in a safe way
2) The environment is damaged when many horses are kept on a small area
3) Horses should not be kept next to ditches and waterways.
• Supervision of horse farms: Municipalities need to exercise supervision in areas
with horse farms to ensure that the environment is not harmed, and to inform
about measures required to reduce the impact. READ MORE ABOUT…
measures at horse farms in
• Increased support financing: It can be costly for an individual horse owner with the complete Living Coast
a few horses to implement measures. In order to quickly improve the situation, White Paper and in the
it may be cost-effective to investigate opportunities for grants for demolition report “Nutrient leaching
from horse keeping in Swe-
and remediation of old manure storage areas and construction of new watertight den – National overview
manure slabs. These are the most expensive, but at the same time the most and proposed measures”51.
important measures.
26 • Effective measures against eutrophicationYou can also read