SIMAPRO DATABASE MANUAL - METHODS LIBRARY
←
→
Page content transcription
If your browser does not render page correctly, please read the page content below
SimaPro Database Manual
Methods Library

SimaPro Database Manual - Methods

Colophon

Title:            SimaPro Database Manual
                  Methods Library
                  PRé, various authors
Written by:
Report version:   4.14.2
Date:             February 2019
Language:         English
Availability:     PDF file
Copyright:        © 2002-2019 PRé. Some rights reserved.
                  This work is licensed under the Creative Commons Attribution-
                  Noncommercial-Share Alike 3.0 Netherlands License. To view a copy
                  of this license, visit:
                  http://creativecommons.org/licenses/by-nc-sa/3.0/nl/deed.en_US or
                  send a letter to Creative Commons, 171 Second Street, Suite 300, San
                  Francisco, California, 94105, USA.
                  If the manual is to be used for other purposes, written consent of PRé
                  is needed.

Support:
 Phone:           +31 33 4504010
Fax:              +31 33 4555024
E-mail:           support@pre-sustainability.com
Website:          simapro.com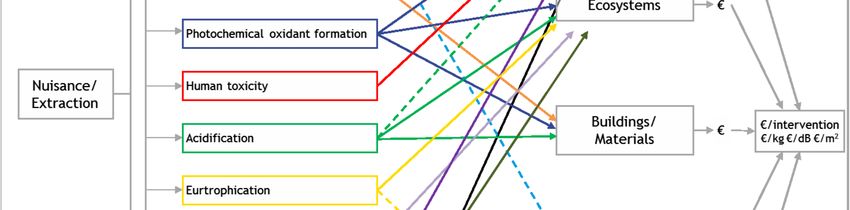
Contents
1     INTRODUCTION ....................................................................................................... 1
1.1   STRUCTURE OF METHODS IN SIMAPRO ................................................................................. 1

1.2   CHECKING IMPACT ASSESSMENT RESULTS .............................................................................. 2

2     EUROPEAN METHODS ............................................................................................... 3
2.1   CML-IA .......................................................................................................................... 3

2.2   ECOLOGICAL SCARCITY 2013 .............................................................................................. 6

2.3   EDIP 2003 ................................................................................................................... 10

2.4   EF METHOD (ADAPTED) ................................................................................................... 12

2.5   EPD (2018) .................................................................................................................. 15

2.6   EPS 2015D AND EPS 2015DX ......................................................................................... 16

2.7   ILCD 2011 MIDPOINT+ .................................................................................................. 18

2.7   IMPACT 2002+ .............................................................................................................. 20

3     GLOBAL ............................................................................................................... 22
3.1   RECIPE 2016................................................................................................................. 22

4     NORTH AMERICAN ................................................................................................. 27
4.1   BEES ............................................................................................................................ 27

4.2   TRACI 2.1 .................................................................................................................... 28

5     SINGLE ISSUE ........................................................................................................ 30
5.1   CUMULATIVE ENERGY DEMAND ........................................................................................ 30

5.2   CUMULATIVE ENERGY DEMAND (LHV)............................................................................... 30

5.3   CUMULATIVE EXERGY DEMAND......................................................................................... 31

5.4   ECOSYSTEM DAMAGE POTENTIAL ...................................................................................... 32

5.5   GREENHOUSE GAS PROTOCOL .......................................................................................... 34

5.6   IPCC 2013.................................................................................................................... 34

5.7   SELECTED LCI RESULTS..................................................................................................... 35

5.8   USETOX 2 ..................................................................................................................... 36
SimaPro Database Manual - Methods

6        WATER FOOTPRINT ................................................................................................ 38
6.1      AWARE ....................................................................................................................... 38

6.2      BERGER ET AL 2014, WAVE (WATER SCARCITY) ................................................................. 38

6.3      BOULAY ET AL 2011 (HUMAN HEALTH) ............................................................................. 39

6.4      BOULAY ET AL 2011 (WATER SCARCITY) ............................................................................ 40

6.5      ECOLOGICAL SCARCITY 2006 (WATER SCARCITY)................................................................. 40

6.6      HOEKSTRA ET AL 2012 (WATER SCARCITY) ......................................................................... 41

6.7      MOTOSHITA ET AL 2011 (HUMAN HEALTH)........................................................................ 41

6.8      PFISTER ET AL 2009 (ECO-INDICATOR 99) .......................................................................... 42

6.9      PFISTER ET AL 2009 (WATER SCARCITY) ............................................................................. 43

6.10 PFISTER ET AL 2010 (RECIPE)........................................................................................... 44

7        SUPERSEDED......................................................................................................... 45
7.1      CML 1992.................................................................................................................... 45

7.2      ECO-INDICATOR 95 ......................................................................................................... 49

7.3      ECO-INDICATOR 99 ......................................................................................................... 55

7.4      ECOLOGICAL FOOTPRINT .................................................................................................. 58

7.5      ECOLOGICAL SCARCITY 2006 ............................................................................................ 59

7.6      ECOPOINTS 97 ............................................................................................................... 60

7.7      EDIP/UMIP 97 ............................................................................................................. 61

7.8      EPD (2008) .................................................................................................................. 63

7.9      EPD (2013) .................................................................................................................. 64

7.10 EPS 2000 ..................................................................................................................... 64

7.11 IPCC 2001 GWP ........................................................................................................... 66

7.12 IPCC 2007.................................................................................................................... 67

7.13 RECIPE ......................................................................................................................... 68
1 Introduction
SimaPro contains a number of impact assessment methods, which are used to calculate impact assessment results. This
manual describes how the various impact assessment methods are implemented in SimaPro. For specific details on the
method see the literature references given or contact the authors of the method.

  Important note on changing methods

  If you want to change methods in SimaPro, it is strongly advised to copy the original method to your project first.
  By copying, you make sure you always have the original method intact in your database. Please note that once
  changes are saved, they cannot be undone!

1.1 Structure of methods in SimaPro
The basic structure of impact assessment methods in SimaPro is:
1. Characterization
2. Damage assessment
3. Normalization
4. Weighting
5. Addition

The last four steps are optional according to the ISO standards. This means they are not always available in all methods.
In SimaPro you can switch the optional steps on or off when you edit a method.

1.1.1 Characterization
The substances that contribute to an impact category are multiplied by a characterization factor that expresses the
relative contribution of the substance. For example, the characterization factor for CO2 in the Climate change impact
category can be equal to 1, while the characterization factor of methane can be 25. This means the release of 1 kg
methane causes the same amount of climate change as 25 kg CO2. The total result is expressed as impact category
indicators (formerly characterization results).

  Note
  A new substance flow introduced in ecoinvent 2.0 called ‘carbon dioxide, land transformation’ is included in all the
  methods available in SimaPro 8. This substance flow represents the CO2 emissions from clear cutting and land
  transformation.

  CO2 uptake and emissions of CO2 and CO from biogenic sources were removed from every method with effects on
  climate change. The characterization factors for methane from biogenic sources were corrected for the CO2
  sequestration.

In SimaPro, sub-compartments can be specified for each substance. For example, you can define an emission to water
with a sub-compartment of ocean. This allows you to create detailed impact assessment methods, with specific
characterization factors for each sub-compartment.

                                                                                                                         1
SimaPro Database Manual - Methods Some impact assessment methods are not as detailed as the inventory in terms of specification of sub-compartments. In this case SimaPro will choose the “unspecified” characterization factor as the default factor for a substance that has a sub-compartment specified in the inventory but has no specific characterization factor in the chosen impact assessment method. 1.1.2 Damage assessment Damage assessment is a relatively new step in impact assessment. It is added to make use of 'endpoint methods', such as the Eco-indicator 99 and the EPS2000 method. The purpose of damage assessment is to combine a number of impact category indicators into a damage category (also called area of protection). In the damage assessment step, impact category indicators with a common unit can be added. For example, in the Eco- indicator 99 method, all impact categories that refer to human health are expressed in DALY (disability adjusted life years). In this method DALYs caused by carcinogenic substances can be added to DALYs caused by climate change. 1.1.3 Normalization Many methods allow the impact category indicator results to be compared by a reference (or normal) value. This mean that the impact category is divided by the reference. A commonly used reference is the average yearly environmental load in a country or continent, divided by the number of inhabitants. However, the reference may be chosen freely. You could also choose the environmental load of lighting a 60W bulb for one hour, 100 km of transport by car or 1 liter of milk. This can be useful to communicate the results to non LCA experts, as you benchmark your own LCA against something everybody can imagine. In SimaPro, there are often alternative normalization sets available. After normalization the impact category indicators all have the same unit, which makes it easier to compare them. Normalization can be applied on both characterization and damage assessment results. PLEASE NOTE: SimaPro does not divide by the reference value (N), but multiplies by the inverse. If you edit or add a normalization value in a method, you must therefore enter the inverted value (1/N). 1.1.4 Weighting Some methods allow weighting across impact categories. This means the impact (or damage) category indicator results are multiplied by weighting factors, and are added to create a total or single score. Weighting can be applied on normalized or non normalized scores, as some methods like EPS do not have a normalization step. In SimaPro, there are often alternative weighting sets available, always in combination with a normalization set. 1.2 Checking impact assessment results Although impact assessment methods become very extensive and include more and more substances, they still do not cover all substances that you can find in your inventory. This can be a methodological issue, as some methods for example do not include raw materials as impact category. Issues can arise if you added a new substance that is not automatically included in the impact assessment method or if you introduced synonyms by importing data from other parties. SimaPro has a built-in check to show you which substances are not included in the selected impact assessment method. For each result, the substances and their amounts not included in the method are shown under ‘Checks’ in the result window. Further, under ‘Inventory results’ you can see the impact assessment results per substance. If a substance is not defined in the method, a pop-up hint will tell you this. On a method level, you can run a check which will show you which of all substances, available in the SimaPro database, are included in the method on impact category level. To run this check, select a method and click the ‘Check’ button in the right hand side of the methods window. 2
2 European methods
2.1 CML-IA
In 2001, a group of scientists under the lead of CML (Center of Environmental Science of Leiden University) proposed a
set of impact categories and characterization methods for the impact assessment step. The impact assessment method
implemented as CML-IA methodology is defined for the midpoint approach. Normalization is provided but there is
neither weighting nor addition.
There are two version of this method available in SimaPro 8: a ‘baseline’ version with 10 impact categories; and an
extended version with ‘all impact categories’ including other impact categories as well as variations of existing impact
categories, e.g. for different time frames.
The current version of CML-IA implemented in SimaPro has been updated using a version of the method uploaded in
August 2016 from the website http://www.cml.leiden.edu/software/data-cmlia.html.

2.1.1 Classification and characterization
The CML Guide (Guinée et al. 2002) provides a list of impact assessment categories grouped into
     A. Obligatory impact categories (category indicators used in most LCAs)
     B. Additional impact categories (operational indicators exist, but are not often included in LCA studies)
     C. Other impact categories (no operational indicators available, therefore impossible to include quantitatively in
         LCA)
In case several methods are available for obligatory impact categories; a baseline indicator is selected, based on the
principle of best available practice. These baseline indicators are category indicators at “mid-point level” (problem
oriented approach)” and are presented below. Baseline indicators are recommended for simplified studies. The guide
provides guidelines for inclusion of other methods and impact category indicators in case of detailed studies and
extended studies.

2.1.1.1   Depletion of abiotic resources
This impact category is concerned with protection of human welfare, human health and ecosystem health. This impact
category indicator is related to extraction of minerals and fossil fuels due to inputs in the system. The Abiotic Depletion
Factor (ADF) is determined for each extraction of minerals and fossil fuels (kg antimony equivalents/kg extraction) based
on concentration reserves and rate of de-accumulation. The geographic scope of this indicator is at global scale.

2.1.1.2   Climate change
Climate change can result in adverse affects upon ecosystem health, human health and material welfare. Climate change
is related to emissions of greenhouse gases to air. The characterization model as developed by the Intergovernmental
Panel on Climate Change (IPCC) is selected for development of characterization factors. Factors are expressed as Global
Warming Potential for time horizon 100 years (GWP100), in kg carbon dioxide/kg emission. The geographic scope of this
indicator is at global scale.

2.1.1.3   Stratospheric Ozone depletion
Because of stratospheric ozone depletion, a larger fraction of UV-B radiation reaches the earth surface. This can have
harmful effects upon human health, animal health, terrestrial and aquatic ecosystems, biochemical cycles and on
materials. This category is output-related and at global scale. The characterization model is developed by the World
Meteorological Organization (WMO) and defines ozone depletion potential of different gasses (kg CFC-11 equivalent/ kg
emission). The geographic scope of this indicator is at global scale. The time span is infinity.

                                                                                                                         3
SimaPro Database Manual - Methods 2.1.1.4 Human toxicity This category concerns effects of toxic substances on the human environment. Health risks of exposure in the working environment are not included. Characterization factors, Human Toxicity Potentials (HTP), are calculated with USES-LCA, describing fate, exposure and effects of toxic substances for an infinite time horizon. For each toxic substance HTP’s are expressed as 1,4-dichlorobenzene equivalents/ kg emission. The geographic scope of this indicator determines on the fate of a substance and can vary between local and global scale. 2.1.1.5 Fresh-water aquatic eco-toxicity This category indicator refers to the impact on fresh water ecosystems, as a result of emissions of toxic substances to air, water and soil. Eco-toxicity Potential (FAETP) are calculated with USES-LCA, describing fate, exposure and effects of toxic substances. The time horizon is infinite Characterization factors are expressed as 1,4-dichlorobenzene equivalents/kg emission. The indicator applies at global/continental/ regional and local scale. 2.1.1.6 Marine ecotoxicity Marine eco-toxicity refers to impacts of toxic substances on marine ecosystems (see description fresh water toxicity). 2.1.1.7 Terrestrial ecotoxicity This category refers to impacts of toxic substances on terrestrial ecosystems (see description fresh water toxicity). 2.1.1.8 Photo-oxidant formation Photo-oxidant formation is the formation of reactive substances (mainly ozone) which are injurious to human health and ecosystems and which also may damage crops. This problem is also indicated with “summer smog”. Winter smog is outside the scope of this category. Photochemical Ozone Creation Potential (POCP) for emission of substances to air is calculated with the UNECE Trajectory model (including fate), and expressed in kg ethylene equivalents/kg emission. The time span is 5 days and the geographical scale varies between local and continental scale. 2.1.1.9 Acidification Acidifying substances cause a wide range of impacts on soil, groundwater, surface water, organisms, ecosystems and materials (buildings). Acidification Potential (AP) for emissions to air is calculated with the adapted RAINS 10 model, describing the fate and deposition of acidifying substances. AP is expressed as kg SO2 equivalents/ kg emission. The time span is eternity and the geographical scale varies between local scale and continental scale. Characterization factors including fate were used when available. When not available, the factors excluding fate were used (In the CML baseline version only factors including fate were used). The method was extended for Nitric Acid, soil, water and air; Sulphuric acid, water; Sulphur trioxide, air; Hydrogen chloride, water, soil; Hydrogen fluoride, water, soil; Phosphoric acid, water, soil; Hydrogen sulfide, soil, all not including fate. Nitric oxide, air (is nitrogen monoxide) was added including fate. 2.1.1.10 Eutrophication Eutrophication (also known as nutrification) includes all impacts due to excessive levels of macro-nutrients in the environment caused by emissions of nutrients to air, water and soil. Nutrification potential (NP) is based on the stoichiometric procedure of Heijungs (1992), and expressed as kg PO4 equivalents per kg emission. Fate and exposure is not included, time span is eternity, and the geographical scale varies between local and continental scale. The method available with all impact categories has, comparing with the baseline version, the following impact categories available: • Global warming (different time frames) • Upper limit of net global warming • Lower limit of net global warming • Ozone layer depletion (different time frames) 4
•    Human toxicity (different time frames)
•    Fresh water aquatic ecotoxicity (different time frames)
•    Marine aquatic ecotoxicity (different time frames)
•    Terrestrial ecotoxicity (different time frames)
•    Marine sediment ecotoxicity (different time frames)
•    Average European (kg NOx-eq); Average European (kg SO2-eq)
•    Land competition
•    Ionising radiation
•    Photochemical oxidation; Photochemical oxidation (low NOx)
•    Malodorous air
•    Equal benefit incremental reactivity
•    Max. incremental reactivity; Max. ozone incremental reactivity

2.1.2 Normalization
Normalization is regarded as optional for simplified LCA, but mandatory for detailed LCA. For each baseline indicator,
normalization scores are calculated for the reference situations: the world in 1990, Europe in 1995 and the Netherlands
in 1997. Normalization data are available for the Netherlands (1997/1998), Western Europe (1995) and the World (1990
and 1995) (Huijbregts et al. 2003).

References
Guinée, J.B.; Gorrée, M.; Heijungs, R.; Huppes, G.; Kleijn, R.; Koning, A. de; Oers, L. van; Wegener Sleeswijk, A.; Suh, S.; Udo de Haes,
      H.A.; Bruijn, H. de; Duin, R. van; Huijbregts, M.A.J. 2002. Handbook on life cycle assessment. Operational guide to the ISO
      standards. Part III: Scientific background. Kluwer Academic Publishers, ISBN 1-4020-0228-9, Dordrecht, 692 pp.
Huijbregts, M.A.J.; Breedveld L.; Huppes, G.; De Koning, A.; Van Oers, L.; Suh, S. 2003. Normalisation figures for environmental life-
      cycle assessment: The Netherlands (1997/1998), Western Europe (1995) and the World (1990 and 1995). Journal of Cleaner
      Production 11 (7): 737-748.

                                                                                                                                            5
SimaPro Database Manual - Methods
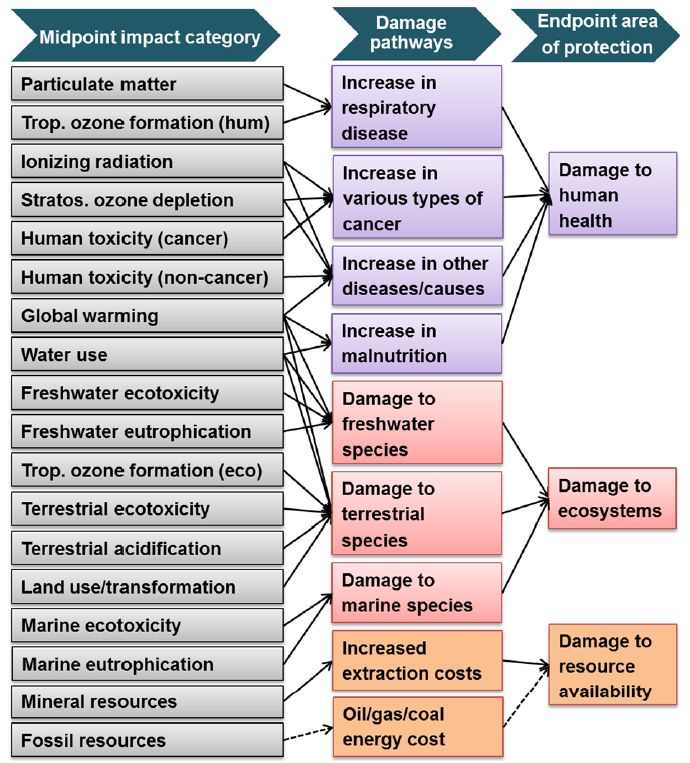
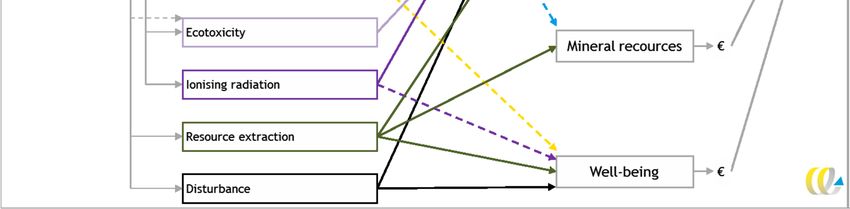
2.2 Environmental Prices
Environmental Prices is a method developed by CE Delft for expressing environmental impacts in monetary terms.
Environmental prices thus indicate the loss of economic welfare that occurs when one additional kilogram of the
pollutant finds its way into the environment.
Development of the Environmental Prices consisted of five steps:
• updating monetary values of the endpoint categories on basis of literature, General SCBA Guidelines and
Discount Rate Working Group;
• updating the impact pathway analyses, which specify the relationship between emissions in the Netherlands
and impacts on endpoints;
• valuation of 15 pollutants on basis of inputs from the previous steps and literature;
• allocation of those pollutants to midpoint impact categories in ReCiPe 2008;
• deriving weighted average value for damage to midpoint categories in order to calculate the damage cost for
each substance characterised in ReCiPe 2008 and midpoint damage factors.
In LCA context environmental prices are used as weighting sets, which allows calculation of single score results.
Figure 1. The relationships mapped in the Environmental Prices Handbook (de Bruyn, et al. 2017)
62.2.1 Characterization
The characterization step is a copy of ReCiPe (2008) Midpoint, hierarchist perspective with an exception for Climate
change based on IPCC (2013), as prescribed by the developers. An overview is provided in section 7.13.
2.2.2 Normalization and weighting
Normalization is not included in this method.
The Environmental Prices in SimaPro use the midpoint-level prices (pollutant- and endpoint-level were also developed).
In practical terms, it means that the prices of environmental themes are combined in a weighting set. CE Delft
developed two weightings sets:
• Dutch Environmental Prices (2015) – based on average emissions in the Netherlands in 2015,
• European Environmental Prices (2015) – based on average emissions in the EU28 in 2015.
The environmental prices are not available for the following impact categories: Natural land transformation, Water,
Metal and Fossil depletion.
References
S.M. de Bruyn, S. Ahdour, M, Bijleveld, L. de Graaff, A. Schroten, Handboek Milieuprijzen 2017, Methodische
onderbouwing van kengetallen gebruikt voor waardering van emissies en milieu-impacts, CE Delft, 2017.
S.M. de Bruyn, M, Bijleveld, L. de Graaff, E. Schep, A. Schroten, R. Vergeer, S. Ahdour Environmental Prices Handbook,
EU28 version, CE Delft, 2018.
2.3 Ecological scarcity 2013
The “ecological scarcity” method (also called Ecopoints or Umweltbelastungspunkte method) is a follow up of the
Ecological scarcity 2006 (see section 6.9) and the Ecological scarcity 1997 method (see section 7.4) which was named
Ecopoints 97 (CH) in the SimaPro method library.
The ecological scarcity method weights environmental impacts - pollutant emissions and resource consumption - by
applying "eco-factors". The distance to target principle is applied in the Ecological scarcity method. The eco-factor of a
substance is derived from environmental law or corresponding political targets. The more the current level of emissions
or consumption of resources exceeds the environmental protection target set, the greater the eco-factor becomes,
expressed in eco-points (EP = UBP). An eco-factor is essentially derived from three elements (in accordance with ISO
Standard 14044): characterization, normalization and weighting.
The most important changes since last update are as follows:
• A reduction target of 80% has been set for CO2 and other greenhouse gases. This falls in the upper range of the Swiss
reduction target and within the range of the reduction required to achieve the 2°C target.
• To assess energy, the federal government's long-term target (2,000 W per capita) is interpolated to the usual time
frame set out in the legislation, which is 2035.
• With regard to air pollutants, additional eco-factors are provided for PAHs and radioactive isotopes.
• In this version, PAHs, dioxins and furans, and benzene are all assessed for their carcinogenic potential.
• As for water pollutants, additional eco-factors for oil emissions to the sea are provided based on an international
agreement to protect the North Sea. Furthermore, eco-factors for the emissions of radioactive isotopes and
persistent organic pollutants in watercourses are included for the first time.
• In some parts of the world, freshwater is a scarce resource. The regionalized ecofactors introduced in the last update
are now indicated for all countries and as determined on the basis of scarcity in OECD and BRIC countries (Brazil,
Russia, India and China).
7SimaPro Database Manual - Methods
• It is now recommended that the eco-factor for freshwater be applied to consumptive water use (and not water
extraction).
• In Switzerland, resource efficiency has become a relevant area of environmental policy. For that reason, a new eco-
factor for mineral primary resources (minerals and metals) was introduced. The ratio of annual production to
available reserves is used as the basis for the characterization.
• New eco-factors were introduced for land use in various biomes. Characterization is based on the impacts of land
uses upon plant and animal biodiversity.
• New eco-factors are provided for noise pollution caused by road, rail and air traffic.
2.3.1 Characterization, normalization and weighting
In the ecological scarcity method, a characterization may be applied if the corresponding environmental impact played a
key role when the target was set. Accordingly, the current CO2 Act stipulates that all greenhouse gases must be taken
into account. Therefore, it is both possible and appropriate to use global warming potential values. Characterization is
not, however, appropriate in every theoretically conceivable case. It should not be used in cases where the environmental
impact of the characterization does not match the legislators’ intention with regard to the way the reduction target (or
the limit or target value) was set.
The ecoinvent implementation contains nineteen specific impact categories, with for each substance a final UBP
(environmental loading points) score as characterization factor which compile the characterization, normalization and
distance-to-target weighting. The impact categories considered by this method are not defined as an impact indicator
but rather as type of emission or resource:
1. Water sources
2. Energy sources
3. Mineral sources
4. Land use
5. Global warming
6. Ozone layer depletion
7. Main air pollutants and PM
8. Carcinogenic substances into air
9. Heavy metals into air
10. Water pollutants
11. POP into water
12. Heavy metals into water
13. Pesticides into soil
14. Heavy metals into soil
15. Radioactive substances into air
16. Radioactive substances into water
17. Noise
18. Non radioactive waste to deposit
19. Radioactive waste to deposit
20. Deposited waste
Weighting is conducted on the basis of goals set by Swiss environmental policy. In specific cases, global, international or
regional goals are used and converted to the Swiss level. The method can also be applied to other countries and regions.
To do so, information about the current environmental situation and the official environmental targets is required.
References
8Frischknecht Rolf, Büsser Knöpfel Sybille, 2013: Swiss Eco-Factors 2013 according to the Ecological Scarcity Method. Methodological
fundamentals and their application in Switzerland. Environmental studies no. 1330. Federal Office for the Environment, Bern:
254 pp.Bern 2013. www.bafu.admin.ch/uw-1330-e
9SimaPro Database Manual - Methods
2.4 EDIP 2003
EDIP 2003 is a Danish LCA methodology that is presented as an update of the EDIP 97 methodology. The main innovation
of EDIP2003 lies in the consistent attempt to include exposure in the characterization modelling of the main non-global
impact categories. EDIP2003 can originally be used both with and without spatial differentiation. Only characterization
factors for site-generic effects, which does not take spatial variation into account, are implemented in SimaPro 8.
2.4.1 Characterization
The EDIP 2003 methodology represents 19 different impact categories. Some of them are updated versions of EDIP 97,
whereas others are modelled totally differently. Table 1 gives an overview of the EDIP 2003 impact categories. The choices
made for implementing the methodology into SimaPro 8, are summed up for each impact category.
Impact categories: Implemented in Choices made during implementation
original form
Global warming Time horizon of 100y is used (IPPC, 2007)
Ozone depletion x
Acidification x
Terrestrial eutrophication x
Aquatic eutrophication (N-eq) Only emissions to inland waters only are
Aquatic eutrophication (P-eq) included. Emissions to air included
Ozone formation (human) x Extended with extra factors from EI 2.0
Ozone formation (vegetation) x Extended with extra factors from EI 2.0
Human toxicity (exposure route via air) Release height of 25m
Human toxicity (exposure route via water) x
Human toxicity (exposure route via soil) x
Ecotoxicity (water acute) x
Ecotoxicity (water chronic) x
Ecotoxicity (soil chronic) x
Hazardous waste Directly taken from EDIP 97 (update 2004)
Slags/ashes Directly taken from EDIP 97(update 2004)
Bulk waste Directly taken from EDIP 97(update 2004)
Radioactive waste Directly taken from EDIP 97(update 2004)
Resources Directly taken from EDIP 97(update 2004)
Table 1: Overview of the different impact categories in EDIP2003, and the changes made for implementation.
In the EDIP 2003 method, characterization factors for aquatic eutrophication are developed for two impact categories:
aquatic eutrophication (N-eq) and aquatic eutrophication (P-eq). In each impact category, characterization factors for
emissions effecting inland waters and emissions effecting marine waters are developed. This double set of
characterization factors reflects the fact that, in general, eutrophication is limited by nitrate in fresh waters, and
phosphate in marine waters.
In order to avoid double counting, that would occur if both emission types are implemented simultaneously, only the
characterization factors for inland water are implemented in SimaPro. When characterization factors for marine water
are needed, the following list can be used and implemented in the EDIP 2003 method:
10Substances CAS no. Impact category
Emission to marine water Aquatic eutrophication Aquatic eutrophication
Compartment Soil Water Water Soil
Nitric acid 7697-37-2 1,24E-01 1,61E-01 0,00E+00 0,00E+00
Nitrite 14797-65-0 1,62E-01 2,10E-01 0,00E+00 0,00E+00
Cyanide 57-12-5 2,92E-01 3,78E-01 0,00E+00 0,00E+00
Nitrogen, total 5,40E-01 7,00E-01 0,00E+00 0,00E+00
Phosphate 14265-44-2 0,00E+00 0,00E+00 3,30E-01 1,98E-02
Pyrophosphate 7722-88-5 0,00E+00 0,00E+00 3,50E-01 2,10E-02
Phosphorus, total 0,00E+00 0,00E+00 1,00E+00 6,00E-02
Table 2: Characterization factors for emissions to marine water in aquatic eutrophication. Emission compartment soil corresponds
with the source category waste water while water corresponds with the source category agriculture.
The emission to soil only takes into account the effects after plant uptake. For this impact category the topsoil is part of
the technosphere. Emissions to air are also included in the model. The data needed for this compartment is not present
in the guideline, but is received from Michael Hauschild.
The EDIP2003 characterization factors for human toxicity, exposure route via air, are enhanced. The new exposure factors
are established for:
• Two different kinds of substances: short-living (hydrogen chloride) and long-living (benzene)
• Actual variation in regional and local population densities: added for each substance
• Different release heights: 1m, 25m and 100m.
The release height of 25m is presented as default in EDIP2003 and is used in SimaPro.
2.4.2 Normalization
There are normalization factors provided for Europe in the reference year 2004 (Laurent et al. 2011).
2.4.3 Weighting
Until the EDIP weighting factors have been updated to an EDIP2003 version, the weighting factors of EDIP97 (according
to the update issued in 2004), are also used in EDIP2003. Because ecotoxicity has no normalization factors, also for
weighting the value is set at zero. For resources, normalization and weighing are already included in the characterization
factor and therefore set at zero.
References
Frischknecht, R.; Jungbluth, N.; Althaus, H.J.; Doka, G.; Dones, R.; Hischier, R.; Hellweg, S.; Humbert, S.; Margni, M.; Nemecek, T.;
Spielmann, M. 2007. Implementation of Life Cycle Impact Assessment Methods: Data v2.0. ecoinvent report No. 3, Swiss centre
for Life Cycle Inventories, Dübendorf, Switzerland.
Hauschild, M.; Potting, J. 2003. Spatial differentiation in Life Cycle impact assessment - The EDIP2003 methodology. Institute for Product
Development Technical University of Denmark.
Laurent, A.; Lautier, A.; Rosenbaum, R.K.; Olsen, S.I.; Hauschild, M.Z. 2011. Normalization in EDIP97 and EDIP2003: updated European
inventory for 2004 and guidance towards a consistent use in practice. Int J LCA 16 (8): 728-738.
11SimaPro Database Manual - Methods
2.5 EF method (adapted)
EF method is the impact assessment method of Environmental Footprint (EF), initiative introduced by the European
Commission. The method included in the SimaPro Professional database includes a number of adaptations, which make
the EF method compatible with the data libraries provided in SimaPro and not only the EF-compliant datasets.
Since the method was modified, it is not suitable for conducting the EF-compliant studies but can be used for other
assessments. The original version of the method will be distributed in the dedicated SimaPro EF database.
The implementation is based on EF method version 2.0, with the following modifications:
• it does not include any substances, which would be new to SimaPro, e.g. regionalised land use flows;
• additional substances have been included as they are extensively used by the background databases and their
synonyms are part of the original EF method:
o Resource use, energy carriers - flows expressed in mass units (not only in net calorific value as in EF);
characterisation factor corresponds to the lower heating values of given fuel;
o Resource use, mineral and metals - additional flows for already characterised mineral and metals;
o Water scarcity - flows representing geographies not covered in the original EF method; global factor
was applied;
o Climate change - carbon dioxide (emission to air) is added with factor of carbon dioxide, fossil, carbon
dioxide, to soil or biomass stock is added with factor -1 (this flow is necessary for the correct modeling
of land use in ecoinvent).
2.5.1 Characterization
Impact category Recommended default LCIA method Indicator
Baseline model of the IPCC 2013, including the carbon feedbacks for Global Warming Potential 100
different substances. years
Climate change IPCC 2013 supplementary material chap. 8 tab 8SM15
https://www.ipcc.ch/pdf/assessment-
report/ar5/wg1/supplementary/WG1AR5_Ch08SM_FINAL.pdf
Steady-state ODPs Ozone Depletion Potential
Scientific Assessment of Ozone Depletion: 1998. Global Ozone (ODP) calculating the
Ozone depletion Research and Monitoring Project - Report No. 44, ISBN 92-807-1722- destructive effects on the
7, Geneva. Undefined Report no. 4 by WMO (1999) stratospheric ozone layer over
a time horizon of 100 years
USEtox consensus model Comparative Toxic Unit for
Rosenbaum, R.K., Bachmann, T.M., Gold, L.S., Huijbregts, A.J., Jolliet, human (CTUh) expressing the
O., Juraske, R., Koehler, A., Larsen, H.F., MacLeod, M., Margni, M., estimated increase in
McKone, T.E., Payet, J., Schuhmacher, M., Van de Meent, D., morbidity in the total human
Human toxicity, cancer
Hauschild, M.Z., 2008, USEtox™, the UNEP-SETAC toxicity model: population per unit mass of a
recommended characterisation factors for human toxicity and chemical emitted (cases per
freshwater ecotoxicity in life cycle impact assessment. Int J Life Cycle kilogramme).
Assess 13 (7): 532-546
USEtox consensus model Comparative Toxic Unit for
Rosenbaum, R.K., Bachmann, T.M., Gold, L.S., Huijbregts, A.J., Jolliet, human (CTUh) expressing the
O., Juraske, R., Koehler, A., Larsen, H.F., MacLeod, M., Margni, M., estimated increase in
Human toxicity, non- McKone, T.E., Payet, J., Schuhmacher, M., Van de Meent, D., morbidity in the total human
cancer Hauschild, M.Z., 2008, USEtox™, the UNEP-SETAC toxicity model: population per unit mass of a
recommended characterisation factors for human toxicity and chemical emitted (cases per
freshwater ecotoxicity in life cycle impact assessment. Int J Life Cycle kilogramme).
Assess 13 (7): 532-546
PM method recommendaed by UNEP Disease incidence due to kg of
Fantke, P., Evans, J., Hodas, N., Apte, J., Jantunen, M., Jolliet, O., PM2.5 emitted
McKone, T.E. (2016). Health impacts of fine particulate matter. In:
Respiratory inorganics
Frischknecht, R., Jolliet, O. (Eds.), Global Guidance for Life Cycle
Impact Assessment Indicators: Volume 1. UNEP/SETAC Life Cycle
Initiative, Paris, pp. 76-99
12Human health effect model as developed by Dreicer et al. 1995 Ionizing Radiation Potentials:
Frischknecht, R., Braunschweig, A., Hofstetter P., Suter P. (2000), Quantification of the impact of
Ionising radiation,
Modelling human health effects of radioactive releases in Life Cycle ionizing radiation on the
human health
Impact Assessment. Environmental Impact Assessment Review, population, in comparison to
Volume 20, Number 2, April 2000, pp. 159-189 Uranium 235
LOTOS-EUROS model Photochemical ozone creation
Van Zelm, R., Huijbregts, M.A.J., Den Hollander, H.A., Van Jaarsveld, potential (POCP): Expression of
Photochemical ozone
H.A., Sauter, F.J., Struijs, J., Van Wijnen, H.J., Van de Meent, D. the potential contribution to
formation, human
(2008). European characterization factors for human health damage photochemical ozone
health
of PM10 and ozone in life cycle impact assessment. Atmospheric formation
Environment 42, 441-453
Accumulated Exceedance Accumulated Exceedance (AE)
Seppälä, J., M. Posch, M. Johansson and J. P. Hettelingh (2006). characterizing the change in
Country-dependent Characterisation Factors for Acidification and critical load exceedance of the
Terrestrial Eutrophication Based on Accumulated Exceedance as an sensitive area in terrestrial and
Impact Category Indicator. International Journal of Life Cycle main freshwater ecosystems,
Acidification Assessment 11(6): 403-416 to which acidifying substances
Posch, M., J. Seppälä, J. P. Hettelingh, M. Johansson, M. Margni and deposit.
O. Jolliet (2008). The role of atmospheric dispersion models and
ecosystem sensitivity in the determination of characterisation factors
for acidifying and eutrophying emissions in LCIA. International
Journal of Life Cycle Assessment 13(6): 477-486
Accumulated Exceedance Accumulated Exceedance (AE)
Seppälä, J., M. Posch, M. Johansson and J. P. Hettelingh (2006). characterizing the change in
Country-dependent Characterisation Factors for Acidification and critical load exceedance of the
Terrestrial Eutrophication Based on Accumulated Exceedance as an sensitive area, to which
Impact Category Indicator. International Journal of Life Cycle eutrophying substances
Terrestrial
Assessment 11(6): 403-416 deposit
eutrophication
Posch, M., J. Seppälä, J. P. Hettelingh, M. Johansson, M. Margni and
O. Jolliet (2008). The role of atmospheric dispersion models and
ecosystem sensitivity in the determination of characterisation factors
for acidifying and eutrophying emissions in LCIA. International
Journal of Life Cycle Assessment 13(6): 477-486
EUTREND model Phosphorus equivalents:
Struijs, J., Beusen, A., van Jaarsveld, H. and Huijbregts, M.A.J. Expression of the degree to
(2008b). Aquatic Eutrophication. Chapter 6 in: Goedkoop, M., which the emitted nutrients
Heijungs, R., Huijbregts, M.A.J., De Schryver, A., Struijs, J., Van Zelm, reaches the freshwater end
Freshwater
R. (2008). ReCiPe 2008 A life cycle impact assessment method which compartment (phosphorus
eutrophication
comprises harmonised category indicators at the midpoint and the considered as limiting factor in
endpoint level. Report I: Characterisation factors, first edition. freshwater).
Chapter in anthology Chapter on aquatic eutrophication in the ReCiPe
report (report I: characterization factors, 2008).
EUTREND model Nitrogen equivalents:
Struijs, J., Beusen, A., van Jaarsveld, H. and Huijbregts, M.A.J. Expression of the degree to
(2008b). Aquatic Eutrophication. Chapter 6 in: Goedkoop, M., which the emitted nutrients
Heijungs, R., Huijbregts, M.A.J., De Schryver, A., Struijs, J., Van Zelm, reaches the marine end
Marine eutrophication R. (2008). ReCiPe 2008 A life cycle impact assessment method which compartment (nitrogen
comprises harmonised category indicators at the midpoint and the considered as limiting factor in
endpoint level. Report I: Characterisation factors, first edition. In marine water)
press. Chapter in anthology Chapter on aquatic eutrophication in the
ReCiPe report (report I: characterization factors, 2008)
CFs set re-calculated by JRC starting from LANCA® v 2.2 as baseline Soil quality index
model.
Bos U., Horn R., Beck T., Lindner J.P., Fischer M. (2016). LANCA®
Land use Characterization Factors for Life Cycle Impact Assessment. Version 2.
Franhofer Verlag, Stuttgart, DE.
http://publica.fraunhofer.de/eprints/urn_nbn_de_0011-n-
3793106.pdf
13SimaPro Database Manual - Methods
USEtox consensus model Comparative Toxic Unit for
Rosenbaum, R.K., Bachmann, T.M., Gold, L.S., Huijbregts, A.J., Jolliet, ecosystems (CTUe) expressing
O., Juraske, R., Koehler, A., Larsen, H.F., MacLeod, M., Margni, M., an estimate of the potentially
McKone, T.E., Payet, J., Schuhmacher, M., Van de Meent, D., affected fraction of species
Ecotoxicity freshwater
Hauschild, M.Z., 2008, USEtox™, the UNEP-SETAC toxicity model: (PAF) integrated over time and
recommended characterisation factors for human toxicity and volume per unit mass of a
freshwater ecotoxicity in life cycle impact assessment. Int J Life Cycle chemical emitted (PAF m3
Assess 13 (7): 532-546 year/kg)
Available WAter REmaining (AWARE) as recommended by UNEP m3 water eq. deprived
Boulay A.M., Bare J., Benini L., Berger M., Lathuillière M.J., Manzardo
A., Margni M., Motoshita M., Núñez M., Pastor A.V., Ridoutt B., Oki
Water scarcity T., Worbe S., Pfister S. (2016). The WULCA consensus
characterization model for water scarcity footprints: Assessing
impacts of water consumption based on available water remaining
(AWARE)
ADP for energy carriers, based on van Oers et al. 2002 as Abiotic resource depletion
implemented in CML, v. 4.8 (2016). fossil fuels (ADP-fossil); based
van Oers, L, Koning, A, Guinée, JB, Huppes, G (2002) Abiotic resource on lower heating value
Resource use, energy
depletion in LCA. Road and Hydraulic Engineering Institute, Ministry
carriers
of Transport and Water, Amsterdam
http://www.leidenuniv.nl/cml/ssp/projects/lca2/report_abiotic_depl
etion_web.pdf
ADP for mineral and metal resources, based on van Oers et al. 2002 Abiotic resource depletion
as implemented in CML, v. 4.8 (2016). (ADP ultimate reserve)
van Oers, L, Koning, A, Guinée, JB, Huppes, G (2002) Abiotic resource
Resource use, mineral
depletion in LCA. Road and Hydraulic Engineering Institute, Ministry
and metals
of Transport and Water, Amsterdam
http://www.leidenuniv.nl/cml/ssp/projects/lca2/report_abiotic_depl
etion_web.pdf
2.5.2 Normalization
Global normalization set for a reference year 2010 is part of the EF method.
2.5.3 Weighting
EF method includes two versions of the weighting factors – including and excluding three toxicity-related
impact categories. Currently, those impact categories are “not seen as sufficiently robust to be included in
external communications or in a weighted result”.
After an evaluation of existing weighting methods, three weighting sets were developed: i) panel based
approach - general public survey; ii) panel based approach - LCA experts’ survey; iii) hybrid evidence-and
judgement-based approach. Those three weighting sets were then aggregated by first averaging the sets
based on panel based approach.
References
Fazio, S. Castellani, V. Sala, S., Schau, EM. Secchi, M. Zampori, L., Supporting information to the characterisation factors
of recommended EF Life Cycle Impact Assessment methods, EUR 28888 EN, European Commission, Ispra, 2018,
ISBN 978-92-79-76742-5, doi:10.2760/671368, JRC109369.
Normalization and weighting factors: Annex A of the Product Environmental Footprint Category Rules Guidance v6.3,
May 2018. http://ec.europa.eu/environment/eussd/smgp/pdf/PEFCR_guidance_v6.3.pdf.
Sala S., Cerutti A.K., Pant R., Development of a weighting approach for the Environmental Footprint, Publications Office
of the European Union, Luxembourg, 2018, ISBN 978-92-79-68042-7, EUR 28562, doi 10.2760/945290.
142.6 EPD (2018)
This method is the successor of EPD (2013) and is to be used for the creation of Environmental Product Declarations
(EPDs), as published on the website of the Swedish Environmental Management Council (SEMC). An EPD is always created
according to a Product Category Rule. This method is especially important for everybody who is reporting a Product
Category Rule (PCR) published by Environdec.
2.6.1 Characterization
In the standard EPDs one only has to report on the following impact categories:
Original names Names in SimaPro
Acidification potential Acidification (fate not incl.)
Eutrophication potential Eutrophication
Global warming potential Global warming (GWP100a)
Photochemical oxidant creation potential Photochemical oxidation
Abiotic depletion potential - elements Abiotic depletion, elements
Abiotic depletion potential - fossil fuels Abiotic depletion, fossil fuels
Water Scarcity Footprint (WSF) Water scarcity
Additional indicators:
The following impact categories are optional indicators and the inclusion of them should be specified in the PCR.
Original names Names in SimaPro
Ozone-depleting gases (expressed as the sum of Ozone layer depletion (ODP) (optional)
ozone-depleting potential in mass of CFC 11-
equivalents, 20 years)
Most impact categories are taken directly from the CML-IA baseline method (eutrophication, global warming, ozone
depletion and abiotic resource depletion) and CML-IA non baseline method (acidification). Water scarcity category is
based on AWARE method and Photochemical oxidation is based on ReCiPe 2008. All those individual methods can be
found in SimaPro.
2.6.2 Normalization and weighting
Normalization and weighting are not a part of this method.
References
General programme instructions for the international EPD® system, 3.0. 11 December 2017. Download at
http://www.environdec.com/Documents/GPI/General_programme_instructions_2_01_20130918.pdf.
15SimaPro Database Manual - Methods 2.7 EPS 2015d and EPS 2015dx EPS 2015 default methodology (Environmental Priority Strategies in product design) is a damage oriented method, the successor of EPS 2000. In the EPS system, willingness to pay to restore changes in the safe guard subjects is chosen as the monetary measurement. The indicator unit is ELU (Environmental Load Unit), which includes characterization, normalization and weighting. The method is available in two versions: - EPS 2015d - including climate impacts from secondary particles, - EPS 2015dx - excluding climate impacts from secondary particles. The reason for developing two versions is the uncertain but important valuations of near-term climate forcers (NTCF) such as Nitrogen oxides (NOx) and Sulphur dioxide (SO2) emissions. Based on the recommendation from UNEP-SETAC Life Cycle Initiative, method developer suggests that the version including the secondary impacts (2015d) is used with care (e.g. in sensitivity analysis) and by LCA practitioners and experts understanding the underlying concept. For more details explanation, you can check the website dedicated to EPS system: http://www.ivl.se/eps The top-down development of the EPS system has led to an outspoken hierarchy among its principles and rules. The general principles remain unchanged since previous version: • The top-down principle (highest priority is given to the usefulness of the system); • The index principle (ready-made indices represent weighted and aggregated impacts); • The default principle (an operative method as default is required); • The uncertainty principle (uncertainty of input data has to be estimated); • Choice of default data and models to determine them. The EPS system is mainly aimed to be a tool for a company's internal product development process. The system is developed to assist designers and product developers in finding which one of two product concepts has the least impact on the environment. The models and data in EPS are intended to improve environmental performance of products. The choice and design of the models and data are made from an anticipated utility perspective of a product developer. They are, for instance not intended to be used as a basis for environmental protection strategies for single substances, or as a sole basis for environmental product declarations. In most of those cases additional site-specific information and modelling is necessary. Implementation of EPS 2015 in SimaPro required few adaptations: - some state indicators were not implemented, either because they do not correspond with the flows used in the inventory (Land use), or the inventory does not cover flows used in the method (Noise and Waste). Also, none of the state indicators under social safe guard subject is included (as they are quantitative, not monetary valued) and only one state indicator from economical safe guard subject is included - housing availability. - approx. 50 substances from the EPS spreadsheet were not implemented as they were not available in SimaPro; - Depletion of abiotic resources includes all the elements covered by the method. Originally, each element has a separate state indicator. 2.7.1 Classification and characterization Emissions and resources are assigned to impact categories when actual effects are likely to occur in the environment, based on likely exposure. Empirical, equivalency and mechanistic models are used to calculate default characterization values. 2.7.1.1 Ecosystem services Weighting factors for damage to ecosystem are included for the following indictors, all expressed in kg: 16
•   Crop growth capacity,
•   Production capacity of fruits and vegetables,
•   Wood growth capacity,
•   Fish and meat production capacity.

2.7.1.2    Access to water
Weighting factors for damage to water access are included for the following indictors, all expressed in kg:
• Drinking water,
• Irrigation water.

2.7.1.3    Biodiversity
Default impact category for biodiversity is extinction of species, expressed in Normalized Extinction of species (NEX).

2.7.1.4    Building technology
Default impact category for building technology is housing availability, expressed in square meters.

2.7.1.5    Human health
Weighting factors for damage to human health are included for the following indictors, all expressed in personyears:
• Life expectancy (YOLL - years of life lost),
• Malnutrition,
• Diarrhea,
• Gravation of angina pectoris,
• Working capacity,
• Asthma cases,
• COPD severe,
• Cancer,
• Skin cancer,
• Low vision,
• Poisoning,
• Intellectual disability: mild.

2.7.1.6    Abiotic resources
Default impact category for abiotic resources is depletion of abiotic resources, expressed in kg of element. In SimaPro,
characterization values for abiotic depletion result from both the impact of depletion and impacts due to extraction of
the element/mineral or resource.

2.7.2     Normalization/Weighting
In the EPS default method, normalization/weighting is made through valuation. Normalization/weighting factors
represent the willingness to pay to avoid changes. The environmental reference is the present state of the environment.
The indicator unit is ELU (Environmental Load Unit).

References
Steen B. 2015. The EPS 2015 impact assessment method – An overview. Swedish Life Cycle Center, Report number 2015:5.
Steen B. 1999. A systematic approach to environmental strategies in product development (EPS). Version 2000 - General system
      characteristics. Centre for Environmental Assessment of Products and Material Systems. Chalmers University of Technology,
      Technical Environmental Planning. CPM report 1999:4.

                                                                                                                                  17
SimaPro Database Manual - Methods 2.8 ILCD 2011 Midpoint+ This is the corrected and updated method of the ILCD 2011 Midpoint (without the +) which can still be found in the Superseded folder. For this new version, the normalization factors were added as provided in "Normalisation method and data for Environmental Footprints; 2014; Lorenzo Benini, et al.; Report EUR 26842 EN". The characterization factors in the Land use category are updated based on "ERRATA CORRIGE to ILCD - LCIA Characterization Factors" - Version06_02_2015(v. 1.0.6) - "List of changes to CFs for land use from v 1 0 5 to v 1 0 6_REVISED.xlsx". Characterization factors for long term emissions are set to zero, because this was an implicit requirement from the European Commission. Weighting factors were added with equal weights for each of the recommended categories as indicated by the guidance document. The full title of this method is: ILCD recommendations for LCIA in the European context. The European Commission (EC- JRC–IES, 2011) analyzed several methodologies for LCIA and made some effort towards harmonization. Starting from the first pre-selection of existing methods and the definition of criteria, a list of recommended methods for each impact category at both midpoint and endpoint was produced. The endpoint methods, however, are not included here, because the list is far from complete. Recommendations are given for the impact categories of climate change, ozone depletion, human toxicity, particulate matter/respiratory inorganics, photochemical ozone formation, ionizing radiation impacts, acidification, eutrophication, ecotoxicity, land use and resource depletion (Table 3). Research needs are identified for each impact category and differentiated according to their priority. No method development took place in the development of the ILCD recommendations. The intention was to identify and promote current best practice. These recommendations do not provide recommendations for weighting across impact categories, nor for normalization within a given category relative to impacts in a given region. 18
You can also read