ECONOMIC IMPACT STUDY OF SURFACING THE SANI PASS ROAD
←
→
Page content transcription
If your browser does not render page correctly, please read the page content below
ECONOMIC IMPACT STUDY OF SURFACING
         THE SANI PASS ROAD

                                DRAFT REPORT

   Prepared for:                Arcus Gibb

   Prepared by:                 Imani Development (SA) (Pty) Ltd
                                with
                                Conningarth Economists
                                FutureWorks

                                                                                     AUGUST 2011

 Imani Development (South Africa) (Pty) Ltd, P O Box 1070, Umhlanga Rocks 4320, South Africa
                                    www.imanidevelopment.com
Offices in Australia, Malawi, Mauritius, South Africa, Tanzania, Uganda, United Kingdom and Zimbabwe
Economic Impact of Surfacing the Sani Pass Road -i-
EXECUTIVE SUMMARY
Introduction
1. The KwaZulu-Natal Department of Transport (KZN-DOT) wishes to upgrade the
Sani Pass Road (MR318). The purpose of this study is to take a holistic view of
the costs and benefits relating to the upgrading of the road both in South Africa
and Lesotho. Such a view would cover a conventional cost-benefit analysis, a
resource economics analysis, Social Accounting Matrix and macro-economic
impact modelling, and attention to development projects and aspects of
international relations. The project covers the Sani Pass road in South Africa and
the road from the border at Sani Top to Mokhotlong in Lesotho.
2. Six options were identified for Phase 2 of the Sani Pass road project by the
engineering consultants. These are:
(i) Close pass – deproclaim road and hand over to Ezemvelo KZN
Wildlife.
(ii) Re-gravel, minor drainage improvements, maintain.
(iii) Improve geometrics, upgrade drainage, retain splash troughs, construct
retaining walls and re-gravel.
(iv) Improve geometrics, upgrade drainage, construct bridges, retaining
walls, blacktop up to km25, gravel to km33.
(v) Improve geometrics, upgrade drainage, construct bridges and retaining
walls, hard surface from km14 to km33.
(vi) Improve geometrics, upgrade drainage, construct bridges and retaining
walls, blacktop from km14 to km31, and tunnel (3km).
3. Maintaining the status quo (defined as routine maintenance only) is an
unsustainable long-term option because of the increased costs of trucking gravel,
and hence upgrading to an improved or good gravel road is also not an option.
Thus, the comparison in the economic analysis is between Options (i) and (v),
i.e., between closing the road and providing it with a hard surface.
4. Option (v) allows accessibility to the public and not only 4-wheel drive vehicles.
Despite greater accessibility, a surfaced Sani Pass road will not be an interstate
highway competing with the N3 or N5. On the Lesotho side, the intention is to
surface the road from Sani Top to Mokhotlong in order to complete a trans-
Lesotho surfaced road.
5. The methodology for data collection consisted of a field visit to Lesotho (Maseru
and Mokhotlong), a site visit to Sani Pass, an examination of specialist reports on
economic, social, aquatic, vegetation and heritage impacts, a workshop held by
resource economists with a panel of experts in Pietermaritzburg, and a
considerable number of telephonic interviews.
6. The main assumptions in this study are:
The choice is between decommissioning the road and providing it with
a hard surface to become an all-weather road.
The road plays a significant role in the facilitation of trade and
commerce between eastern Lesotho and KwaZulu-Natal.
Tourism developments in Lesotho, including hotels, a spa and golf
course are waiting on the completion of a surfaced Sani Pass road.
Sources of information are accurate.
7. The limitation in this report is that no information was obtained on possible new
investment projects in the Underberg-Himeville area that could exploit
Imani Development (SA) (Pty) Ltd 11 August 2011Economic Impact of Surfacing the Sani Pass Road - ii -
opportunities presented by the surfacing of Sani Pass and an improved connection
to Lesotho.
Economic Activities
8. In this section the focus is on those economic activities in the Underberg-
Himeville and Mokhotlong District that generate traffic on Sani Pass which
provides the only road across the border between Lesotho and KwaZulu-Natal,
and hence the only artery for traffic between Mokhotlong District in Lesotho and
the Underberg-Himeville area in KwaZulu-Natal.
9. In the Underberg-Himeville area, about 46,000 (26%) annual visitors travel up
Sani Pass. The Sani-related visitors are estimated to contribute R41.7 million per
annum to local accommodation establishments. Their expenditure on local trade
(on food, beverages, fuel and souvenirs) is estimated at R47.2 million per annum.
10. There are four main 4x4 tour operators who transport approximately 19,000
visitors per annum up the Pass. Their total turnover is estimated at R11.5 million
per annum, and they are only a small contributor to the regional economy.
11. The present study included an investigation into the possible impact of surfacing
Sani Pass on adventure tourism. The verification was done through telephonic
interviews with the tourism industry, notably inbound tour operators (who supply
tourist to the 4x4 tour operators) and Tourism KZN.
12. The majority of inbound tour operators sell Sani as a soft, scenic tour, not as an
adventure tour. They felt that surfacing would not devalue Sani Pass as an
attraction. Surfacing in fact would enhance the trip in several ways although
traffic growth and safety aspects would need to be monitored.
13. The inferences to be drawn are that the majority of foreign tourists would
continue to be attracted to Sani, that some inbound tour operators might decide to
use their own vehicles rather than the services of the 4x4 tour operators, and that
the 4x4 tour operators would need to focus on improving the quality and
uniqueness of their services and to enhance synergy with the inbound operators.
14. Restrictions on the value of goods purchased by Lesotho traders on any one trip
from South Africa through Sani Pass pose a major problem to Mokhotlong
traders and arise from the fact that SARS operates only at five commercial border
posts.
15. For Mokhotlong traders wishing to bring in goods worth more than R5,000 at a
time, the nearest commercial border post is Caledonspoort, the use of which
involves a longer distance and corresponding higher transport costs.
16. The restriction limits the geographic catchment area of Sani Pass for cross-border
trade.
17. The opening hours of the border post at Sani Pass are 6am-6pm. This puts Sani
Pass at a disadvantage compared with Caledonspoort (6am-10pm) and Maputsoe
(open 24 hours/day).
18. Statements by the District Administrator in Mokhotlong corroborate the views of
Underberg traders to the effect that trade between Mokhotlong District and
Underberg-Himeville has fallen. However, a meeting of Mokhotlong traders
reiterated that Underberg was considered to be the cheapest source of goods for
the Mokhotlong District. The meeting estimated that at present 70% of
Mokhotlong trade was with Underberg-Himeville, and that this could increase to
90% if the road projects on both sides of the border were to go ahead.
19. The major economic activity in the Mokhotlong District relates to wool and
mohair production.
Imani Development (SA) (Pty) Ltd 11 August 2011Economic Impact of Surfacing the Sani Pass Road - iii -
20. It is estimated that the quality and quantity of wool and mohair produced could
increase by as much as 40%.
21. With transport costs being the main costs for farmers, the improvement of Sani
Pass is extremely important to wool and mohair producers in Mokhotlong
District, and improving Sani Pass is regarded as essential for the Mokhotlong
wool industry to expand.
22. The major development project in the Mokhotlong District at present is the
construction of the Polihali Dam. Construction work is to begin in 2011 and will
be completed in 2017.
23. At existing dams, the water agreement with South Africa limits development
around the dam. However, the agreement is being examined with a view to
reducing the limitations on development as many investors are interested in
recreation projects. In the case of Polihali Dam, the Lesotho government is keen
on having integrated development from Phase 1 onwards, and thus investment in
accommodation and recreation could be attracted at an early stage after
completion of the dam. Three large tourism projects are also being investigated in
the Sani Top area. According to the Lesotho Tourism Authority, the surfacing of
Sani Pass road is a requirement for the proposed recreation and tourism
investment projects.
Resource Economics
24. The study assessed the changes in condition and relative value of ecosystem
services for the various scenarios. An ecosystem service is one that is generated
by the natural environment, enhances human well-being and is directly used by
people, e.g., large natural areas in the upper catchments of rivers have provided a
regular supply of clean water but have been transformed through settlement,
forestry or agriculture. The transformation changes the supply of ecosystem
services.
25. The supply of ecosystem services will increase with the upgrading of the existing
road to a surfaced road. This is due to improved stormwater attenuation as well as
the decreased deposition of sediment which is eroded from the road and deposited
in the streams and rivers. It is likely that these changes will result from improved
ecological conditions.
26. The demand for many of the cultural ecosystem services, such as sense of place,
spiritual wellbeing, and recreation, will change with the upgrading of the existing
road to a surfaced road. The number of users, and therefore demand, will increase
in terms of sense of place, access between Lesotho and South Africa, birding (and
other wildlife) and botanising, the number of self-drive users of Sani Pass road,
and users for recreational purposes, such as hiking, mountain biking and running.
27. Spiritual wellbeing is likely to be affected less by the nature of the road surface
than by the nature of the road use (traffic volumes, types of use, speed and noise).
Road use management is likely to be a key determinant of the quality of tourist
experiences.
28. The upgrading of the existing road to a hard surface will have a negative effect on
the four-wheel drive tour operators who will have to either stop offering four-
wheel drive tours to the top of Sani Pass or offer a different package. Given that
the approaches to the South African border post will be able to accommodate tour
buses, but that the Pass will not be able to accommodate large buses, there is a
potential market for guides to take these tourists up the Pass and into Lesotho.
Imani Development (SA) (Pty) Ltd 11 August 2011Economic Impact of Surfacing the Sani Pass Road - iv -
Financial Costs and Benefits
29. Capital costs of construction and maintenance costs of road options are compared
against benefits. The implications for enterprises in the Underberg area are that,
under Option 1, all existing business relating to Sani Pass would be permanently
lost, whereas Option 2 would allow the enterprises to retain at least some and
perhaps all of their existing business and to expand their businesses by tapping
into increased traffic on the Pass. Thus, the negative effects for these operators
can be mitigated by adaptation of their product offerings.
30. There are no benefits to enterprises in the study area from closing the Pass. A
financial cost-benefit balance sheet would consist only of costs. Losses to
existing businesses in the Underberg-Sani Top areas would amount to R106.34
million per annum. These losses would be a severe blow to accommodation
establishments in the Underberg area, would be less vital but nonetheless
significant for trading enterprises, and would represent the entire turnover of the
Sani Top Chalet and the Underberg-based 4x4 tour operators which would
presumably have to close.
31. For Lesotho, total capital and maintenance costs of R519.1 million over a 25-year
period lead to new investments of R1,450 million, annual financial benefits of at
least R197.122 million, and the creation of at least 2,000 temporary
(construction) and 730 permanent jobs.
32. For the Underberg area, total capital and maintenance costs of R417.1 million
over a 25-year period lead to retained business worth between R72.4-100.4
million per annum, and generated business (phased in over 3 years) of R66.7
million per annum, and thereafter business growth of at least R7.0-8.4 million per
annum, resulting in annual financial benefits of between R146.1-175.5 million
per annum from the fourth year after the road is completed.
33. The analysis compares the public costs of construction and maintenance of the
road with the public benefits in the way of new investment and employment in a
developing country (Lesotho) and the pecuniary benefits accruing to producers
and enterprises in the Mokhotlong District and Underberg-Himeville. It is clear
that the benefits exceed the costs.
Macro-economic Impact
34. The study calculated the possible macro-economic impact of the proposed
construction on the current economic activities in the area and the impacts on
KwaZulu-Natal (KZN) and Lesotho. Economic activities in Underberg-Himeville
and Mokhotlong District were evaluated in terms of possible impacts of the
proposed construction both in the short and longer term. Tourism activities with
the 4x4 tour operators and taxi operators would be the ones that would be most
directly affected by the project.
35. A multiplier model was used that has previously been developed for projects in
KZN. The model is based on the provincial Social Accounting Matrix (SAM).
Current economic activities are expressed in terms of gross domestic product
(GDP), employment and payments to households.
36. In layman’s terms a Social Accounting Matrix (SAM) represents a mathematical
matrix depicting the linkages that exist in financial terms between all the major
role players in the economy, i.e., business sectors, households and government. It
is very similar to the input/output table in the sense that it also reflects the inter-
sectoral linkages in an economy.
Imani Development (SA) (Pty) Ltd 11 August 2011Economic Impact of Surfacing the Sani Pass Road -v-
37. For KwaZulu-Natal, the construction phase impact on GDP is approximately
R261 million (in constant 2010 prices). Other impacts of the construction phase
are the creation of 1,955 jobs, impacts on low-income, medium and high income
households of R21 million, R26 million and R93 million respectively, and a
negative impact on the balance of payments of approximately R265 million. Total
government revenue is expected to increase by an average of approximately R57
million per annum.
38. For Lesotho, the construction phase impact on GDP is approximately R323
million. Impact on employment amounts to 2,422 jobs that will be sustained over
the construction period. The impact on low-income, medium and high income
households will respectively be R26 million, R32 million and R116 million. The
negative impact on the balance of payments will amount to approximately R328
million. Total government revenue is expected to increase by an average of
approximately R70 million per annum.
39. Tourism is a very important element of the economic structure of the Underberg-
Himeville area. Its contribution to the area’s GDP is R434.54 million, of which
Sani-destined tourists contribute R93.34 million (21%). The 4x4 operators are
responsible for R11.26 million (or 2.54%) of tourism’s total contribution to GDP
in the area.
40. Tourism is not such an important element of the economic structure of the
Mokhotlong area. The Sani-origin tourists account for R6.07 million (39%) of the
total tourist contribution to District GDP.
41. If the Pass is closed, all Sani Pass-related business in the Underberg-Himeville
area and the Sani Top area will be lost. Tourism will be reduced to zero.
42. If the road is surfaced, and local tourism industry players in Underberg and
Himeville are correct in believing that the 4x4 operators will be forced out of
business, the consequences will be exactly the same as that of closing the Pass.
This scenario therefore has the same economic impact consequences as Option 1
in paragraph 41 above.
43. However, there is unlikely ever to have been a case where an upgraded road fails
to generate new opportunities and new traffic. It is therefore highly unlikely that
surfacing the road would lead to a worst-case scenario. A medium scenario with a
50% loss of 4x4 operator traffic and a best-case scenario with 100% retention of
such traffic appear to be reasonable. If these scenarios are compared with Option
1, the impact on the growth on the Underberg and Mokhotlong economies is
positive. Clearly, any growth must yield a positive result when compared with the
loss of all existing business which is inherent in Option 1.
Economic Cost-Benefit Analysis
44. An economic cost-benefit analysis (CBA) looks at a project from the point of
view of society as a whole. Financial prices are converted into economic prices
through the use of shadow pricing which excludes transfers such as taxes and
duties as well as interest which are not resource costs.
45. The shadow prices used in this study are derived from the consultants experience
in road project appraisal in various parts of Southern Africa over a period of 40
years. In South Africa the shadow price factor (SPF) has varied from 0.79-0.91,
while in neighbouring countries it has been between 0.80-0.87. For the Sani Pass
section of the road, therefore, a mid-point value of 0.85 has been adopted while
for the Mokhotlong-Sani Top road in Lesotho, a rate recently calculated by the
consultants in Swaziland of 0.80 has been assumed. The Swaziland and Lesotho
Imani Development (SA) (Pty) Ltd 11 August 2011Economic Impact of Surfacing the Sani Pass Road - vi -
economies are broadly similar in terms of prices, given their position in the
Southern African Customs Union vis a vis the dominant South African economy.
46. At the end of the study period, a road will retain some value. This is known to as
residual value, and from discussions with engineers has been put at 45% of
construction costs in South Africa and 25% in Lesotho in 2038. The reason for
the difference is that the road in Lesotho will be designed for higher speeds and
traffic volumes than Sani Pass, and is therefore likely to be due for improvement
after 20 years of operation.
47. The costs in a transport project relate to construction and maintenance. The
benefits derived from a road project are those which accrue to users in the form
of vehicle operating costs (VOCs), time savings and accident costs. Other
benefits arise from the comparison between road closure and road upgrading:
these benefits consist of the retention of existing business and the potential for
growth of new business.
48. In this analysis, a base case and a best case are identified. Under the best case it is
expected that the 4x4 tour operators with mitigation will retain all of their
business, while under the base case they would retain 50% of their business with
mitigation.
49. Data on vehicle operating costs (VOCs) were provided by the Cape Town office
of SSI. The values used for VOCs are based on figures calculated by SSI for Sani
Pass. Included in the VOCs for Sani Pass is also a time savings figure. To
determine VOCs for the Sani Top-Mokhotlong road, the P318-1 (Km 14-25 of
Sani Pass) VOC saving figures were used as a proxy as this section of Sani Pass
most closely resembled the Sani Top-Mokhotlong road. The values used for the
Lesotho component of the road are very conservative, and may work out to be
much higher once a detailed study is undertaken for the Sani Top-Mokhotlong
section.
50. Under Option 1 with the road being decommissioned, certain traffic at present
using Sani Pass would be diverted to routes through Fouriesburg, Ficksburg and
Maseru. If Sani Pass were to be surfaced, the saving in distance and hence VOCs
would be considerable. The VOC values under the distance savings calculations
are those used by SSI for different vehicle types over different road types,
gradients and conditions.
51. A second set of time savings figures is based on the same principle as the
distance saving calculations. In this case, the additional time spent on
transportation as a result of the decommissioning of the road is multiplied by an
average cost per hour for various vehicle types. These time savings figures are
based on work done by Imani in a 2010 road construction project in Swaziland.
Salaries and wages as well as labour market conditions are broadly comparable to
those in Lesotho. To the extent that some of the goods reflected in Table 6.3
might be transported by South African rather than Lesotho carriers, the values
would be understated since salaries and wages are higher in South Africa than in
Lesotho.
52. The results are shown as net present value (NPV) and internal rate of return
(IRR).
Scenario Discount NPV IRR (%)
rate (%) (Rm)
Base case 10 3.5 10
Best case 10 56.0 11
Imani Development (SA) (Pty) Ltd 11 August 2011Economic Impact of Surfacing the Sani Pass Road - vii -
53. Sensitivity analysis was conducted by (i) varying the discount rate to 8% and
12% to take account of possible shifts in the cost of capital, (ii) assuming that
only 50% of development projects in Mokhotlong District occur, and (iii)
combining a hard-surfaced road on Sani Pass with the status quo (gravel road)
from Sani Top to Mokhotlong and excluding development projects in
Mokhotlong District. The effect on NPV is shown in the table below.
Scenario Discount rate (%) NPV (Rm)
Varying discount rate
Base case 8 153.2
12 -96.5
Best case 8 223.0
12 -55.0
50% development projects 10 -82.4
8 36.6
12 -160.8
Gravel/no dev projects 10 108.5
8 216.3
12 33.9
54. At the preferred discount rate of 10%, the results for the NPV are positive,
indicating that the project is viable, and for the IRR are acceptable for project
implementation. An IRR of 11% provides the funding agency with a result that
exceeds the prime interest rate as well as the inflation rate.
55. Non-economic factors also need to be taken into account. These concern
international relations in the Southern African Customs Union (SACU) and
Southern African Development Community (SADC). The SACU has always
recognised that the free flow of goods across borders depends on good transport
links and systems. SADC has identified cross-border road routes for
improvement and upgrading, the Sani Pass-Mokhotlong road being one of the
remaining links that requires upgrading.
56. In 2001 the governments of South Africa and Lesotho issued a Declaration of
Intent on Technical and Financial Cooperation in the area of road construction
and transportation which recognised the situation of Lesotho as a landlocked
country and its relationship with KwaZulu-Natal. The international relations
aspect, therefore, provides strong grounds for justifying the Sani Pass-
Mokhotlong road project.
Mitigation Measures
57. A number of mitigation measures have been identified by the study team which
would cushion any possible negative impacts on existing enterprises in the area of
influence of the Sani Pass-Mokhotlong road.
58. These measures relate to:
Aesthetics of the Sani Pass road
Road use management
In order to reduce the impacts on trade, tourism and accommodation, both
the Lesotho and South African governments as well as the KwaZulu-Natal
provincial administration should undertake aggressive marketing
campaigns to promote the area for tourism. This is also a key finding of
the social and earlier economic specialist reports.
The Lesotho Tourism Authority should develop new tourism routes,
Imani Development (SA) (Pty) Ltd 11 August 2011Economic Impact of Surfacing the Sani Pass Road - viii -
As a large percentage of foreign tourists who visit the area are linked to
inbound tour operators, marketing efforts should be made to persuade
those operators to continue to run tours to the Sani Pass area and to extend
their tours into Lesotho rather than terminating at Sani Top.
Opening hours of the border post should be extended commensurate with
safety considerations.
SARS should consider upgrading the border post, once it has been
relocated, to commercial status, i.e., with no limit on the value of goods
imported by Lesotho traders, in order to allow trade between Mokhotlong
District and KwaZulu-Natal to reach its potential.
Conclusion
59. The contention that an all-weather surface would only have negative impacts
goes against all experience in previous road projects. Experience has shown that
the improvement of road infrastructure to make areas more accessible has always
resulted in increased visitor numbers. In the case of Sani Pass, a number of new
possibilities would be opened up once the road works are complete, e.g., the
Polihali Dam could be exploited as a tourist resort, and hotel development could
incur in the Sani Top area, attracting ordinary SUV vehicles which are not
necessarily 4x4s.
60. An all-weather road will generate new traffic, creating a tourism niche in the
area.
61. This new traffic will inject significant streams of revenue into an area that is
currently underperforming.
62. The new road will result in increased trade between the countries and the
potential for new investment opportunities.
63. The road plays a significant role in the facilitation of the wool and mohair
industry in Lesotho with the new road creating the opportunity for a 40% growth
in this industry.
64. The decommissioning of the road will result in substantial distance and time
saving costs due to traffic being rerouted.
65. The surfaced road results in significant levels of trade, tourism and
accommodation being retained in the area.
66. A surfaced road will have a positive net effect on the ecology of the area with
reductions in erosion and sedimentation.
67. The economic cost-benefit analysis reveals that a surfaced road will have a
positive net effect to the overall project area and is viable. Although a limited
number of stakeholders may be negatively affected, the overall benefit of having
a surfaced road outweighs the costs of not having a road at all.
68. The macroeconomic impact analysis yielded positive results on GDP,
employment, incomes and tourism.
69. The economic CBA yielded a positive net present value and an internal rate of
return of 11% which exceeds the current interest and inflation rates.
Imani Development (SA) (Pty) Ltd 11 August 2011Economic Impact of Surfacing the Sani Pass Road - ix -
Table of Contents
EXECUTIVE SUMMARY ...........................................................................................................................I
LIST OF TABLES................................................................................................................................... XI
LIST OF FIGURES ................................................................................................................................ XII
1. INTRODUCTION.............................................................................................................................1
1.1 Background ................................................................................................................................................1
1.2 Rationale for Surfaced Road......................................................................................................................1
1.3 Methodology...............................................................................................................................................2
1.4 Assumptions and Limitations .....................................................................................................................3
1.5 The Study Team.........................................................................................................................................3
2. ECONOMIC ACTIVITIES................................................................................................................4
2.1 Underberg-Himeville ..................................................................................................................................4
2.1.1 Tourism ................................................................................................................................................................ 4
2.1.2 4x4 Tour Operators .............................................................................................................................................. 4
2.1.2.1 Organisation of Tours ................................................................................................................................. 4
2.1.2.2 Attractions/Selling Points........................................................................................................................... 5
2.1.2.3 Impact of Surfacing the Road.................................................................................................................... 6
2.1.2.4 Summary....................................................................................................................................................... 6
2.1.3 Trade.................................................................................................................................................................... 7
2.2 Mokhotlong District.....................................................................................................................................7
2.2.1 Challenges ........................................................................................................................................................... 7
2.2.1.1 Roads ............................................................................................................................................................. 8
2.2.1.2 Restrictions on Trade .................................................................................................................................. 8
2.2.1.3 Border Opening Times ............................................................................................................................... 9
2.2.1.4 Catchment Area for Sani Pass ................................................................................................................... 9
2.2.2 Economic Activities .............................................................................................................................................. 9
2.2.2.1 Sani Pass Trade............................................................................................................................................ 9
2.2.2.2 Traders and Hawkers ................................................................................................................................ 10
2.2.2.3 Wool and Mohair....................................................................................................................................... 10
2.2.2.4 Tourism ....................................................................................................................................................... 12
2.2.2.5 Transport..................................................................................................................................................... 13
2.2.2.6 Crops............................................................................................................................................................ 13
2.2.2.7 Livestock..................................................................................................................................................... 14
2.2.3 Development Projects and Potential .................................................................................................................. 14
2.2.3.1 Lesotho Highlands Water Project ........................................................................................................... 14
2.2.3.2 Tourism and Environment.................................................................................................................... 14
2.3 Conclusion ...............................................................................................................................................15
3. RESOURCE ECONOMICS...........................................................................................................16
3.1 Background and Introduction ...................................................................................................................16
3.2 Ecosystem Services.................................................................................................................................16
3.3 Why Use an Ecosystem Services Approach?..........................................................................................16
3.4 The ECO-FUTURES Approach................................................................................................................18
3.4.1 Site Visit ............................................................................................................................................................ 18
3.4.2 A Workshop with a Panel of Experts.............................................................................................................. 18
3.5 Results .....................................................................................................................................................21
3.5.1 Supply and Demand for Service ........................................................................................................................ 21
3.5.2 Changes in Supply with Different Scenarios...................................................................................................... 23
3.5.3 Change in Demand for Services with Different Scenarios ................................................................................. 24
3.5.3.1 Local Role................................................................................................................................................... 24
3.5.3.2 Provincial/National Role.......................................................................................................................... 25
3.5.3.3 International Role ...................................................................................................................................... 26
3.6 Conclusions..............................................................................................................................................27
4. FINANCIAL COSTS AND BENEFITS ..........................................................................................28
4.1 Costs ........................................................................................................................................................28
4.1.1 Capital ................................................................................................................................................................ 28
4.1.2 Maintenance....................................................................................................................................................... 28
4.2 Benefits ....................................................................................................................................................29
4.2.1 Option 1 – Closure of Sani Pass ........................................................................................................................ 29
4.2.2 Option 2 – Surfacing of Sani Pass ..................................................................................................................... 29
Imani Development (SA) (Pty) Ltd 11 August 2011Economic Impact of Surfacing the Sani Pass Road -x-
5. MACRO-ECONOMIC IMPACT .....................................................................................................32
5.1 Project Background..................................................................................................................................32
5.2 Approach and Modelling ..........................................................................................................................32
5.2.1 Approach ............................................................................................................................................................ 32
5.3 Modelling..................................................................................................................................................32
5.3.1 Micro Modelling .................................................................................................................................................. 32
5.3.2 Macro Modelling................................................................................................................................................. 34
5.3.2.1 Overview of Macro-Economic Impact Analysis .................................................................................. 34
5.3.2.2 The Social Accounting Matrix ................................................................................................................ 35
5.3.3 Data source assumptions................................................................................................................................... 35
5.3.3.1 Construction and Operational Data ........................................................................................................ 35
5.3.4 Current Local Activities ...................................................................................................................................... 36
5.3.5 Tourism – Accommodation and Trade............................................................................................................... 36
5.3.5.1 Data Collection .......................................................................................................................................... 36
5.3.5.2 Underberg-Himeville ................................................................................................................................ 36
5.3.5.3 4x4 Tour Operators ................................................................................................................................... 37
5.3.5.4 Lesotho........................................................................................................................................................ 37
5.3.5.5 Mokhotlong Taxi Operators..................................................................................................................... 38
5.4 Other Activities .........................................................................................................................................38
5.5 Results .....................................................................................................................................................38
5.6 Construction Phase Impacts ....................................................................................................................38
5.6.1 KwaZulu-Natal Results....................................................................................................................................... 39
5.6.1.1 Impact on GDP .......................................................................................................................................... 39
5.6.1.2 Impact on Capital Investments ................................................................................................................ 39
5.6.1.3 Impact on Employment Creation ............................................................................................................ 39
5.6.1.4 Impact on Households .............................................................................................................................. 40
5.6.1.5 Fiscal Impact .............................................................................................................................................. 40
5.6.1.6 Impact on Balance of Payments .............................................................................................................. 40
5.6.2 Lesotho............................................................................................................................................................... 40
5.6.2.1 Impact on GDP .......................................................................................................................................... 40
5.6.2.2 Impact on Capital Investments ................................................................................................................ 40
5.6.2.3 Impact on Employment Creation ............................................................................................................ 41
5.6.2.4 Impact on Households .............................................................................................................................. 41
5.6.2.5 Fiscal Impact .............................................................................................................................................. 41
5.6.2.6 Impact on Balance of Payments .............................................................................................................. 41
5.7 Tourism Results .......................................................................................................................................41
5.7.1 Baseline.............................................................................................................................................................. 41
5.7.1.1 Underberg-Himeville ................................................................................................................................ 41
5.7.1.2 Lesotho........................................................................................................................................................ 42
5.7.2 Tourism Scenarios – Underberg-Himeville Area................................................................................................ 43
5.7.3 Tourism Scenarios – Lesotho ............................................................................................................................ 44
5.7.4 Road Maintenance ............................................................................................................................................. 45
5.8 Conclusion ...............................................................................................................................................45
6. ECONOMIC COST-BENEFIT ANALYSIS ....................................................................................46
6.1 Purpose....................................................................................................................................................46
6.2 Costs ........................................................................................................................................................46
6.3 Benefits ....................................................................................................................................................46
6.3.1 Vehicle Operating Costs .................................................................................................................................... 46
6.3.2 Time Savings...................................................................................................................................................... 48
6.3.3 Other Benefits .................................................................................................................................................... 49
6.4 Results .....................................................................................................................................................49
6.5 International Relations .............................................................................................................................52
7. MITIGATION MEASURES............................................................................................................53
8. CONCLUSION ..............................................................................................................................55
8.1 Key Findings ............................................................................................................................................55
8.2 Impact Significance Ratings.....................................................................................................................55
REFERENCES .......................................................................................................................................58
APPENDIX A ..........................................................................................................................................59
Imani Development (SA) (Pty) Ltd 11 August 2011Economic Impact of Surfacing the Sani Pass Road - xi -
LIST OF TABLES
Table 2.1: Imports and Exports through Sani Top Border Post, Financial Years (April-March)
2005/06-2010/11 ....................................................................................................................... 9
Table 2.2: Wool and Mohair Output, Lesotho and Mokhotlong, 2005/06-2009/10 (‘000 kg per
annum)..................................................................................................................................... 11
Table 2.3: Wool and Mohair Value, Lesotho and Mokhotlong, 2005/06-2009/10 (Rmill) .... 11
Table 2.4: Visitor Arrivals, Sani Top Border Post, 2009 ........................................................ 13
Table 3.1: Landcover Types .................................................................................................... 19
Table 3.2: Key Ecosystem Services Supplied ......................................................................... 21
Table 3.3: Total current supply of and demand for ecosystem services (ordered from highest
to lowest demand) ................................................................................................................... 22
Table 3.4: Relative changes in supply of services with different scenarios (%) ..................... 23
Table 3.5: Relative Changes in Demand for Services at a Local Level with Different
Scenarios ................................................................................................................................. 24
Table 3.6: Relative changes in demand for services at a provincial or national level with
different scenarios ................................................................................................................... 25
Table 3.7: Relative Changes in Demand for Services at an International Level with Different
Scenarios ................................................................................................................................. 26
Table 4.1: Capital Costs of Construction (R) (constant 2010 prices)...................................... 28
Table 4.2: Maintenance Costs, South Africa and Lesotho (R) (constant 2010 prices)............ 28
Table 4.3: Closure of Sani Pass – Financial Costs (constant 2010 prices).............................. 29
Table 4.4: Financial Costs and Benefits of Surfacing Sani Pass-Mokhotlong Road (constant
2010 prices) ............................................................................................................................. 30
Table 5.1: Number of Beds, Bed Occupancy and Annual Accommodation Turnover in the
Underberg-Himeville Area (2010 prices)................................................................................ 36
Table 5.2: Annual Number of Tourists, Underberg-Himeville ............................................... 37
Table 5.3: Number of Rooms, Beds and Occupation Rate Available in Mokhotlong ............ 38
Table 5.4: Macro-economic Impact of the Construction Phase .............................................. 39
Table 5.5: Macro-economic Impact of the Construction Phase .............................................. 40
Table 5.6: Tourism Activity in Underberg-Himeville expressed in Macro-economic
Parameters, Rmill (2010 prices) .............................................................................................. 41
Table 5.7: Tourism Activity in Mokhotlong expressed in Macro-Economic Parameters, Rmill
(2011 prices)............................................................................................................................ 42
Table 5.8: Tourism Growth Scenario in KZN, Rmill (2010 prices)........................................ 44
Table 5.9: Tourism Growth Scenario in the Mokhotlong Area in Lesotho, Rmill (2010 prices)
................................................................................................................................................. 45
Table 6.1: Vehicle Operating Costs, Sani Pass (R/km) ........................................................... 47
Table 6.2Vehicle Operating Cost Assumptions ...................................................................... 47
Table 6.3: VOC Savings – Diverted Traffic............................................................................ 48
Table 6.4: Time Savings for Diverted Traffic ......................................................................... 48
Table 6.5: Other Benefits ........................................................................................................ 49
Table 6.6: CBA Results........................................................................................................... 51
Table 6.7: Sensitivity Analysis................................................................................................ 51
Table 8.1: Impact Assessment: Road upgrade versus road closure......................................... 56
Table 8.2: Impact Assessment: Road upgrading versus status quo......................................... 57
Imani Development (SA) (Pty) Ltd 11 August 2011Economic Impact of Surfacing the Sani Pass Road - xii -
LIST OF FIGURES
Figure 3.1: Ecosystem functions, such as decomposition, generate a range of ecosystem
services, such as soil fertility, which we require to maintain human well-being. ................... 17
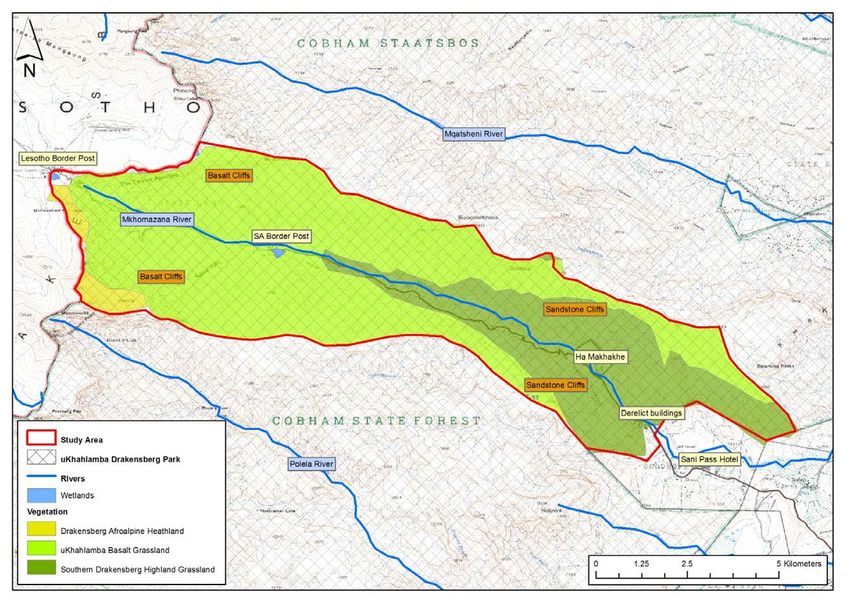
Figure 3.2: The ECO-FUTURES approach used to assess the supply and demand for
ecosystem services .................................................................................................................. 18
Figure 3.3: Sani Pass Showing Landcover Types ................................................................... 19
Figure 3.4: Defined study area for the ecosystem services assessment showing main rivers,
wetlands, and vegetation types, as well as important features ................................................ 20
Figure 5.1: Multipliers and Turnover ..................................................................................... 33
Imani Development (SA) (Pty) Ltd 11 August 2011Economic Impact of Surfacing the Sani Pass Road -1-
1. INTRODUCTION
1.1 Background
The KwaZulu-Natal Department of Transport (KZN-DOT) wishes to upgrade the Sani Pass
Road (MR318). As part of the Environmental Impact Report (EIR) of Phase 2 (upgrading
from km14 to km 33) being prepared by Arcus Gibb, a report on the economic aspects was
commissioned and completed in 2009.
The present study was commissioned by Arcus Gibb on behalf of the KZN-DOT on 5
November 2010. The purpose of this study is to take a holistic view of the costs and benefits
relating to the upgrading of the road both in South Africa and Lesotho. Such a view would
cover a conventional cost-benefit analysis, a resource economics analysis, Social Accounting
Matrix and macro-economic impact modelling, and attention to development projects and
aspects of international relations.
1.2 Rationale for Surfaced Road
The project covers the Sani Pass road in South Africa and the road from the border at Sani
Top to Mokhotlong in Lesotho.
Six options were identified for Phase 2 of the Sani Pass road project by the engineering
consultants. These are:
(i) Close pass – deproclaim road and hand over to Ezemvelo KZN Wildlife.
(ii) Re-gravel, minor drainage improvements, maintain.
(iii) Improve geometrics, upgrade drainage, retain splash troughs, construct retaining walls
and re-gravel.
(iv) Improve geometrics, upgrade drainage, construct bridges, retaining walls, blacktop up
to km25, gravel to km33.
(v) Improve geometrics, upgrade drainage, construct bridges and retaining walls, hard
surface from km14 to km33.
(vi) Improve geometrics, upgrade drainage, construct bridges and retaining walls, blacktop
from km14 to km31, and tunnel (3km).
An economic cost-benefit analysis customarily compares “with” and “without” scenarios. For
Sani Pass, the latter scenario would in fact be the base case which would imply the “do-
nothing” option. This means that the status quo would be maintained, the status quo being
defined as routine maintenance only. However, this is an unsustainable long-term option
because of the increased costs both of repairing storm damage and washaways which are
regular annual occurrences, and of trucking gravel for resurfacing. Borrow pits are not
permitted in the World Heritage Site, and hence gravel has to be trucked in over a
considerable distance. Because this is no longer a sustainable option, it implies the
decommissioning of the road and handing it over to Ezemvelo KZN Wildlife.
For the same reason that the status quo is no longer sustainable, upgrading to an improved or
good gravel road is also not an option. Thus, Options (ii) and (iii) have been discarded and
are excluded from the analysis, meaning that the “with” scenario relates only to surfacing the
road. The final design has incorporated Option (v) as the desired one, and has therefore
eliminated Options (iv) and (vi). Thus, the comparison in the economic analysis is between
Options (i) and (v), i.e., between closing the road and providing it with a hard surface.
Imani Development (SA) (Pty) Ltd 11 August 2011Economic Impact of Surfacing the Sani Pass Road -2-
Option (v) allows accessibility to the public and not only 4-wheel drive vehicles, i.e., small
vehicle categories such as passenger cars, bakkies, SUVs and the larger taxi vehicles (GVM
of 4.2 tons, Toyota Quantum-type) will be allowed. Fully laden trucks of 8-ton maximum
payload, however, will be restricted to 4-wheel drive vehicles with a 13-ton GVM. Tour and
passenger buses will be restricted to a short-wheel base 4x4 vehicle with an 8.5 ton GVM.
Despite greater accessibility, a surfaced Sani Pass road will not be an interstate highway
competing with the N3 or N5.
On the Lesotho side, the intention is to surface the road from Sani Top to Mokhotlong in
order to complete a trans-Lesotho surfaced road. A feasibility study of upgrading this road to
a bitumen standard is being undertaken by Aurecon for the Roads Directorate in Lesotho. The
road to Mokhotlong and Sani Top is spectacular and includes the highest road in Africa at the
top of the Tlaeeng Pass, 3275m above sea level. Between Sani Top and Mokhotlong is Black
Mountain Pass, every bit as dramatic as Sani but in a very different way. Sani Pass spirals
upward over a short distance, while Black Mountain Pass flows with the terrain, climbing
steeply and then dropping sharply into deep valleys. Mokhotlong is 52 kilometres from Sani
Top.
1.3 Methodology
A field visit to Lesotho was undertaken between 18-20 January 2011. Appointments with
various government departments and officials were set up for the consultants by the Ministry
of Public Works and Transport. Meetings were held in Maseru on 18 and 20 January and in
Mokhotlong on 19 January.
The main aim of the visit was to obtain quantitative information wherever possible on
economic activities in the area of influence of the Mokhotlong-Sani Pass road, economic
development plans for Mokhotlong District, and economic statistics for Lesotho with a
regional (district) breakdown. In discussions with various officials, it emerged that there is no
National Economic Development Plan at present, although one is expected to be produced by
mid-year. Similarly, there are no regional development plans for the districts. The National
Tourism Development Plan was never approved by the cabinet, has never been implemented
and is obsolete although the factual content remains valid. Some statistical information and
extracts from internal reports were made available to us by various respondents in the
meetings.
The consultants have examined the specialist reports on economic and social impacts as well
as the reports by the aquatic, vegetation and heritage specialists prepared for the
Environmental Impact Report, and have used certain information contained in these reports
that are relevant to this study. Figures have been corroborated where necessary through
interviews and further data collection.
A site visit to Sani Pass was undertaken on 11 February. Four team members made the trip,
but because of rain and storm damage the final ascent was inaccessible by the 4x4 vehicle
used. Two consultants climbed the final section along the switchback curves, crossing the
border to Sani Top Chalets where an interview was held.
Resource economists held a workshop with a panel of experts in Pietermaritzburg on
8 March. This was attended by the following:
Imani Development (SA) (Pty) Ltd 11 August 2011You can also read