Environmental Guide for Assessing and Mitigating the Air Quality Impacts and Greenhouse Gas Emissions of Provincial Transportation Projects ...
←
→
Page content transcription
If your browser does not render page correctly, please read the page content below
MINISTRY OF TRANSPORTATION

Environmental Guide for Assessing and Mitigating
  the Air Quality Impacts and Greenhouse Gas
 Emissions of Provincial Transportation Projects

                    January 2012
Ministry of Transportation
MINISTRY OF TRANSPORTATION
Environmental Guide for Noise
ENVIRONMENTAL STANDARDS AND PRACTICES
Environmental Guide: Recommended Approach for Assessing
and Mitigating the Air Quality Impacts and Greenhouse Gas
Emissions of Provincial Transportation Projects
ISSUED BY:
ENVIRONMENTAL POLICY OFFICE
ONTARIO MINISTRY OF TRANSPORTATION
301 ST. PAUL STREET, GARDEN CITY TOWER
ST. CATHARINES, ON
L2R 7R4
Citation
Environmental Guide for Assessing and Mitigating the Air Quality Impacts and Greenhouse Gas Emissions of
Provincial Transportation Projects (October 2011, Ontario Ministry of Transportation).
Acknowledgements
This Guide was developed in response to increased demand from provincial and federal regulatory agencies,
and the public, to improve the assessment and mitigation of air quality and greenhouse gas emissions
associated with provincial transportation
Photo Credit: projects.
McCormick Rankin CorporationIt outlines a standardized assessment approach and
methodology for both individual and Class EA projects.
It was developed in consultation with technical and environmental assessment representatives from both
levels of government, including Environment Canada, Health Canada, Transport Canada, the Canadian
Environmental Assessment Agency (Ontario Region) and the Ontario ministries of Environment and Health.
Part of the Standard Environmental References
The time and effort expended by these individuals, to thoroughly review and provide comment on the
document, throughout its development, is greatly appreciated. We hope that their interest and input regarding
suggested improvements to the document will continue following implementation of the assessment approach
and methodology.
ISSUED BY:
This Guide is intended to be a living AND
PROVINCIAL document that will be reviewedPLANNING
ENVIRONMENTAL and revised asOFFICE
necessary.
MINISTRY OF TRANSPORTATION
Comments and Suggestions 301 ST. PAUL STREET
ST. CATHARINES, ONTARIO
The Ministry of Transportation welcomes comments
L2R and suggestions on ways to improve the document with
7R4
the objective of providing a practical and pragmatic approach to environmental management in the Province of
Ontario. MTO anticipates that changes will be warranted to clarify, improve and incorporate new information.
Version: June-2006 Effective:
The format of the document is designed to accommodate such changes. Such revisions and amendments will
be incorporated in later editions of this document. MTO will not formally respond to unsolicited comments
submitted in response to the document.
Ce document hautement spécialisé n'est disponsible qu'en anglais en vertue du règlement 411/97, qui en
exempte l'application de la Loi sur les services en français. Pour obtenir de l’aide en français, veuillez
communiquer avec le ministère des Transports, Bureau des services en français au: 905-704-2045 ou 905-
704-2046.Ministry of Transportation
Environmental Guide for Air Quality Impacts and Greenhouse Gas Emissions
VERSION HISTORY
VERSION # DATE DESCRIPTION OF MAJOR CHANGETABLE OF CONTENTS
1 INTRODUCTION ................................................................................................................................... 7
1.1 CURRENT APPROACH ....................................................................................................................................................7
1.2 RECOMMENDED APPROACH ..........................................................................................................................................7
2 POLICY FRAMEWORK ........................................................................................................................... 9
2.1 CLASSIFICATION OF PROJECTS .........................................................................................................................................9
2.2 AIR QUALITY IMPACT AND GREENHOUSE GAS EMISSIONS ....................................................................................................9
2.3 FEDERAL‐PROVINCIAL EA COORDINATION ......................................................................................................................10
3 AIR QUALITY AND CC/GHG IMPACT ASSESSMENT AND MITIGATION .................................................. 11
3.1 GENERAL METHODOLOGY ...........................................................................................................................................11
3.2 LIMITATIONS .............................................................................................................................................................11
3.3 OBJECTIVES ..............................................................................................................................................................11
3.4 TASKS ......................................................................................................................................................................12
Task 1: Assessment of Transportation Planning Alternatives ..................................................................................13
Task 2: Assessment of Route Alternatives................................................................................................................14
Task 3: Detailed Assessment of the Preferred Alternative .......................................................................................15
Task 4: Assessment of Need for Mitigation..............................................................................................................17
Task 5: Mitigation Options and their Evaluation......................................................................................................17
Task 6: Reporting......................................................................................................................................................18APPENDICES
APPENDIX 1: AIR QUALITY AND GHG EMISSIONS – A TRANSPORTATION PERSPECTIVE............................................ 23
1. AIR QUALITY ..............................................................................................................................................................23
1.1 Measurement and Planning .............................................................................................................................23
1.2 Transportation Related Air Pollutants..............................................................................................................24
1.3 Local and Regional Air Quality .........................................................................................................................27
1.4 Indoor versus Outdoor Air Quality....................................................................................................................27
1.5 Transportations Contribution to Air Pollutants ................................................................................................28
2. GREENHOUSE GAS EMISSIONS (CLIMATE CHANGE)..................................................................................................29
APPENDIX 2: PREDICTION OF CRITERIA AIR CONTAMINANT AND GREENHOUSE GAS EMISSIONS OF ROAD
TRANSPORTATION VEHICLES ............................................................................................................. 31
1. PREDICTION OF CRITERIA AIR CONTAMINANT EMISSIONS .......................................................................................31
1.1 Preamble ..........................................................................................................................................................31
1.2 Criteria Air Contaminants.................................................................................................................................32
1.3 Prediction of Emissions – General Methodology ..............................................................................................32
1.4 Prediction of Emissions: Practices for MTO MOBILE 6.2 Applications .............................................................34
1.5 Prediction of Emissions: Re‐Entrained Road Dust............................................................................................36
1.6 Prediction of Emissions: Truck Idle Emission Rates...........................................................................................38
2. PREDICTION OF GREENHOUSE GAS EMISSIONS ........................................................................................................39
APPENDIX 3: ASSESSMENT OF LOCAL AIR QUALITY IMPACTS...................................................................................... 41
1. INTRODUCTION.........................................................................................................................................................41
2. GENERAL APPROACH.................................................................................................................................................42
3. CAL3QHC/R DISPERSION MODELS: A BRIEF REVIEW .................................................................................................43
4. CREDIBLE WORST‐CASE ANALYSIS: METHODOLOGY ................................................................................................47
5. COMPREHENSIVE ANALYSIS: METHODOLOGY ......................................................................................................................52
APPENDIX 4: ASSESSMENT OF REGIONAL AIR QUALITY AND CC/GHG EMISSION IMPACTS....................................... 57
1. INTRODUCTION.........................................................................................................................................................57
1.1 Describing Regional Air Quality ........................................................................................................................57
1.1.1 Regionally Important Pollutants .................................................................................................................................... 58
1.1.2 Averaging Periods for Pollutant Concentrations............................................................................................................ 58
1.1.3 Spatial Extent of the Region........................................................................................................................................... 58
1.2 Regional Air Quality In Ontario ........................................................................................................................59
1.2.1 Recent Trends ................................................................................................................................................................ 59
1.2.2 Attribution of Pollution to Local and Distant Sources.................................................................................................... 60
1.3 Climate Change and GHG Emissions ................................................................................................................60
2. ASSESSMENT OF REGIONAL AIR QUALITY IMPACTS ..................................................................................................60
2.1 Rationale For Assessment.................................................................................................................................60
2.2 Potential Assessment Approaches....................................................................................................................62
3. ASSESSMENT OF REGIONAL GHG EMISSION IMPACTS ..............................................................................................68
3.1 Recommended Methodology to Predict Regional GHG Emission Impacts .......................................................70
APPENDIX 5: MITIGATION OPTIONS FOR LOCAL AIR QUALITY, REGIONAL AIR QUALITY AND GHG EMISSION IMPACTS
......................................................................................................................................................... 73
1. INTRODUCTION.........................................................................................................................................................73
2. LOCAL AIR QUALITY IMPACTS....................................................................................................................................75
2.1 MTO Experience with Local Air Quality Impacts:..............................................................................................75
2.2 Local Mitigation Opportunities and Considerations:........................................................................................762.2.1 Dust Control................................................................................................................................................................... 76
2.2.2 Limiting Vehicle Speed................................................................................................................................................... 76
2.2.3 Vegetative Groundcover................................................................................................................................................ 77
3. MITIGATION OF REGIONAL AIR QUALITY AND GHG EMISSION IMPACTS ..................................................................77
3.2 Regional Mitigation Opportunities and Considerations ...................................................................................77
3.2.1 Provision of Transportation Modes with Low Emission Rates ............................................................................................ 78
3.2.2 Provision of HOV Lanes....................................................................................................................................................... 78
3.2.3 Road Pricing........................................................................................................................................................................ 78
3.2.4 Highway Geometric Design ................................................................................................................................................ 78
FIGURES
FIGURE 1: METHODOLOGY FLOWCHART: SELECTION OF PREFERRED ALTERNATIVE .................................................................. 19
FIGURE 2: METHODOLOGY FLOWCHART: ASSESSMENT OF PREFERRED ALTERNATIVE ............................................................... 20Ministry of Transportation
Environmental Guide for Air Quality Impacts and Greenhouse Gas Emissions
1 INTRODUCTION
The Ontario and the Canadian Environmental Assessment Acts call for due
consideration of the potential impacts of transportation projects on the social and
physical environments.
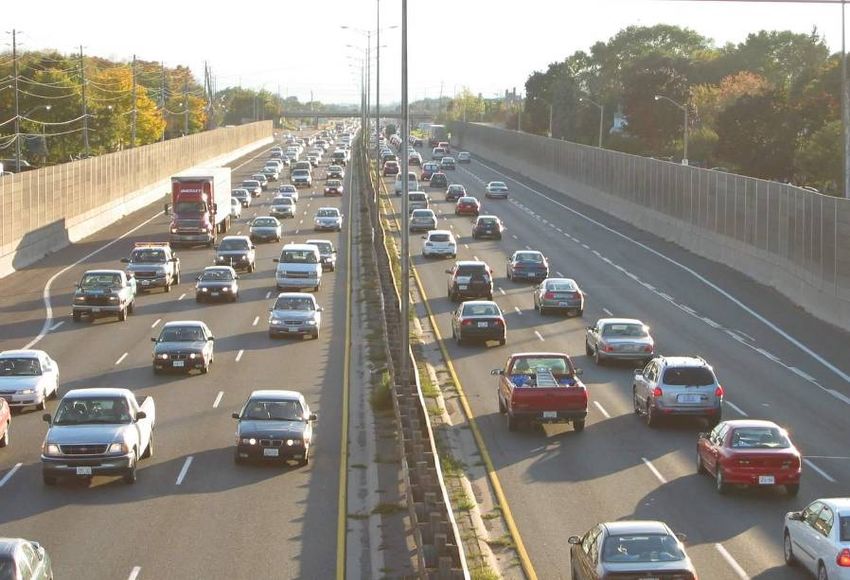
The operation of large transportation facilities, highway construction and highway traffic
in particular, can have significant local, regional and, cumulatively, global impacts on the
atmosphere and the climate system. Specifically, pollutants in vehicle exhaust and
evaporative emissions and in re-entrained road surface contaminants affect air quality
adversely. They also contribute to the gradual accumulation of greenhouse gases.
These potential air quality (AQ) impacts and greenhouse gas (GHG) emissions1 of road
transportation are explained in Appendix 1 of this document.
1.1 Current Approach
MTO, as a proponent of provincial transportation initiatives, is responsible for
addressing the air quality and climate change/greenhouse gas (CC/GHG) emission
impacts of proposed transportation projects. The methodology for this task is, however,
not well established, and as a result, it is handled on a project-by-project basis by MTO,
with input from the Ministry of the Environment (MOE) and, where the Canadian
Environmental Assessment Act is triggered, from Environment Canada and Health
Canada. This project specific approach pursued to date is subject to inefficiencies.
1.2 Recommended Approach
Purpose
The purpose of this document is to recommend a systematic and generic approach to
assess the potential air quality impacts and greenhouse gas emissions of provincial
transportation undertakings for which MTO is directly responsible. It is also to address
mitigation of impacts, where such mitigation is necessary and practical. It does not limit,
however, the ability of project teams and regulatory agencies to address any project
specific issue in the manner that they deem to be appropriate.
Corporate and Regulatory Support
The recommended approach has been presented to MOE, the Canadian Environmental
Assessment Agency (CEA Agency), Environment Canada and Health Canada; as well
as other interested federal agencies including Transport Canada.
With the endorsement of the regulatory agencies and MTO senior management, the
approach will allow MTO staff and consultants to follow a defined analysis and
mitigation methodology.
The defined analysis and mitigation methodologies will become available for use by
MTO staff and consultants after the Guide has been endorsed.
________
1
Transportation’s primary climate change (CC) impact is through its greenhouse gas (GHG) emissions. The scope
of the proposed approach for CC impacts includes assessment and mitigation of these emissions. It does not
include any attempt to assess how transportation might influence the climate or conversely be influenced by the
climate.
January 2012 Page 7 of 78Ministry of Transportation
Environmental Guide for Air Quality Impacts and Greenhouse Gas Emissions
An “endorsed” Guide, also:
y validates the extraordinary amount of time and effort put forward by all parties to develop
the standardized approach;
y removes uncertainty, for both MTO and EA reviewers, resulting in more predictable
timelines and budgets for all parties;
y results in more credibility with review agents, resulting in increased efficiencies in the EA
process;
y increases public confidence and support for MTO’s approach to assessing air quality
impacts and greenhouse gas emissions;
y demonstrates intergovernmental collaboration; and
y promotes interest and potential adoption by other transportation service providers within
Ontario (e.g., municipalities) and across Canada.
Scope
The approach in this Guide will not apply to ongoing, current MTO projects where:
1. MOE has been consulted on and accepted the air quality assessment methodology
in accordance with MOE’s existing air quality assessment requirements, and
2. MTO has:
• initiated an AQ/GHG assessment already and selected a preferred alternative; or
• issued a Notice of Completion of its Transportation Environmental Study Report (TESR);
or,
• submitted to MOE an Individual Environmental Assessment (EA) Report for approval
(Terms of Reference excluded); or
• completed all Environmental Assessment Act (EAA) requirements (MOE approved
Individual EA or Process Completion Statement [PCS] issued by MTO for Class EA
Group A or B projects).
Administration
The Environmental Guide will be revisited in five-year intervals and, if necessary,
revised to account for major advances in science, technology or regulation.
Updated documents will contain the most recent criteria air contaminant (CAC) and
greenhouse gas (GHG) emission inventories by using authoritative sources, including
the following links:
• Environment Canada’s Greenhouse Gas Sources and Sinks in Canada 1990-
2007
(http://unfccc.int/national_reports/annex_i_ghg_inventories/national_inventories_
submissions/items/4771.php); and
• Environment Canada’s 2007 Provincial Air Pollutant Emission Summaries
http://ec.gc.ca/pdb/websol/emissions/ap/ap_query_e.cfm.
January 2012 Page 8 of 78Ministry of Transportation
Environmental Guide for Air Quality Impacts and Greenhouse Gas Emissions
2 POLICY FRAMEWORK
2.1 Classification of Projects
The majority of MTO’s transportation planning and design projects are subject to the
Ontario and Canadian Environmental Assessment Acts. They involve new facilities or
improvements to existing facilities.
Under the Ontario Environmental Assessment Act, projects that involve the planning of
new large facilities such as provincial freeways are subject to an Individual EA. Other
projects, which are relatively small in scale, routinely performed, or have predictable
and mitigable environmental effects, are subject to MTO’s Class EA process.
Projects subject to the Class EA are divided into four groups - A, B, C, and D. Group ‘A’
projects involve new facilities, Group ‘B’ are major improvements to existing facilities,
Group ‘C’ entail minor improvements to existing facilities, and Group ‘D’ include
operation, maintenance, administration and other work on existing facilities.
2.2 Air Quality Impact and Greenhouse Gas Emissions
The air quality and climate change/greenhouse gas (AQ and CC/GHG) implications of
projects subject to an Individual EA can be significant2. The same is also true for some
Group ‘A’ and ‘B’ projects completed through the Class EA process. Group C and D
projects, on the other hand, are not likely to have significant AQ and CC/GHG impacts
or offer opportunities to influence these impacts substantially. Hence, the detailed
assessment and mitigation approach proposed in this document is intended for
Individual EA and select Group ‘A’ and ‘B' projects.
Under the EAA, MTO is required to assess the environmental consequences of an
undertaking, including the effect on air quality. However, MOE may not require an air
quality and greenhouse gas assessment for certain Group ‘A’ and ‘B’ MTO Class EA
projects under the circumstances described below.
MTO provides MOE with supporting documentation so as to satisfy MOE that there is:
1. a relatively small increase in the number of emission sources (i.e., vehicles and/
or traffic capacity); and
2. sufficient distance from the edge of the highway right-of-way to sensitive
receptors (e.g., residential dwellings and institutional buildings).
While there is no legal obligation for MTO to meet any specific air quality standard or
GHG emission target, MTO will endeavour to meet all relevant standards and do better
by minimizing the air quality and GHG emission impacts of all of its projects whenever
and wherever this is technically feasible and economically viable.
________
2
The word ‘significant’ is used in this document in its dictionary meaning – not in any specific meaning assigned to it
in a legal document.
January 2012 Page 9 of 78Ministry of Transportation Environmental Guide for Air Quality Impacts and Greenhouse Gas Emissions 2.3 Federal-Provincial EA Coordination Projects that warrant detailed AQ and CC/GHG assessment will be studied with the technical methodology defined in this document. This methodology will meet the needs of both provincial and federal regulatory agencies, in the spirit of the Canada-Ontario Agreement on EA Cooperation. January 2012 Page 10 of 78
Ministry of Transportation
Environmental Guide for Air Quality Impacts and Greenhouse Gas Emissions

3         AIR QUALITY AND CC/GHG IMPACT ASSESSMENT AND MITIGATION
3.1       General Methodology

The proposed methodology to air quality impact assessment relies on pollutant
emission and dispersion modelling to predict the contribution of the project to ambient
pollutant concentrations over a 20-year period. This contribution, added to background
concentration levels, allows prediction of the combined effects of the proposed project
and all other contributors to air pollution. The resulting concentration levels are
compared with the provincial and federal ambient air quality criteria and standards to
assist in the assessment and evaluation of transportation alternatives and to judge the
need for any mitigation.

The methodology for potential CC/GHG impacts relies on emission modelling to predict
the net amount of greenhouse gases attributable to the project over a 20-year period. A
decrease in net emissions will help Ontario meet its GHG emission targets for 2014,
2020 and 2050 (Ontario’s Action Plan on Climate Change – August 2007). Similarly, it
will help Canada contribute to the international effort to reduce GHG emissions.

It should be noted that the MOE, where appropriate, may require pre-construction and
post construction ambient air monitoring in such a manner as would adequately assess
potential impacts to local air quality.

The general methodology is described by the outline of individual tasks in Section 3.5
and in Appendices 2 – 5 of this document.
3.2       Limitations
The above-sketched general approach to AQ and CC/GHG impact assessment is
limited to prediction of emissions and ambient pollutant concentration levels. It does not
extend to an explicit prediction of health and welfare effects. However, the likelihood of
health and welfare effects of air pollution can be inferred by comparing predicted
pollutant concentrations with the Provincial Ambient Air Quality Criteria, the National
Canada-Wide Standards, and the National Ambient Air Quality Objectives. The same
cannot be done with greenhouse gases. Hence, climate change impacts will be
assessed indirectly and on a relative scale by comparing the net GHG emission
consequences of a proposed initiative with relevant benchmarks, such as Ontario’s
transportation and total GHG emissions.
3.3       Objectives
The AQ and CC/GHG impact assessment will serve the following specific objectives:

1)      Provide comparative pollutant emission estimates that can be used in the selection of the
        “preferred” transportation and route alternative(s). This information can become part of
        the set of traditional project planning and design criteria and enhance the societal value of
        the selection process.

2)      For the preferred alternative and the planning timeframe (typically, 20 years):

January 2012                                                                                Page 11 of 78
Ministry of Transportation
Environmental Guide for Air Quality Impacts and Greenhouse Gas Emissions
• Assess local3 air quality impacts and, specifically, the likelihood, extent and duration
of exceeding provincial ambient air quality criteria and national air quality standards.
The results of this assessment are of direct interest to the agencies and to local
residents, institutions and businesses.
• Assess regional4 air quality impacts. The results of this analysis are of particular
interest to local, provincial and federal governments and can assist in the project
approval process. The impacts can be either positive or negative relative to a do-
nothing scenario.
• Assess the incremental increase or decrease in expected greenhouse gas emissions.
This information is of particular interest to the provincial government with respect to
the Climate Change Action Plan and the federal agencies responsible for Canada’s
international efforts on Climate Change (CC).
3) Assess the need for and practicality of mitigation measures and predict their utility. This
information can be useful to MTO, regulatory agencies, stakeholders, and the public.
4) Inform MTO’s long-term transportation policy and planning decisions through the collective
experience gained from diverse projects over the course of several years. This last
objective falls beyond the scope of the Environmental Guide but will be pursued by MTO’s
Air Quality and Climate Change Team on an ongoing basis.
3.4 Tasks
A comprehensive AQ and CC/GHG study can pursue the above objectives by
performing the six tasks listed below.
1. Assessment of transportation planning alternatives
2. Assessment of route alternatives
3. Detailed assessment of the preferred alternative (selected transportation planning and
route option)
4. Assessment of need for mitigation
5. Evaluation of mitigation options
6. Reporting
Note: Tasks 1 – 6 apply to Individual and Group ‘A’ projects. Tasks 3 – 6 apply to Group ‘B’ projects.
The balance of this document is devoted to a brief description of each task. The details
of the scientific methodology recommended for each task are provided in individual
appendices (Appendix 2 – 5).
________
3
The word ‘local’ refers to the immediate vicinity of the transportation system where the concentration of
transportation-related air pollutants may exceed the ambient air quality criteria for one or more hours in a typical
year. For major roads, the collective experience of the scientific community suggests that the affected immediate
vicinity is limited to the area within approximately 500 m of the road.
4
The word ‘regional’ refers to a geographic area in which the planned transportation system is likely to have a
significant contribution to the cumulative air pollution and greenhouse gas emissions load. The definition of an air
quality region is not unique and will depend on the specifics of the transportation system and the natural and social
geography around it.
January 2012 Page 12 of 78Ministry of Transportation Environmental Guide for Air Quality Impacts and Greenhouse Gas Emissions Task 1: Assessment of Transportation Planning Alternatives The principal function of a transportation system is to provide access to people and/or goods at a certain capacity and level of service (performance). This capacity and level of service can be achieved, in theory, by a number of equivalent alternative transportation systems (e.g., road, rail, marine, transit) or a combination of these and/or transportation demand management, traffic control and road improvement. The transportation demand management measures include transitways and HOV lanes. Under favourable conditions, these can be effective in reducing the total vehicle kilometres (VKTs) travelled and, hence, total vehicle emissions. Access management and Intelligent Transportation Systems (ITS) are part of the traffic control toolkit. They may improve traffic flow (reduce vehicle stops per distance and time spent at idle) and traffic related total emissions. Road improvements with respect to geometric and structural design may contribute to lower vehicle fuel consumption and emissions. The EA process affords the opportunity to compare these and other alternatives systematically with respect to a set of evaluation criteria. AQ and CC/GHG impacts are part of this set of criteria. Some transportation alternatives may have significant air quality consequences for the local community and even for the region (air shed) at large. They may also contribute incrementally to the growing greenhouse gas content of the global atmosphere and the extent of anthropogenic climate change. Most of these consequences are proportional to the amount of pollutants (criteria air contaminants) and greenhouse gases emitted by the transportation alternative studied. Hence, a comparative assessment of equivalent transportation alternatives with respect to AQ and CC/GHG can be conducted by estimating the total amount of pollutant and greenhouse gas emissions, in tonnes per year, for each transportation alternative studied. This approach is often referred to as burden analysis. Burden analysis is most appropriate for road transportation initiatives with one or more credible alternatives and with significant emission burdens. The proposed approach posits that any transportation initiative that increases the total provincial emissions of a critical air pollutant or those of greenhouse gases (weighted sum of CO2, CH4 and N2O emissions) by more than 0.1% (one-thousandth)5 of their respective values in an appropriate reference year is a significant pollution burden. [Note: To accommodate potential special requirements of regulatory agencies, MTO may use a stricter criterion than the 0.1% level recommended.] The critical air pollutants are NOx and PM2.5. These are arguably the most important transportation related contributors to smog. Burden analysis can be carried out during that phase of an environmental assessment study where transportation planning alternatives are being assessed and evaluated. The principal steps of this analysis are described below. The details of the recommended scientific methodology for the burden analysis are provided in Appendix 2. January 2012 Page 13 of 78
Ministry of Transportation
Environmental Guide for Air Quality Impacts and Greenhouse Gas Emissions

Burden Analysis: Key Steps

•      Define credible transportation alternatives with equivalent passenger and/or goods
       movement capacity and level of service in one or more appropriate reference years.
       Alternatives may include a new highway, expansion of an existing highway, one or more
       transit routes, rail, etc.

•      For each alternative, predict the annual vehicle kilometres travelled (VKT) by each major
       vehicle type (e.g., VKT for cars and light trucks, heavy trucks, buses, and freight trains) for
       the reference years.

•      For each vehicle type, estimate emission factors in gram/VKT of principal pollutants (CO,
       NOx, VOCs, PM2.5, and PM10) and greenhouse gases (CO2, N2O and CH4). The VOCs will
       include, specifically, the following “air toxics”: formaldehyde, acetaldehyde, benzene, 1, 3-
       butadiene, and acrolein.

•      Integrate the VKT and emission factor data to estimate the total pollutant and greenhouse
       gas emissions for each credible transportation alternative in each reference year.

•      Compare alternatives with respect to emissions in the context of relevant emission
       inventories (e.g., total emissions and/or transportation emissions in Ontario and in Canada).
       This information is available from Environment Canada.

Task 2:        Assessment of Route Alternatives
An AQ and CC/GHG impact assessment will be needed at the route planning phase of
the EA process, if the preferred transportation alternative (highway or other mode)
involves potentially one or more new route alternatives.
Route location can have local and regional AQ and provincial/national CC policy
implications (Ontario’s GHG targets and Canada’s international obligations). The route
of a highway and/or alternative transportation mode is of greatest significance to the
local community. During planning, the project team may have the opportunity to keep
the distance of the highway or other major transportation facilities from sensitive
receptors (residences) and critical receptors (hospitals, retirement homes, childcare
centres, etc.), at approximately 100 m or greater. This would help, in most cases, to
avoid the need for air quality impact mitigation.
The project team will always assess the local AQ implications of each route alternative
for the critical and sensitive receptors affected by the pollution generated on each route
and associated infrastructure. Commercial and industrial buildings are not included in
this assessment, unless specifically called for by the Ministry of the Environment.

The regional and national AQ & CC/GHG implications, on the other hand, warrant
detailed analysis only if there is a significant difference in the expected emissions from

_______
5
    The significance of the 0.1% figure may be explained in the following context: Road traffic on a typical 16 km (10
    mile) portion of a four-lane highway produces more than, but not much more than, 0.1% of Ontario’s NOx and PM2.5
    emissions. Hence, a 0.1% “screen” will capture any transportation alternative with emissions exceeding those of a
    16 km (10 mile), four-lane highway.

January 2012                                                                                                Page 14 of 78
Ministry of Transportation
Environmental Guide for Air Quality Impacts and Greenhouse Gas Emissions
the alternative routes, which can be estimated by comparing route lengths. A difference
of 10% in route length corresponds to approximately 10% difference in most pollutant
emissions and is deemed to be significant enough to warrant a burden analysis, as
described under Task 1 of this Guide. A burden analysis is not warranted if the route
lengths of the shortest and longest alternatives are less than 10% apart. At an absolute
level, a route length difference of less than 1 km is deemed to be clearly insignificant.
Hence, a route length difference of more than 10% or 1 km, whichever is larger, is the
recommended trigger for the burden analysis.
The proposed analysis is most appropriate for the “alternative methods” phase of the
EA process. Its principal steps are described as follows:
• Define the credible alternative routes with equivalent passenger and goods movement
capacity and performance in the reference years.
• Establish the need for a burden analysis, and if warranted, conduct this analysis according
to the method outlined under Task 1. The burden analysis is to help assess, for each route
alternative, the potential for regional air quality and national climate change (GHG
emissions) issues.
The route with the “least” pollutant burden will affect the regional air quality less than its
alternatives. It will also have the least climate change impact (GHG emissions). However,
it may not necessarily be the one with the least local air quality impacts. This issue is
addressed by dispersion modelling, as outlined in the points below.
• In order to assess local air quality impacts, produce a site and project-specific pollutant
concentration profile with distance from the edge of the planned infrastructure for a credible
worst-case6 scenario. This profile will explain to the public the air quality implications of
living at various distances from the highway.
NOx and PM2.5 are the two key pollutants to be considered in this analysis. These are the
principal transportation related air pollutants of concern in Ontario. NOx is most directly
related to the volume and type of traffic (vehicle mix, driving cycle, etc.) while PM2.5 reflects
the influence of both traffic and road conditions (primarily silt loading of roads). The
credible worst-case incorporates 90th percentile figures for background concentrations.
• Describe and compare the “credible worst-case” air quality (atmospheric concentration of
pollutants) implications for living within approximately 500 m of each route alternative - with
appropriate references to affected critical (e.g., institutional buildings) and sensitive
receptors (e.g., residences).
Task 3: Detailed Assessment of the Preferred Alternative
The preferred alternative, combining the preferred transportation and route alternatives,
has a high potential for implementation. Hence, the proposed approach for this
alternative includes a methodology for more comprehensive local as well as regional
AQ and CC/GHG emissions impact assessment.
The operation of a typical transportation system, particularly a new highway, can have
significant long-term local and regional impacts. The local impacts involve primarily air
quality. The regional impacts, on the other hand, can involve both air quality and
climate change - although climate change is largely a global phenomenon.
January 2012 Page 15 of 78Ministry of Transportation
Environmental Guide for Air Quality Impacts and Greenhouse Gas Emissions
The local AQ impacts of the transportation system (e.g., highway and other major local
vehicle traffic) can be assessed by emissions and dispersion modelling at the EA for
Route Location and Concept Design or a later stage in the EA process. The scientific
methodology recommended for this analysis is presented in Appendix 3. Its principal
steps are described below.
• For the preferred alternative, encompassing the preferred transportation alternative and
the preferred route, identify those critical receptors (hospital, retirement facility, etc.) and
residences (sensitive receptors) that are in part or wholly within 500 m of the edge of the
travelled transportation infrastructure.
• For each community, select the infrastructure elements that will have a significant air
quality impact. This selection will include the appropriate portion of the mainline highway
with its associated road infrastructure and/or other transportation facility (e.g., commuter
rail line, freight rail line, etc).
• For each community and the relevant infrastructure elements, conduct a credible worst-
case air quality impact assessment. This assessment will produce site-specific
concentration distance profiles for CO, NO2, VOCs, PM2.5, and PM10.
If any of the credible worst-case analyses indicates that a critical receptor (hospital,
retirement facility, etc.) or a significant number of sensitive receptors may be subject to
air quality that does not meet the provincial/national ambient air quality
criteria/standards, then a more detailed analysis will be carried out for that specific
community or receptor. Otherwise, no further local air quality impact assessment is
needed. The detailed air quality impact assessment will be the combined effects
analysis, as defined in Appendix 3. In this analysis, the combined simultaneous
influences of meteorology, traffic volumes, and background pollution on local air quality
are assessed for the reference year(s).
• Explain the implications of the combined effects analysis results in the context of provincial
air quality and other relevant reference data, comparing also build and no-build
alternatives.
The regional AQ and CC/GHG impacts of transportation systems are more difficult to
predict quantitatively. The methodology recommended below is based on quantitative
and detailed prediction of emission inventories and qualitative assessment of their
regional air quality and GHG emission implications.
Estimate the regional air quality implications of the preferred alternative. This entails
prediction of the incremental change (increase or decrease) in the pollution burden of
the region for each reference year (i.e., difference between the build and no-build
options). The recommended methodology for this step is presented in Appendix 4.
• Explain regional impacts in their appropriate context.
• Estimate the total GHG emissions of the preferred alternative for the reference
________
6
The credible worst-case scenario is a hypothetical condition in which near-worst states for background pollution,
meteorology and traffic volume coincide – a highly conservative scenario.
January 2012 Page 16 of 78Ministry of Transportation
Environmental Guide for Air Quality Impacts and Greenhouse Gas Emissions
years and assess their implications for Ontario’s GHG emission targets and
Canada’s international obligations (Appendix 4). This information is primarily to
meet the needs of provincial and federal agencies.
Task 4: Assessment of Need for Mitigation
The local air quality impacts of the preferred alternative may warrant mitigation, if these
impacts are predicted to result in the exceedances of the provincial/federal ambient air
quality criteria, objectives, and standards for one or more criteria air contaminants over
a significant period of time per year and at a significant number of receptors.
Any mitigation decision on regional impacts ought to consider transportation’s role
(share) in the air quality issue of concern. This decision should also be informed by the
relative cost of reducing emissions from transportation and other major provincial
sources of air pollution and by a broad consideration of macro-economic implications.
The necessity to mitigate local and regional air quality impacts is a function of the
likelihood and severity of exposure to air quality that does not meet provincial/federal
ambient air quality criteria, objectives, and standards. This document stipulates that
exposure of only existing institutional buildings and residences, and those explicitly
planned for in official municipal plans at the time the assessment is carried out will be
taken into account in assessing this necessity.
The detailed analyses proposed under Task 3 are designed to deliver the transportation
related data necessary to assist in local and regional mitigation decisions. These data
are however not sufficient to make all decisions, since transportation is only one
variable to affect air quality. Future regional and local air quality will depend in large
part on how emissions from other Ontario sources and trans-boundary pollution will
change over time.
Most long-term air quality trends are at present pointing in the right direction, thanks to
continuing efforts in Canada and the U.S. to curtail emissions from transportation and
other sources of air pollution. It is more than likely that background pollutant
concentrations will decrease in the foreseeable future. The magnitude of this decline is
however very difficult to predict. Hence, the air quality modelling methodology
recommended in this paper will assume that the background pollutant concentrations
will persist at their most recent values over the entire study period (a conservative
assumption).
Task 5: Mitigation Options and their Evaluation
MTO has jurisdiction over a very limited set of mitigation options. This set is often
insufficient to influence regional and local air quality and CC/GHG emission impacts to a
significant degree. There is however greater scope for mitigation within the combined
jurisdictions of the local, provincial and federal governments.
The mitigation options for regional impacts include transportation demand management,
fiscal and financial measures to reduce demand for travel by single occupancy vehicles,
encouragement for the production and use of cleaner vehicles and fuels, and adoption
of stricter new and in-use vehicle and fuel standards. These broader regional measures
and their utility in reducing AQ and CC/GHG impacts are discussed in Appendix 5.
January 2012 Page 17 of 78Ministry of Transportation Environmental Guide for Air Quality Impacts and Greenhouse Gas Emissions Although many of them fall beyond MTO jurisdiction and cannot be delivered by MTO, a judicious assessment of their utility in the AQ and CC/GHG emissions report can be useful to all three levels of government and provide the public with a broader perspective on mitigation initiatives that they can participate in. The mitigation options for local impacts include traffic control measures to reduce and improve traffic flow, better geometric design, better landscaping, and dust control on the highway. The design and efficacy of these potential measures are discussed in Appendix 5. Task 6: Reporting The AQ and GHG emissions assessment and mitigation work will be documented in a stand-alone report, which provides the full context of the project and a detailed presentation and interpretation of the results. This project specific report will not need to justify the methodology employed. This will be accomplished by referencing the appropriate sections of the Environmental Guide in hand. January 2012 Page 18 of 78
Ministry of Transportation
Environmental Guide for Air Quality Impacts and Greenhouse Gas Emissions

Figure 1: Methodology Flowchart: Selection of Preferred Alternative

January 2012                                                               Page 19 of 78
Ministry of Transportation
Environmental Guide for Air Quality Impacts and Greenhouse Gas Emissions

Figure 2: Methodology Flowchart: Assessment of Preferred Alternative

January 2012                                                               Page 20 of 78
Ministry of Transportation
Environmental Guide for Air Quality Impacts and Greenhouse Gas Emissions

                                                  APPENDICES

Appendix 1:            Air Quality and GHG Emissions – A Transportation Perspective

Appendix 2:            Prediction of Criteria Air Contaminant and Greenhouse Gas Emissions
                       of Road Transportation Vehicles

Appendix 3:            Assessment of Local Air Quality Impacts

Appendix 4:            Assessment of Regional Air Quality and Greenhouse Gas Emission
                       Impacts

Appendix 5:            Mitigation Options for Local Air Quality, Regional Air Quality and
                       Greenhouse Gas Emission Impacts

January 2012                                                                                Page 21 of 78
Ministry of Transportation
Environmental Guide for Air Quality Impacts and Greenhouse Gas Emissions
Page Intentionally Left Blank
January 2012 Page 22 of 78Ministry of Transportation
Environmental Guide for Air Quality Impacts and Greenhouse Gas Emissions
APPENDIX 1: Air Quality and GHG Emissions – A Transportation Perspective
1. AIR QUALITY
1.1 Measurement and Planning
The Ontario Ministry of the Environment (MOE) measures ambient air quality in terms of
the concentration of six specific common pollutants in outdoor air. These pollutants are
ozone, particulate matter, carbon monoxide, nitrogen dioxide, sulphur dioxide, and total
reduced sulphur compounds. Their concentrations are measured hourly by a network
of air quality monitoring stations spread across the Province.
MOE converts measured pollutant concentrations into air quality indices (AQIs) with
numeric values of 0 to 100+. Values of 0-15 indicate “very good”, 16-31 “good”, 32-49
“moderate”, 50-99 “poor”, and 100+ “very poor” air quality. Indices are calculated for
each of the six pollutants on a regional basis. The highest calculated value is reported
as the air quality index for that region. MOE uses the AQI to issue air quality advisories
to individual communities across the Province. These advisories may turn into “smog
alerts” on days with persistently poor air quality.
The relation between the index and pollutant concentrations reflects the “best available”
science in human health effects of air pollution. MOE currently employs the relations
presented in Table 1.
Table 1: Relation between the Air Quality Index and Pollutant Concentrations
AQI CO Ozone TRS PM2.5 SO2 NO2
Category (ppm) (ppb) (ppb) (μg/m3) (ppb) (ppb)
Very Good 0-12 0-23 0-5 0-11 0-164 0-104
Good 13-22 24-50 6-10 12-22 165-250 105-204
Moderate 23-30 51-80 11-27 23-45 251-340 205-254
Poor 31-49 81-149 28-999 46-90 341-1999 255-524
Very Poor >49 >149 >999 >90 >1999 >524
Note: The concentration units in this table are those reported by MOE in their website and documents.
The unit ppm stands for parts per million, ppb for parts per billion, and μg/m3 for micro-gram per cubic-metre.
In July 2007, Canadian federal, provincial and municipal governments commenced a
collaborative program to test/pilot a new index – the Air Quality Health Index (AQHI).
This initiative is now providing relevant information on the “healthiness” of the ambient
air by accounting for the combined effects of ozone, NO2 and PM2.5/PM10.
The AQHI is a useful tool to convey general air quality conditions to the public. For a
more detailed and source-specific assessment of air quality, the ambient concentration
January 2012 Page 23 of 78Ministry of Transportation Environmental Guide for Air Quality Impacts and Greenhouse Gas Emissions of each relevant pollutant is compared directly with its ambient air quality criterion or standard. This more detailed approach is adopted in transportation air quality impact assessments. 1.2 Transportation Related Air Pollutants Most transportation vehicles run on hydrocarbons and emit essentially the same pollutants. These directly emitted pollutants are called “primary pollutants” and include carbon monoxide (CO), oxides of nitrogen (NOx) and volatile organic compounds (VOCs). Oxides of nitrogen include nitric oxide (NO), nitrogen dioxide (NO2) and nitrous oxide (N2O). The volatile organic compounds constitute a large group of compounds that contain carbon and hydrogen. Some of the VOCs emitted by transportation vehicles are deemed to have significant health impacts and are designated as “air toxics”. These are benzene, 1, 3-butadiene, formaldehyde, acetaldehyde, and acrolein. There are also secondary pollutants, which are formed in the atmosphere through the chemical and physical transformation of the primary pollutants, some significant distance downstream of their point of emission. These include ozone and particulate matter, the two principal constituents of smog and, currently, the focus of attention of public health officials. Ozone is formed through a complex photochemical reaction of oxides of nitrogen with volatile organic compounds. The rate of this reaction is a function of the composition of the atmosphere and weather conditions. Under ordinary conditions, the rate is relatively slow. Hence, ozone is typically formed many kilometres downwind of the source of its precursors, such as highway traffic. In fact, ozone concentrations are usually depressed around highways, since the nitric oxide (NO) emitted by vehicles reacts relatively rapidly to convert ozone into oxygen (NO+O3 → NO2+O2). This phenomenon is commonly referred to as the “scavenging of ozone”. Particulate matter consists mainly of liquid droplets and solid particles with absorbed or adsorbed gaseous substances and has many sources. Some of the transportation related sources are: road dust; vehicle brake and tire wear products; incomplete combustion products emitted through vehicle exhaust; sulphates formed from the sulphur dioxide emitted by vehicles; and nitrates formed from the oxides of nitrogen emitted by vehicles. The first three of these are deemed to be primary while the last three secondary pollutants. Sulphates and nitrates are formed over time and cannot be traced to a single source or group of sources. Many stationary sources such as smelters, refineries, power plants and all kinds of fossil fuel combustors contribute to these pollutants. Particulate matter of greatest relevance to transportation air quality impacts is commonly classified into two size fractions: those smaller than 10 micron in diameter (PM10, inhalable particulate matter) and those smaller than 2.5 micron (PM2.5, respirable particulate matter). PM10 includes PM2.5 and is commonly split into two fractions: the fine fraction (PM2.5) and the course fraction (PM10 - PM2.5). Currently, health professionals are paying greater attention to the fine fraction, since it appears to be more directly related to respiratory and cardiovascular health effects attributable to particulate matter. The principal transportation source of PM2.5 is vehicle exhaust. January 2012 Page 24 of 78
Ministry of Transportation
Environmental Guide for Air Quality Impacts and Greenhouse Gas Emissions

The pollutants of greatest relevance to transportation air quality impact assessments
are the ones that are subject to provincial or federal air quality guidelines. These
include carbon monoxide (CO), nitrogen dioxide (NO2), ozone (O3), particulate matter
(PM2.5 and PM10), benzene, 1,3-butadiene, formaldehyde, acetaldehyde, and acrolein.
The first four pollutants are included in the MOE air quality index program. The
remaining five are volatile organic compounds designated as “air toxics”. Most of these
pollutants, but not all, are subject to the provincial ambient air quality criteria (AAQC)
and Canada-wide standards (CWS). These criteria and standards are listed in Table 2
in the concentration units of μg/m3 (micro-gram per cubic metre) and ppm (parts per
million) or ppb (parts per billion).

January 2012                                                                      Page 25 of 78
Ministry of Transportation
Environmental Guide for Air Quality Impacts and Greenhouse Gas Emissions

      Table 2: Provincial Ambient Air Quality Criteria (AAQC) and Canada-Wide Standards (CWS)

                                                         AAQC                                        CWS
                 POLLUTANT
                                                 (μg/m3  / ppm / ppb)1                           (μg/m3 / ppb)

                      CO                           30 ppm (1hour)
                                                36,200 μg/m3 (1hour)

                      CO                           13 ppm (8 hour)
                                                15,700 μg/m3 (8 hour)

                     NO2                           200 ppb (1 hour)
                                                  400 μg/m3 (1 hour)

                     NO2                          100 ppb (24-hour)
                                                 200 μg/m3 (24 hour)

                     PM102                        50 μg/m3 (24 hour)

                    PM2.53                                                                   30 μg/m3 (24 hour)

                    Ozone4                         80 ppb (1 hour)                            65 ppb (8 hour)
                                                  165 μg/m3 (1 hour)                         127 μg/m3 (8 hour)

                  Benzene5                        10 μg/m3 (24 hour)

               1,3-Butadiene5                     2.3μg/m3 (24 hour)

               Formaldehyde                       65 μg/m3 (24 hour)

                Acetaldehyde                     500 μg/m3 (24 hour)

                   Acrolein6                    0.04 μg/m3 (24 hour)

                   Acrolein6                      4.5 μg/m3 (1hour)

          Source: Ontario Ministry of the Environment and the U.S. Environmental Protection Agency

          Notes:
                   3
          1) μg/m stands for “microgram per cubic metre”; ppm for “parts per million”; and ppb for “parts per billion”.
                           3
          2) The 50 μg/m 24-hour PM10 level represents an interim AAQC adopted in 1997.
                           3                                    th
          3) The 30 μg/m 24-hour PM2.5 level represents the 98 percentile annual ambient measurement averaged
              over three consecutive years.
          4) The 65 ppb 8-hour O3 level represents the fourth highest annual ambient measurement averaged over
              three consecutive years.

January 2012                                                                                                      Page 26 of 78
You can also read