Pan-European rural monitoring network shows dominance of NH3 gas and NH4NO3 aerosol in inorganic atmospheric pollution load
←
→
Page content transcription
If your browser does not render page correctly, please read the page content below
Atmos. Chem. Phys., 21, 875–914, 2021
https://doi.org/10.5194/acp-21-875-2021
© Author(s) 2021. This work is distributed under
the Creative Commons Attribution 4.0 License.
Pan-European rural monitoring network shows dominance of NH3
gas and NH4NO3 aerosol in inorganic atmospheric pollution load
Y. Sim Tang1 , Chris R. Flechard2 , Ulrich Dämmgen3 , Sonja Vidic4 , Vesna Djuricic4 , Marta Mitosinkova5 ,
Hilde T. Uggerud6 , Maria J. Sanz7,8,9 , Ivan Simmons1 , Ulrike Dragosits1 , Eiko Nemitz1 , Marsailidh Twigg1 ,
Netty van Dijk1 , Yannick Fauvel2 , Francisco Sanz7 , Martin Ferm10 , Cinzia Perrino11 , Maria Catrambone11 ,
David Leaver1 , Christine F. Braban1 , J. Neil Cape1 , Mathew R. Heal12 , and Mark A. Sutton1
1 UK Centre for Ecology & Hydrology (UKCEH), Bush Estate, Penicuik, Midlothian EH26 0QB, UK
2 French National Research Institute for Agriculture, Food and Environment (INRAE), UMR 1069 SAS, 65 rue de St-Brieuc,
35042 Rennes CEDEX, France
3 von Thunen Institut (vTI), Bundesallee 50, 38116 Braunschweig, Germany
4 Meteorological and Hydrological Service of Croatia (MHSC), Research and Development Division, Gric 3,
10000 Zagreb, Croatia
5 Slovak Hydrometeorological Institute (SHMU), Department of Air Quality, Jeseniova 17, 833 15 Bratislava, Slovak Republic
6 Norwegian Institute for Air Research (NILU), P.O. Box 100, 2027 Kjeller, Norway
7 Fundación CEAM, C/Charles R. Darwin, 46980 Paterna (Valencia), Spain
8 Basque Centre for Climate Change, Sede Building 1, Scientific Campus of the University of the Basque Country,
48940, Leioa, Bizkaia, Spain
9 Ikerbasque, Basque Science Foundation, María Díaz Haroko Kalea, 3, 48013 Bilbo, Bizkaia, Spain
10 IVL Swedish Environmental Research Institute, P.O. Box 5302, 400 14, Gothenburg, Sweden
11 C.N.R. Institute of Atmospheric Pollution Research, via Salaria Km. 29, 300 – 00015, Monterotondo st, Rome, Italy
12 School of Chemistry, University of Edinburgh, David Brewster Road, Edinburgh EH9 3FJ, UK
Correspondence: Y. Sim Tang (yst@ceh.ac.uk)
Received: 23 March 2020 – Discussion started: 26 May 2020
Revised: 5 November 2020 – Accepted: 22 November 2020 – Published: 21 January 2021
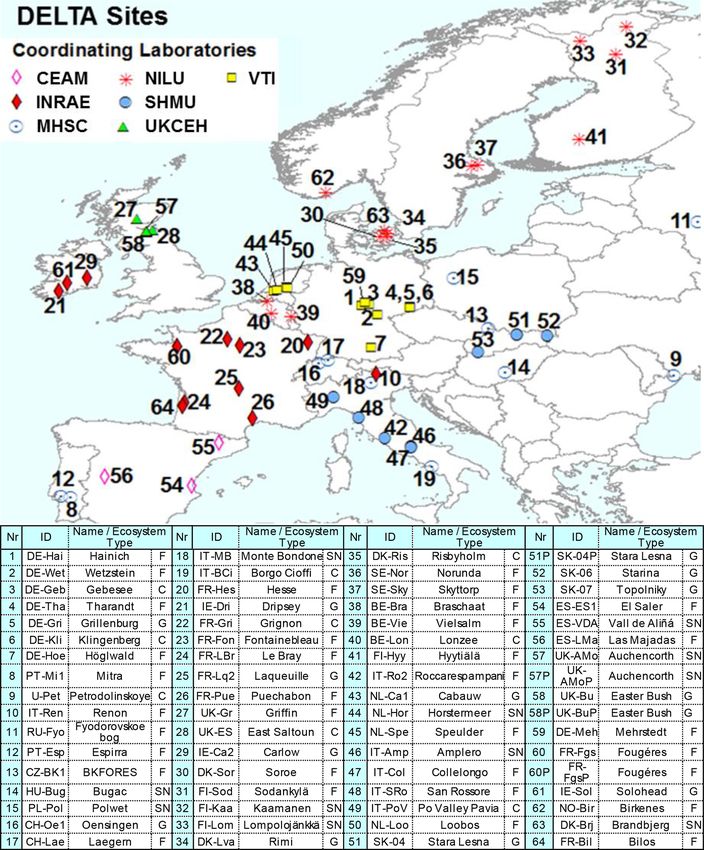
Abstract. A comprehensive European dataset on monthly at- gions, and four main ecosystem types (crops, grassland,
mospheric NH3 , acid gases (HNO3 , SO2 , HCl), and aerosols forests, and semi-natural). The smallest concentrations (with
2−
(NH+ − − + 2+ 2+
4 , NO3 , SO4 , Cl , Na , Ca , Mg ) is presented the exception of SO2− 4 and Na+ ) were in northern Eu-
and analysed. Speciated measurements were made with a rope (Scandinavia), with broad elevations of all components
low-volume denuder and filter pack method (DEnuder for across other regions. SO2 concentrations were highest in cen-
Long-Term Atmospheric sampling, DELTA® ) as part of tral and eastern Europe, with larger SO2 emissions, but par-
the EU NitroEurope (NEU) integrated project. Altogether, ticulate SO2−4 concentrations were more homogeneous be-
there were 64 sites in 20 countries (2006–2010), coordinated tween regions. Gas-phase NH3 was the most abundant single
between seven European laboratories. Bulk wet-deposition measured component at the majority of sites, with the largest
measurements were carried out at 16 co-located sites (2008– variability in concentrations across the network. The largest
2010). Inter-comparisons of chemical analysis and DELTA® concentrations of NH3 , NH+ −
4 , and NO3 were at cropland
measurements allowed an assessment of comparability be- sites in intensively managed agricultural areas (e.g. Borgo
tween laboratories. Cioffi in Italy), and the smallest were at remote semi-natural
The form and concentrations of the different gas and and forest sites (e.g. Lompolojänkkä, Finland), highlighting
aerosol components measured varied between individual the potential for NH3 to drive the formation of both NH+4 and
sites and grouped sites according to country, European re- NO− 3 aerosol. In the aerosol phase, NH +
4 was highly corre-
Published by Copernicus Publications on behalf of the European Geosciences Union.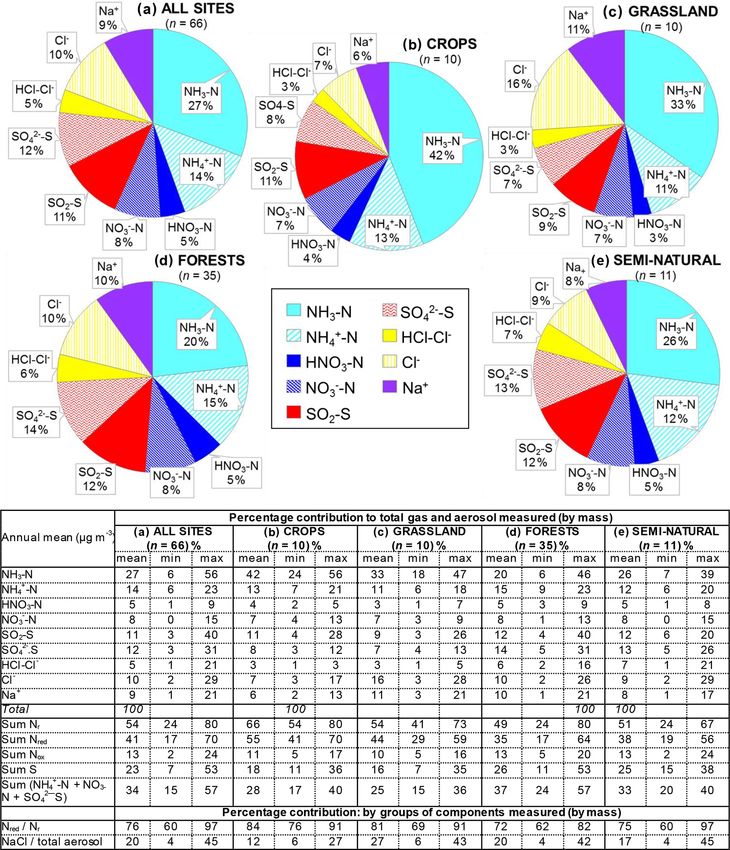
876                              Y. S. Tang et al.: Pan-European rural monitoring network shows dominance of NH3 gas

                                2−
lated with both NO−    3 and SO4 , with a near-1 : 1 relation-   oxides (NOx ), ammonia (NH3 ), and their secondary inor-
ship between the equivalent concentrations of NH+   4 and sum    ganic aerosols (SIAs; ammonium sulfate, (NH4 )2 SO4 ; am-
             2−
(NO−  3 + SO 4  ), of which around  60 % was  as NH 4 NO3 .      monium nitrate, NH4 NO3 ) (ROTAP, 2012; EMEP, 2019).
   Distinct seasonality was also observed in the data, influ-    The aerosols, formed through neutralization reactions be-
enced by changes in emissions, chemical interactions, and        tween the alkaline NH3 gas and acids generated in the at-
the influence of meteorology on partitioning between the         mosphere by the oxidation of SO2 and NOx (Huntzicker et
main inorganic gases and aerosol species. Springtime max-        al., 1980; AQEG, 2012), are a major component of fine par-
ima in NH3 were attributed to the main period of manure          ticulate matter (PM2.5 ) (AQEG, 2012; Vieno et al., 2016a)
spreading, while the peak in summer and trough in win-           and precipitation (ROTAP, 2012; EMEP, 2019). The nega-
ter were linked to the influence of temperature and rain-        tive effects of these pollutants on sensitive ecosystems are
fall on emissions, deposition, and gas–aerosol-phase equilib-    mainly through acidification (excess acidity) and eutrophi-
rium. Seasonality in SO2 was mainly driven by emissions          cation (excess nutrient N) processes that can lead to a loss
(combustion), with concentrations peaking in winter, except      of key species and decline in biodiversity (e.g. Hallsworth et
in southern Europe, where the peak occurred in summer.           al., 2010; Stevens et al., 2010). They are also implicated in
Particulate SO2− 4 showed large peaks in concentrations in
                                                                 radiative forcing and influence climate change through inputs
summer in southern and eastern Europe, contrasting with          of nitrogen that can alter the carbon cycle (Reis et al., 2012;
much smaller peaks occurring in early spring in other re-        Sutton et al., 2013; Zaehle and Dalmonech, 2011).
gions. The peaks in particulate SO2−  4 coincided with peaks
                                                                    A number of EU policy measures (e.g. 2008/50/EC Am-
in NH3 concentrations, attributed to the formation of the        bient Air Quality Directive: EU, 2008; 2016/2284/EU Na-
stable (NH4 )2 SO4 . HNO3 concentrations were more com-          tional Emissions Ceilings Directive, NECD: EU, 2016) and
plex, related to traffic and industrial emissions, photochem-    wider international agreements (e.g. Gothenburg Protocol;
istry, and HNO3 :NH4 NO3 partitioning. While HNO3 con-           UNECE, 2012) are targeted at abating the emissions and
centrations were seen to peak in the summer in eastern and       environmental impacts of SO2 , NOx , and NH3 . The largest
southern Europe (increased photochemistry), the absence of       emissions reductions have been achieved for SO2 , which de-
a spring peak in HNO3 in all regions may be explained by         creased by 82 % across the 33 member countries of the Euro-
the depletion of HNO3 through reaction with surplus NH3 to       pean Environment Agency (EEA-33) since 1990, to 4743 kt
form the semi-volatile aerosol NH4 NO3 . Cooler, wetter con-     SO2 in 2017 (EEA, 2019). Reductions in NOx emissions
ditions in early spring favour the formation and persistence     have been more modest, at 45 % over the same period, with
of NH4 NO3 in the aerosol phase, consistent with the higher      emissions in 2017 of 8563 kt NOx exceeding those of SO2 .
springtime concentrations of NH+              −
                                    4 and NO3 . The seasonal
                                                                 By contrast, the reductions in NH3 emissions (of which over
               −                       +                         90 % come from agriculture) have been more modest, de-
profile of NO3 was mirrored by NH4 , illustrating the influ-
ence of gas–aerosol partitioning of NH4 NO3 in the seasonal-     creasing by only 18 %. Here, the decrease was largely driven
ity of these components.                                         by reductions in fertilizer use and livestock numbers, in par-
   Gas-phase NH3 and aerosol NH4 NO3 were the dominant           ticular from eastern European countries, rather than through
species in the total inorganic gas and aerosol species mea-      implementation of any abatement or mitigation measures.
sured in the NEU network. With the current and projected         More worryingly, the decreasing trend has reversed in re-
trends in SO2 , NOx , and NH3 emissions, concentrations of       cent years, with emissions increasing by 5 % since 2010, to
NH3 and NH4 NO3 can be expected to continue to dominate          4788 kt NH3 in 2017 (EEA, 2019).
the inorganic pollution load over the next decades, especially      In recent assessments, critical loads of acidity were ex-
NH3 , which is linked to substantial exceedances of ecolog-      ceeded in about 5 % of the ecosystem area across Europe in
ical thresholds across Europe. The shift from (NH4 )2 SO4        2017 (EMEP, 2018). While the substantial decline in SO2
to an atmosphere more abundant in NH4 NO3 is expected            emissions has allowed the recovery of ecosystems from acid
to maintain a larger fraction of reactive N in the gas phase     rain, NH3 from agriculture and NOx from transport are in-
by partitioning to NH3 and HNO3 in warm weather, while           creasingly contributing to a larger fraction of the acidity
NH4 NO3 continues to contribute to exceedances of air qual-      load. Although NH3 is not an acid gas, nitrification of NH3
ity limits for PM2.5 .                                           and ammonium (NH+                                       +
                                                                                        4 ) releases hydrogen ions (H ) that
                                                                 acidify soils and fresh water. The deposition of reactive N
                                                                 (Nr ; including oxidized N: NOx , HNO3 , NO−   3 , and reduced
                                                                 N: NH3 , NH+   4 ) and  its contribution to eutrophication  ef-
1   Introduction                                                 fects have also been identified by the European Environment
                                                                 Agency (EEA) as the most important impact of air pollutants
Air quality policies and research on atmospheric sulfur          on ecosystems and biodiversity (EEA, 2019). The deposition
(S) and nitrogen (N) pollutant impacts on ecosystems and         of Nr throughout Europe remains substantially larger than the
human health have focused on the emissions, concentra-           level needed to protect ecosystems, with critical-load thresh-
tions, and depositions of sulfur dioxide (SO2 ), nitrogen        olds for eutrophication from N exceeded in around 62 % of

Atmos. Chem. Phys., 21, 875–914, 2021                                               https://doi.org/10.5194/acp-21-875-2021
Y. S. Tang et al.: Pan-European rural monitoring network shows dominance of NH3 gas                                             877

the EU-28 ecosystem area and in almost all countries in Eu-        spheric measurements of sulfur (SO2 , particulate SO2−   4 ) and
rope in 2017 (EMEP, 2018).                                         nitrogen (NH3 , HNO3 , particulate NH+    4 , NO −
                                                                                                                    3 )  have   been
   Following emission, atmospheric transport and fate of the       made by a daily filter pack method across the European
gases are controlled by the following processes: short-range       Monitoring and Evaluation Program (EMEP) networks since
dispersion and deposition, chemical reaction and formation         1985, providing data for evaluating wet- and dry-deposition
of NH+  4 aerosols, and the long-range transport and deposi-       models (EMEP, 2016; Tørseth et al., 2012). The method,
tion of the aerosols (Sutton et al., 1998; ROTAP, 2012). At-       however, does not distinguish between the gas- and aerosol-
mospheric S and Nr inputs from the atmosphere to the bio-          phase N species. Consequently, these data are reported as to-
sphere occur though (i) dry deposition of gases and aerosols,      tal inorganic ammonium (TIA = sum of NH3 and NH+           4 ) and
(ii) wet deposition in rain, and (iii) occult deposition in fog    total inorganic nitrate (TIN = sum HNO3 and NO−     3 ), limiting
and cloud (Smith et al., 2000; ROTAP, 2012). The deposition        the usefulness of the data. Speciated measurements by an ex-
processes contribute very different fractions of the total S or    pensive and labour-intensive daily annular denuder method
Nr input and different chemical forms of the pollutants at dif-    are also made (Tørseth et al., 2012) but are necessarily re-
ferent spatial scales. NH3 is a highly reactive, water-soluble     stricted to a small number of sites due to the high costs as-
gas and deposits much faster than NOx (which is not very           sociated with this type of measurement. There are also net-
water-soluble and has low deposition velocity). Dry N de-          works with a focus on specific N components, for example,
position by NH3 therefore contributes a significant fraction       the national NH3 monitoring networks in the Netherlands
of the total N deposition to receptors close to source areas       (LML; van Zanten et al., 2017) and in the UK (National Am-
and will often exert the larger ecological impacts compared        monia Monitoring Network, NAMN; Tang et al., 2018a) or
with other N pollutants (Cape et al., 2004; Sutton et al., 1998,   compliance monitoring across Europe in the case of SO2 and
2007). Numerous studies have shown that Nr deposition in           NOx . The UK is unique in having an extensive set of speci-
the vicinity of NH3 sources is dominated by dry NH3 –N de-         ated gas and aerosol monitoring data from the Acid Gas and
position (e.g. Pitcairn et al., 1998; Sheppard et al., 2011),      Aerosol Network (AGANet), with measurements from 1999
with removal of NH3 close to a source controlled by phys-          to the present (Tang et al., 2018b).
ical, chemical, and ecophysiological processes (Flechard et           In this context, there is an ongoing need for cost-effective,
al., 2011; Sutton et al., 2007, 2013). Unlike NOx , HNO3           easy-to-operate, time-integrated atmospheric measurement
(from oxidation of NOx ) is very water-soluble, while NO−     3    for the respective gas and aerosol phases at sufficient spa-
particles can act as cloud condensation nuclei (CCN) so that       tial scales. Such data would help to (1) improve estimates of
they are both scavenged quickly and removed efficiently by         N deposition; (2) contribute to development and validation
precipitation. Since NOx is inefficiently removed by precipi-      of long-range transport models, e.g. EMEP (Simpson et al.,
tation, wet deposition of NOx near a source is small and only      2006) and EMEP4UK (Vieno et al., 2014, 2016b); (3) in-
becomes important after NOx has been converted to HNO3             terpret interactions between the gas and aerosol phases; and
and NO−  3.                                                        (4) interpret ecological responses to nitrogen (e.g. ecosystem
   Because of the large numbers of atmospheric N species           biodiversity or net carbon exchange). To contribute to this
and their complex atmospheric chemistry, quantifying the           goal, a “three-level” measurement strategy in the EU Frame-
deposition of Nr is hugely complex and is a key source of          work Programme 6 Integrated Project “NitroEurope” (NEU;
uncertainty for ecosystem effect assessment (Bobbink et al.,       http://www.nitroeurope.ceh.ac.uk/, last access: 29 July 2020)
2010; Fowler and Reis, 2007; Schrader et al., 2018; Sutton         between 2006 and 2010 delivered a comprehensive inte-
et al., 2007). Input by dry deposition can be estimated us-        grated assessment of the nitrogen cycle, budgets, and fluxes
ing a combination of measured and/or modelled concentra-           for a range of European terrestrial ecosystems (Sutton et al.,
tion fields with high-resolution inferential models (e.g. Smith    2007; Skiba et al., 2009). At the most intensive level (Level
et al., 2000; Flechard et al., 2011) or by making direct flux      3), state-of-the-art instrumentation for high-resolution, con-
measurements (e.g. Fowler et al., 2001; Nemitz et al., 2008).      tinuous measurements at just 13 “flux super sites” provided
Although it is possible to measure Nr deposition directly          detailed understanding on atmospheric and chemical pro-
(e.g. Skiba et al., 2009), the flux measurement techniques         cesses (Skiba et al., 2009). By contrast, manual methods with
are complex and resource-intensive, unsuited to routine mea-       a low temporal frequency (monthly) at the basic level (Level
surements at a large number of sites. The “inferential” mod-       1) provided measurements of Nr components at a large num-
elling approach provides a direct estimation of deposition         ber of sites (> 50 sites) in a cost-efficient way in a pan-
from Nr measurements by applying a land-use-dependent de-          European network (Tang et al., 2009). Key species of interest
position velocity (Vd ) to measured concentrations (Dore et        included NH3 , HNO3 , and ammonium aerosols ((NH4 )2 SO4 ,
al., 2015; Flechard et al., 2011; Simpson et al., 2006; Smith      NH4 NO3 ).
et al., 2000).                                                        In this paper, we present and discuss 4 years of monthly
   At present, there are limited atmospheric measurements          reactive gas (NH3 , HNO3 , HCl) and aerosol (NH+       4 , NO3 ,
                                                                                                                                   −

that speciate the gas- and aerosol-phase components at mul-        SO2−        −     +      2+       2+
                                                                       4 , Cl , Na , Ca , Mg ) measurements from the
tiple sites over several years. On a European scale, atmo-

https://doi.org/10.5194/acp-21-875-2021                                                Atmos. Chem. Phys., 21, 875–914, 2021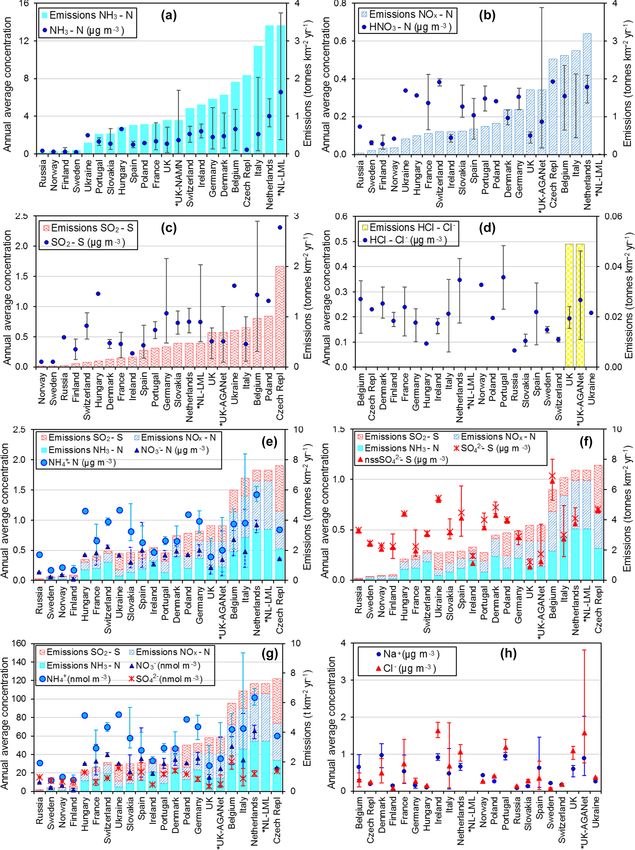
878                               Y. S. Tang et al.: Pan-European rural monitoring network shows dominance of NH3 gas

Level 1 network set up under the NEU integrated project
(Fig. 2). A harmonized measurement approach with a sim-
ple, cost-efficient time-integrated method, applied with high
spatial coverage, allowed a comprehensive assessment across
Europe. The gas and aerosol network was complemented by
2 years of wet-deposition data made at a subset of the sites
(Fig. 3). The intention of the smaller bulk wet-deposition net-
work was two-fold: (i) to provide wet-deposition estimates at
DELTA® (DEnuder for Long-Term Atmospheric sampling)
sites that do not already have such measurements on site
and (ii) to compare the relative importance of reduced and
oxidized N versus sulfur in the atmospheric pollution load.        Figure 1. Reaction scheme for the formation of ammonium aerosols
Measurements across the network were coordinated between           from interaction of NH3 with acid gases HNO3 , SO2 , and HCl,
multiple European laboratories. The measurement approach           showing the components (green) that were measured in the Ni-
and the operations of the networks, including the implemen-        troEurope (NEU) DELTA® network. Dry deposition of the gas
tation of annual inter-comparisons to assess comparability         and aerosol components was estimated by inferential modelling
                                                                   (Flechard et al., 2011), while wet deposition (blue) was measured in
between the laboratories, are described. The data are dis-
                                                                   the NEU bulk wet-deposition network at a subset of the DELTA®
cussed in terms of spatial and temporal variation in con-          sites.
centrations, relative contribution of the inorganic nitrogen
and sulfur components to the inorganic pollution load, and
changes in atmospheric concentrations of acid gases and their      co-located CarboEurope sites (Flechard et al., 2020). Other
interactions with NH3 gas and NH+    4 aerosol.                    measurements made at the Level 1 sites included estimation
                                                                   of wet-deposition fluxes (Sect. 2.3) and also soil and plant
                                                                   bioassays (Schaufler et al., 2010).
2     Methods                                                         Altogether, the DELTA® network covered a wide distri-
                                                                   bution of sites across 20 countries and four major ecosys-
2.1    NEU Level 1 DELTA® network                                  tem types: crops, grassland, semi-natural, and forests. These
                                                                   sites can be described as “rural” and were chosen to provide
The NitroEurope (NEU) Level 1 network was operated be-             a regionally representative estimate of air composition. The
tween November 2006 and December 2010 to deliver the               network site map is shown in Fig. 2, with site details given
core measurements of reactive nitrogen gases (NH3 , HNO3 )         in Table S1 in the Supplement. Further information on the
and aerosols (NH+           −
                     4 , NO3 ) for the project (Fig. 1). A low-    sites are also provided in Flechard et al. (2011). Network
volume denuder filter pack method, the “DEnuder for Long-          establishment started in November 2006, with 57 sites op-
Term Atmospheric sampling” system (DELTA® ; Sutton et              erational from March 2007 onwards. Over the course of the
al., 2001a; Tang et al., 2009, 2018b), with time-integrated        network, some sites closed or were relocated due to infras-
monthly sampling was used, which made implementation               tructure changes, and new sites were also added. A total of 64
at a large number of sites possible. Other acid gases (SO2 ,       sites provided measurements at the end of the project, with
HCl) and aerosols (SO2−         −    +     2+      2+
                          4 , Cl , Na , Ca , Mg ) were also        45 of the sites operational the entire time. In addition, repli-
collected at the same time and measured by the DELTA®              cated DELTA® measurements were made at four sites:
method. DELTA® measurements were co-located with all
NEU Level 3 sites with advanced flux measurements (Skiba             1. Auchencorth Moss parallel (P) (UK-AMoP; NH3 and
et al., 2009) and with the network of main CarboEurope-                 NH+4 measured only);
IP CO2 flux monitoring sites (http://www.carboeurope.org/
                                                                     2. Easter Bush parallel (P) (UK-EBuP; same method as
ceip/, last access: 5 January 2020) (Flechard et al., 2011,
                                                                        main site);
2020). Two of the UK sites in the NEU DELTA® network
are existing UK NAMN (Tang et al., 2018a) and AGANet                 3. SK04 parallel (P) (SK04P; same method as main site);
sites (Tang et al., 2018b). These are Auchencorth Moss (UK-
Amo) and Bush (UK-EBu), located in southern Scotland.                4. Fougéres parallel (P) (FR-FgsP; different sample train
Monthly gas and aerosol data at the two sites, made as part             with 2× NaCl-coated denuders instead of 2× K2 CO3 –
of the UK national networks, were included in the NEU                   glycerol-coated denuders to capture HNO3 ; see
network. NEU network Nr data were used, together with                   Sect. 2.2.3) from February to December 2010 only.
a range of dry-deposition models, to model dry-deposition
fluxes (Flechard et al., 2011) and to assess the influence of Nr
on the C cycle, potential C sequestration, and the greenhouse
gas balance of ecosystems using CO2 exchange data from the

Atmos. Chem. Phys., 21, 875–914, 2021                                                  https://doi.org/10.5194/acp-21-875-2021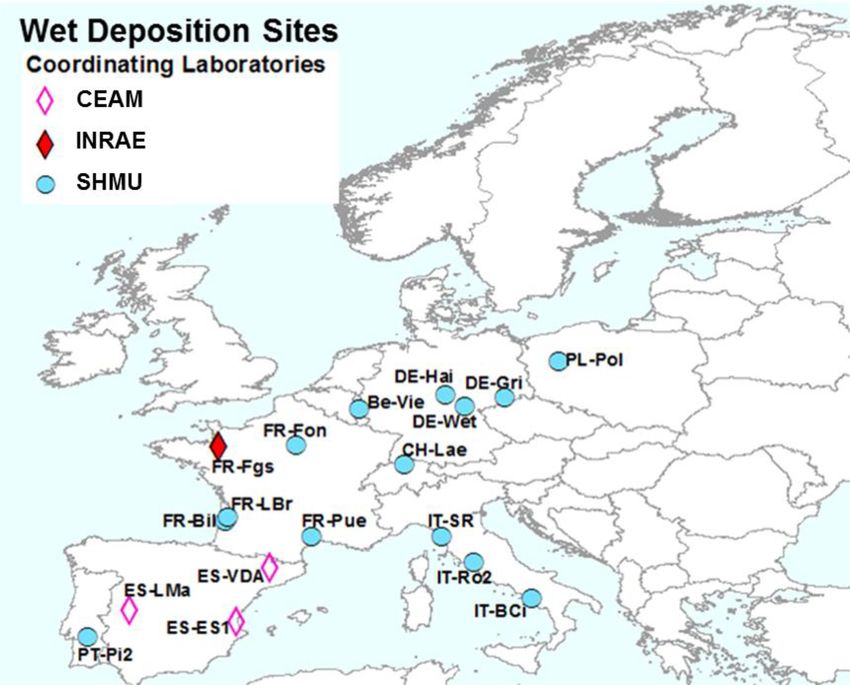
Y. S. Tang et al.: Pan-European rural monitoring network shows dominance of NH3 gas                                                879

Figure 2. NitroEurope (NEU) DELTA® network sites operated between 2006 and 2010. The colour of the symbols indicates the responsible
laboratories: CEAM (the Mediterranean Centre for Environmental Studies), vTI (von Thunen Institut), INRAE (French National Research
Institute for Agriculture, Food and Environment), MHSC (Meteorological and Hydrological Service of Croatia), UKCEH (UK Centre for
Ecology & Hydrology), NILU (Norwegian Institute for Air Research), SHMU (Slovak Hydrometeorological Institute). Ecosystem types
are C (crops), G (grassland), F (forests), and SN (short semi-natural; includes moorland, peatland, shrubland, and unimproved and upland
grassland). Replicated (P: parallel) DELTA measurements are made at four sites: SK04/SK04P; UK-AMo/UK-AMoP (NH3 and NH+         4 only),
UK-Bu/UK-BuP, and FR-Fgs/FR-FgsP (NaCl-coated denuders instead of K2 CO3 –glycerol in sample train).

2.1.1   Coordinating laboratories                                     later in Sect. 3.1 and 3.2). A network of local site opera-
                                                                      tors representing the science teams of each site performed
A team of seven European laboratories shared responsibil-             the monthly sample changes and posted the exposed sam-
ity for running the network. Measurement was on a monthly             ples back to their designated laboratories for analysis. Air
timescale, with each laboratory preparing and analysing the           concentration data were submitted by the laboratories for
monthly samples with documented analytical methods (see               their respective sites in a standard reporting template to
Table S3 for information on analytical methods and limit              UKCEH. Following data checks against defined quality pro-
of detection (LOD)) for between 5 and 16 DELTA sites                  tocols (Tang et al., 2009), the finalized dataset was uploaded
(Fig. 2). The use of a harmonized DELTA® methodology,                 to the NEU database (http://www.nitroeurope.ceh.ac.uk/, last
coupled to defined quality protocols (Tang et al., 2009), en-         access: 29 July 2020). Establishment of the network, in-
sured comparability of data between the laboratories (see             cluding the first year of measurement results on Nr com-

https://doi.org/10.5194/acp-21-875-2021                                                    Atmos. Chem. Phys., 21, 875–914, 2021
880                                Y. S. Tang et al.: Pan-European rural monitoring network shows dominance of NH3 gas

ponents, is reported in Tang et al. (2009). Information on          monthly sample. The volumes of deionized water used to
co-located measurements and agricultural activities at each         extract acid-coated denuders and aerosols filters are 3 and
of the sites was also collected and is accessible from the          4 mL, respectively. For the base-coated denuders and aerosol
NEU website (http://www.nitroeurope.ceh.ac.uk/, last ac-            filters, the extract volume in both cases is 5 mL An example
cess: 29 July 2020).                                                is shown here for calculating the atmospheric concentrations
                                                                    of NH3 (gas) (Eq. 1) and NH+     4 (aerosol) (Eq. 2) from the
2.2     DELTA® methodology                                          aqueous extracts, based on an air volume of 15 m3 collected
                                                                    in a typical month.
The DELTA® method used in the NEU Level 1 network
is based on the system developed for the UK Acid Gas                Gas NH3 (µg m−3 ) =
and Aerosol Monitoring Network (AGANet, Tang et al.,
                                                                    NH+        −1 [sample − blank] · 3 mL ·             17

2018b). Full details of the DELTA® method and air con-                  4 mg L                                          18
                                                                                                                                      (1)
centration calculations in the NEU network are provided by                              15 m3
Tang et al. (2009, 2018b). The method uses a small 6 V air                     +      −3
                                                                    Particle NH4 (µg m ) =
pump to deliver low air-sampling rates of between 0.2 and
                                                                    NH+        −1 sample − blank · 4 mL

0.4 L min−1 , a high-sensitivity gas meter to record the typ-           4 mg L
                                                                                                                                      (2)
ical monthly volume of air collected, and a DELTA® de-                               15 m3
nuder filter pack sample train to collect separately the gas-
                                                                    Pairs of base- and acid-coated denuders are used to collect
and aerosol-phase components. The sample train is made up
                                                                    the acid gases and alkaline NH3 gas, respectively. This allows
of two pairs of base- and acid-impregnated denuders (15 and
                                                                    denuder collection efficiency of, for example, NH3 (Eq. 3) to
10 cm long) to collect acid gases and NH3 , respectively, un-
                                                                    be assessed as part of the data quality assessment process. An
der laminar conditions. A two-stage filter pack with base-
                                                                    imperfect acid coating on the denuders for example can lead
and acid-coated cellulose filters collects the aerosol compo-
                                                                    to lower capture efficiencies (Sutton et al., 2001a; Tang and
nents downstream of the denuders. The base coating used
                                                                    Sutton, 2003).
was K2 CO3 –glycerol, which is effective for the simultane-
ous collection of HNO3 , SO2 , and HCl (Ferm, 1986), while
the acid coating was either citric acid for temperate climates      Denuder collection efficiency, NH3 (%)
or phosphorous acid for Mediterranean climates (Allegrini et                        NH3 (Denuder 1)
                                                                     = 100 ×                                                          (3)
al., 1987; Ferm, 1979; Perrino et al., 1990; Fitz, 2002). In this              NH3 (Denuder 1 + Denuder 2)
way, artefacts between gas- and aerosol-phase concentrations
are minimized (Ferm et al., 1979; Sutton et al., 2001a). The           A correction, based on the collection efficiency, is ap-
DELTA® air inlet has a particle cut-off of ∼ 4.5 µm, which          plied to provide a corrected air concentration (χa (corrected);
means fine-mode aerosols in the PM2.5 fraction and some of          Eq. 4) (Sutton et al., 2001a; Tang et al., 2018a, 2018b). With
the coarse-mode aerosols < PM4.5 will be collected (Tang et         a collection efficiency of 95 %, the correction amounts to
al., 2015).                                                         0.3 % of the corrected air concentration. For an efficiency
   A low-voltage version of the AGANet DELTA® system                below 60 %, the correction amounts to more than 50 % and
was built centrally by UKCEH and sent to each of the Eu-            is not applied. The air concentration (χa ) of NH3 is then de-
ropean sites, where they were installed by local site con-          termined as the sum of NH3 in denuders 1 and 2 (Tang et
tacts. These systems operated on either 6 V (off mains power        al., 2018a). By applying the infinite series correction, the
with a transformer) or 12 V from batteries (wind- and solar-        assumption is that any NH3 (and other gases) that is not
powered). Air sampling was direct from the atmosphere               captured by the denuders will be collected on the down-
without any inlet lines or filters to avoid potential loss of       stream aerosol filter. To avoid double-counting, the estimated
components – in particular HNO3 , which is very “sticky” – to       amount of “NH3 breakthrough” is subtracted from the NH+      4
surfaces. Sampling height was 1.5 m above ground or vegeta-         concentrations on the aerosol filter.
tion in open areas. In forested areas, the DELTA® equipment
was set up either in large clearings or on towers 2–3 m above
the canopy (see Flechard et al., 2011).                                                                             1
                                                                    χa (corrected) = χa (Denuder 1) ·        h                    i   (4)
                                                                                                                 χa (Denuder 2)
                                                                                                        1−       χa (Denuder 1)
2.2.1    Calculation of gas and aerosol concentrations

Atmospheric gas and aerosol concentrations in the DELTA®            2.2.2   Estimating sea salt and non-sea-salt SO2−
                                                                                                                   4
method are calculated from the number of inorganic ions                     (ss-SO2−
                                                                                  4 and nss-SO4 )
                                                                                                 2−
                2−
(NH+      −            −
    4 , NO3 , SO4 , Cl , and base cations) in the denuder
and aerosol aqueous extracts and the volume of air sampled          Sea salt SO2−         2−
                                                                                4 (ss-SO4 ) in aerosol was estimated according
(from gas meter readings), which is typically 15 m3 for a           to Eq. (5), based on the ratio of the mass concentrations of

Atmos. Chem. Phys., 21, 875–914, 2021                                                  https://doi.org/10.5194/acp-21-875-2021
Y. S. Tang et al.: Pan-European rural monitoring network shows dominance of NH3 gas                                            881

SO2−                    +
   4 to the reference Na species in seawater (Keene et al.,
1986; O’Dowd and de Leeuw, 2007).

[ss − SO2−             2− −3
        4 ] (µg ss − SO4 m ) =
 0.25 · [Na+ ] (µgNa+ m−3 )                                (5)

   Non-sea-salt SO2−       2−
                  4 (nss-SO4 ) was then derived as the
difference between total measured SO2−
                                     4   and ss-SO2−4
(Eq. 6).

[nss − SO2−            2− −3
         4 ](µg ss − SO4 m ) =
[SO2−        2− −3         2−            2− −3
   4 ] (µg SO4 m ) − [ss_SO4 ](µg ss − SO4 m ) (6)

2.2.3    Artefact in HNO3 determination

Results from the first DELTA® inter-comparison in the NEU
network (Tang et al., 2009) (see also Sect. 2.5) and further      Figure 3. NitroEurope (NEU) bulk wet-deposition network sites
work by Tang et al. (2015, 2018b) have shown that HNO3            operated between 2008 and 2010. The colour of the symbols indi-
concentrations may be overestimated on the carbonate-             cates the responsible laboratories: CEAM (the Mediterranean Cen-
coated denuders used due to co-collection of other oxidized       tre for Environmental Studies), INRAE (French National Research
                                                                  Institute for Agriculture, Food and Environment), and SHMU (Slo-
nitrogen components, most likely from nitrous acid (HONO).
                                                                  vak Hydrometeorological Institute).
In the UK AGANet, HNO3 data are corrected with an em-
pirical factor of 0.45 derived by Tang et al. (2015). Since
the correction factor for HNO3 is uncertain (estimated to be
                                                                  data, with a further 6 sites providing 1 year of monthly data
±30 %) and derived for UK conditions, no attempt has been
                                                                  between 2008 and October 2010, when measurements ended.
made to correct the HNO3 data from the NEU network. The
                                                                     The type of bulk precipitation collector used was a
DELTA® method remained unchanged throughout the entire
                                                                  Rotenkamp sampler (Dämmgen et al., 2005), mounted 1.5 m
network operation and provided a consistent set of measure-
                                                                  above ground, or in the case of forest sites, either in clearings
ments by the same protocol. The caveat is that the HNO3
                                                                  or above the canopy. Each unit has two collectors providing
data presented in this paper also include an unknown frac-
                                                                  replicated samples, comprising a pyrex glass funnel (aper-
tion of oxidized N, most probably HONO, and therefore rep-
                                                                  ture area = 84.9 cm2 ) with vertical sides, connected directly
resent an upper limit in the determination of HNO3 . Contri-
                                                                  to a 3 L collection bottle (material: low-density polyethy-
bution from NO2 is likely to be small since this is collected
                                                                  lene), which was changed monthly. Thymol (5-methyl-2-(1-
with a low efficiency on carbonate-coated denuders (Bai et
                                                                  methylethyl)phenol) (150 mg) was added as a biocide (Cape
al., 2003; Tang et al., 2015), and the network sites are rural,
                                                                  et al., 2012) to a clean, dry pre-weighed bottle at the start
where NOx concentrations are expected to be in the low parts
                                                                  of each collection period. This provided a minimum thymol
per billion. At the French Fougéres parallel site (FR-FgsP),
                                                                  concentration of 50 mg L−1 for a full bottle to preserve the
NaCl-coated denuders were used to measure HNO3 to com-
                                                                  sample against biological degradation of labile nitrogen com-
pare with results from K2 CO3 –glycerol-coated denuders at
                                                                  pounds during the month-long sampling.
the main site (FR-Fgs) (see Sect. 2.1 for methodology and
                                                                     Three European laboratories shared management and
Sect. 3.3.1 for data inter-comparison).
                                                                  chemical analysis for the network (Fig. 3). The laboratories
2.3     NEU bulk wet-deposition network                           were CEAM (all three Spanish sites); INRAE (French Renon
                                                                  site); and SHMU, designated the main laboratory responsible
The NEU bulk wet-deposition network (Fig. 3, Table S2)            for all other sites. A full suite of precipitation chemistry anal-
was established to provide wet-deposition data on NH+             yses were carried out that included pH, conductivity, NH+      4,
                                                             4
                                                                             2−       3−
and NO−  3 . It was set up 2 years after the establishment of     NO− 3 , SO 4  , PO  4  , Cl − , Na+ , K+ , Ca2+ , and Mg2+ . Rain

the NEU DELTA® network, with sites located at a sub-              volumes and precipitation chemistry data were submitted in a
set of DELTA® sites that did not already have on-site wet-        standard template to UKCEH for checking and then uploaded
deposition measurements. Sampling commenced at some               to the NEU database (http://www.nitroeurope.ceh.ac.uk/, last
sites in January 2008, with 14 sites operational from March       access: 29 July 2020). Samples with high P (> 1 µg L−1
2008. Site changes also occurred during the operation of this     PO3−              +               +
                                                                      4 ), high K , and/or NH4 values that are indicative of
network, again with some site closures and new site addi-         bird contamination were rejected. Annual wet deposition
tions over time. In total, 12 sites provided 2 years of monthly   (e.g. kg N ha−1 yr−1 ) was estimated from the product of the

https://doi.org/10.5194/acp-21-875-2021                                               Atmos. Chem. Phys., 21, 875–914, 2021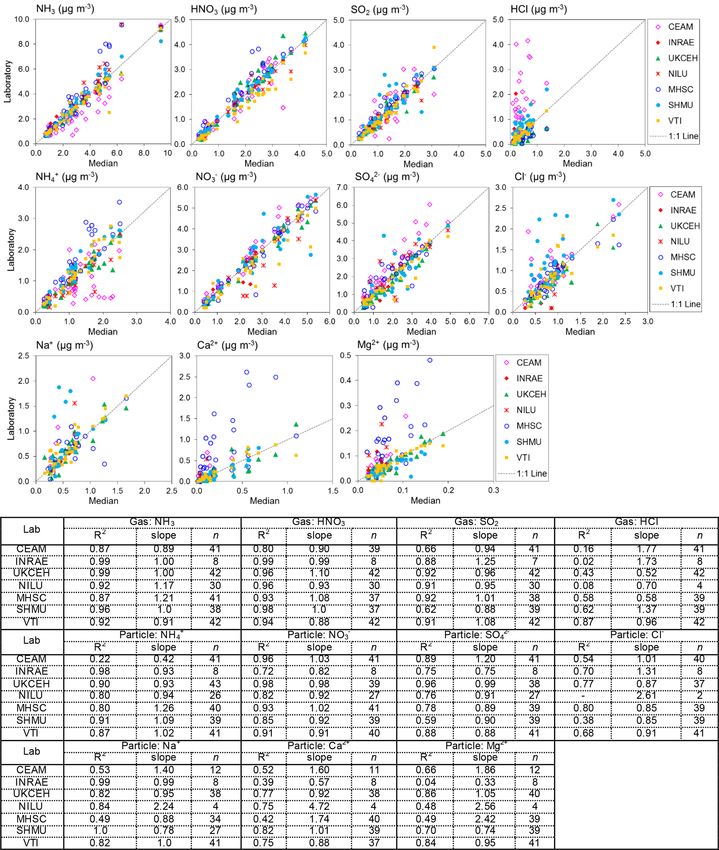
882                               Y. S. Tang et al.: Pan-European rural monitoring network shows dominance of NH3 gas

species concentrations and rain volume. Determinations of          able for all other 18 countries in the NEU network from the
organic N were also carried out on some of the rain samples        European Environment Agency (EEA) website (EEA, 2020).
in a separate investigation reported by Cape et al. (2012).        Emissions data for the period 2007 to 2010 were extracted,
                                                                   and the emission densities of each gas (t km−2 yr−1 ) in each
2.4   Laboratory inter-comparisons: chemical analysis              country were derived by dividing the 4-year-averaged total
                                                                   emissions by the land area (km2 ). Gridded emissions data
All laboratories in the DELTA® and bulk wet-deposition             (at 0.1◦ × 0.1◦ resolution) for SO2 , NOx , and NH3 are avail-
networks participated in water chemistry proficiency testing       able from the EMEP emissions database (EMEP, 2020). The
(PT) schemes in their own countries as well as the EMEP            0.1◦ × 0.1◦ gridded data for the period 2007 to 2010 were
(once annually; http://www.emep.int, last access: 8 Febru-         downloaded and were used to estimate national total emis-
ary 2010) and/or WMO-GAW (twice annually; http://www.              sions (sum of all grid squares in each country) and 4-year-
qasac-americas.org, last access: 12 January 2020) laboratory       averaged emission densities (t km−2 yr−1 ) for Russia and
inter-comparison schemes. PT samples for analysis are syn-         Ukraine. As a check, total emissions for the other 18 coun-
thetic precipitation samples for determination of pH, conduc-      tries were also calculated by this method and were the same
tivity, and all the major inorganic ions at trace levels. In ad-   as the national emission totals reported by the EEA (EEA,
dition, UKCEH also organized an annual PT scheme for the           2019).
duration of the project (NEU-PT) to compare laboratory per-
formance in the analysis of inorganic ions at higher concen-       2.7     National air quality network data from the
trations relevant for DELTA® measurements. This comprised                  Netherlands and UK
the distribution of reference solutions containing known con-
centrations of ions that were analysed by the laboratories as      2.7.1    Dutch LML network data
part of their routine analytical procedures.
                                                                   Atmospheric NH3 has been monitored at eight sites in the
2.5   Field inter-comparisons: DELTA measurements
                                                                   Dutch national air quality monitoring network (LML, Lan-
Prior to the NEU DELTA® network establishment, a work-             delijk Meetnet Luchtkwaliteitl) since 1993 (van Zanten et
shop was held to provide training to participating laboratories    al., 2017). The low-density, high-time-resolution LML net-
on sample preparation and analysis. This was followed by a         work is complemented by a high-density monthly diffusion
4-month inter-comparison exercise (July to October 2006)           tube network, the Measuring Ammonia in Nature (MAN)
between six laboratories at four test sites (Montelibretti,        network (http://man.rivm.nl, last access: 6 November 2018)
Italy; Braunschweig, Germany; Paterna, Spain, and Auchen-          (Lolkema et al., 2015). The MAN network has 136 mon-
corth, UK). Results of the inter-comparison on Nr compo-           itoring locations sited within nature reserves and includes
nents were reported by Tang et al. (2009), which demon-            60 Natura 2000 sites, with concentrations ranging between
strated good agreement under contrasting climatic conditions       1.0 and 14 µg m−3 (Lolkema et al., 2015). The focus of the
and atmospheric concentrations of the Nr gases and aerosols.       MAN network is to provide site-based NH3 concentrations
The first DELTA® inter-comparison allowed the new labora-          for the nature conservation sites rather than a representa-
tories to gain experience in making measurements and was           tive spatial-concentration field for the country. Hourly NH3
an extremely useful exercise to check how the whole sys-           and SO2 data which were also available from the eight sites
tem works, starting with coating of denuders and filters and       in the LML network were downloaded from the Rijksinsti-
DELTA® train preparation, sample exchange via post, sam-           tuut voor Volksgezondheid en Milieu (RIVM, the Dutch Na-
ple handling, and inter-comparing laboratory analytical per-       tional Institute for Public Health and the Environment) web-
formance. Further DELTA® inter-comparisons between lab-            site (http://www.lml.rivm.nl/gevalideerd/index.php, last ac-
oratories were conducted each year for the duration of the         cess: 6 November 2018). The 4-year-averaged NH3 and SO2
project, details of which are summarized in Table 1. At each       concentrations for the period 2007 to 2010 were calculated
test site, DELTA® systems were randomly assigned to each           and used to complement measurement data from the four
of the participating laboratories. All laboratories provided       Dutch sites in the NEU DELTA® network.
DELTA® sampling trains for each of the inter-comparison
sites and carried out chemical analysis on the returned ex-        2.7.2    UK NAMN and AGANet network data
posed samples. Measurement results were returned in a stan-
dard template to UKCEH, the central coordinating laboratory        Atmospheric NH3 , acid gases, and aerosols are measured in
for collation and analysis.                                        the UK NAMN (since 1996) and AGANet (since 1999) (Tang
                                                                   et al., 2018a, b). The UK approach is a high-density network
2.6   European emissions data                                      with low-time-resolution (monthly) measurements, combin-
                                                                   ing an implementation of the DELTA® method used in the
With the exception of Russia and Ukraine, official reported        present NEU DELTA® network and a passive ALPHA®
national emissions data on SO2 , NOx , and NH3 are avail-          method (Tang et al., 2001) to increase network coverage

Atmos. Chem. Phys., 21, 875–914, 2021                                                 https://doi.org/10.5194/acp-21-875-2021
Y. S. Tang et al.: Pan-European rural monitoring network shows dominance of NH3 gas                                            883

Table 1. Details of annual NitroEurope (NEU) DELTA® field inter-comparisons conducted between 2006 and 2010.

            Inter-comparison period   Test sites                      Participating laboratories    Number of monthly
                                                                                                   measurement periods
            2006 (Jul–Oct)            Auchencorth, UK                 6                                                4
                                      Braunschweig, Germany
                                      Montelibretti, Italy
                                      Paterna, Spain
            2007 (Jul–Aug)            Auchencorth, UK                 6                                                2
                                      Montelibretti, Italy
            2008 (Apr–May)            Auchencorth, UK                 7 (INRAE: new laboratory)                        2
                                      Braunschweig, Germany
            2009 (Nov–Dec)            Auchencorth, UK                 7 (INRAE: new laboratory)                        2
                                      Montelibretti, Italy

in NH3 measurements (Sutton et al., 2001b; Tang et al.,            ence were 81 % and 86 %, respectively, across the full range
2018a). Monthly and annual data for the overlapping pe-            of PT concentrations. At concentrations above 1 mg L−1 , the
riod of the project were extracted from the UK-AIR website         agreement improved and increased to 89 % for Na+ and 96 %
(https://uk-air.defra.gov.uk/, last access: 25 November 2019)      for Cl− . A larger spread around the reference values was
and nested with the NEU network data for analysis in this          provided for the base cations Ca2+ and Mg2+ at low con-
paper.                                                             centrations (< 1 mg L−1 ). The percentage of results passing
                                                                   at low concentrations below 1 mg L−1 was 36 % (Ca2+ ) and
                                                                   59 % (Mg2+ ), increasing to 80 % (Ca2+ ) and 90 % (Mg2+ )
3     Results and discussion                                       above 1 mg L−1 . The larger scatter at low concentrations is
                                                                   likely due to uncertainty in the chemical analysis at or close
3.1    Laboratory inter-comparison results: chemical               to the method limit of detection and reflects challenges of
       analysis                                                    measuring base cations, in particular Ca2+ as this is very
                                                                   “sticky” and adsorbs–desorbs from surfaces, leading to an-
Figure 4 compares the percentage deviation of results from
                                                                   alytical artefacts.
reference solution concentrations (“true value”) reported
                                                                      To show what the PT reference solution concentrations
by the laboratories for different chemical components in
                                                                   would correspond to if they were a denuder and/or aerosol
the EMEP, WMO-GAW, and NEU proficiency testing (PT)
                                                                   extract, equivalent gas (Eq. 1) and/or aerosol concentrations
schemes, combined from 2006 to 2010. Each data point is
                                                                   (Eq. 2) (Sect. 2.2.1) are calculated for each of the ions and
colour-coded in the graphs according to the laboratory pro-
                                                                   provided in the summary table in Fig. 4. A 0.5 mg L−1 NH+      4
viding the measurements.
                                                                   solution, for example, is equivalent to an atmospheric con-
   Altogether, results from the combined PT schemes pro-
                                                                   centration of 0.09 µg NH3 m−3 (gas) or 0.13 µg NH+        4 m
                                                                                                                                 −3
duced > 100 observations for each reported chemical com-
                                                                   (aerosol) for a monthly sample. In Fig. 5, scatterplots are
ponent over the 4-year period. The performances of labora-
                                                                   shown comparing all NEU laboratory-reported results with
tories in Fig. 4 can be summarized in terms of the percentage
                                                                   PT reference, where all ion concentrations (mg L−1 ) from
of reported results agreeing within 10 % of the true values
                                                                   Fig. 4 have been converted to equivalent gas and aerosol
(see summary table below Fig. 4), where the true values rep-
                                                                   concentrations (µg m−3 ), based on a typical volume of 15 m3
resent the nominal concentrations in the aqueous test solu-
                                                                   over a month. With the exception of a small number of out-
tions. The best agreements were for SO2−                −
                                             4 and NO3 , with      liers, most data points are close to the 1 : 1 line, with labora-
an average of 92 % and 87 % of all reported results agreeing
                                                                   tory results agreeing within ±0.05 µg m−3 in equivalent gas
within 10 % of the true value across the concentration range
                                                                   and/or aerosol concentrations. These are low ambient con-
covered in the PT schemes. In the case of NH+   4 , while an av-   centrations and show that the measurement uncertainty in the
erage of 90 % of reported results were within 10 % of the ref-
                                                                   analysis of very low concentrations in the PT schemes will be
erence at 1 mg L−1 NH+   4 , laboratory performance was poorer     small for the majority of sites in the network, where concen-
(68 % agreeing within 10 %) at lower concentrations (0.1–
                                                                   trations were found to be much higher (see Fig. 6).
0.9 mg L−1 ). Poorer performance at the low concentrations
was largely due to two laboratories (CEAM and SHMU),
with > 50 % of their results reading high. For Na+ and Cl− ,
the percentages of results agreeing within 10 % of the refer-

https://doi.org/10.5194/acp-21-875-2021                                                 Atmos. Chem. Phys., 21, 875–914, 2021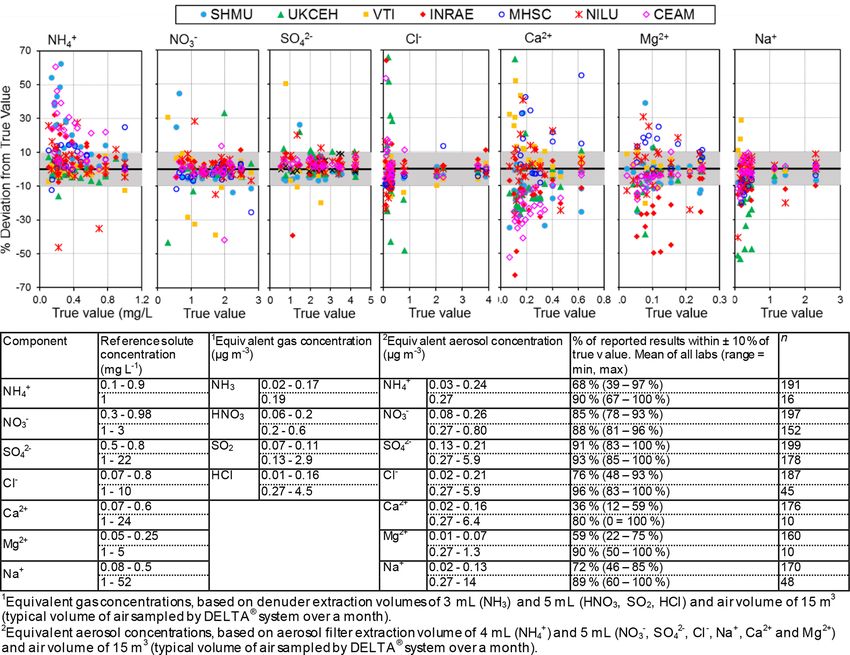
884                                Y. S. Tang et al.: Pan-European rural monitoring network shows dominance of NH3 gas

Figure 4. Summary of reported results from all laboratories in chemistry proficiency testing (PT) schemes for chemical analysis of aqueous
inorganic ions (2006–2010: EMEP, WMO-GAW, and NitroEurope), expressed as a percentage deviation from the true value (PT reference
solutions). The grey shaded areas in the graphs show values that are within ±10 % of true value.

3.2   Field inter-comparison results: DELTA®                           ual outliers, the mean concentrations from each of the seven
      measurements                                                     laboratories for each of the four field sites were calculated
                                                                       and compared with averaged median estimates of all labo-
Results from 4 years of annual DELTA® field inter-                     ratories for each site. A summary of the mean concentra-
comparisons (2006–2009), for all field sites, are combined             tions and the percentage difference from the median is pre-
and summarized in Fig. 6. The gas and aerosol concentra-               sented in Table 2. Since the INRAE laboratory did not join
tions measured and reported by each of the laboratories are            the NEU network until 2008, averaged median values from
compared with the median estimate of all laboratories in each          the 2008 and 2009 inter-comparisons are used to compare
of the scatterplots, with the colour of the symbols identifying        with the INRAE results, included in the table for clarity.
the laboratory providing the measurements. Regression re-              The mean concentrations between laboratories are broadly
sults (slope and R 2 ) in the table below the plots provide the        comparable. Each of the laboratories were also able to re-
main features of the inter-comparison. The slope is equiv-             solve the main differences in mean concentrations at the four
alent to the mean ratio of each laboratory against the me-             field sites, ranging from the lowest concentrations at Auchen-
dian value, where values close to unity indicate closer agree-         corth (e.g. median = 1.4 µg NH3 m−3 ) to higher concentra-
ment to the median value. Overall, the scatterplots show good          tions, representing a more polluted site at Paterna (e.g. me-
agreement between the laboratories, with some laboratories             dian = 5.2 µg NH3 m−3 ) for the test periods (Table 2). Larger
showing very close agreement to the median estimates and               differences for HCl, Ca2+ , and Mg2+ are due to clear outliers
more scatter observed from the others.                                 from one or two laboratories at the very low concentrations
   The occurrence of outliers in some of the individual                of these species encountered and may be related to measure-
monthly values indicates that caution needs to be exer-                ment uncertainties at the low air concentrations. The compa-
cised in the interpretation of these data points in the inter-
comparison. To average out the influence of a few individ-

Atmos. Chem. Phys., 21, 875–914, 2021                                                      https://doi.org/10.5194/acp-21-875-2021
Y. S. Tang et al.: Pan-European rural monitoring network shows dominance of NH3 gas 885
Figure 5. Scatterplots comparing all NEU laboratory-reported results from wet chemistry proficiency testing (PT) schemes (2006–2010:
EMEP, WMO-GAW, and NitroEurope) vs. true values (PT reference solutions). All aqueous ion concentrations (mg L−1 ) from Fig. 4 are
converted to equivalent gas and aerosol concentrations (µg m−3 ) for the comparisons.
rability between laboratories for each of the components is laboratory blanks reported by MHSC for aerosol NH+ 4 were
next considered in turn. low (mean = 0.48 µg NH+ 4 ) and smaller than other laborato-
ries (mean = 0.64–1.20 µg NH+ 4 ) (Fig. S2), their field blanks
3.2.1 Inter-comparisons: NH3 , NH+ −
4 , HNO3 , NO3 in the 2006 DELTA inter-comparison exercise were on aver-
age 5.5 times larger than the laboratory blanks. This is likely
The best agreement between laboratories was for the Nr due to extensive delays in getting samples released from cus-
gases (NH3 , HNO3 ) and aerosol species (NH+ −
4 , NO3 ), with toms in Slovakia at the start of the network. Another possibil-
slopes within ±10 % of the median values and R > 0.9 in 2
ity is a breakthrough of NH3 from the acid-coated denuders
the regression analysis from five of the laboratories (Fig. 6, onto the aerosol filters. The denuder collection efficiency of
Table 2). This is important since Nr species were the primary NH3 gas (Eq. 3, Sect. 2.2.1) reported by MHSC was on aver-
focus for the NEU DELTA® network. Slightly poorer agree- age 88 % for all years and 91 % where 2006 data have been
ment for NH3 and NH+ 4 was provided by CEAM and MHSC excluded (Table S3). This is comparable with the mean col-
laboratories, with data points both above and below the 1 : 1 lection efficiencies of all laboratories (91 % and 90 %) (Ta-
line (Fig. 6). The outliers above the 1 : 1 line from MHSC ble S4), which makes NH3 breakthrough an unlikely expla-
were from the 2006 inter-comparison exercise. Removal of nation for the higher readings. The assessment of NH+ 4 is
these 2006 outliers improved the MHSC regression slope however more uncertain from the reduced number of data
for NH3 from 1.21 (R 2 = 0.87, n = 41) to 0.99 (R 2 = 0.99, points (n = 10).
n = 10) (Fig. S1). While this seems to suggest that the perfor- For the CEAM laboratory, reported NH3 concentrations
mance of MHSC for NH3 improved following the first inter- were on average 16 % lower (n = 41) than the median, with
comparison exercise, the regression slope for aerosol NH+ a slope of 0.89 (R 2 = 0.87), and particulate NH+
4 4 was on av-
increased instead from a slope of 1.26 (R 2 = 0.83, n = 41) erage 13 % lower (n = 41) than the median, with a slope of
to 1.48 (R 2 = 0.93, n = 10), suggesting an overestimation 0.42 (R 2 = 0.22) (Fig. 6). A need to improve the NH+ 4 analy-
of NH+ 4 concentrations (Fig. S1). A possible cause may be sis (indophenol colorimetric assay) in the acid-coated denud-
the quality and/or variability in the aerosol filter blank values ers and aerosol filters by the CEAM laboratory was identi-
for NH+ 4 as laboratory blanks are subtracted from exposed fied from the 2006 inter-comparison (Tang et al., 2009). The
samples to estimate aerosol NH+ 4 concentrations. While the
https://doi.org/10.5194/acp-21-875-2021 Atmos. Chem. Phys., 21, 875–914, 2021886 Y. S. Tang et al.: Pan-European rural monitoring network shows dominance of NH3 gas
Table 2. Inter-comparison of results from seven European laboratories at four different field test sites for all years (2006–2010). The results
shown are the mean concentrations from each laboratory for each site and the averaged median estimates derived from all laboratories for
each site.
Site Median CEAM % diff UKCEH % diff MHSC % diff NILU % diff SHMU % diff vTI % diff ∗ Median *INRAE ∗ % diff
(all years) (2008/09)
NH3
Auchencorth 1.42 1.23 −13 1.39 −2 1.51 6 1.60 13 1.48 4 1.38 −2 1.06 1.17 10
Braunschweig 4.32 3.61 −16 4.34 0 4.62 7 4.87 13 4.27 −1 4.41 2 6.40 6.64 4
Montelibretti 2.46 1.66 −33 2.44 −1 2.89 18 2.77 12 2.63 7 2.34 −5 1.91 1.91 0
Paterna 5.21 4.39 −16 5.27 1 7.00 34 6.22 19 5.55 7 4.57 −12
NH+
4
Auchencorth 0.73 0.69 −6 0.64 −13 0.92 26 0.73 0 0.96 31 0.74 2 0.58 0.60 2
Braunschweig 1.55 1.54 −1 1.61 4 2.15 39 1.18 −24 1.64 6 1.45 −6 1.38 1.31 −5
Montelibretti 0.95 0.87 −9 0.86 −9 1.21 27 0.72 −24 1.13 19 0.93 −3 0.96 0.96 0
Paterna 1.80 0.50 −72 1.56 −13 2.12 18 1.64 −9 2.04 13 2.26 25
HNO3
Auchencorth 0.57 0.57 −1 0.53 −7 0.69 21 0.62 9 0.59 3 0.49 −15 0.55 0.59 7
Braunschweig 2.36 1.79 −24 2.82 19 2.67 13 2.43 3 2.48 5 2.09 −11 2.85 2.85 0
Montelibretti 2.64 2.53 −4 2.74 4 3.08 17 2.60 −2 2.77 5 2.31 −13 1.70 1.70 0
Paterna 2.67 2.82 6 2.73 2 3.18 19 2.61 −2 2.40 −10 2.05 −23
NO−
3
Auchencorth 1.21 1.24 3 1.18 −2 1.16 −4 1.27 4 1.20 −1 1.18 −3 1.26 1.14 −9
Braunschweig 3.26 3.70 14 3.43 5 3.33 2 2.28 −30 3.09 −5 2.36 −28 2.92 2.94 1
Montelibretti 1.81 2.00 10 1.84 1 1.57 −13 1.28 −29 1.91 5 1.56 −14 2.11 2.11 0
Paterna 4.52 4.73 5 4.34 −4 4.60 2 4.34 −4 4.57 1 4.32 −4
SO2
Auchencorth 0.95 0.91 −4 0.88 −7 0.99 4 1.10 15 0.91 −4 1.05 10 0.93 1.21 30
Braunschweig 1.49 1.33 −11 1.49 0 1.65 10 1.32 −12 1.41 −5 1.45 −3 1.05 1.17 11
Montelibretti 1.12 1.29 15 1.15 2 1.48 31 0.94 −16 1.45 29 0.99 −12 0.54 0.54 0
Paterna 1.96 2.07 6 1.96 0 2.04 4 1.93 −2 1.99 2 1.78 −9
SO2−
4
Auchencorth 1.04 1.21 17 0.80 −23 1.14 10 1.66 60 1.23 19 0.97 −7 0.82 0.58 −29
Braunschweig 2.04 2.67 31 2.12 4 2.35 15 1.58 −22 1.72 −16 1.51 −26 1.61 1.37 −15
Montelibretti 1.55 1.89 22 1.35 −13 1.61 4 1.49 −4 1.79 16 1.43 −8 0.83 0.83 0
Paterna 3.28 4.19 28 3.06 −7 3.06 −7 3.68 12 3.01 −8 3.21 −2
HCl
Auchencorth 0.20 1.01 396 0.19 −9 0.15 −28 0.21 4 0.33 62 0.19 −6 0.22 0.74 244
Braunschweig 0.39 1.35 247 0.22 −43 0.16 −59 0.08 −78 0.63 62 0.35 −9 0.16 0.10 −37
Montelibretti 0.40 1.01 151 0.33 −18 0.40 −1 – – 0.58 45 0.36 −11 0.54 0.54 0
Paterna 0.73 1.77 141 0.42 −42 0.47 −36 – – 1.32 80 0.81 10
Cl−
Auchencorth 0.84 0.93 10 0.73 −13 0.86 3 0.26 −69 1.17 39 0.85 1 0.95 0.81 −15
Braunschweig 0.52 0.78 51 0.35 −32 0.57 10 – – 0.81 56 0.36 −30 0.33 0.21 −39
Montelibretti 0.85 0.94 11 0.76 −11 0.84 −1 – – 1.19 41 0.86 1 0.66 0.66 0
Paterna 1.37 1.74 27 1.11 −19 1.31 −5 – – 2.10 54 1.06 −23
Na+
Auchencorth 0.53 0.79 47 0.55 2 0.60 13 1.25 134 0.68 28 0.56 5 0.65 0.57 −11
Braunschweig 0.37 0.38 4 0.21 −43 0.37 1 0.24 −34 0.85 131 0.37 1 0.27 0.19 −29
Montelibretti 0.59 0.99 67 0.62 4 0.70 18 – – 0.84 42 0.59 −1 0.51 0.51 0
Paterna 0.94 – – 1.01 7 0.71 −25 – – 0.94 −1 0.95 1
Ca2+
Auchencorth 0.06 0.06 −5 0.06 −11 0.32 415 0.15 137 0.05 −27 0.06 −12 0.03 0.04 38
Braunschweig 0.16 0.07 −57 0.14 −15 0.61 272 0.36 122 0.09 −47 0.11 −34 0.07 0.08 15
Montelibretti 0.16 0.54 241 0.16 −1 0.45 183 – – 0.15 −4 0.16 2 0.08 0.08 0
Paterna 0.64 – – 0.53 −17 1.69 163 – – 0.49 −24 0.57 −12
Mg2+
Auchencorth 0.05 0.07 27 0.05 −3 0.14 172 0.18 251 0.05 −6 0.05 −8 0.05 0.09 65
Braunschweig 0.05 0.03 −33 0.04 −26 0.10 114 0.08 61 0.03 −35 0.02 −56 0.02 0.04 77
Montelibretti 0.06 0.13 113 0.06 −2 0.18 185 – – 0.05 −13 0.06 2 0.04 0.04 0
Paterna 0.13 – – 0.13 −4 0.33 147 – – 0.10 −24 0.13 −2
Atmos. Chem. Phys., 21, 875–914, 2021 https://doi.org/10.5194/acp-21-875-2021Y. S. Tang et al.: Pan-European rural monitoring network shows dominance of NH3 gas 887
2−
Figure 6. Scatterplots comparing atmospheric gas (NH3 , HNO3 , SO2 , and HCl) and aerosol (NH+ − − + 2+
4 , NO3 , SO4 , Cl , Na , Ca , Mg )
2+
concentrations measured by each of the NEU laboratories with the median estimate of all laboratories. Data from all field inter-comparisons
(2006–2009) for all test sites (Auchencorth, UK; Braunschweig, Germany; Montelibretti, Italy; and Paterna, Spain) are combined in the
analysis. A summary of the regression results is shown in the table below the graphs. Note that (i) there are fewer data points for INRAE
because they joined the NEU network later in 2007 and participated in the 2008 and 2009 inter-comparisons only, and (ii) the low number of
observations in some cases was due to some laboratories not reporting all parameters. NILU: HCl, Cl− + 2+ 2+ reported for
, Na , Ca , and Mg
+ 2+ 2+
2008 inter-comparisons only; CEAM: Na , Ca , Mg reported for 2007–2009 inter-comparisons only.
indophenol method for aqueous NH+ 4 determination is pH- be underestimated if the pH of the indophenol reaction has
sensitive. Calibration solutions and quality control checks not been adjusted for the increased acidity in the sample ex-
for the colorimetric assays are made up in deionized water tracts. When the 2006 data are excluded from the regres-
(pH 7), whereas the aqueous extracts from the DELTA® acid- sion analysis, the slopes for NH3 and NH+ 4 increased to 1.02
coated denuders and cellulose filters are acidic (pH ∼ 3). De- (R 2 = 0.94, n = 12) and 0.98 (R 2 = 0.51, n = 12), respec-
termination of NH+ 4 in the denuder extracts may therefore tively (Fig. S1). The improved agreement with other lab-
https://doi.org/10.5194/acp-21-875-2021 Atmos. Chem. Phys., 21, 875–914, 2021You can also read