Ice content and interannual water storage changes of an active rock glacier in the dry Andes of Argentina - The Cryosphere
←
→
Page content transcription
If your browser does not render page correctly, please read the page content below
The Cryosphere, 15, 1187–1213, 2021
https://doi.org/10.5194/tc-15-1187-2021
© Author(s) 2021. This work is distributed under
the Creative Commons Attribution 4.0 License.

Ice content and interannual water storage changes of an
active rock glacier in the dry Andes of Argentina
Christian Halla1 , Jan Henrik Blöthe2 , Carla Tapia Baldis3 , Dario Trombotto Liaudat3 , Christin Hilbich4 ,
Christian Hauck4 , and Lothar Schrott1
1 Department    of Geography, University of Bonn, 53115 Bonn, Germany
2 Institute of Environmental Social Sciences and Geography, University of Freiburg, 79085 Freiburg, Germany
3 Instituto Argentino de Nivología, Glaciología y Ciencias Ambientales, CCT CONICET, 5500 Mendoza, Argentina
4 Department of Geosciences, University of Fribourg, 1700 Fribourg, Switzerland

Correspondence: Christian Halla (chris.halla@uni-bonn.de)

Received: 22 January 2020 – Discussion started: 18 March 2020
Revised: 8 October 2020 – Accepted: 14 January 2021 – Published: 3 March 2021

Abstract. The quantification of volumetric ice and water         sents an important long-term ice reservoir, as do other ground
content in active rock glaciers is necessary to estimate their   ice deposits in the vicinity, if compared to surface ice that
role as water stores and contributors to runoff in dry moun-     covers less than 3 % of the high mountain catchment.
tain catchments. In the semi-arid to arid Andes of Argentina,
active rock glaciers potentially constitute important water
reservoirs due to their widespread distribution. Here how-
ever, water storage capacities and their interannual changes
have so far escaped quantification in detailed field studies.    1   Introduction
Volumetric ice and water content was quantified using a
petrophysical four-phase model (4PM) based on complemen-         Presently moving rock glaciers are classified as active rock
tary electrical resistivity tomography (ERT) and seismic re-     glaciers (Barsch, 1996) defined as the “the visible expression
fraction tomography (SRT) in different positions of the Dos      of cumulative deformation by long-term creep of ice/debris
Lenguas rock glacier in the upper Agua Negra basin, Ar-          mixtures under permafrost conditions” (Berthling, 2011,
gentina. We derived vertical and horizontal surface changes      p. 105). Rock glaciers constitute predominant landforms in
of the Dos Lenguas rock glacier, for the periods 2016–2017       the extensive periglacial belts of arid high mountain regions,
and 2017–2018 using drone-derived digital elevation models       such as the Central Andes of Argentina and Chile (Corte,
(DEMs). Interannual water storage changes of −36 mm yr−1         1976; Trombotto et al., 1999). Here, rock glaciers show some
and +27 mm yr−1 derived from volumetric surface changes          of the highest spatial densities worldwide (Azocar and Bren-
for the periods 2016–2017 and 2017–2018, respectively, in-       ning, 2010; Blöthe et al., 2019), covering more surface area
dicate that significant amounts of annual precipitation can be   than glaciers in some parts (IANIGLA, 2018).
stored in and released from the active rock glacier.                Rock glaciers have been identified and discussed as sig-
   Geophysical results show heterogeneous ice and water          nificant water reservoirs in the dry Andes due to their
content with ice-rich permafrost and supra-, intra- and sub-     widespread distribution (Arenson and Jakob, 2010; Bren-
permafrost water pathways at the end of the thaw period. Ac-     ning, 2010; Corte, 1976, 1978). Recently, first-order assess-
tive layer and ice-rich permafrost control traps and pathways    ments of their water storage capacities suggest that signifi-
of shallow groundwater and thus regulate interannual stor-       cant amounts of ice are stored in rock glaciers (Jones et al.,
age changes and water releases from the active rock glaciers     2018a). However, field-based studies that rigorously quan-
in the dry mountain catchment. The ice content of 1.7–           tify rock glacier water storage capacities and their interan-
2.0 × 10⁹ kg in the active Dos Lenguas rock glacier repre-       nual changes are lacking in the region (Schaffer et al., 2019).
                                                                 In this study we investigate the water storage capacities of a

Published by Copernicus Publications on behalf of the European Geosciences Union.
1188                                                       C. Halla et al.: Ice content and interannual water storage changes

tongue-shaped rock glacier, whose material source is derived       tures (Kenner et al., 2020). Interannual vertical variations of
from talus slopes.                                                 the surface topography are mostly related to the mass balance
   Under a changing climate, temperatures in the semi-arid         of rock glaciers (Kääb et al., 1998; Konrad et al., 1999). An-
to arid Andes are predicted to increase at a faster rate com-      nual mass balance and discharge are significantly lower for
pared to their lowlands (Bradley et al., 2006). Associated         rock glaciers compared to glaciers (Kääb et al., 1997; Krainer
changes in the mountain cryosphere, such as the degra-             and Mostler, 2002).
dation of glaciers (Braun et al., 2019; Dussaillant et al.,           The hydrologic system of rock glaciers receives water
2019), permafrost (Drewes et al., 2018; Rangecroft et al.,         from precipitation, snowmelt, ice melt and groundwater flow,
2016) and snowpack (Malmros et al., 2018; Saavedra et              while water is lost by discharge, groundwater flow, evap-
al., 2018), will strongly affect Andean watersheds currently       oration and sublimation (Burger et al., 1999; Krainer et
dominated by runoff generated from snowmelt and ice melt           al., 2007). Internal water flow, water storage capacities and
(Barnett et al., 2005; Bradley et al., 2006). Rising air tem-      changes are controlled by heterogeneous material composi-
peratures are expected to shift the timing of seasonal snow        tions (debris, ice, water and air) and their hydrothermal prop-
cover and snowmelt resulting in reduced discharge in sum-          erties (e.g. porosity and solid- or liquid-phase state of wa-
mer and autumn when demands are highest (Barnett et al.,           ter). Ice-rich permafrost functions as long-term water stor-
2005; Bradley et al., 2006). The sensitivity of the Central        age, while the active layer functions as a seasonal reservoir
Andes and Desert Andes of Argentina towards recent warm-           (Jones et al., 2018b). Seasonal to annual ice gains and water
ing is reflected by more pronounced snow cover reduction           releases have been mainly attributed to freezing and thaw-
and rising snowline elevations compared to the western side        ing of the active layer during winter and summer, respec-
of the Andes (Saavedra et al., 2018). In the semi-arid An-         tively (Duguay et al., 2015). Shallow groundwater drainage
des of Argentina many active rock glaciers currently exist         in rock glaciers is regulated by unfrozen and frozen con-
at or below the 0 ◦ C isotherm (Brenning, 2005; Trombotto          ditions with supra-, sub- and intra-permafrost flow (Jones
et al., 1999). For the next decades it is predicted that the       et al., 2019). Rock glaciers can contribute to groundwater
0 ◦ C isotherm of mean annual air temperature will increase        recharge and basin streamflow during late summer, autumn
by more than 500 m based on the representative concentra-          and winter (Harrington et al., 2018; Williams et al., 2006).
tion pathway of an additional radiative forcing of 8.5 W m−2       The water input and different hydraulic properties of hydro-
(RCP8.5), which is likely to trigger widespread thermal dis-       logical flow paths of frozen and unfrozen ground delay and
turbances and permafrost degradation in the Central Andes          buffer the water release of rock glaciers (Harrington et al.,
(Drewes et al., 2018). Yet, studies investigating changes in       2018; Jones et al., 2019; Rogger et al., 2017), which impacts
rock glacier volume over time are lacking so far. Generally,       the runoff generation in mountain catchments (Geiger et al.,
ground ice in rock glaciers responds more slowly to climate        2014; Krainer and Mostler, 2002). Moreover, water releases
change compared to surface snow and ice due to the presence        of rock glaciers and permafrost degradation can impact sur-
of the seasonally frozen active layer which dampens ther-          face freshwater in mountain catchments by changing their
mal changes in the subsurface (Haeberli et al., 2006). Mas-        inorganic chemistry (Colombo et al., 2018a, b) and influenc-
sive ground ice and ice-supersaturated conditions, i.e. ice-       ing the stream energy budget (Harrington et al., 2017). How-
rich permafrost in rock glaciers, are less sensitive to climatic   ever, only few studies have investigated groundwater flow
warming than permafrost with low ice content (Scherler et          pathways in rock glaciers (Harrington et al., 2018) and other
al., 2013) due to complex interactions of advective and con-       landforms of mountain watersheds sustaining stream runoff
vective heat fluxes and latent heat effects during freeze and      during dry periods (Langston et al., 2011; McClymont et al.,
thaw processes (Scherler et al., 2010). However, ice melt is       2012, 2010).
also predicted for rock glaciers (Marmy et al., 2016), and            The hydrologic importance of water storage capacities
corresponding changes are currently being observed in the          in rock glaciers compared to glaciers (Croce and Milana,
European Alps (Mollaret et al., 2019). In addition, signs of       2002; Milana and Maturano, 1999) as well as river discharge
permafrost warming have been reported for many active rock         (Schrott, 1996) and chemistry during summer months due to
glaciers worldwide, often manifested as rising permafrost          the melt of frozen ground (Lecomte et al., 2008) has been
temperatures that induce increased surface velocities (Kääb        previously investigated in the upper Agua Negra catchment
et al., 2007). Borehole data show that most of the rock glacier    in the dry Andes of Argentina. The present study of the
deformation occurs within shear horizons of creeping per-          talus rock glacier “Dos Lenguas” builds upon this earlier re-
mafrost (Arenson et al., 2002; Haeberli et al., 1998). Velocity    search and presents results of high-resolution surface detec-
variations of rock glaciers are additionally affected by liquid    tions and extensive hydro-geophysical subsurface measure-
water availability and groundwater fluxes (Ikeda et al., 2008)     ments in the data-scarce region of the dry Andes. In spite of
after rainfall and snowmelt, which increase pore water pres-       speculations on their hydrological significance (Azocar and
sure temporarily enhancing shearing (Cicoira et al., 2019;         Brenning, 2010; Corte, 1976; Jones et al., 2018a), almost no
Kenner et al., 2017; Wirz et al., 2016). Thus, rock glacier        quantitative and measurement-based estimates about water
movement is impacted by hydrology and ground tempera-              storage capacities of Andean rock glaciers and their changes

The Cryosphere, 15, 1187–1213, 2021                                                   https://doi.org/10.5194/tc-15-1187-2021

C. Halla et al.: Ice content and interannual water storage changes                                                              1189

over different timescales exist. With the present study, we try
to fill this gap and aim to (1) quantify long-term ice storage
capacities and water content at the end of the thaw period
by estimating the current material composition, (2) analyse
surface deformations and gain quantitative estimates of inter-
annual storage changes, and (3) infer the internal hydrologic
structure from the spatial distribution of ice and water con-
tent in different geomorphological areas of the active rock
glacier.

2   Study site

The upper Agua Negra basin and Dos Lenguas rock glacier
are located at approximately 30◦ S in the dry Andes of Ar-
gentina (Fig. 1a). The regional climate is characterized by
semi-arid conditions and extremely high solar radiation in-
tensities throughout the year (Schrott, 1998). Precipitation
above 4000 m a.s.l. is mainly solid and falls as snow and sleet
during winter. Due to the absent or thin snow cover during
8 months of the year, the incoming solar radiation controls
surface temperatures and the upper ground thermal regime
(Schrott, 1991). Available annual records from meteorolog-
ical stations in recent years show mainly negative mean an-
nual air temperature in the catchment (Table 1). The mean
to maximum annual precipitation in the Agua Negra catch-
ment area was between 45 and 168 mm yr−1 in the hydro-
logical years 2016–2017 and 2017–2018 (Table 2, CHIRPS-
derived estimates, Climate Hazards Group InfraRed Precip-
itation with Stations, Funk et al., 2015). Continuous per-
mafrost has been estimated to cover roughly 16 % or 9 km2 of
the watershed above 5200 m a.s.l. (Schrott, 1996). The lower
limit of discontinuous permafrost extends to ∼ 4000 m a.s.l.,
potentially covering large areas in the basin, including ac-
tive rock glaciers (0.88 km2 ) (Schrott, 1994; Tapia-Baldis
and Trombotto-Liaudat, 2020).
   Surface ice and snow stored in mountain glaciers (1.4 km2 )
and perennial snowfields (0.18 km2 ) together account for
2.8 % of the watershed (Fig. 1). The high mountain
cryosphere of the upper Agua Negra basin has been one of
the areas where previous studies investigated the hydrologic
significance of runoff from the high mountain cryosphere.
                                                                  Figure 1. (a) Spatial distribution of active rock glaciers, glaciers
Discharge measurements confirmed that meltwater from ar-
                                                                  and perennial snowfields in the upper Agua Negra catchment (hill-
eas affected by permafrost conditions and seasonally frozen
                                                                  shade based on TanDEM-X – TerraSAR-X add-on for Digital Ele-
ground account for an important share of ∼ 20 % of the dis-       vation Measurement – data © DLR – Deutsches Zentrum für Luft-
charge, which increases up to 30 % after snowmelt during the      und Raumfahrt – 2017) mapped by the Glacier Inventory of Ar-
ablation season (Schrott, 1994, 1996). Hydrochemical anal-        gentina (IANIGLA, 2018). The inset shows the location of the upper
ysis of meltwater indicates significant internal recycling by     Agua Negra catchment. (b) Based on the drone-derived DEM 2016,
sublimation and evaporation and delayed meltwater through-        the shaded relief map of the Dos Lenguas rock glacier shows the
puts from Dos Lenguas and other rock glaciers in the upper        geomorphological units subdivided into the root zone, central part,
Agua Negra basin (Lecomte et al., 2008). Geophysical in-          northern and southern tongue, the locations of geophysical profiles,
vestigations on the El Paso rock glacier suggest that the ac-     field pictures (Fig. 2), and ground control points for displacement
tive layer traps and conducts water and interacts with the per-   measurements.
mafrost table during summer thaw, while ice-rich permafrost

https://doi.org/10.5194/tc-15-1187-2021                                                  The Cryosphere, 15, 1187–1213, 2021
1190                                                                       C. Halla et al.: Ice content and interannual water storage changes

Table 1. Potential mean annual air temperature (MAAT) of recent years derived from different local meteorological stations for the upper
Agua Negra basin. The altitudes of 4300 and 4500 m a.s.l. correspond to the elevation range of the Dos Lenguas rock glacier, respectively.

                  Station (altitude)                                       Year       MAAT [◦ C]            MAAT [◦ C]           Reference
                                                                                     4300 m a.s.l.∗        4500 m a.s.l.∗
                  El Paso rock glacier (4720 m a.s.l.)             1990–1991                     1.8                  −0.1       Schrott (1996)
                  Paso Agua Negra (4774 m a.s.l.)                       2015                    −0.4                  −2.3       CEAZA (2019)
                  Agua Negra (4460 m a.s.l.)                            2016                    −2.5                  −4.5       IANIGLA (2019)
                  Diaguita (3880 m a.s.l.)                              2017                    −1.1                  −3.1       IANIGLA (2019)
                  Diaguita (3880 m a.s.l.)                              2018                    −0.5                  −2.5       IANIGLA (2019)
                ∗ A dry adiabatic lapse rate of 0.98 ◦ C km−1 was used to derive potential MAAT in different elevations from each station.

is an important water reservoir releasing water mainly during                           able to detect internal hydrological structures and quantify
droughts (Croce and Milana, 2002).                                                      ice and water content by means of geophysical methods. The
   Previous studies at Dos Lenguas have investigated                                    ice content and the liquid water content during the end of the
hydrological–geomorphological aspects such as the active                                thaw period were only estimated once at each geophysical
layer and the discharge of 5–8 L s−1 during the thaw period                             profile.
(Schrott, 1994; Schrott, 1996). The tongue-shaped talus rock                               The horizontal and vertical surface changes were sur-
glacier is roughly 1200 m long; is between 200 and 600 m                                veyed on a yearly basis with an unmanned aerial vehicle
wide in its upper and lower part, respectively; and extends                             (UAV). Accordingly, interannual storage changes between
from 4200 m at the foot to 4500 m in the root zone (Fig. 1b).                           2016–2017 and 2017–2018 were derived from the volumetric
Its surface covers an area of ∼ 0.36 km2 including side and                             changes of the surface towards the end of the thaw season.
front slopes and 0.25 km2 excluding them. In its lower part
the west-southwest flowing rock glacier separates into a                                3.2     DEM generation and analysis
northern and a southern tongue (Dos Lenguas is Spanish
for “two tongues”) both with distinct transverse ridges and                             To investigate the kinematics, i.e. vertical and horizontal sur-
furrows terminating in oversteepened frontal slopes (> 35◦ ).                           face changes, of the Dos Lenguas rock glacier, we relied
The surface morphology of the root zone is featured by                                  on the production of digital elevation models (DEMs) from
longitudinal ridges and furrows. In the central part of Dos                             aerial photography collected with a UAV. Using structure-
Lenguas longitudinal ridges transition into transverse struc-                           from-motion multi-view stereo (SfM-MVS) algorithms, we
tures downslope, where crevasses indicate the splitting of the                          derived dense point clouds from overlapping aerial imagery
tongues (Fig. 2). Meltwater ponds occur in transversal fur-                             with Agisoft PhotoScan Professional (version 1.4.4).
rows in the central part and on the northern tongue of Dos
Lenguas. The headwall talus system (1.01 km2 ) is located at
                                                                                        3.2.1      Data acquisition and DEM processing
a fault system and delivers mass input to the root zone by
rockfalls and groundwater from the contributing area above.
The debris supply is composed of weathered volcanic rocks                               During late summer in 2016, 2017 and 2018, we surveyed
of the Permian–Triassic Choiyoi Group consisting of rhyo-                               Dos Lenguas using a Phantom 3 Advanced Multicopter
lites, dacites, andesites and basaltic lavas, tuffs, breccias, and                      equipped with a standard camera (12.4 MP; FOV – field
ignimbrites (Heredia et al., 2012, 2002). The rock glacier sur-                         of view – 94◦ ), taking between 550 and 1800 overlap-
face is predominantly characterized by a thin layer (< 0.5 m)                           ping images per survey. Survey flights were accomplished
of coarse pebbles to small boulders supported by a sandy ma-                            in a single day (13 March 2016) or spanning multiple days
trix (Schrott, 1994), with isolated large boulders that occur                           (24 February–2 March 2017 and 3–7 March 2018), depend-
more frequently closer to the headwalls.                                                ing on weather conditions. Across the survey area, which
                                                                                        covered the rock glacier and its surrounding stable sur-
                                                                                        faces, we distributed 34 ground control points (Fig. 1b) that
3     Methods                                                                           were repeatedly measured with a Trimble R8s/R2 differen-
                                                                                        tial global navigation satellite system (dGNSS) operating in
3.1    Timing of field surveys                                                          a real-time kinematic base-rover configuration. The positions
                                                                                        of ground control points were recorded with horizontal root-
All field surveys were carried out between late February and                            mean-squared (RMS) errors of 0.012 and 0.013 m for 2017
mid-March in 2016, 2017 and 2018. During late summer, the                               and 2018, respectively, and vertical RMS errors of 0.022 and
active-layer depth and the meltwater content should be close                            0.027 m for 2017 and 2018, respectively. For all 3 years, the
their maximum. Therefore, the time span is particularly suit-                           identical workflow was followed in PhotoScan, starting with

The Cryosphere, 15, 1187–1213, 2021                                                                                https://doi.org/10.5194/tc-15-1187-2021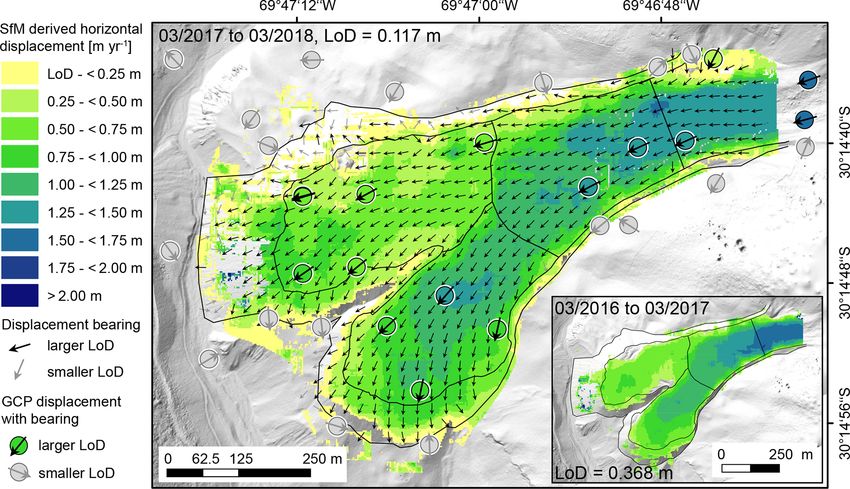
C. Halla et al.: Ice content and interannual water storage changes                                                                        1191

Figure 2. Field images of Dos Lenguas. (a) View towards the northern (left) and southern (right) tongues of the rock glacier. Note gully-like
structures in the upper oversteepened frontal slopes indicate the depths of the basal layer at both tongues (dotted lines). (b) Crevasses in
the central rock glacier part indicate rupturing of transversal ridge thereby exposing fine debris. (c) Partly frozen thermokarst pond with
delta indicating fine-sediment transport and accumulation along water pathways in furrows. (d) Thermokarst ponds next to profile L1 on the
northern tongue. (e) Gully-like structures at the surface perpendicular to the ridge and furrows indicate meltwater pathways in the active layer
next to profile L2 on the southern tongue (larger gullies on the southern tongue are also visible in Fig. 1b next to the field image location).

image alignment, followed by the manual identification of                 tracking (EMT) software (https://tu-dresden.de/geo/emt, last
ground control points and camera optimization.                            access: 21 January 2020), originally developed for motion
                                                                          tracking in oblique pictures (Schwalbe and Maas, 2017) but
3.2.2   Measurement of horizontal rock glacier                            likewise applicable to vertical images. As orthoimages col-
        displacement                                                      lected in consecutive years show large spectral differences,
                                                                          caused by shadowing effects, snow cover, surface moisture,
With the advancement of SfM-MVS software solutions and                    etc., we used DEMs and their derivatives as input for image-
the availability of low-cost UAVs, the production of high-                matching applications (Dall’Asta et al., 2017). EMT soft-
resolution DEMs and orthoimages has offered new time-                     ware applies area-based matching to automatically find cor-
efficient possibilities for the assessment of rock glacier kine-          responding patches of pixel values in multi-temporal im-
matics (Dall’Asta et al., 2017). Here we use two complemen-               ages using least-squares matching or cross-correlation algo-
tary approaches: (a) the repeated measurement of 34 ground                rithms (Förstner, 1986; Schwalbe and Maas, 2017). Images
control points using a dGNSS device and (b) an automated                  are loaded into EMT software, where starting points (patch
image-matching approach to quantify horizontal movement                   centres) are defined, the patch size and search area are set,
on the rock glacier.                                                      and the tracking method and master and slave images are se-
   For automated image co-registration in optical imagery we              lected. While the patch size defines the area of master image
used the freely available stand-alone environmental motion-               values to match, the search area defines the maximum off-

https://doi.org/10.5194/tc-15-1187-2021                                                           The Cryosphere, 15, 1187–1213, 2021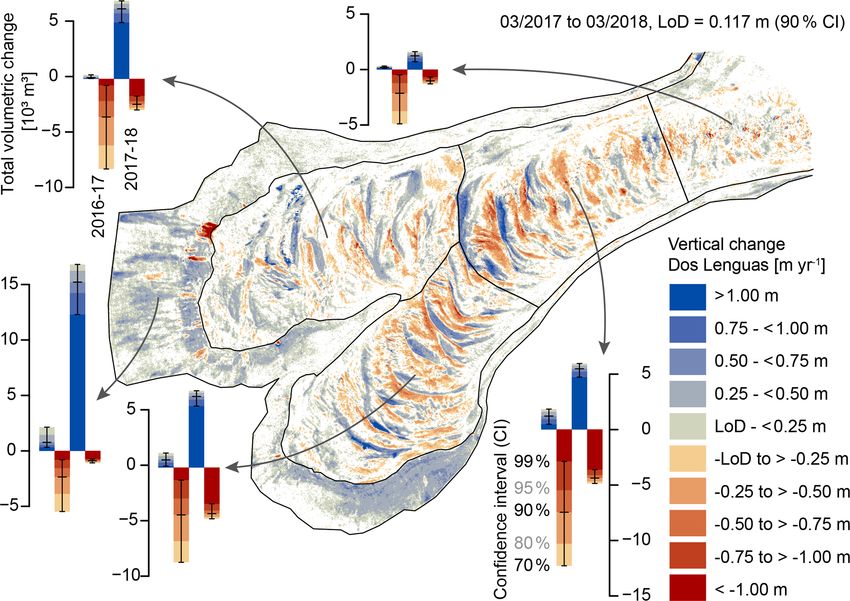
1192                                                      C. Halla et al.: Ice content and interannual water storage changes

set of the patch in the slave image. We applied least-squares     where t is the critical value of a given confidence interval in
matching with a patch size of 150 × 150 pixels and a search       a two-sided Student’s t distribution and σ is the error asso-
area of 50 × 50 pixels on hillshade images with 0.5 × 0.5 m       ciated with the DEM, calculated from the average reprojec-
resolution, resulting in a patch size of 75 × 75 m and a search   tion error of 34 ground control points for epochs i and i + 1.
area of 25 × 25 m.                                                Raster values less than the LoD were later excluded from the
                                                                  calculation of the total positive and total negative volumetric
3.2.3   Volumetric surface changes                                changes of the respective surface areas (Fig. 4).

Besides analysing the horizontal displacements of the rock
                                                                  3.3     Geophysics
glacier, short-term surface elevation changes can be used to
approximate the geodetic mass balance of a rock glacier from
photogrammetric investigations (Kääb et al., 1998; Kääb et        Two-dimensional electrical resistivity tomography (ERT)
al., 1997) or dGNSS measurements (Konrad et al., 1999).           and seismic refraction tomography (SRT) were conducted
The production of multi-temporal DEMs allows for the cal-         along identical longitudinal profiles and cross-profiles on the
culation of volumetric surface changes between consecutive        Dos Lenguas rock glacier (Fig. 1b) to image the internal
surveys. The vertical changes of the rock glacier surface area    structure and to quantify its material composition based on a
over the periods 2016–2017 and 2017–2018 were estimated           petrophysical model, the so-called four-phase model (4PM,
by subtracting surface elevations of the 2016 DEM from the        see below) (Hauck et al., 2011).
2017 DEM and the 2017 DEM from the 2018 DEM, respec-                 The layout and survey geometry of the profiles were cho-
tively. Then, the pixel-wise volumetric change was derived        sen according to the surface morphology of the rock glacier
by multiplying the vertical changes of each raster cell by cell   (Fig. 1b): (i) to gather subsurface properties in the four main
size. The total positive and total negative volumetric changes    structural units of the rock glacier, i.e. the root zone (profile
(bar graphs in Fig. 4) for the different geomorphological         C1), the central part (profile C2) and both tongues (profiles
units of Dos Lenguas (Fig. 1b) were summed to derive neg-         L1 and L2); (ii) to include longitudinal profiles and cross-
ative and positive volumetric changes of the respective sur-      profiles, which cover side slopes; and (iii) to survey perpen-
face areas. The total volumetric net changes of the geomor-       dicular to potential water pathways (Langston et al., 2011)
phological units are the sum of positive and negative volu-       and water traps indicated by depressions and the local slope
metric changes in the respective surface areas. The density       of surface topography.
of ice (900 kg m−3 ) was used to estimate the corresponding
net change of ground ice, which is given as water equivalent      3.3.1    Electrical resistivity tomography (ERT)
(1 mm yr−1 corresponds to 1 kg m−2 yr−1 ) for each geomor-
phological area except for the side and front slopes. There-      Subsurface resistivity is measured by injecting direct current
fore, it was assumed that the net changes in ground ice are       into the ground through two electrodes while measuring the
mainly caused by volume expansion due to freezing of wa-          potential difference between two other electrodes coupled to
ter and volume reduction due to melting of ground ice or          the ground. Iterative tomographic inversions of apparent re-
thawing of ice-supersaturated permafrost. The net change in       sistivities measured at different electrode locations and sepa-
ground ice content per year was interpreted as a first-order      rations along a profile finally yield a two-dimensional model
estimate of the interannual water storage change. The as-         of the specific resistivity of the subsurface. The application
sumption implies that spatial variations of the flow regime,      of ERT has become a standard technique to image and moni-
bulk density changes of debris and edge effects of surface        tor variations of electrical resistivity in the near subsurface of
areas of the rock glacier are included in total volumetric net    mountain permafrost due to its sensitivity to the state of water
changes but potentially of minor importance for the consid-       (liquid or solid) in unfrozen and frozen conditions (Hauck,
ered timescale.                                                   2013; Hilbich et al., 2008; Mollaret et al., 2019).
   Different sources of error might complicate the interpre-         Four two-dimensional ERT profiles were measured with
tation of volumetric surface changes; amongst these errors        an ABEM Terrameter LS system (four channels) with 4 ca-
are dGNSS measurements, manual tagging of ground con-             bles and 81 electrodes. Sponges were placed around steel
trol points aerial image quality and interpolation algorithms     electrodes and wetted with salt water to reduce contact resis-
(Wheaton et al., 2010). Therefore, a minimum level of detec-      tance of the dry and loose surface material (sands and pebbles
tion (LoD) was calculated that incorporates propagated un-        to boulders) in order to improve galvanic coupling (Mau-
certainties from individual DEMs and determines a thresh-         rer and Hauck, 2007). Profile lengths of 240 m (L1), 320 m
old to discriminate significant changes from non-significant      (C1) and 400 m (C2 and C2) were achieved with an elec-
noise. Following Brasington et al. (2003) we define the min-      trode spacing of 3, 4 and 5 m, respectively (Table 3). All pro-
imum LoD using Eq. (1):                                           files were measured with the multiple-gradient array, which
         q                                                        reached maximum penetration depths of 41 m for L1, 60 m
LoD = t σDEM 2         2
                    + σDEM     ,                            (1)
                  i        i+1
                                                                  for C1, and 68 m for C2 and L2. Before data inversion, data

The Cryosphere, 15, 1187–1213, 2021                                                    https://doi.org/10.5194/tc-15-1187-2021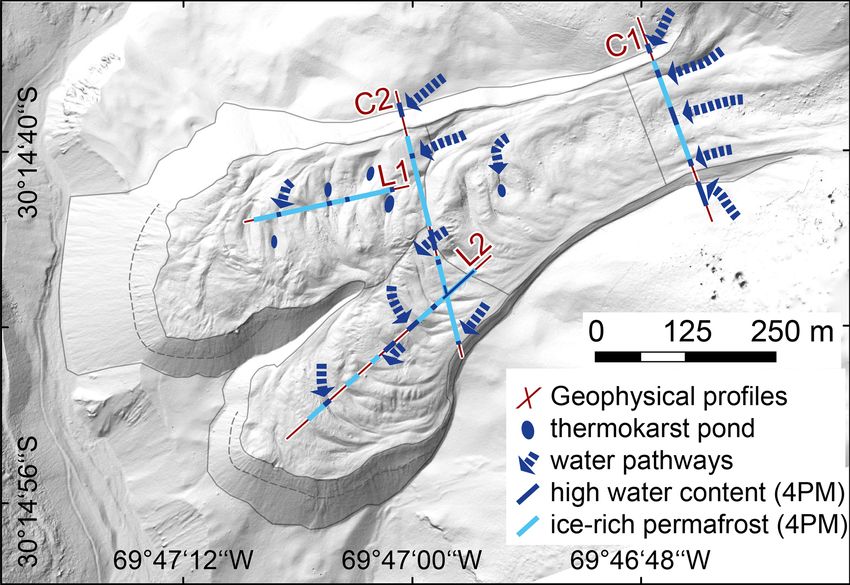
C. Halla et al.: Ice content and interannual water storage changes                                                                         1193

Figure 3. Horizontal surface displacement on the Dos Lenguas rock glacier. Ground control point: GCP.

Figure 4. Vertical changes of Dos Lenguas from March 2017 to March 2018. The bar graphs show the total positive volumetric (bluish bars)
and the total negative volumetric (reddish bars) changes for each geomorphological area (Fig. 1b) as a function of the confidence intervals
for the periods 2016–2017 and 2017–2018. Starting at the 12 o’clock position and following in the clockwise direction, the five bar graphs
contain the total volumetric changes of the root zone, the central area, the southern tongue, the front and side slopes, and the northern tongue.
The corresponding total net changes of ice are given in Table 6 as water equivalents.

points exceeding the threshold of 1 % of the coefficient of                magnitudes, typical for permafrost environments. The robust
variation were removed.                                                    inversion scheme (L1 norm) with no limits for the resistiv-
  Data inversion was done using the RES2DINV inversion                     ity range was used, as sharp boundaries and high resistivities
software (http://www.geotomosoft.com, last access: 21 Jan-                 for ice-rich permafrost were expected. The surface topogra-
uary 2021). Default inversion settings were adapted to com-                phy was integrated based on dGNSS measurements of each
ply with high resistivity contrasts on the order of several                electrode along the profiles, and the topographic shift of the

https://doi.org/10.5194/tc-15-1187-2021                                                            The Cryosphere, 15, 1187–1213, 2021
1194                                                                 C. Halla et al.: Ice content and interannual water storage changes

Table 2. Mean and maximum precipitation in the Agua Negra valley for the hydrological periods 2016–2017 and 2017–2018 from the
CHIRPS (Climate Hazards Group InfraRed Precipitation with Stations) data archive (Funk et al., 2015).

                                                                    Sum of monthly precipitation [mm]
                                      Hydrological    Austral winter         Austral summer     Hydrological year
                                      period          1 Apr–30 Sep            1 Oct–31 Mar       1 Apr–31 Mar
                                                      Mean          Max      Mean       Max     Mean            Max
                                      2016–2017          23          50         22        90        45            140
                                      2017–2018          13          55         38       113        51            168

Table 3. Details of the ERT surveys. The columns to the left of the acquisition date contain details of the layout geometry of each profile
(see Fig. 1b for the position of the profiles). The columns to the right of the acquisition date contain filtered data points and the quality of the
inversion. Longitudinal profile: long. profile.

 ERT profiles                                           Length            Electrode   Acquisition        Number of data points    Absolute error after
 Dos Lenguas                            Orientation           [m]     spacing [m]     date           Collected            Used     five iterations [%]
 C1 (cross-profile) root zone           NNW→SSE               320                4    23 Feb 2017          1160      992 (86 %)                   6.2
 C2 (cross-profile) central part        N→S                   400                5    27 Feb 2017          1168     1075 (92 %)                   5.1
 L1 (long. profile) northern tongue     ENE→WSW               240                3    2 Mar 2017           1168     1117 (96 %)                   6.7
 L2 (long. profile) southern tongue     NE→SW                 400                5    2 Mar 2018            951      919 (97 %)                   7.4

subsurface nodes of the inversion models were exponentially                      Hauck and Kneisel, 2008) and permafrost in rock glaciers
damped with depth (Loke, 2018).                                                  (1500–5000 m s−1 , cf. Draebing, 2016). Low-velocity layers
    The mean absolute misfit error of the inversion model is                     sandwiched between or located below high-velocity layers
given by the difference between calculated and measured ap-                      cannot be detected from P waves (Schrott and Hoffmann,
parent resistivity of the model blocks (Loke, 2018). Data out-                   2008). Despite the challenges in mountain permafrost ter-
liers of measured apparent resistivities were filtered using a                   rain, refraction seismic surveys have been successfully ap-
filter criterion of RMS error of > 100 % after a first inversion                 plied on periglacial landforms like rock glaciers (Croce and
run before the inversion was repeated with the filtered data                     Milana, 2002; Hausmann et al., 2007; Ikeda, 2006; Musil et
set (Loke, 2018). In total, 92 % of all gathered data points                     al., 2002; Schrott, 1996), moraines (Langston et al., 2011),
were used after filtering (Table 3).                                             talus slopes (Otto and Sass, 2006) and debris-covered slopes
                                                                                 (Hilbich, 2010).
3.3.2   Seismic refraction tomography (SRT)                                         We used a 24-channel Geode (Geometrics) with 14 Hz
                                                                                 geophones to record seismic waves with a sample interval
Significantly different elastic properties between the frozen                    of 0.125 ms and five stackings per shot point. A sledge ham-
and the unfrozen state of the subsurface can be measured                         mer (7.5 kg) and an aluminium plate were used to generate
using its P-wave velocities. P waves are refracted at sub-                       P waves. A total of 8 to 10 in-line shots and 3 to 6 offset
surface layers with velocity contrasts. Subsurface layers and                    shots were measured for each layout before “rolling” on. The
structures can be delineated by analysing first-arrival times                    geophone spacing ranges between 3 and 5 m in alignment
at each receiver if velocities increase with depth. Velocity                     with the spacing of the ERT profiles, as electrode positions
changes in the active layer and permafrost are mainly in-                        were used for geophones to ensure consistent sensor posi-
fluenced by the porosity of sediments and their saturation                       tions within the same geophysical profile (Table 4). The com-
with air (330 m s−1 ), water (1500 m s−1 ) or ice (3500 m s−1 )                  plete data processing workflow, including first-arrival pick-
and are thus more distinct in unconsolidated coarse-grained                      ing, travel time analysis and data inversion, was performed
sediments than consolidated rocks (Hilbich, 2010). P-wave                        with the Reflexw software package that uses an inversion al-
velocities in rock glaciers derived from different field stud-                   gorithm based on the simultaneous iterative reconstruction
ies increase generally from the active layer (< 1500 m s−1 )                     technique (Sandmeier, 2016). Profile topography and an ini-
to permafrost (range of 1500–5000 m s−1 ) (Draebing, 2016;                       tial velocity gradient of 300 m s−1 m−1 were integrated in all
Hauck and Kneisel, 2008).                                                        start models. The reliability of the tomograms is given by
   Difficulties for the interpretation of structures can                         the RMS and by the sum of the total absolute time differ-
arise from overlapping P-wave velocities, e.g. sand (200–                        ences between observed and calculated travel times (Table 4)
2000 m s−1 ) or bedrock (1300–6200 m s−1 , cf. Table A3 in                       (Sandmeier, 2016).

The Cryosphere, 15, 1187–1213, 2021                                                                      https://doi.org/10.5194/tc-15-1187-2021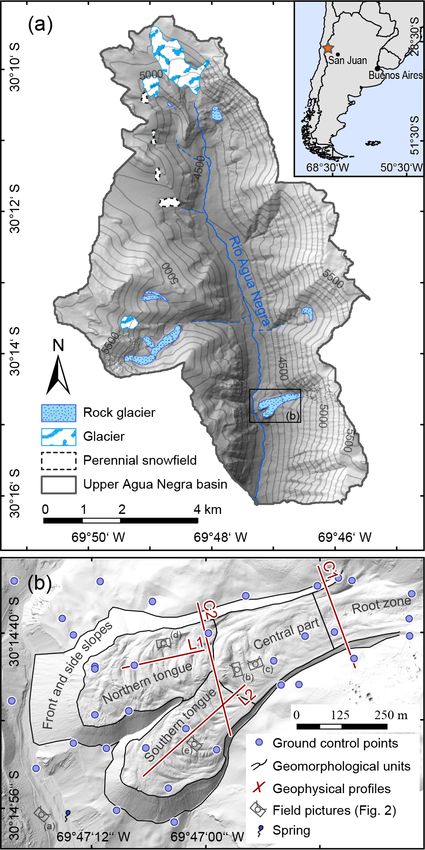
C. Halla et al.: Ice content and interannual water storage changes                                                                                     1195

Table 4. Details of the SRT surveys. Sensor spacing and orientation of all SRT profiles are identical to the corresponding ERT profiles (cf.
Table 3). Longitudinal profile: long. profile.

   SRT profiles                          Geophone positions on   Acquisition    Shot                                RMS                Total absolute
   Dos Lenguas                                ERT profile [m]    date          points      Iterations      deviation [ms]        time difference [ms]
   C1 (cross-profile)       root zone                  20–304    24 Feb 2017        25               9                   2.7                          2.0
   C2 (cross-profile)     central part                 20–360    28 Feb 2017        25              14                   4.7                          3.8
   L1 (long. profile) northern tongue                   6–213    3 Mar 2017         25              13                   3.2                          2.4
   L2 (long. profile) southern tongue                   0–400    3 Mar 2018         43              11                   2.6                          2.0

3.3.3   Four-phase model (4PM)                                           Table 5. Model parameters for 4PM calculation.

In order to quantify the material composition of the rock                            Prescribed 4PM parameters
glacier, the complementary ERT and SRT field data were
                                                                                     a                                  1
combined in the 4PM to estimate the volumetric fractions
                                                                                     m                                  2
of ice, water, air and rock based on petrophysical relation-                         n                                  2
ships. Using the ERT-derived inverted specific resistivity dis-                      vw (m s−1 )                        1500
tribution ρ and the P-wave velocity distribution from SRT,                           vr (m s−1 )                        6000
the 4PM determines the volumetric fractions of liquid water                          vi (m s−1 )                        3500
(fw ), ice (fi ,) and air (fa ) within the predefined porosity (φ)                   va (m s−1 )                        330
of the rock fraction (fr ) by assuming that the sum of all frac-
tions equals one in each model cell of the two-dimensional                           Values for model scenarios
model domain (Hauck et al., 2011).                                                   ρw ( m)                           30; 50; 100; 200
                                                                                     8uniform                           0.3, 0.5, 0.7
fw + fi + fa + fr = 1 with 0 ≤ fw fi fa fr ≤ 1                   (2)                 8mixed a                           0.75–0.03
                                                                                     8active layer b                    0.45–0.3
In its simplest version, the estimation of fw in the 4PM is                          8Permafrost b                      0.75–0.3
based on Archie’s law that relates the measured and inverted                         8bedrock b                         0.1–0.03
electrical resistivity ρ (in  m) of sediments to the resistivity
                                                                                   a Mixed model includes different porosities of the active layer,
of pore water ρw , the porosity φ and the saturation with water                    permafrost and bedrock. b Porosity ranges include depth
Sw :                                                                               gradient.

ρ = ρw φ −m Sw−n ,                                               (3)

where m (cementation index) and n (saturation exponent)
                                                                                 ρw (1 − fr )n 1/n

are empirically determined parameters of the host material               fw =                       ,                                                       (5)
(Archie, 1942). This petrophysical relation is assumed to be                     ρ(1 − fr )m

still valid in partly frozen material and permafrost close to                  vi va    1 fr 1 − fr
                                                                         fi =            − −
0 ◦ C, where unfrozen water can still be present (Hauck et al.,               va − vi v vr            va
2011). Regarding the seismic velocities, the 4PM incorpo-                                  n 1/n
                                                                                ρw (1 − fr )            1   1
rates and extends the time-average equation of Timur (1968)                 −                             −      ,                                          (6)
to four phases:                                                                  ρ(1 − fr )m           vw va

                                                                                vi va   1 fr 1 − fr
1 fw fr fi fa                                                            fa =             − −
  =   + + + ,                                                    (4)          vi − va v vr            vi
v   vw vr vi va                                                                                 1/n
                                                                                ρw (1 − fr )n

                                                                                                        1   1
                                                                            −                             −      .                                          (7)
where vis the obtained P-wave velocity of the bulk material                      ρ(1 − fr )m           vw vi
and vw , vr , vi and va are P-wave velocities of water, rock,
                                                                         Equations (5)–(7) allow for calculating the fractions fw ,
ice and air, respectively (Hauck et al., 2011). Equations (2),
                                                                         fi and fa based on the input data ρ and v from ERT
(3) and (4) can be combined and solved for fw , fi and fa by
                                                                         and SRT, respectively, if the other material properties
replacing φ = 1 − fr and Sw = fw / φ in Eq. (3) to yield
                                                                         (φ, ρw , m, n, vw , vr , vi and va , cf. Table 5) are prescribed.
                                                                            The P-wave velocities vw , vi and va are known mate-
                                                                         rial properties and were taken from previous studies in
                                                                         periglacial environments (Hauck and Kneisel, 2008). The P-
                                                                         wave velocity vr of the frozen volcanic rocks was assumed

https://doi.org/10.5194/tc-15-1187-2021                                                               The Cryosphere, 15, 1187–1213, 2021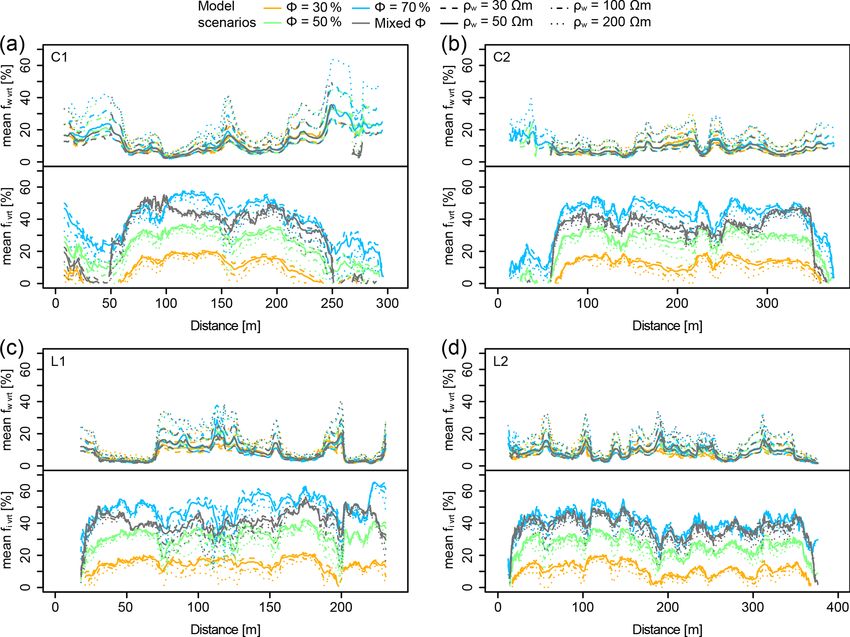
1196                                                       C. Halla et al.: Ice content and interannual water storage changes

to be 6000 m s−1 , since comparable frozen or unfrozen rock        specific electrical resistivity of surface waters derived from
types range between 4000 and 7000 m s−1 (Draebing, 2016;           the spring (∼ 30  m), thermokarst ponds (∼ 50  m) and
Schön, 2011) and the sensitivity of the 4PM is very low            melted snow from the surface (∼ 200  m). A fourth value
for variations in vr (Hauck et al., 2011). The free parame-        of 100  m was assumed to represent an intermediate model
ters m and n in Archie’s law were adopted from studies that        response to snow-derived groundwater increasing its conduc-
have been successfully conducted in different mountain per-        tivity during percolation.
mafrost environments (Pellet et al., 2016), including differ-         The 4PM model results were evaluated based on two crite-
ent rock glaciers (Hauck et al., 2011; Mewes et al., 2017;         ria. First, we used the ratio of the number of model cells with
Schneider et al., 2013) or have been tested for unfrozen and       physically consistent solutions (i.e. which satisfied Eq. 2) to
frozen sands (King et al., 1988). These prescribed parameters      the total number of model cells as proxy for the suitability of
of the 4PM were kept constant in the model scenarios. The          the sensitive 4PM parameters 8 and ρw . Second, the model
most sensitive 4PM parameters from Table 5 are the poros-          results were qualitatively compared to check plausible mate-
ity φ and the pore water resistivity ρw (Hauck et al., 2011).      rial compositions in permafrost and the active layer during
Hence, for this study model scenarios with different combi-        summer thaw, e.g. whether ice content in permafrost is suffi-
nations of φ and ρw values were performed to estimate and          cient to allow for creep deformations and whether model re-
evaluate modelled material compositions.                           sults indicate unreasonable ice content near the surface, i.e.
   We used three uniform porosity models with φ of 30 %,           active-layer depths. After the evaluation, plausible conserva-
50 % and 70 % and one mixed-porosity model by integrat-            tive and maximum scenarios were chosen in order to esti-
ing different porosity ranges of 45 %–30 %, 75 %–30 % and          mate ranges of the total ice content of Dos Lenguas and the
10 %–3 % for the active layer, permafrost and bedrock, re-         liquid water content at the end of the thaw season. The mean
spectively (Table 5), due to the high spatial variability of the   volumetric fraction of water (mean fw ) and ice (mean fi )
porosity and volumetric ice content in rock glaciers. Obser-       of all model cells located below the rock glacier surface of
vations from drill cores have shown that volumetric ground         each profile (4PM model cells below side slopes and outside
ice content can range from 0 % to 90 % in ice-free, ice-           the rock glacier were excluded at profiles C1 and C2) were
poor and ice-rich layers in rock glaciers (Haeberli et al.,        converted to mass using densities of 997 and 900 kg m−3 for
1998; Krainer et al., 2017; Monnier and Kinnard, 2013).            water and ice, respectively. The mean ice and water con-
The frozen core of active rock glaciers is mainly character-       tent along the profiles C1 (root zone), C2 (central area), L1
ized by ice-supersaturated conditions (> 40 % ice content)         (northern tongue) and L2 (southern tongue) were extrapo-
and can contain massive ground ice. Therefore the assumed          lated to the mean depth of ice-rich permafrost of each profile
uniform 70 % porosity model and mixed-porosity model rep-          and to the respective surface area of the geomorphological
resent the upper-bound assumptions for the 4PM modelling           units (Fig. 1b). The error estimation for the mean ice and wa-
approach of a talus rock glacier, like Dos Lenguas. Ice-           ter content in Dos Lenguas was calculated by linearly propa-
supersaturated conditions could be expected for volumetric         gating the uncertainties of (i) the mean fw and the mean fi of
ice content greater than 40 %, since the dominant grain sizes      all used model cells of each profile, (ii) mean depths of ice-
of Dos Lenguas are sands and pebbles (Schrott, 1994). The          rich permafrost, and (iii) 2 % error attributed to the mapped
30 % and 50 % porosity models allow for volumetric ice con-        surface areas derived from the high-resolution DEM.
tent less than 30 % and 50 %, given that the voids in rock            Besides the quantification of the material composition, the
glaciers and the 4PM also contain water and air. Therefore         4PM was used to infer the internal hydrologic structure of
the latter porosity models would be suitable for an inactive       the rock glacier from the spatial distribution of ice and wa-
or intact rock glacier, which does not presently move, as          ter content per porosity, i.e. ice and water saturations, along
the creep of frozen soils is restricted by interlocking parti-     the profiles. The resolution capacity of water and ice con-
cles without ice-supersaturated conditions (Arenson et al.,        tent along 4PM profiles was previously tested by Mewes et
2002; Arenson and Springman, 2005). The spatial arrange-           al. (2017) using synthetic models and field data to assess de-
ment of mixed porosities was deduced from interpretations          tectable hydrological structures in rock glaciers.
of the ERT and SRT data. Negative depth gradients (0.01–
0.03 m−1 ) were included to simulate substrate compaction
with depth while allowing for higher volumetric ice content        4     Results
in the upper part of the frozen core of the rock glacier. Poros-
ity assumptions for geophysical models are further discussed       4.1    Horizontal surface displacements
by Mollaret et al. (2020), who also found porosity values of
30 %–70 % for active rock glaciers based on jointly inverted       The Dos Lenguas rock glacier shows a heterogeneous pat-
data sets.                                                         tern of horizontal surface displacements that are consistent
   All porosity scenarios were modelled for different pore         in both direction and magnitude for the two epochs (Fig. 3).
water resistivities of 30, 50, 100 and 200  m. Modelled pore      Generally, surface velocities fall between a few decimetres
water resistivities were based on in situ measurements of          and 2 m yr−1 and decrease downslope and laterally from

The Cryosphere, 15, 1187–1213, 2021                                                   https://doi.org/10.5194/tc-15-1187-2021
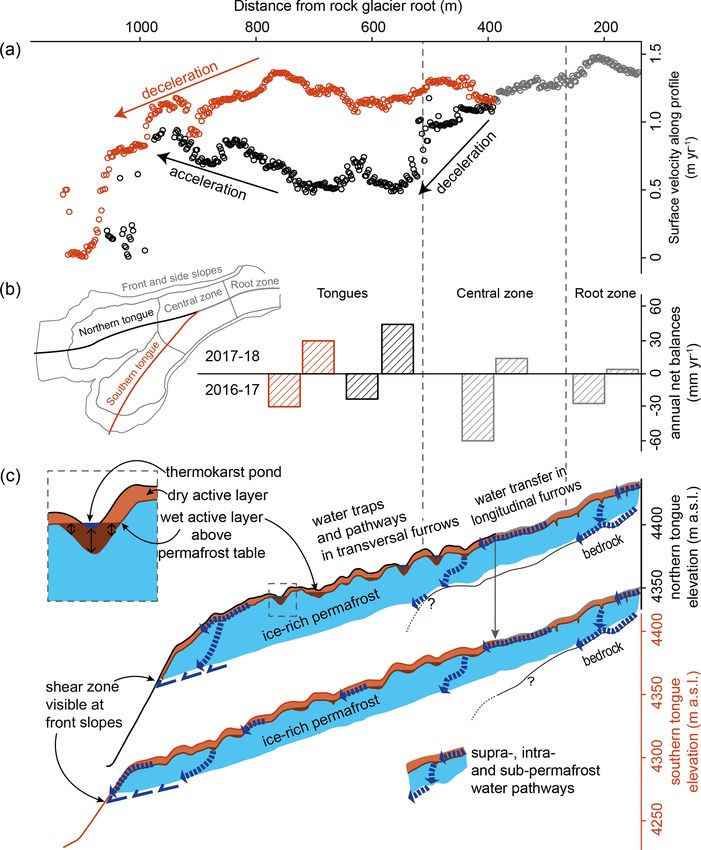
C. Halla et al.: Ice content and interannual water storage changes                                                       1197

the central flow lines towards the side slopes. The high-        layer show downslope transported and accumulated debris at
est surface speeds of 1.5–2 m yr−1 are attained along the        the front slopes.
central flow line of the root zone, where surface morphol-          If the volumetric changes of the surface topography were
ogy is dominated by longitudinal ridges and furrows indi-        produced solely by the interannual forward movement, the
cating extensional flow in a mainly western direction. Sur-      sum of total positive and negative volumetric changes should
face movements remain between 1.5 and 2 m yr−1 in the            be close to zero within the given uncertainties. However, the
upper central part, while the flow direction slightly turns      total positive and negative volumetric changes yielded differ-
to the west-southwest. Grading into the southern tongue of       ent magnitudes for the rock glacier surface (excluding front
the rock glacier, surface displacement decreases only mod-       and side slopes) and the different geomorphologic units dur-
erately to between 1 and 1.25 m yr−1 and bends towards           ing the observation periods (cf. bar graphs in Fig. 4). Thus,
the southwest. In contrast to this, the boundary between         annual net changes of the ground ice content, i.e. volumet-
the central part and the northern tongue is much sharper.        ric gains and losses of ice, were calculated as a first-order
Here, the flow continues in a west-southwest direction and       estimate of the interannual water storage changes given in
immediately drops down to below 0.75 m yr−1 . Approach-          water equivalents (Table 6). The sum of the total volumet-
ing the front of the northern tongue, surface displacement       ric changes in all geomorphological units (excluding the area
accelerates again, reaching velocities of up to 1.25 m yr−1 .    of the front and side slopes) gives an annual net change in
Opposed to this, the southern tongue further bends towards       ground ice of −36 and +27 mm yr−1 in the years 2016–
the southwest, keeping relatively high surface displacement      2017 and 2017–2018, respectively, with a confidence inter-
rates between 1 and 1.5 m yr−1 before slowing down to 0.75–      val of 95 % (Table 6). The spatial differences in the first
0.5 m yr−1 on top of the frontal slope. Consistently on both     observation period, 2016–2017, indicate major ice losses of
frontal slopes, however, displacement rates rapidly decrease     −61 mm yr−1 in the central area and moderate losses be-
downwards from approximately 1 m yr−1 to below the LoD.          tween −23 and −30 mm yr−1 in the other geomorphologi-
   The horizontal surface displacement rates confirm the ac-     cal units. During the second period of 2017–2018, the cen-
tive state of Dos Lenguas, while the displacements of ground     tral part, northern tongue and southern tongue gained 14, 45
control points with rates smaller than the LoD and random        and 30 mm yr−1 , respectively, while gains of 4 mm yr−1 in-
bearings (Fig. 3) underline the inactive state of the rock       dicate almost equilibrium conditions in the root zone. Thus,
glacier part north of Dos Lenguas classified from surface        based on the 95 % confidence interval, the total net change
morphology (Schrott, 1996).                                      of the ground ice between March 2016 and March 2018 in-
                                                                 dicates ice losses of −23 and −47 mm yr−1 in the root zone
                                                                 and central part, respectively; ice gains of 22 mm yr−1 on the
4.2   Volumetric changes
                                                                 northern tongue; and equilibrium conditions with 0 mm yr−1
                                                                 for the southern tongue.
For two epochs, 2016–2017 and 2017–2018, we calcu-                  The robustness of volumetric estimates was assessed by
lated vertical surface changes and corresponding volumetric      calculating LoDs based on different confidence intervals as
changes for the five morphological units of the Dos Lenguas      input to Eq. (1), using t values from a two-sided Student’s
rock glacier. The spatial pattern of interannual positive vol-   t distribution (Table 6, Fig. 4). Most of the revealed verti-
umetric changes along the front of the transverse ridges and     cal changes from 2016 to 2017 had high limits of detection
negative volumetric changes on the back of the transverse        from 0.232 to 0.576 m for the 70 % to 99 % confidence inter-
ridges indicate the advance of the surface of the rock glacier   vals, respectively. In contrast, vertical changes from 2017 to
(Fig. 4). The highest amounts of these paired positive and       2018 had very narrow limits of detection between 0.073 and
negative volumetric changes correlate spatially to the lower     0.183 m for the 70 % to 99 % confidence intervals, respec-
central area and along the southern tongue where strongly        tively. Thus, detected volumetric changes for 2017–2018 can
developed transverse ridges and furrows match with high          be regarded as more reliable due to their higher accuracy.
horizontal displacements (cf. Figs. 3 and 4). Although the       The lower accuracy for the period 2016–2017 might be re-
highest displacement rates occurred in the root zone, vol-       lated to bulging effects causing spatial errors (Mosbrucker
umetric changes are less pronounced here, as surface to-         et al., 2017) in the central part of the 2016 DEM due to
pography is characterized by longitudinal ridges and fur-        technical difficulties during dGNSS measurements of central
rows. Conversely, weaker volumetric changes occurred on          ground control points. However, the 95 % and 99 % confi-
the northern tongue, where slower movements of the trans-        dence intervals yielded still comparable magnitudes of volu-
verse ridges predominate. Positive volumetric changes of the     metric changes for both periods and give rather conservative
upper front slopes reflect the advancement and oversteepen-      estimates.
ing above the shear layer, which is also visible on the aerial      If the amounts of interannual storage changes are consid-
images (cf. Figs. 2a, 3 and 4). Negative volumetric changes      ered as mean depth variations of an ice-rich permafrost table,
delineate superimposed linear erosion features at the upper      they would mean the growth or melting of ground ice at the
frontal slopes. Positive volumetric changes below the shear      top of a frozen core by several centimetres per year. Observed

https://doi.org/10.5194/tc-15-1187-2021                                               The Cryosphere, 15, 1187–1213, 2021
1198 C. Halla et al.: Ice content and interannual water storage changes
Table 6. Level of detection (LoD; top) is given for different confidence intervals and t values for detected vertical changes. Associated net
balance estimates (bottom) derived from the sum of positive and negative interannual volumetric changes for the observation periods. The
net changes of ice are given in water equivalent per year for the whole surface area and each geomorphological unit of the rock glacier. The
net balance approximations correspond to interannual water storage change under the assumption that the volumetric changes were mainly
caused by gains and losses of ice.
Confidence interval 70 % 80 % 90 % 95 % 99 %
t value 1.036 1.282 1.645 1.96 2.576
LoD 2016–2017 [m] 0.232 0.287 0.368 0.438 0.576
LoD 2017–2018 [m] 0.073 0.091 0.117 0.139 0.183
Net change of positive and negative volumetric changes for the observation periods [mm yr−1 ]
Period 2016–2017 2017–2018 2016–2017 2017–2018 2016–2017 2017–2018 2016–2017 2017–2018 2016–2017 2017–2018
Rock glacier surface −109 +29 −86 +28 −55 +28 −36 +27 −15 +25
Root area −116 +8 −89 +7 −49 +5 −27 +4 −9 +1
Central part −141 +15 −117 +15 −84 +14 −61 +14 −33 +14
Northern tongue −90 +50 −68 +49 −38 +46 −23 +45 −7 +42
Southern tongue −95 +30 −74 +30 −47 +30 −30 +30 −13 +30
wet active-layer conditions above ice-rich permafrost during the subsurface indicate rather ice-rich permafrost in the rock
the summer thaw in our study and other studies (Arenson glacier. Thus, we interpret the active layer to be mainly char-
et al., 2010; Croce and Milana, 2002; Kenner et al., 2020) acterized by very dry debris of ridges and locally wet con-
add to the interpretation that active layer and ice-rich per- ditions located in longitudinal and compressional furrows
mafrost tables are potential sinks and sources of interannual or in topographic depressions between side slopes and talus
storage changes. Yet, the interannual growth and decay of slopes of the rock glacier (Fig. 5). Direct proof of wet active-
ground ice in and around other parts of the rock glacier could layer conditions is given at L1 where meltwater ponds are
add to the interannual water storage changes. The estimated present in furrows next to the profile (Fig. 2d) on the north-
magnitudes of interannual changes seem reasonable given ern tongue. Horizontal and vertical contrasts and anomalies
the high variability of mountain weather conditions, micro- of resistivity permitted a clear delimitation of the permafrost
topographic effects and strong influence of incoming solar body in the rock glacier. Lower electrical resistivities below
radiation potentially controlling local active-layer variations depressions and furrows could indicate higher water and/or
on rock glaciers in the upper Agua Negra catchment (Schrott, lower ice content in the rock glacier due to percolating water
1998). and/or local permafrost degradation between interpreted ice-
rich permafrost (Fig. 5). Ice-rich permafrost shows large ver-
4.3 Internal structure, ice and water content tical variations and increasing thicknesses of 10–20, 15–25
and 15–30 m in the root zone, central area and both tongues,
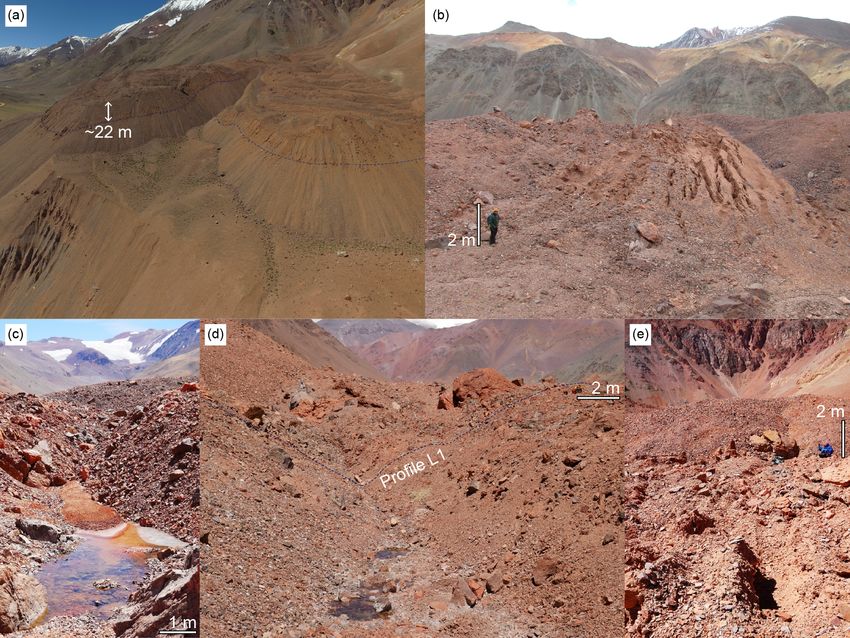
4.3.1 ERT results and interpretations respectively. As the electrical conductivity (= 1 / resistivity)
is mostly sensitive to liquid water content, it remains incon-
The inversion results of all ERT data show a heterogeneous clusive if higher resistivities are caused by air- or ice-filled
distribution of high, intermediate and low specific resis- voids. Additionally, inversion model sensitivity decreases
tivities in the rock glacier (Fig. 5). High-resistivity zones with depth and towards lateral borders of ERT, and high-
(> 104 m) are mainly located underneath ridges of the rock resistivity contrasts can cause inversion artefacts in the model
glacier, reaching depths of 10–30 m below the surface. Low (Hilbich et al., 2009; Marescot et al., 2003). Nevertheless, the
resistivities (< 103 m) predominantly occur in and near to- mean thickness of ice-rich permafrost was roughly approxi-
pographic depressions close to the surface in all profiles or mated from the vertical dimensions of high-resistivity zones
below high resistivities at depths of approximately 40 m in of 15 ± 5, 20 ± 5 and 22 ± 7 m in the root zone, central area
both cross-profiles (C1 and C2) and below depths of 35 m in and both tongues, respectively (cf. interpreted structures in
the longitudinal profile L2 (Fig. 5) Fig. 5).
According to the heterogeneous pattern of resistivity
ranges as well as field observations of the surface debris 4.3.2 SRT results and interpretations
along the profiles, the resistivity ranges were interpreted
as follows: (i) low electrical resistivities (< 103 m) cor- All SRT profiles reveal a horizontal two-layer structure of
respond to unfrozen and wet subsurface conditions, and smoothly increasing P-wave velocities with depth (Fig. 6).
(ii) high electrical resistivities (> 104 m) close to the sur- P-wave velocities of < 600 m s−1 of the active layer reflect
face show dry unconfined sands and/or coarser debris with dry unconfined sands and pebble- to boulder-sized material
large voids, while high electrical resistivities (> 104 m) in close to the surface (< 3 m depth). Increasing velocities up
The Cryosphere, 15, 1187–1213, 2021 https://doi.org/10.5194/tc-15-1187-2021C. Halla et al.: Ice content and interannual water storage changes 1199 Figure 5. ERT of Dos Lenguas. (a) Cross-profile C1 of the root Figure 6. SRT of Dos Lenguas. (a) Cross-profile C1 of the root area. area. (b) Cross-profile C2 of the central rock glacier. (c) Longitu- (b) Cross-profile C2 of the central rock glacier. (c) Longitudinal dinal profile L1 of the northern tongue. (d) Longitudinal profile L2 profile L1 of the northern tongue. (d) Longitudinal profile L2 of the of the southern tongue. Note the different horizontal and vertical southern tongue. Note the different horizontal and vertical scales for scales for the different profiles. Absolute error: abs. error. the different profiles. to 1500 m s−1 at depths of 3–8 m indicate a more compacted table could either indicate higher water (vw = 1500 m s−1 ) and/or moister sandy material above the permafrost table. and lower ice content and/or be related to the vertical resolu- Inverted P-wave velocities of the lower layer have a wide tion of the smoothly inverted P-wave velocities. range from 1500 to 5000 m s−1 , thereby showing spatially Higher velocities were interpreted as ice-rich per- heterogeneous velocity distributions. The upper low-velocity mafrost (2500–4500 m s−1 ) and bedrock occurrences layer (< 1500 m s−1 ) indicates unfrozen areas, while the (> 4500 m s−1 ), where Dos Lenguas starts to split up (cf. intermediate- to high-velocity layer (1500–4500 m s−1 ) is in- Fig. 6b and c) and below the talus slope next to the root area terpreted as permafrost. The gradually increasing P-wave ve- (cf. Fig. 6a). However, a reliable discrimination between locities are partly vertically incised between higher P-wave frozen unconsolidated rocks, and bedrock is difficult due to velocities (cf. 2000 m s−1 isoline in Fig. 6), indicating the the large overlapping P-wave velocity ranges of permafrost transition from unfrozen debris to thawing permafrost be- (Draebing, 2016; Schrott and Hoffmann, 2008), volcanic tween 1500 and 2000 m s−1 during summer, which has been rocks (Schön, 2011) and the limited resolution capacity in observed on previous seismic surveys of rock glaciers in the the lowest parts of the models. Due to the ambiguities of study area (Croce and Milana, 2002; Schrott, 1994). The P- velocity patterns and resistivity distributions, the spatial wave velocities of the transition area around the permafrost delineations differ in some areas of the independently https://doi.org/10.5194/tc-15-1187-2021 The Cryosphere, 15, 1187–1213, 2021
You can also read