Deciphering the evolution of the Bleis Marscha rock glacier (Val d'Err, eastern Switzerland) with cosmogenic nuclide exposure dating, aerial image ...
←
→
Page content transcription
If your browser does not render page correctly, please read the page content below
The Cryosphere, 15, 2057–2081, 2021
https://doi.org/10.5194/tc-15-2057-2021
© Author(s) 2021. This work is distributed under
the Creative Commons Attribution 4.0 License.

Deciphering the evolution of the Bleis Marscha rock glacier (Val
d’Err, eastern Switzerland) with cosmogenic nuclide exposure
dating, aerial image correlation, and finite element modeling
Dominik Amschwand1,a , Susan Ivy-Ochs1,2 , Marcel Frehner1 , Olivia Steinemann2 , Marcus Christl2 , and
Christof Vockenhuber2
1 Department  of Earth Sciences, ETH Zurich, 8092, Zurich, Switzerland
2 Laboratory of Ion Beam Physics, ETH Zurich, 8093, Zurich, Switzerland
a now at: Department of Geosciences, University of Fribourg, 1700, Fribourg, Switzerland

Correspondence: Dominik Amschwand (dominik.amschwand@unifr.ch)

Received: 21 July 2020 – Discussion started: 10 August 2020
Revised: 21 January 2021 – Accepted: 25 February 2021 – Published: 26 April 2021

Abstract. We constrain the Holocene development of the            ders on a moving rock glacier ideally record time since depo-
active Bleis Marscha rock glacier (Err–Julier area, east-         sition on the rock glacier root but are stochastically altered by
ern Swiss Alps) with 15 cosmogenic nuclide exposure ages          boulder instabilities and erosional processes. This work con-
(10 Be, 36 Cl), horizontal surface creep rate quantification by   tributes to deciphering the long-term development and the
correlating two orthophotos from 2003 and 2012, and finite        past to quasi-present climate sensitivity of rock glaciers.
element modeling. We used the latter to separate the con-
trol on surface movement exerted by topography and ma-
terial properties. Bleis Marscha is a stack of three over-
riding lobes whose formation phases are separated by time
gaps expressed morphologically as over-steepened terrain          1   Introduction
steps and kinematically as a sharp downslope decrease in
surface movement. The three discrete formation phases ap-         Active rock glaciers are defined as “lobate or tongue-shaped
pear to be correlated to major Holocene climate shifts:           bodies of perennially frozen unconsolidated material super-
Early Holocene low-elevation lobes (∼ 8.9–8.0 ka, after the       saturated with interstitial ice and ice lenses that move downs-
Younger Dryas), Middle Holocene lobe (∼ 5.2–4.8 ka, after         lope or downvalley by creep as a consequence of the defor-
the Middle Holocene warm period), and Late Holocene high-         mation of ice contained in them and which are, thus, features
elevation lobes (active since ∼ 2.8 ka, intermittently coex-      of cohesive flow” (Barsch, 1996). Their active phase and de-
isting with oscillating Bleis Marscha cirque glacierets). The     velopment are conditioned by ice preservation, permafrost
formation phases appear to be controlled in the source area       conditions (Haeberli et al., 2006), and debris supply (Kenner
by the climate-sensitive accumulation of an ice-debris mix-       and Magnusson, 2017).
ture in proportions susceptible to rock glacier creep. The on-       In our current warming climate (Hock et al., 2019), ac-
going cohesive movement of the older generations requires         tive rock glaciers as the “visible expression of mountain per-
ice at a depth which is possibly as old as its Early–Middle       mafrost” (Barsch, 1996) receive considerable attention. Their
Holocene debris mantle. Permafrost degradation is attenu-         surface kinematics is considered to be diagnostic of the ther-
ated by “thermal filtering” of the coarse debris boulder man-     mal state of mountain permafrost (Delaloye et al., 2018),
tle and implies that the dynamics of the Bleis Marscha lobes      which is otherwise not directly observable. Rock glaciers
that once formed persisted over millennia are less sensitive      are thought to store significant water resources (Jones et al.,
to climate. The cosmogenic radionuclide inventories of boul-      2019) and to become more significant in the deglaciating
                                                                  mountains (Haeberli et al., 2017; Knight et al., 2019).

Published by Copernicus Publications on behalf of the European Geosciences Union.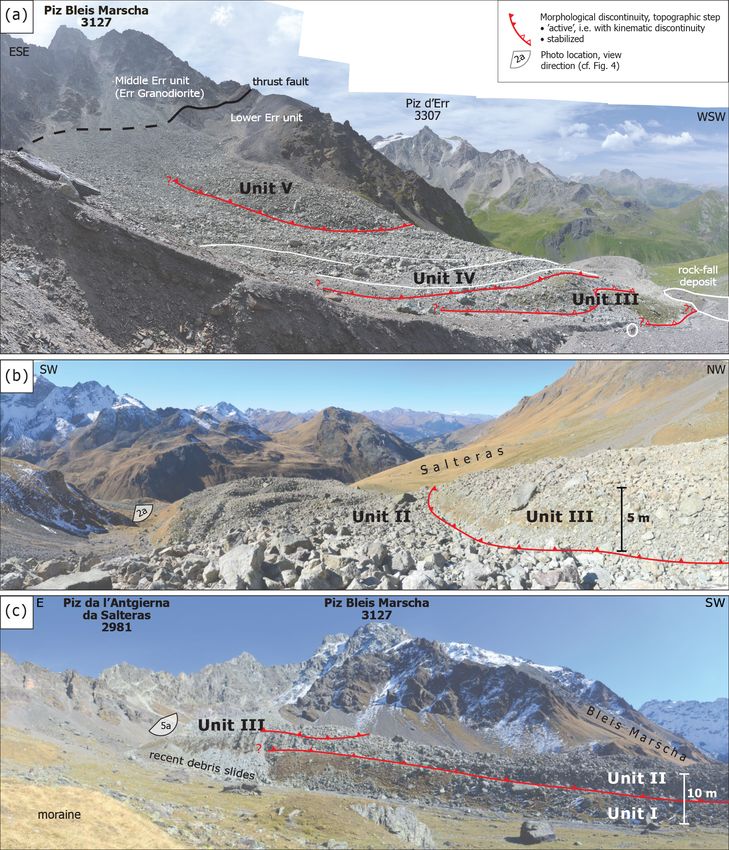
2058 D. Amschwand et al.: Deciphering the evolution of the Bleis Marscha rock glacier
In the literature, different views on the climate sensitiv-
ity of rock glaciers are proposed. One concept is that rock
glaciers respond in a delayed fashion to current warming be-
cause of the high thermal inertia of the ice-rich core and the
thermal decoupling from climate by the insulating effect of
the boulder mantle (active layer) (e.g., Haeberli et al., 2017;
Anderson et al., 2018) via the “thermal semi-conductor” ef-
fect (Harris and Pedersen, 1998; Humlum, 1998; Hanson and
Hoelzle, 2004). The ground cooling effect of a coarse debris
mantle (Schneider et al., 2012; Wicky and Hauck, 2017) fa-
vors a large negative thermal offset and more resilient per-
mafrost conditions even at mean annual ground temperatures
close to 0 ◦ C (Kellerer-Pirklbauer, 2019). Furthermore, the
creep of millennia-old rock glaciers is tied to the ice supersat-
uration of the debris and hence to the preservation of ice over
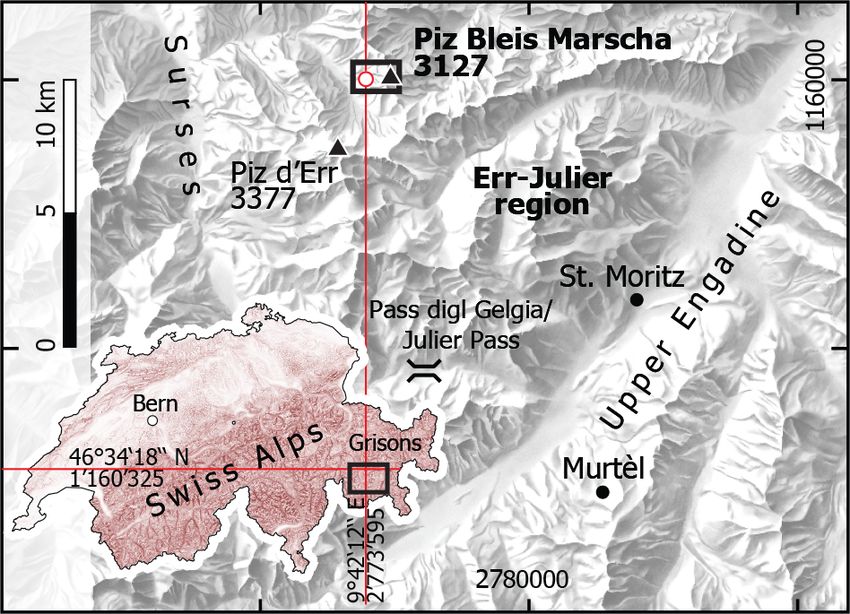
their entire lifetime (Barsch, 1996; Haeberli et al., 2003). Figure 1. Location of the Bleis Marscha rock glacier to the west be-
Another concept is the synchronous, rapid response to low Piz Bleis Marscha in the Err–Julier region, eastern Swiss Alps.
warming based on kinematic rock glacier monitoring. Many The rectangle shows the area covered by the geomorphological map
rock glaciers across the Alps show a common behavior (Fig. 3). Inset map: location and extent (black rectangle) of the Err–
of surface creep rates with (sub-)seasonal fluctuations (De- Julier regional map within Switzerland and the coordinates of the
laloye et al., 2010). These decennial to annual changes in sur- lowermost front of the Bleis Marscha rock glacier (maps reproduced
face creep rates respond within months to changing summer with the authorization of the Swiss Federal Office of Topography,
swisstopo).
air temperature, snow cover timing (Noetzli et al., 2019), and
water in the shear layer (Cicoira et al., 2019). Rock glacier
formation can occur within centuries (Humlum, 1996) or
In this study, our focus is on the Bleis Marscha rock glacier
under very specific topo-climatic conditions even within
located in the Err–Julier area, eastern Swiss Alps (Fig. 1).
decades (Scotti et al., 2017). Debris pulses or “surge pack-
Previous relative dating studies based on Schmidt-hammer
ages” (Kenner et al., 2014), as well as significant accelera-
rebound values, as well as the thickness and chemical com-
tion and destabilization (Marcer et al., 2019) up to sudden
position of weathering rinds, suggest a development through
collapse (Bodin et al., 2016), are reported.
the entire Holocene (Frauenfelder et al., 2001, 2005; Laustela
The response of rock glaciers to external forcing such as
et al., 2003). We exposure dated 15 boulders along a longitu-
air temperature, precipitation, snow cover, weathering in-
dinal transect from the lowermost front up to the transition
tensity, debris supply, and interactions with glaciers (e.g.,
towards the talus with the cosmogenic radionuclides 10 Be
pushing ice, altered thermal conditions by insulation, glacial
and 36 Cl. To our knowledge, this is the first study that ex-
debris sources) are insufficiently understood. Furthermore,
posure dates boulders on an active, presently moving rock
their external response is difficult to disentangle from in-
glacier lobe in the Alps. The exposure ages are interpreted in
ternal thermomechanical and topographic feedbacks. Histor-
light of field observations, modern surface creep rate quan-
ical records are sparse and too short compared to typical
tification through image correlation, and numerical finite el-
rock glacier lifetimes, activity phases, and response periods.
ement modeling to unveil periods of activity and the devel-
To resolve long-term effects on rock glacier development
opment of the Bleis Marscha rock glacier. This work con-
(Kenner and Magnusson, 2017) and to put the present-day
tributes to deciphering the long-term development and the
morphology reflecting the lifelong dynamic history of active
past to quasi-present climate sensitivity of rock glaciers
rock glaciers and (relict) rock glacier deposits in a climate-
sensitivity context (Frauenfelder and Kääb, 2000), their ac-
tivity phases need to be placed in a chronological framework. 2 Study site
Cosmogenic radionuclide concentrations record all periods
of exposure of the rock surface to cosmic rays. In principle, The studied Bleis Marscha rock glacier (WGS 84:
they are a suitable tool for deriving numerical exposure ages 46◦ 340 1800 N, 9◦ 420 1200 E; CH1903+/LV95: 2773595,
for boulders on the landform surface (Ivy-Ochs and Kober, 1160326) lies on the eastern slope of the upper Val d’Err,
2008). The technique has been applied to (relict) rock glacier a side valley of the Surses (Oberhalbstein) in the Err–Julier
deposits or related periglacial landforms, e.g., by Ivy-Ochs area, Grisons, eastern Swiss Alps (Fig. 1). The rock glacier
et al. (2009), Böhlert et al. (2011a, b), Moran et al. (2016), originates in a north-northwest-oriented cirque of Piz Bleis
Denn et al. (2017), and Steinemann et al. (2020). Relict and Marscha (3127 m a.s.l.).
active rock glacier deposits in Iceland were exposure dated The Err–Julier area lies in the rain shadow of the Lep-
by Fernández-Fernández et al. (2020). ontine, Bernese, and Glarus Alps resulting in a dry-cold,
The Cryosphere, 15, 2057–2081, 2021 https://doi.org/10.5194/tc-15-2057-2021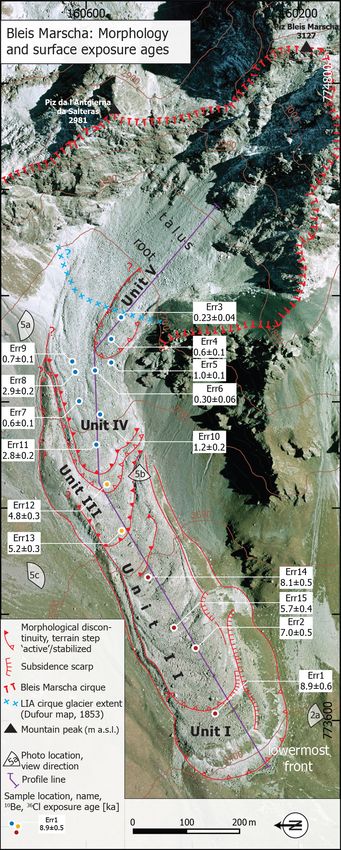
D. Amschwand et al.: Deciphering the evolution of the Bleis Marscha rock glacier                                           2059

continental-type climate. Frauenfelder et al. (2001) report       material properties (e.g., ice content at depth) on the surface
low mean annual precipitation (MAP) of 900–1000 mm a−1            movement.
(1971–1990), a regional lapse rate of 0.55 ◦ C/100 m, and
a mean annual 0 ◦ C isotherm at ca. 2180 m a.s.l. Val d’Err       3.1   Field work and landform analysis
is a high valley with the valley floor at an elevation
above 2000 m a.s.l. and surrounding peaks rising to over          Field mapping was performed in August 2017, focusing on
3000 m a.s.l. The present-day lower limit of permafrost oc-       Quaternary geology and geomorphology. Fieldwork was car-
currence is roughly at 2400 m a.s.l. (Gruber et al., 2006;        ried out at the scale of 1 : 5000 following standard geomor-
Boeckli et al., 2012; Kenner et al., 2019).                       phological mapping procedures as outlined in Chandler et
   The north-northwest- to south-southeast-oriented valley        al. (2018). Details of the landform and sediments of vari-
lies in a tectonically complex zone between the Upper Pen-        ous sectors of the rock glacier were characterized, in concert
ninic Platta nappe overlain by the Lower Austroalpine Err         with digital elevation model (DEM) analysis, to subdivide
nappe. The debris-supplying headwalls (in the Tschirpen unit      Bleis Marscha into different lobes. Especially distinguishing
of the Err nappe) are composed of post-Variscan granitoids        were lichen coverage (leading to pale vs. dark appearance
and Permo-Triassic to Lower Cretaceous sediments (mostly          of the blocks) and general freshness of the blocks, the loca-
slate and carbonates), separated by a thrust fault outcrop-       tion of ridges and furrows, and the presence of steep steps
ping subhorizontally along the cirque walls (Cornelius, 1932;     on the rock glacier, as well as the dominant size and round-
Frauenfelder et al., 2005).                                       ing of blocks. Crosscutting relationships with talus and rock-
   During the Last Glacial Maximum (LGM) around 24 ka             fall deposits, moraines, and the past location of the cirque
(Ivy-Ochs, 2015), the area was covered up to an elevation of      glacier were also examined based on historical maps. Land-
∼ 2800 m a.s.l. by ice flowing northwards from the nearby         form interpretation was supported by aerial and DEM data
Engadine ice dome (Inn–Danube river catchment) into the           on an iPad with the Garafa GIS Pro application accessed
Rhine glacier system (Bini et al., 2009). Prominent pre-          in the field. Photos taken in the field and locations of boul-
sumed late-glacial (Egesen) moraines along the valley flanks      ders sampled for cosmogenic nuclide exposure dating were
(Schlosser, 1990; Frauenfelder et al., 2001) suggest that the     thus automatically georeferenced. Orthorectified aerial im-
upper Val d’Err, including our study site, was likely last oc-    ages (0.25×0.25 m resolution) and the high-resolution DEM
cupied by a glacier during the Egesen stadial (12.9–11.7 ka;      swissALTI3D provided by the Swiss Federal Office of To-
Ivy-Ochs, 2015). The Bleis Marscha cirque was occupied by         pography (swisstopo) served for topographic analysis and vi-
a glacieret during the Little Ice Age (LIA) and up until re-      sualization. The DEM, derived from aerial images acquired
cently (Dufour, 1853; Frauenfelder et al., 2001).                 in 2016, is gridded on 2 × 2 m cells and has an accuracy
                                                                  of ±1–3 m (1σ level, all three dimensions) for areas above
                                                                  2000 m a.s.l. Extraction of swath profiles and morphomet-
                                                                  ric calculations were carried out with the MATLAB tool-
3   Material and methods                                          box TopoToolbox 2 (Schwanghart and Scherler, 2014) and
                                                                  the open-source software QGIS.
The morphology of rock glaciers, in which process and form
are intrinsically linked via deformation by creep, largely pre-   3.2   10 Be   and 36 Cl exposure dating
serves the cumulative deformation history over the lifetime
of the landform (Frauenfelder and Kääb, 2000). The concept        Boulders suitable for exposure dating are large (> 1.5 m side
of rock glacier formation and the conveyor-belt-like advance      length) and in a stable position; suitable rock surfaces do not
mechanism form the theoretical groundwork on how surface          show signs of fast weathering or spalling. A total of 15 boul-
boulders move compared to the rock glacier as a whole (out-       ders on the rock glacier surface were sampled with hammer,
lined in Sect. 5.1–5.2). The subdivision in geomorphologi-        chisel, and battery-powered saw according to the guidelines
cally defined units of the polymorphic (sensu Frauenfelder        of Ivy-Ochs and Kober (2008) and field observations. Topo-
and Kääb, 2000) Bleis Marscha rock glacier, assisted by an        graphic shielding, dip, and dip direction of sampled surfaces
estimate of modern surface creep rates from aerial image          were measured using a compass and clinometer. The sam-
correlation, provides a framework for the discussion and in-      ples (∼ 0.5 kg of rock material each) were collected close to
terpretation of the exposure ages. Topographic maps, aerial       the central flow line from the lowermost front up to the high-
photographs, digital elevation models (DEMs), geomorpho-          elevation active lobes, preferentially on ridges to minimize
logical field mapping, surface exposure dating, and finite el-    topographic and snow shielding (Böhlert et al., 2011b) and
ement (FE) modeling form the data basis to reconstruct the        towards the frontal upper edge of each morphologically iden-
Bleis Marscha development. Surface exposure ages of 15            tified lobe (Haeberli et al., 2003; Steinemann et al., 2020). A
boulders of the rock glacier deposit were determined with         total of 14 samples were Err Granodiorite (for quartz, 10 Be;
the cosmogenic radionuclides 10 Be and 36 Cl. FE modeling         Table 1); only one Main Dolomite boulder for 36 Cl met the
separates the control of topography (e.g., surface slope) and     sampling criteria (Table 2).

https://doi.org/10.5194/tc-15-2057-2021                                                  The Cryosphere, 15, 2057–2081, 2021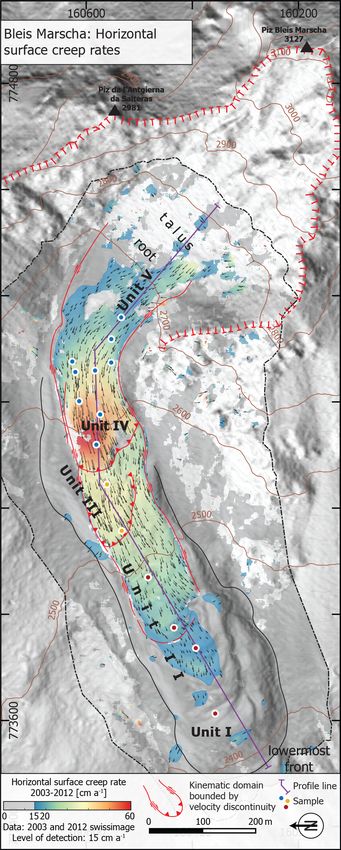
2060                                                   D. Amschwand et al.: Deciphering the evolution of the Bleis Marscha rock glacier

Table 1. The 10 Be sample information of the Bleis Marscha rock glacier boulders (Err Granodiorite) with location, sample information,
blank-corrected AMS 10 Be concentration, and calculated exposure age.

                  Sample       Latitude       Longitude         Elevation         Sample        Shielding                     10 Be        Exposure agec ,
                  name                                                          thickness         factora         concentrationb         erosion corrected
                                      ◦N               ◦E          m a.s.l.           cm                –         104 atoms g−1                          a
                  Err1          46.5719            9.7036              2448             1.5         0.9739       23.584 ± 1.216          8948 ± 466 (636)
                  Err2          46.5723            9.7053              2482             1.5         0.9751       18.992 ± 1.004          7027 ± 374 (505)
                  Err15         46.5727            9.7057              2483             1.0         0.9582       15.257 ± 0.771          5697 ± 290 (399)
                  Err14         46.5730            9.7070              2498             2.0         0.9484       21.366 ± 0.638          8076 ± 243 (460)
                  Err13         46.5734            9.7081              2529             2.0         0.9502       14.027 ± 0.659          5169 ± 244 (349)
                  Err12         46.5737            9.7093              2552             1.5         0.9476       13.234 ± 0.654          4796 ± 238 (332)
                  Err11         46.5738            9.7102              2583             1.5         0.9450        7.819 ± 0.277           2774 ± 99 (166)
                  Err10         46.5737            9.7110              2612             1.5         0.9211        3.308 ± 0.425          1181 ± 152 (162)
                  Err7          46.5740            9.7113              2623             1.5         0.9365        1.854 ± 0.161             646 ± 56 (64)
                  Err6          46.5738            9.7120              2643             2.0         0.9406        0.860 ± 0.183             295 ± 63 (64)
                  Err9          46.5742            9.7124              2650             1.5         0.9204        2.083 ± 0.213             727 ± 74 (82)
                  Err5          46.5735            9.7122              2647             1.5         0.9428        2.940 ± 0.202            1001 ± 69 (84)
                  Err4          46.5735            9.7127              2665             2.0         0.9392        1.642 ± 0.154             556 ± 52 (59)
                  Err3          46.5733            9.7133              2680             1.8         0.9259        0.673 ± 0.115             229 ± 39 (41)
               a Shielding correction includes the topographic shielding due to surrounding landscape and the dip of the sampled surface.
               b AMS measurement errors are at 1σ level and include the AMS analytical uncertainties and the error of the subtracted blank. Measured ratios
               were measured against the in-house standard S2007N which is calibrated to 07KNSTD.
               c Exposure age errors are internal errors (uncertainties represent 1σ confidence range comprising AMS counting errors and errors based on the
               normalization to blanks and standards). External errors are given in parentheses. Erosion correction for a surface erosion rate of 1 mm kyr−1 .

Table 2. The 36 Cl sample information of the Bleis Marscha rock glacier boulder (Main Dolomite) with location, sample information, blank-
corrected AMS 36 Cl concentration, and calculated exposure age.

   Sample name          Latitude       Longitude         Elevation         Sample        Shielding                  Cl in                 36 Cl           Exposure agec ,
                                                                         thickness         factora                  rock      concentrationa,b          erosion corrected
                               ◦N               ◦E          m a.s.l.           cm                –                  ppm        106 atoms g−1                            a
   Err8                 46.5741            9.7120             2643               1.5          0.937       49.63 ± 0.09           0.313 ± 0.014          2890 ± 130 (181)
 a Concentration measured against 36 Cl/Cl standard K382/4N (Christl et al., 2013; Vockenhuber et al., 2019).
 b Sample ratio corrected for laboratory blank of (2.5 ± 0.4) × 10−15 36 Cl/35 Cl.
 c Production rates as in Alfimov and Ivy-Ochs (2009) and references therein. Erosion correction for a surface erosion rate of 5 mm kyr−1 (karst weathering/corrosion).

   The 10 Be sample preparation followed Kronig et                                          online calculator (Balco et al., 2008) with the northeast-
al. (2018). The ratio of 10 Be/9 Be is measured with the                                    ern North America (NENA) 10 Be production rate of 3.87 ±
600 kV Tandy at the ETH Zurich accelerator mass spec-                                       0.19 atoms g−1 a−1 and the scaling model by Lal (1991) and
trometry (AMS) facility (Christl et al., 2013). The in-house                                Stone (2000). The shielding parameters were calculated with
standard S2007N, which is calibrated against the 07KN-                                      the “online calculators formerly known as the CRONUS-
STD, was used. For 36 Cl extraction from the dolomite sam-                                  Earth online calculators” (Balco et al., 2008; http://hess.
ple (Err8), the method of isotope dilution was employed                                     ess.washington.edu/math, last access: 22 April 2021). The
(Ivy-Ochs et al., 2004). Concentrations of major and trace                                  NENA production rate has been shown to be well appli-
elements were measured by ICP-MS (inductively coupled                                       cable for the Alpine area (Claude et al., 2014). The 36 Cl
plasma mass spectrometry) at Actlabs (Ontario, Canada) (Ta-                                 surface exposure age was computed with a LIP in-house-
ble 3). AMS measurements were conducted with the 6 MV                                       developed MATLAB program based on the equations and
Tandem accelerator (Synal et al., 1997; Vockenhuber et al.,                                 constants given in Alfimov and Ivy-Ochs (2009, and refer-
2019) of the Laboratory of Ion Beam Physics (LIP), ETH                                      ences therein). The 36 Cl production in dolomite is dominated
Zurich.                                                                                     by the spallation of Ca, muon interactions with Ca, and low-
   The 10 Be surface exposure ages were calculated from                                     energy neutron capture reflecting the high natural Cl concen-
the blank-corrected data (long-time laboratory blank of                                     tration (Err8: 49.6 ± 0.1 ppm; Table 2). The following pro-
10 Be/9 Be = (3.2 ± 1.4) × 10−15 ) using the CRONUS-Earth                                   duction rates were used: 48.8 ± 3.4 36 Cl atoms g−1 a−1 for

The Cryosphere, 15, 2057–2081, 2021                                                                                    https://doi.org/10.5194/tc-15-2057-2021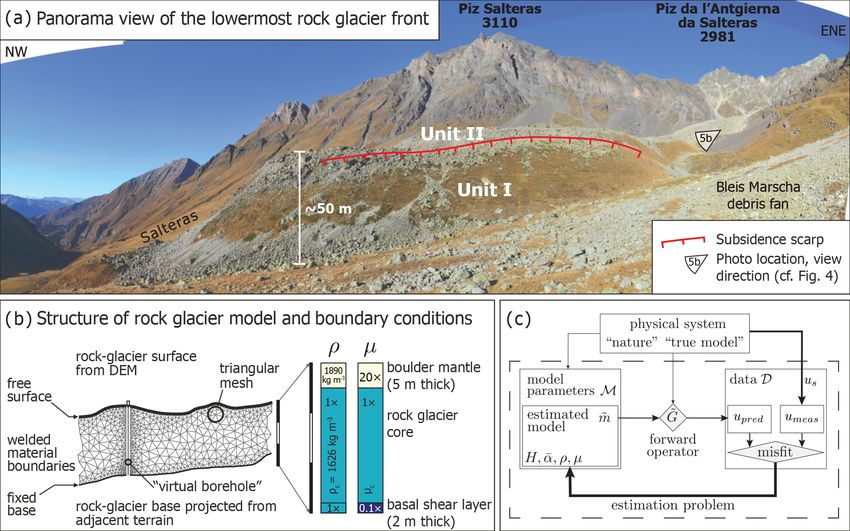
D. Amschwand et al.: Deciphering the evolution of the Bleis Marscha rock glacier                                                     2061

Table 3. Elemental composition of the dolomite sample Err8.

      SiO2    Al2 O3    Fe2 O3   MnO      MgO      CaO        Na2 O   K2 O    TiO2   P2 O5      LoI       Sm     Gd     Th      U
      %            %         %     %        %        %           %      %        %       %       %       ppm    ppm    ppm    ppm
      0.45      0.35      0.26    0.06    20.39   31.88        0.06   0.10    0.01     0.01   46.12      0.20   0.10   0.20   6.70

spallation in Ca and 5.3 ± 1.0 36 Cl atoms g−1 a−1 for muon            3.4    Finite element modeling
capture in Ca at the rock surface. A neutron capture rate of
760 ± 150 neutrons g−1air (Alfimov and Ivy-Ochs, 2009) was
                                                                       The surface movement of a rock glacier integrates the over-
implemented. We used the Lal and Stone scaling of the pro-             all vertical deformation profile (e.g., Müller et al., 2016). An
duction rates to the site latitude, longitude, and elevation           appropriate flow law – a mathematical formulation of the
(Balco et al., 2008).                                                  governing deformation process – allows us in principle to in-
   We report and discuss exposure ages with an erosion                 fer from (known, observable) surface properties (e.g., surface
rate of 1 mm kyr−1 for the crystalline samples (10 Be) and             deformation) to (unknown) effective material parameters and
5 mm kyr−1 for the dolomite sample (36 Cl). Snow-cover cor-            structures at depth.
rections are omitted as such corrections would increase the               The first-order deformation of rock glaciers is governed
exposure ages by only a few percent (by 6 % for 50 cm of               by gravity-driven steady-state creep of its ice-bonded interior
snow during 6 months of a year). The reported errors are at            (Müller et al., 2016). In the case of ice supersaturation, the
the 1σ level including analytical uncertainties of the AMS             deformable (excess) ice leads to stress transfer in space and
measurements and the blank correction (internal errors).               time and thus to a cohesive surface creep rate pattern, a di-
                                                                       agnostic feature of active rock glaciers. Creep of permafrost
                                                                       can be approximately described by Glen’s flow law for poly-
3.3   Estimation of modern surface creep rates
                                                                       crystalline ice (Haeberli et al., 2006), establishing a constitu-
                                                                       tive power-law relationship between shear stresses τ (Pa) and
We quantify the horizontal surface creep rate with the cross-          shear strain rates ε̇ (s−1 ). To illustrate the problem, consider
correlation of orientation images (Fitch et al., 2002) de-             the surface speed us (m s−1 ) of an infinite, parallel-sided slab
rived from two ortho-images with the MATLAB tool Im-                   calculated with Glen’s flow law,
GRAFT (Messerli and Grinsted, 2015). The orthophoto mo-
saic swissimage 25 cm is a composite of orthorectified digital                 2A
color aerial photographs, provided by the Swiss Federal Of-            us =       (ρg sin ᾱ)n H n+1 ,                                (1)
                                                                              n+1
fice of Topography (swisstopo). Ground resolution is given
as 0.25 m and positional accuracy as ±0.25 m.                          with flow rate factor A (Pa−n s−1 ) related to dynamic vis-
                                                                                      τ
   The orientation correlation method developed by Fitch et            cosity µ := 2ε̇  = (2Aτ n−1 )−1 (Pa s), stress exponent n (–),
al. (2002) is a feature-based method of translatory image              density ρ (kg m−3 ), average surface slope ᾱ (◦ ), thickness H
matching that correlates the orientation of the image inten-           (m), and gravitational acceleration g (9.81 m s−2 ). However,
sity gradients. Orientation images are normalized and invari-          Eq. (1) is underdetermined, and no unique solution exists.
ant to pixel brightness, making the method more robust and             A simultaneous determination of material properties (den-
less susceptible to different illumination in the images. We           sity, viscosity) and structure (thickness) is not possible. This
derived the orientation images from the R band of the RGB              inverse problem requires regularization to become solvable;
images.                                                                i.e., all but one of these parameters need to be estimated in-
   The post-processing steps are noise filtering to remove             dependently.
erroneous matches and smoothing to attenuate small-scale                  The rock glacier model is mechanically described by the
and thus likely short-lived creep rate variations. A minimum           model parameters H , ᾱ, ρ, and µ. We invert for effective
correlation coefficient of 0.6 and a conservative signal-to-           dynamic viscosity µ from known surface slope ᾱ and sur-
noise ratio threshold of 6 sufficed to remove incoherent and           face speed us . We regularize the inverse problem by a priori
poor-quality displacement vectors. The optimal template size           prescribing density ρ and thickness H , parameters that can
of 51 × 51 pixels was found using a procedure based on                 be reasonably well estimated from the literature knowledge
Debella-Gilo and Kääb (2012). The search window size of                and field observations (Fig. 2a). In the absence of any Bleis
211 × 211 pixels was defined with the recommendations of               Marscha rheological borehole data to constrain the power-
Messerli and Grinsted (2015). The modal displacement of the            law exponent n of the effective viscous flow law, we pro-
presumably stable adjacent off-rock glacier areas defined the          ceed by a forward operator that implements the simplest
significance level, which is the threshold below which any             temperature-independent (isothermal) linear viscous (New-
measured displacement is not distinguishable from immobil-             tonian) material (n = 1). The system of force-balance and
ity.                                                                   constitutive equations are solved numerically in two dimen-

https://doi.org/10.5194/tc-15-2057-2021                                                       The Cryosphere, 15, 2057–2081, 2021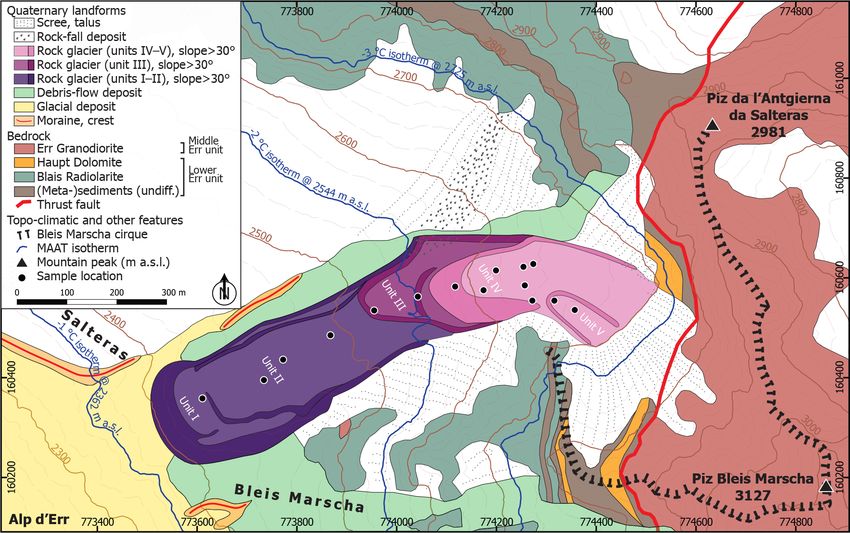
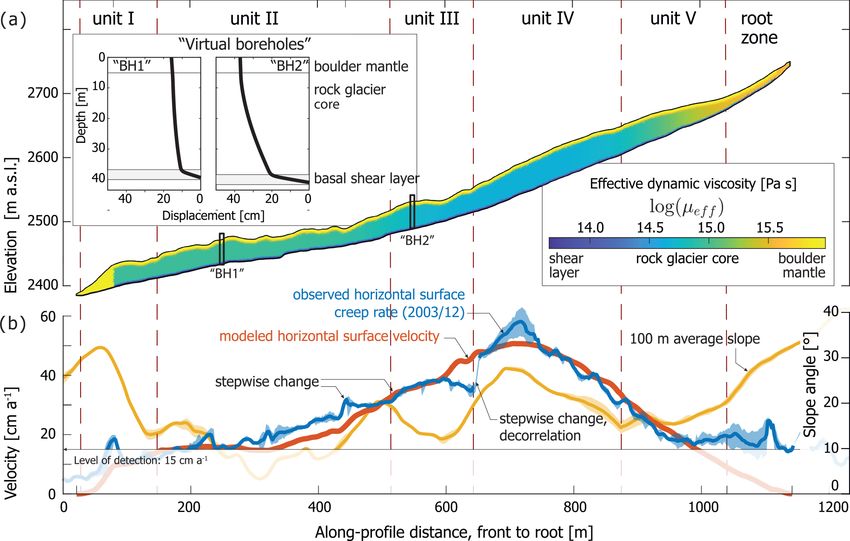
2062                                        D. Amschwand et al.: Deciphering the evolution of the Bleis Marscha rock glacier

Figure 2. (a) Side view of the lowermost front, rising 30–50 m above the Salteras trough shoulder (see Fig. 4 for photo location and view
direction). A stabilized, grassy sidewall extends upstream beneath younger lobes. The southernmost fringe is subsiding possibly due to ice
loss. (b) Finite element (FE) model setup, triangular mesh (Shewchuk, 1996), boundary conditions, and prescribed ratios of density ρ and
dynamic viscosity µ (profiles). The surface boundary is the well-constrained elevation along a longitudinal profile, extracted from the DEM
as a swath profile with TopoToolbox. The a priori prescribed density and viscosity ratios create the characteristic mechanical layering of rock
glaciers with a stiff, high-viscosity boulder mantle, deformable core, and weak, low-viscosity basal layer. (c) Inverse problem structure with
the model parameters m̃ that are linked to the observable data us via the discrete forward operator G̃, the FE model. The model predicts a
synthetic surface velocity upred from the mechanical parameters that control the rock glacier creep: thickness H , average surface slope ᾱ,
density ρ, and dynamic viscosity µ. A combination of parameter values for (H, ᾱ, ρ, µ) that produces synthetic surface velocities upred
whose misfit to the observed data umeas is equal to or smaller than the measurement uncertainties is one solution to the inverse problem.
Starting from an initial guess, the rock glacier model m̃ = (H, ᾱ, ρ, µ) is iteratively refined until a solution is found (estimation problem).

sions along the central flow line with the numerical FE code              by the ice-bearing interior that comprises the rock glacier
presented in Frehner et al. (2015).                                       core and the basal shear layer. (2) The ice-rich rock glacier
   Direct evidence from over-steepened rock glacier fronts,               core consists of a perennially frozen mixture of ice, debris,
borehole deformation measurements (Arenson et al., 2002),                 and fine material. (3) A fine-grained shear layer a few me-
and indirect geophysical investigations (Springman et al.,                ters thick concentrates 60 %–90 % of the total displacement.
2012) suggests a pronounced thermomechanical layering of                  Its higher deformation susceptibility, arising from the weak-
rock glaciers. A robust finding is that the deforming part can            ening effect of liquid water at grain boundaries, is in our
be divided into a sequence of three layers: surface boulder               model accounted for by a lower viscosity. Boulder mantle,
mantle, rock glacier core, and shear layer (Haeberli et al.,              core, and shear layer lie on an immobile substratum of debris
2006; Frehner et al., 2015; Cicoira et al., 2021). (1) The sea-           or bedrock.
sonally frozen ice-free or ice-poor surface layer consists of a              Over-steepened terrain steps, exposing the uppermost few
matrix-poor, clast-supported framework of large, interlocked              meters of the stratigraphy, show the coarse boulder mantle
boulders (∼ active layer). Discrete movements of blocks in                over the finer-grained rock glacier core (see field observa-
the boulder mantle are negligible compared to the total sur-              tions in Sect. 4.1). Although no borehole deformation data
face movement (but not with respect of inventories of cosmo-              are available for Bleis Marscha to confirm the presence of
genic nuclides; see Sect. 5.2). Deformation is accommodated               a shear layer, it is very likely that this typical rock glacier

The Cryosphere, 15, 2057–2081, 2021                                                             https://doi.org/10.5194/tc-15-2057-2021
D. Amschwand et al.: Deciphering the evolution of the Bleis Marscha rock glacier                                             2063

feature (Arenson et al., 2002) does exist there. We approxi-      rock glacier model with a uniform viscosity of pure ice for
mate the deforming part of the rock glacier as a three-layer      the entire rock glacier core, µ0c = 2 × 10¹³ Pa s, as an initial
system consisting of a 5 m thick boulder mantle, 30–40 m          guess. Next, we compute synthetic surface velocity data by
thick core, and a 3 m thick low-viscosity basal shear layer.      means of the discretized forward operator, carried out by the
The (variable) total thickness is estimated as follows. The       numerical FE code (Fig. 2c). The synthetic data predicted
model top boundary is the rock glacier surface given by the       by the current model are visually compared to the measured
DEM, implemented as a free surface (Fig. 2b). The bottom          data, the orthophoto-derived surface creep rates. For rock
boundary is defined by a fixed, no-slip boundary to the im-       glacier parts where the misfit between synthetic and mea-
mobile substratum. Its elevation is projected from the adja-      sured data exceeds the data uncertainty, the viscosity is either
cent terrain at the rock glacier front where the rock glacier     increased if synthetic velocities were too high compared to
rises from the Salteras trough shoulder (Fig. 2a; cf. Kääb and    measured values (upred > umeas ) or decreased in the opposite
Reichmuth, 2005; Scapozza et al., 2014) and parallel to the       case (upred < umeas , estimation problem). The obtained rock
average rock glacier surface in the upper stretches. All lay-     glacier viscosity distribution, m̃, that plausibly explains the
ers including the boulder mantle effectively obey a viscous       measured surface creep rates, umeas , within their uncertainty
flow law and are separated by no-slip boundaries (dynami-         is one solution to the inverse problem.
cally coupled, “welded”) (Arenson et al., 2002; Springman
et al., 2012; Frehner et al., 2015).
   We estimate the density of the rock glacier materi-            4     Results and interpretation
als as the weighted average of the density of its con-
stituents (Müller et al., 2016), namely debris (Err Gra-          4.1    Geomorphology of Bleis Marscha
nodiorite, ρdebris = 2700 kg m−3 ), ice (ρice = 910 kg m−3 ),
and air (ρair = 1 kg m−3 ). For the approximately void-           The Bleis Marscha rock glacier is a tongue-shaped
free rock glacier core with 60 vol % ice, we obtain ρc =          multi-unit or polymorphic (sensu Frauenfelder and Kääb,
1626 kg m−3 , and for the boulder mantle with 30 vol % air        2000) talus rock glacier at an elevation range of 2400–
ρm = 1890 kg m−3 (Barsch, 1996; Fig. 2b). The effect of           2700 m a.s.l. (Fig. 3). With a length of 1100 m, a width of
water on density is insignificant. The prescribed viscosity       150–200 m, a surface area of ∼ 2.4 × 10⁵ m2 , and a source
ratios between the different layers are rock glacier core to      area of ∼ 3.1 × 10⁵ m2 , it ranks among the largest rock
high-viscosity boulder mantle 1 : 20 (estimated from domi-        glaciers in the Err–Julier area. Based on an assumed mean
nant wavelength of furrow-and-ridge microtopography; see          thickness of 30–40 m, we estimate a total volume of ∼ (7–
back-of-the-envelope calculation below; Fig. 2b) and core         10) × 106 m3 .
to low-viscosity basal shear layer 10 : 1 (conservative as-          The rock glacier boulder mantle consists of three main
sumption from the literature; Cicoira et al., 2021, and ref-      rock types, each with its source in different parts of the cirque
erences therein). To estimate the effective viscosity ratio R     headwall (Fig. 3; Cornelius, 1932): prevalently weathering-
between the rock glacier mantle and core, we use an analyt-       resistant Err Granodiorite, followed by Blais Radiolarite
ical formula based on buckle-folding theory that we apply         and tectonically fractured Main Dolomite. Weathering-prone
to the furrow-and-ridge microtopography on units I–II (see        lithologies such as rauhwacke (cellular dolomite), conglom-
Sect. 4.1; equation modified for one-sided support from Biot,     erate, limestone, and shales occur only in lenses or thin seams
1961; cf. Frehner et al., 2015):                                  in the headwall and are only rarely found on the rock glacier
                                                                  surface. Block volumes are typically between 0.5–50 m3 . Av-
            3 λd 3

       µm                                                         erage block diameter is 1–2 m, exceptionally with > 10 m
R :=      =          .                                     (2)    edge length. The size of the largest blocks increases down-
       µc   8 π hm
                                                                  stream towards the lowermost front. Downstream, the rock
The viscosity ratio R can be calculated from the dominant         glacier rises over and is disconnected from the surrounding
wavelength λd and rock glacier mantle thickness hm . Insert-      terrain.
ing λd = 50 m and hm = 4 m (estimates from field observa-            Observations such as overall debris color reflecting dif-
tions), we roughly estimate R = 24.                               ferences in freshness of the sediment (weathering of the
   The susceptibility for steady-state creep of debris-ice mix-   Err Granodiorite and lichen coverage), degree of soil devel-
tures depends on debris-ice proportions (specifically the de-     opment, and internal steep frontal terrain steps (slope an-
gree of ice supersaturation, i.e., the ice volume exceeding the   gle > 30◦ ) allows us to subdivide the complex rock glacier
pore volume), fabric, particle size, temperature, and water       into five different morphological units (Fig. 3) sensu Barsch
content (Moore, 2014). Since the influence of each parame-        (1996). These are labeled unit I (the lowest elevation, frontal
ter is difficult to disentangle and the material properties and   part) to unit V (the highest elevation lobe). We interpret
composition are not known at this level of detail, we absorb      over-steepened terrain steps as marking internal boundaries
these contributions by the effective viscosity, µ, and estimate   in the rock glacier related to overriding of lower lobes by
it by solving the inverse problem. We depart from an initial      higher lobes. The lower lobes must originally have been con-

https://doi.org/10.5194/tc-15-2057-2021                                                 The Cryosphere, 15, 2057–2081, 2021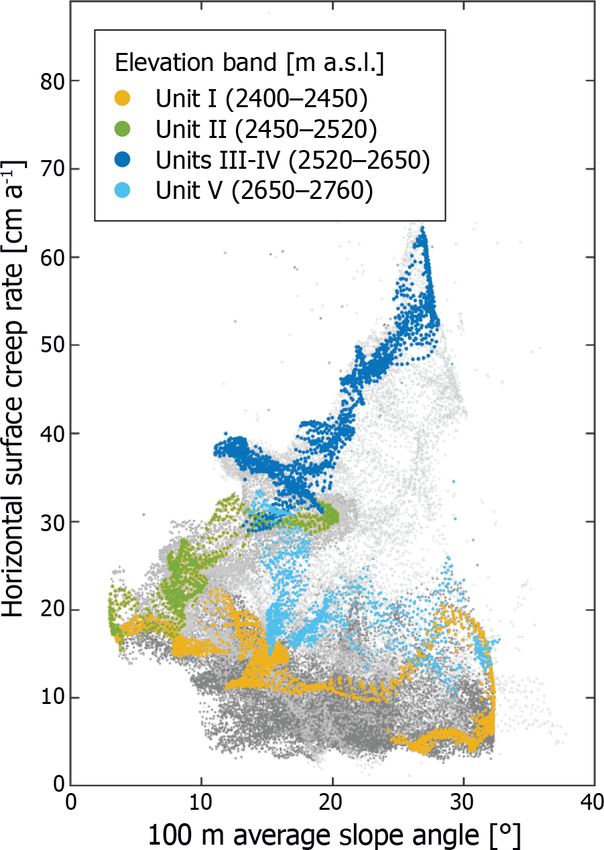
2064                                      D. Amschwand et al.: Deciphering the evolution of the Bleis Marscha rock glacier

Figure 3. Quaternary features and main lithologies in the Bleis Marscha cirque. Bedrock map modified from Cornelius (1932). A subhorizon-
tal thrust separates the crystalline Middle Err unit from the sedimentary Lower Err unit. Present-day mean annual air temperature (MAAT)
isotherms are drawn according to Frauenfelder et al. (2001).

nected to the talus slopes in the Bleis Marscha cirque, the            Fig. 2a). Where unit II rests on unit I, it is recessed by ∼ 5 m
only source of Err Granodiorite, as testified by the domi-             forming a ledge along the sides (Fig. 5c). The boulder weath-
nance of Err Granodiorite (> 80 vol %) increasing towards              ering and abundance of black and green lichen give the lower
the lowermost rock glacier front. In theory then, the lower            lobes (units I–II) a much darker brownish-gray appearance in
lobes in part underlie the overriding higher lobes. Along its          comparison to the higher elevation lobes. Blocks in units I–II
lower part (units I–II), the rock glacier lies on a till-mantled       are subangular to subrounded; weathering of the Err Gran-
bedrock step (trough shoulder) known as Salteras. Schlosser            odiorite blocks plays an important role. The surface of unit II
(1990) mapped a right-lateral moraine near the trough shoul-           is gently inclined (∼ 10◦ ) with a well-developed furrow-
der break in slope (Fig. 3) and interpreted it as belonging            and-ridge microtopography of downstream crescent-shaped
to the Egesen stadial. The moraines and the rock glacier are           transverse ridges that are regularly spaced ∼ 50 m apart and
nowhere in contact.                                                    separated by < 5 m deep furrows (Fig. 5b). The mean rock
   The lowermost front of the Bleis Marscha rock glacier               glacier surface slope and presumably also the basal slope
rises roughly 30–50 m from the edge of the Err valley trough           steepen from ∼ 10 to 20◦ at an elevation of 2500 m a.s.l.
shoulder at an elevation of 2380 m a.s.l. (Fig. 2a). The frontal       causing units I–II to decelerate. The break in slope induced
part, denoted as unit I (Figs. 3, 4), exhibits several features        along-flow compressive stresses (Fig. 5b). Buckle folding of
suggesting that it is apparently inactive (see Sect. 4.3). This        the layered rock glacier (stiff boulder mantle, deformable
includes signs of settling and thus incipient degradation of           ice-rich core) in response to compressive flow likely was
the rock glacier body, patches of vegetation, and marked soil          the dominant formation mechanism of the transverse furrow-
development, as well as extensive lichen cover, iron staining,         and-ridge microtopography of unit II (cf. Frehner et al., 2015;
and weathering rinds. Yet, a fresh frontal boulder apron indi-         Sect. 3.4).
cates that the movement of this apparently old body has not               Along the left-lateral side of units I–II, a west-southwest-
ceased completely. The boundary between unit I and II is a             to east-northeast-oriented scarp indicated by exposed fresh
steep, ca. 2–3 m high terrain step that extends upstream as a          material dissects both units and is therefore a younger fea-
stable, grassy sidewall along the two lobes (margin of unit I;         ture. The southernmost fringe of the rock glacier is slowly

The Cryosphere, 15, 2057–2081, 2021                                                        https://doi.org/10.5194/tc-15-2057-2021
D. Amschwand et al.: Deciphering the evolution of the Bleis Marscha rock glacier                                                    2065

                                                                         subsiding. Debris slides or aprons do not follow along the
                                                                         entire scarp (Fig. 2a). The slow, interior deformation must
                                                                         originate at depth rather than at shallow levels, which would
                                                                         push loose surface debris over the edge. The body is sagging
                                                                         instead of laterally advancing, for which ice loss is a possible
                                                                         explanation.
                                                                            Unit III is clearly differentiated from units I–II by the
                                                                         slightly paler color of the debris (less brown) and by a steep,
                                                                         5 m high, frontal terrain step (Fig. 5b). This terrain step is
                                                                         quite marked; the grass cover and soil development suggest
                                                                         long-term stability. The incipient soil development and veg-
                                                                         etation patches, clearly differentiate unit III from the upper
                                                                         units IV and V. Fresh material poured over the stabilized,
                                                                         grassy, right-lateral margin along unit III between radiolarite
                                                                         rock fall deposits and its front, indicated by a light-colored
                                                                         boulder apron formed by debris slides exposing less weath-
                                                                         ered material, which suggests a recent increase in or renewal
                                                                         of activity of unit III (possible reactivation; Fig. 5c). Units
                                                                         I–III are bordered by a stable lateral ridge which is densely
                                                                         vegetated and has a thick soil cover (Fig. 5b, c). It extends up-
                                                                         slope until the body disappears beneath the younger unit IV
                                                                         (Fig. 2a). We interpret this grassy ridge as the margin of the
                                                                         oldest, possibly relict body (unit I) that underlies the younger
                                                                         lobes (units II and III) and not as lateral moraines (Frauen-
                                                                         felder et al., 2001; cf. Barsch, 1996).
                                                                            The boundary between unit III and IV is another steep 5 m
                                                                         step in the terrain. The steep (> 20◦ ) terrain here is cut by
                                                                         three major scarps where the two-layered stratigraphy of a
                                                                         coarse, clast-supported blocky mantle (thickness of ∼ 3 m)
                                                                         over a finer, matrix-supported core is exposed. These inner
                                                                         terrain steps are expressions of discontinuities and form the
                                                                         frontal boundary of units III and IV (Fig. 5b). Units IV–V
                                                                         are starkly different in appearance from units I–III. Again,
                                                                         the hue of the debris lightens (more gray than brown), the
                                                                         debris is much less weathered, and boulders are more angu-
                                                                         lar. The maximum block size decreases from 5–6 m in diam-
                                                                         eter to 2–3 m. Vegetation and soil patches are absent. Unit IV
                                                                         exhibits several longitudinal ridges along the right-hand side
                                                                         (Fig. 4). In the bend at the lip of the cirque, the microtopogra-
                                                                         phy becomes more accentuated with a set of parallel longitu-
                                                                         dinal, asymmetric ridges (steep side facing outwards), whose
                                                                         amplitude however rarely exceeds 2 m. These are flow fea-
                                                                         tures that likely relate to the left turn that the rock glacier
                                                                         makes here. Unit V, a small rock glacier lobe (width 80 m),
Figure 4. Plan view of morphological domains on a 2003 or-
                                                                         is well visible in the root zone emanating from the talus slope
thophoto showing the morphological discontinuities (inner fronts
and terrain steps, slope breaks), sampling locations, and exposure       (Figs. 4, 5a).
ages (in ka; uncertainties are 1σ external errors; see Fig. 8 for sur-      We observed neither signs of glacier activity nor any sur-
face creep rates). Bleis Marscha is a stack of three overriding lobes    face ice remaining from the recent glaciation of the cirque
composed of units I–II, unit III, and units IV–V, separated by over-     (Dufour, 1853; Siegfried, 1887). The “small ice patch” men-
steepened terrain steps. Historical maps suggest that the Holocene       tioned by Frauenfelder et al. (2005) was no longer visible in
maximum extent of the cirque glacier, reached during the Little Ice      2017. The smooth, unstructured talus passes directly into the
Age (LIA) around 1850, remained within the Bleis Marscha cirque          broad (180 m) rock glacier root zone (unit IV) at an elevation
(orthophoto reproduced with the authorization of the Swiss Federal       of ∼ 2700 m a.s.l. (Fig. 5a). No morphological evidence of
Office of Topography, swisstopo).                                        the recent LIA glacier remains.

https://doi.org/10.5194/tc-15-2057-2021                                                        The Cryosphere, 15, 2057–2081, 2021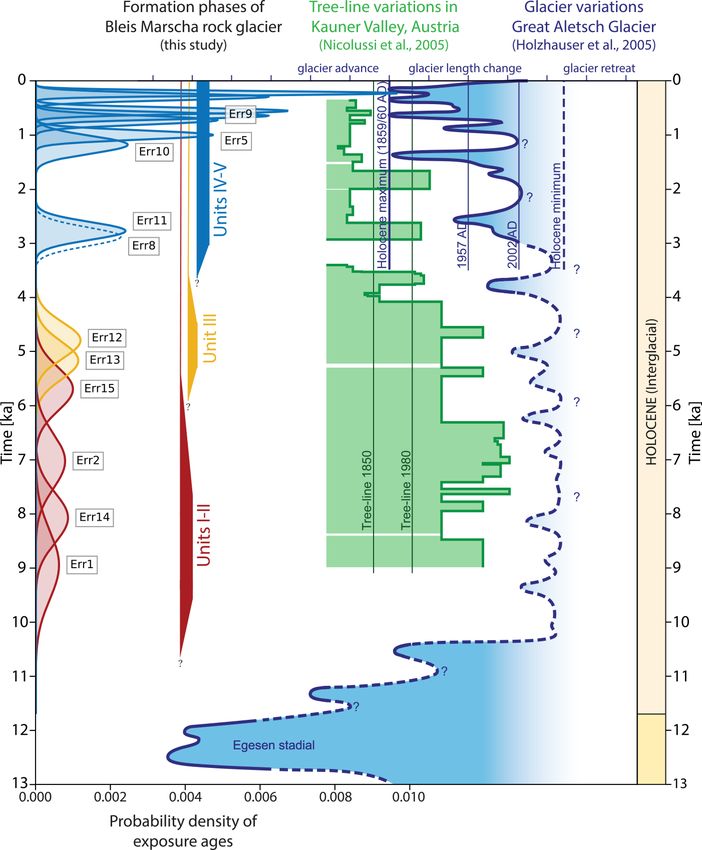
2066                                         D. Amschwand et al.: Deciphering the evolution of the Bleis Marscha rock glacier

Figure 5. Panorama views of the Bleis Marscha rock glacier (see Fig. 4 for photo locations). (a) View to the southeast into the root zone in
Piz Bleis Marscha cirque. The dominant lithology of the boulder mantle, Err Granodiorite, is sourced above the thrust fault in the back of
the cirque. Photo taken in August 2018. (b) View to the west onto lower rock glacier part with furrow-and-ridge microtopography (unit II).
The currently advancing unit III is outlined by the prominent terrain step. Photo taken in October 2018. (c) Side view to the southeast of the
middle rock glacier part, evidencing the Bleis Marscha rock glacier as a multi-unit debris stream composed of multiple stacked lobes. The
fresh lateral debris apron poured over the stabilized, grassy sidewall along unit III hints at recently increased activity (possible reactivation).
Unit I at the base of the stack is discernible by the stable, grassy sidewall and the ledge beneath unit II. Photo taken in October 2018.

The Cryosphere, 15, 2057–2081, 2021                                                               https://doi.org/10.5194/tc-15-2057-2021
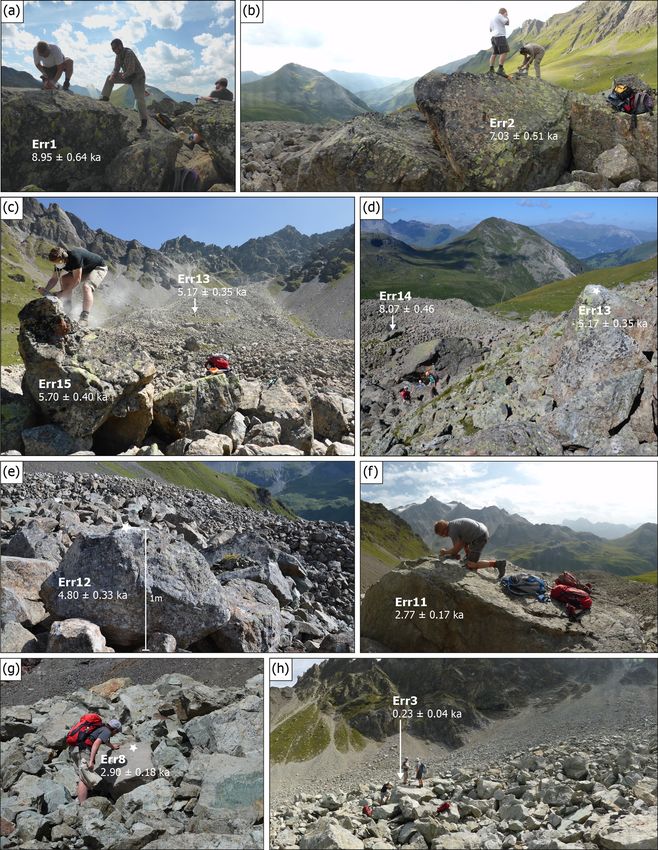
D. Amschwand et al.: Deciphering the evolution of the Bleis Marscha rock glacier                                                          2067

Figure 6. Field photographs of selected sampled boulders that are discussed in the text. In panels (d), (e), and (g), the star marks the sampled
surface. The numbers refer to the boulder exposure ages (in ka; uncertainties are 1σ external errors).

https://doi.org/10.5194/tc-15-2057-2021                                                           The Cryosphere, 15, 2057–2081, 2021
2068                                       D. Amschwand et al.: Deciphering the evolution of the Bleis Marscha rock glacier

Figure 7. Longitudinal section of rock glacier surface along the profile line shown in Fig. 4 showing exposure ages (in ka; uncertainties are
1σ external errors), sample location (triangles), surface elevation, small-scale topography, and morphological units (separated by dashed red
lines). Note the stratigraphically directed time axis to emphasize the general anti-correlation of the exposure ages with altitude. Exposure
ages and sampling location are projected perpendicular onto the longitudinal profile, not along (unknown) surface isochrons. The small-scale
topography is a high-pass-filtered topography computed by subtracting a 100 m running mean from the altitude at each point.

4.2    Boulder exposure ages                                             est youngest lobe, unit V, are 0.56 ± 0.06 ka for Err4 and
                                                                         0.23 ± 0.04 ka for Err3 (Fig. 6h).
                                                                            Ages generally decrease from the lowermost toe of the
                                                                         rock glacier (unit I) to the uppermost lobe (unit V). Nev-
Measured 10 Be concentrations are in the range of (0.7 ± 0.1
                                                                         ertheless, ages on different morphological units of different
to 23.6 ± 1.2) × 104 atoms g−1 . The measured 36 Cl concen-
                                                                         ages show a similar degree of geologic scatter in terms of the
tration is (3.1 ± 0.1) × 105 atoms g−1 (Tables 1, 2). Cos-
                                                                         relative dispersion. In stark contrast to nearly all exposure
mogenic nuclide exposure ages (10 Be and 36 Cl) range from
                                                                         dating projects whereby the cosmogenic nuclide concentra-
0.23 ± 0.04 to 8.95 ± 0.64 ka (Figs. 4, 7; Tables 1, 2).
                                                                         tion records the time elapsed since the boulder reached its
   For the lowermost, oldest part of the rock glacier (unit I),
                                                                         final position (e.g., on a moraine or a landslide deposit), we
we obtained one 10 Be exposure age: Err1 at 8.95 ± 0.64 ka
                                                                         have exposure dated an active, moving landform. This re-
(Figs. 4, 6a, 7). The three ages for unit II are, from lowest
                                                                         quires a different way of interpreting the exposure ages. The
elevation to highest, 7.03 ± 0.51 ka (Err2; Fig. 6b), 5.70 ±
                                                                         cosmogenic nuclide concentrations comprise all the nuclides
0.40 ka (Err15; Fig. 6c), and 8.08 ± 0.46 ka (Err14; Fig. 6d).
                                                                         acquired during exposure of the sampled surfaces. This in-
From the next higher unit III, we obtained two 10 Be ages:
                                                                         cludes exposure in the bedrock (inheritance), at the talus foot,
5.17 ± 0.35 ka (Err13; Fig. 6d) and 4.80 ± 0.33 ka (Err12;
                                                                         and on the rock glacier surface including while it is moving
Fig. 6e). In the higher elevation, the more active parts of the
                                                                         and at the final boulder position. Effects already discussed in
Bleis Marscha rock glacier, nine ages were determined, seven
                                                                         other studies (Heyman et al., 2011) such as boulder rolling,
from unit IV and two from unit V. The 10 Be ages for unit IV
                                                                         toppling, or spalling can also affect the nuclide concentra-
are from lower to higher elevation Err11 at 2.77 ± 0.17 ka
                                                                         tion. This is discussed in detail in Sect. 5.2.
(Fig. 6f), Err10 at 1.18 ± 0.16 ka, Err7 at 0.65 ± 0.06 ka,
Err6 at 0.30 ± 0.06 ka, Err9 at 0.73 ± 0.08 ka, and Err5 at
1.00±0.08 ka. The 36 Cl age for a dolomite boulder in unit IV
is 2.89 ± 0.18 ka (Err8; Fig. 6g). The ages from the high-

The Cryosphere, 15, 2057–2081, 2021                                                           https://doi.org/10.5194/tc-15-2057-2021
D. Amschwand et al.: Deciphering the evolution of the Bleis Marscha rock glacier 2069
4.3 Modern surface creep rates
By correlating two orthophotos from late summer 2003 and
2012, we obtain a noise-filtered horizontal surface creep rate
field for the Bleis Marscha rock glacier and its immediate
surroundings (Fig. 8). Surface creep rates are in the range of
25–60 cm a−1 . There are data gaps in which the image cor-
relation failed due to decorrelation (non-translational move-
ment, toppling, or vegetation) or inadequate input images
(textureless snow fields). Since considerable presumably sta-
ble adjacent off-rock glacier areas show apparent surface
movements of up to 15 cm a−1 , we adopt this conservative
value as the significance level. Areas with speeds lower than
this level of detection are classified as non-moving (dark gray
areas in Fig. 8).
The lowermost unit I is mostly below the level of detec-
tion and considered close to immobile. Surface creep rates
increase gradually upslope to 25 cm a−1 on unit II, while the
creep pattern changes from the slow deformation of a central,
narrow stripe with outward, gradually decreasing creep rates
to a laterally sharply confined, lobe-wide en bloc movement.
On units II–IV, surface creep rates increase more stepwise
up to 60 cm a−1 until the mid-section of unit IV, along with
the average surface slope (Fig. 10b). The “steps” or decorre-
lation gaps in surface speed coincide with terrain steps that
delimit the lobes laterally and frontally. This suggests differ-
ential movement of the lobes that override each other, agree-
ing with field observations of boulder toppling at the over-
steepened, “active” terrain steps (Fig. 4). Important disconti-
nuities are in front of unit III (Fig. 5b) and unit IV (Figs. 7,
10b). Towards the talus, surface creep rates decrease. The
orographic left side of the root zone, where unit V is, is more
active.
Data points from the entire rock glacier surface drawn in
a slope–surface creep rate scatter plot (average slope within
100 m radius; Fig. 9, gray dots) are clustered in a wedge-
shaped domain; the few outliers are due to non-translational
movement (e.g., sliding, tumbling) and not due to large-area
cohesive creep. Higher creep rates are reached at higher sur-
face slope angles, in accordance with the concept of shear-
stress-driven creep. A clearer slope-velocity relation emerges
when data from a 20 m wide stripe along the central pro-
Figure 8. Modern horizontal surface creep rates derived from two
file are highlighted (Fig. 8) because they are unaffected by
orthophotos from 2003 and 2012. Level of detection is 15 cm a−1 .
boundary effects such as lateral drag and non-translational
The long temporal baseline of 9 years averages interannual vari-
abilities in rock glacier creep rates and is a robust estimate of movements. The clear correlation between creep rate and av-
modern, short-term surface kinematics. Important morphological erage surface slope suggests that surface creep rates on units
(Fig. 4) and kinematic discontinuities (decorrelation gaps and step- II–IV (altitude bands 2475–2653 m a.s.l.) are controlled by
wise changes in surface creep rate) largely coincide along morpho- topography (via average surface slope) rather than by ma-
logical unit boundaries. Areas below the level of detection are con- terial properties (effective viscosity). The correlation is lost
sidered immobile except for the lowermost front (unit I), where on the lowermost frontal area (lowermost ∼ 100 m, unit I),
a fresh frontal boulder apron and comparison with the 1988 or- where incipient stabilization and possibly loss of ice ham-
thophoto indicate slow surface movement (5–10 cm a−1 ) (hillshade pers viscous creep, and on the uppermost unit V, possibly
background map reproduced with the authorization of the Swiss because slope-independent deformation processes other than
Federal Office of Topography, swisstopo).
creep are dominant (Fig. 10b). We explore the relationship
https://doi.org/10.5194/tc-15-2057-2021 The Cryosphere, 15, 2057–2081, 20212070 D. Amschwand et al.: Deciphering the evolution of the Bleis Marscha rock glacier
controlled creep on units II–IV and incipient degradation of
unit I.
We used the FE code presented in Frehner et al. (2015).
The aspects discussed therein (incompressibility, boundary
effects) apply analogously in this study. Our synthetic ver-
tical deformation profiles (“virtual boreholes”; Fig. 10a, in-
sets) resemble measured borehole deformation profiles from
other rock glaciers (Arenson et al., 2002). No boreholes have
been drilled on Bleis Marscha rock glacier. Although the
simple Newtonian continuum model with vertical viscosity
layering does not accurately reproduce deformation mecha-
nisms at the microscale, it does capture the essential defor-
mation effects that lead to the observed surface creep rates.
The solution to Eq. (1) is non-unique as higher surface
speed can be achieved with any combination of greater thick-
ness, steeper surface slope, or lower viscosity. Large errors in
the topographical parameters would undermine the goal of
separating topographical from material controls. However,
the driving stress and ultimately the deformation is largely
governed by the well-constrained average surface slope (not
by the basal slope; Nye, 1952) and the reasonably assessable
rock glacier thickness and density. The remaining unknown
viscosity can be estimated with sufficient accuracy.
Figure 9. Slope–creep rate relation. Scatter plot showing the cor-
relation between the 100 m averaged slope (from smoothed DEM) 5 Discussion
and the horizontal surface creep rate for different elevation bands of
the Bleis Marscha rock glacier. The gray dots are data points from By examining the exposure ages and considering the image
the entire rock glacier (lowermost part < 2450 m a.s.l. in dark gray, correlation and FE modeling results, we decipher the history
lobes > 2450 m a.s.l. in light gray). Data points restricted to a 20 m of the Bleis Marscha rock glacier over the past 9 kyr and put
stripe along the central profile, where the effect of lateral drag is it into the framework of the known regional climate history
minimal, are colored. The good correlation between surface slope (Ivy-Ochs et al., 2009; Böhlert et al., 2011a).
and surface creep rates suggests that on units II–IV, topographically
controlled creep is the dominant deformation mechanism.
5.1 Exposure dating an active rock glacier
Cosmogenic nuclide ages include all of the time that a rock
between surface creep rate, topography, and material proper- surface is exposed to cosmic rays. However, in nearly all pre-
ties numerically in Sect. 4.4. vious studies, the sought-after age encompasses only the nu-
clides produced since the boulder reached its final position
4.4 Controls on modern surface creep rates (e.g., in a moraine or landslide deposit). Unlike single-age
landforms that for the most part formed in short-lived events,
For a given rock glacier thickness, layering, and density, active rock glaciers are continually moving and grow over
the effective viscosity distribution is fitted to the 2003 to centuries to millennia. Rock surfaces are exposed to cosmic
2012 surface creep rates. We obtain a simplified but plau- rays in various stages of the landform evolution.
sible rock glacier structure (Fig. 10a) that reproduces the Rock glaciers form on an inclined slope (e.g., a talus slope)
image-correlation data within their uncertainty (Fig. 10b). when an accumulation with favorable debris-ice proportions
The result suggests that the viscosity in the more slowly mov- reaches a critical thickness (Kirkbride and Brazier, 1995;
ing, apparently inactive low-elevation lobes are only slightly Haeberli et al., 2003, 2006). Viscous creep emerges as the
higher than in the active, more rapidly moving high-elevation dominant deformation mechanism, and the mobilized mate-
lobes (Fig. 10a), i.e., that surface creep rates on units II– rial begins to creep downslope under its own weight. Coarse
IV can be explained by topographical parameters (thickness, blocks on the rock glacier surface that form the boulder
surface slope) alone. In contrast, the external parts of unit I mantle are sourced in the rock glacier root and carried to-
move more slowly than potentially possible given the com- wards the front. Conceptually, boulder residence time on the
parable surface slope and thickness to unit II. This mod- rock glacier surface is the time since the initial deposition in
eling result corroborates our hypothesis of topographically the rock glacier root and comprises the travel time (creep-
The Cryosphere, 15, 2057–2081, 2021 https://doi.org/10.5194/tc-15-2057-2021D. Amschwand et al.: Deciphering the evolution of the Bleis Marscha rock glacier 2071
Figure 10. (a) Inferred effective viscosity distribution on the longitudinal transect (profile line shown in Figs. 4, 8). The inferred effective
dynamic viscosity does not vary significantly over units II–IV. Along-profile variations in surface creep rates are primarily controlled by the
surface slope. Insets: modeled yearly horizontal displacements in “virtual boreholes”. The strain localization near the base despite the linear
stress–strain rate relationship arises from the rock glacier parameterization with the three-part mechanical layering (boulder mantle, core,
basal shear layer). The simple Newtonian model with depth-varying viscosity generates synthetic velocity profiles that resemble borehole
deformations measured on other rock glaciers. (b) Longitudinal section of observed surface creep rate (blue line), modeled or synthetic
horizontal surface velocity (orange), and the 100 m filtered slope (yellow). Horizontal surface creep rate of sections dominated by viscous
creep roughly follow the average surface slope (units II–IV). Correlation is lost on the lowermost front and talus. The morphologically defined
units I–II, unit III, and units IV–V are separated by sharp speed gradients (stepwise changes in surface creep rate, kinematic discontinuities;
Fig. 7).
induced, passive transportation during active periods) and, On an active rock glacier, the cosmogenic nuclide concen-
for an inactive to relict landform, the time since the stabi- tration adds up all of the following periods of exposure (Ta-
lization of the landform (relict period) (Haeberli et al., 1998, ble 4):
2003). This model predicts a spatially correlated age sig- 1. pre-exposure in the headwall (bedrock inheritance)
nal with downstream systematically increasing surface ages.
The conveyor-belt-like advance mechanism affects the rock 2. transit time in the talus or during intermediate upstream
glacier age structure and the relations between surface veloc- storage
ity, length, and age (Kääb et al., 1997; Kääb and Reichmuth, 3. transport on the moving (active) rock glacier (travel
2005). Due to the decrease in horizontal speeds with depth time)
and the frontal volume loss mainly from excess ice meltout,
the rock glacier surface moves faster than the advancing land- 4. sitting at the (quasi-)stabilized position (inactive rock
form itself (Haeberli et al., 1998; Frauenfelder et al., 2005; glacier or relict rock glacier deposit).
Kääb and Reichmuth, 2005). Surface exposure ages atop the As in other cosmogenic nuclide studies, post-depositional
front of rock glaciers give the lower bound of the landform surface processes like boulder surface weathering, spalling,
age (Scapozza et al., 2014; Winkler and Lambiel, 2018). unaccounted for shielding, rotation, and toppling lead to a
lower total boulder nuclide inventory (Ivy-Ochs et al., 2007;
Heyman et al., 2011).
https://doi.org/10.5194/tc-15-2057-2021 The Cryosphere, 15, 2057–2081, 2021You can also read