Multiplexed proteomics of autophagy-deficient murine macrophages reveals enhanced antimicrobial immunity via the oxidative stress response - eLife
←
→
Page content transcription
If your browser does not render page correctly, please read the page content below
RESEARCH ARTICLE

                                    Multiplexed proteomics of autophagy-
                                    deficient murine macrophages reveals
                                    enhanced antimicrobial immunity via the
                                    oxidative stress response
                                    Timurs Maculins1,2, Erik Verschueren3†, Trent Hinkle3, Meena Choi3,4,
                                    Patrick Chang5, Cecile Chalouni5, Shilpa Rao6, Youngsu Kwon7, Junghyun Lim1,
                                    Anand Kumar Katakam5, Ryan C Kunz8, Brian K Erickson8, Ting Huang4,
                                    Tsung-Heng Tsai4,9, Olga Vitek4, Mike Reichelt5, Yasin Senbabaoglu6,
                                    Brent Mckenzie7, John R Rohde10, Ivan Dikic2,11*, Donald S Kirkpatrick12*,
                                    Aditya Murthy12*
                                    1
                                     Department of Cancer Immunology, Genentech, South San Francisco, United
                                    States; 2Institute of Biochemistry II, Goethe University, Frankfurt am Main,
                                    Germany; 3Department of Microchemistry, Proteomics and Lipidomics, Genentech,
                                    South San Francisco, United States; 4Khoury College of Computer Sciences,
                                    Northeastern University, Boston, United States; 5Department of Pathology,
                                    Genentech, South San Francisco, United States; 6Department of Oncology
                                    Bioinformatics, Genentech, South San Francisco, United States; 7Department of
                                    Translational Immunology, Genentech, South San Francisco, United States; 8IQ
                                    Proteomics LLC, Cambridge, United States; 9Department of Mathematical Sciences,
*For correspondence:                Kent State University, Kent, United States; 10Department of Microbiology and
dikic@biochem2.uni-frankfurt.de
(ID);
                                    Immunology, Dalhousie University, Halifax, Canada; 11Department of Infectious
dkirkpatrick@interlinetx.com        Diseases, Genentech, South San Francisco, United States; 12Interline Therapeutics,
(DSK);                              South San Francisco, United States
amurthy@interlinetx.com (AM)

Present address: †Galapagos
NV, Mechelen, Belgium
                                    Abstract Defective autophagy is strongly associated with chronic inflammation. Loss-of-function
Competing interest: See             of the core autophagy gene Atg16l1 increases risk for Crohn’s disease in part by enhancing innate
page 24                             immunity through myeloid cells such as macrophages. However, autophagy is also recognized as a
Funding: See page 24                mechanism for clearance of certain intracellular pathogens. These divergent observations
                                    prompted a re-evaluation of ATG16L1 in innate antimicrobial immunity. In this study, we found that
Received: 21 August 2020
Accepted: 12 May 2021
                                    loss of Atg16l1 in myeloid cells enhanced the killing of virulent Shigella flexneri (S.flexneri), a
Published: 04 June 2021             clinically relevant enteric bacterium that resides within the cytosol by escaping from membrane-
                                    bound compartments. Quantitative multiplexed proteomics of murine bone marrow-derived
Reviewing editor: Christina L       macrophages revealed that ATG16L1 deficiency significantly upregulated proteins involved in the
Stallings, Washington University
                                    glutathione-mediated antioxidant response to compensate for elevated oxidative stress, which
School of Medicine, United
                                    simultaneously promoted S.flexneri killing. Consistent with this, myeloid-specific deletion of
States
                                    Atg16l1 in mice accelerated bacterial clearance in vitro and in vivo. Pharmacological induction of
   Copyright Maculins et al. This   oxidative stress through suppression of cysteine import enhanced microbial clearance by
article is distributed under the    macrophages. Conversely, antioxidant treatment of macrophages permitted S.flexneri
terms of the Creative Commons
                                    proliferation. These findings demonstrate that control of oxidative stress by ATG16L1 and
Attribution License, which
                                    autophagy regulates antimicrobial immunity against intracellular pathogens.
permits unrestricted use and
redistribution provided that the
original author and source are
credited.

Maculins et al. eLife 2021;10:e62320. DOI: https://doi.org/10.7554/eLife.62320                                                   1 of 30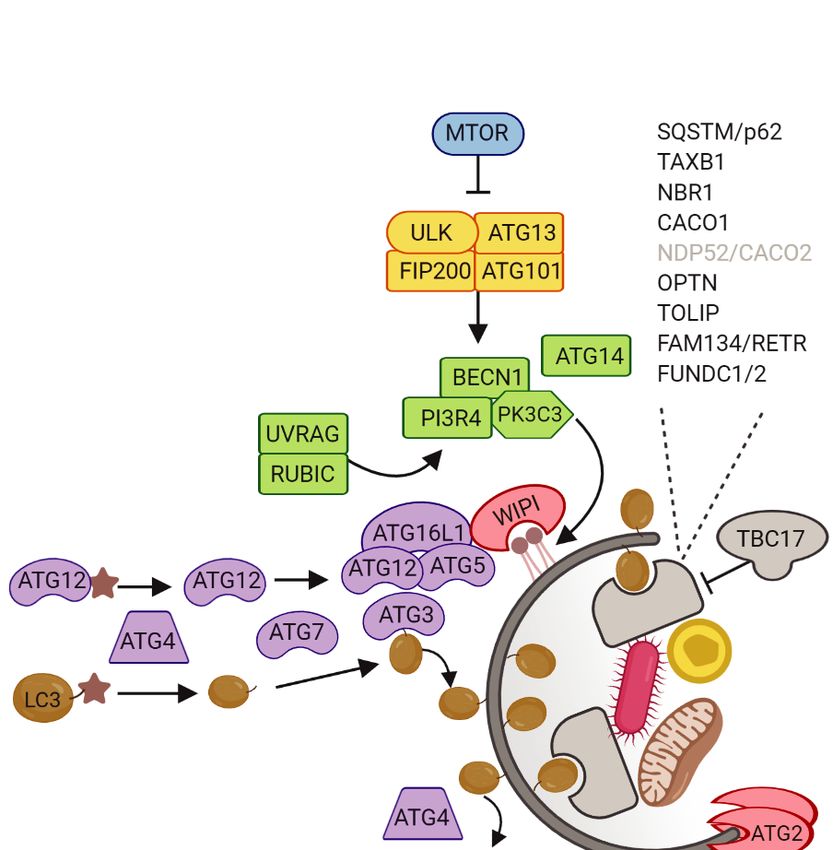
Research article                                                                         Cell Biology Immunology and Inflammation

                                    Introduction
                                    Effective immunity against enteric pathogens requires complex signaling to coordinate the inflam-
                                    matory response, pathogen clearance, tissue remodeling, and repair (Maloy and Powrie, 2011).
                                    Autophagy, a cellular catabolic pathway that eliminates cytosolic cargo via lysosomal degradation,
                                    has emerged as an important regulator of mucosal immunity and inflammatory bowel disease (IBD)
                                    etiology. Genome-wide association studies linked the missense T300A variant in the core autophagy
                                    gene Atg16l1 with increased risk for IBD (Hampe et al., 2007; Rioux et al., 2007). Later studies
                                    demonstrated that this variant contributes to enhanced caspase-mediated degradation of the
                                    ATG16L1 protein (Lassen et al., 2014; Murthy et al., 2014). Genetic loss-of-function of core
                                    autophagy genes including Atg16l1 increases secretion of pro-inflammatory cytokines by macro-
                                    phages in response to toll-like receptor (TLR) activation (Lim et al., 2019; Saitoh et al., 2008). This
                                    contributes to increased mucosal inflammation, driving resistance to extracellular pathogens such as
                                    Citrobacter rodentium (Marchiando et al., 2013; Martin et al., 2018) and pathogenic Escherichia
                                    coli (Wang et al., 2019). Loss of autophagy-related genes Atg16l1, Beclin1, and Rbc1cc1 (encoding
                                    FIP200) in the myeloid compartment also confers enhanced antimicrobial immunity against certain
                                    intracellular pathogens, such as Salmonella typhimurium (S.typhimurium) and Listeria monocyto-
                                    genes via induction of type I and II interferon responses (Samie et al., 2018; Wang et al., 2020).
                                    Thus, autophagy impacts antimicrobial immunity in vivo via innate immunosuppression as well as
                                    myeloid cell reprogramming.
                                        Targeted elimination of intracellular pathogens by xenophagy, a form of selective autophagy, is
                                    well-described in cellular model systems (Bauckman et al., 2015). In contrast to non-selective
                                    autophagy triggered by nutrient stress, xenophagy functions to eliminate intracellular bacteria by
                                    sequestering them in autophagosomes and shuttling them to the degradative lysosomal compart-
                                    ment. Pathogenic bacteria have evolved mechanisms to either evade capture by the autophagy
                                    machinery, as by S.typhimurium and S.flexneri (Birmingham et al., 2006; Campbell-Valois et al.,
                                    2015; Dong et al., 2012; Martin et al., 2018; Xu et al., 2019b) or attenuate autophagic flux as by
                                    Legionella pneumophila (Choy et al., 2012). S.typhimurium primarily resides in a protective com-
                                    partment known as the Salmonella containing vacuole (SCV). There it prevents formation of the
                                    ATG5~ATG12-ATG16L1 complex at the bacterial vacuolar membrane via secretion of the effector
                                    SopF, which blocks ATG16L1 association with vacuolar ATPases (Xu et al., 2019b). Despite its ability
                                    to interfere with autophagy, infected host cells still recognize 10–20% of cytosolic S.typhimurium
                                    and subject this subpopulation to lysosomal degradation via mechanisms involving direct recognition
                                    of either the bacterial surface (Huang and Brumell, 2014; Stolz et al., 2014) or damaged phago-
                                    cytic membranes (Fujita et al., 2013; Thurston et al., 2012).
                                        Compared to S.typhimurium, S.flexneri is not characterized by a vacuolar life cycle, but instead
                                    resides in the host cytoplasm. S.flexneri effector proteins IcsB and VirA are capable of completely
                                    inhibiting autophagic recognition to permit replication in the host cytosol (Liu et al., 2018;
                                    Ogawa et al., 2005). In response, the host cell attempts to further counteract S.flexneri infection via
                                    diverse mechanisms, such as coating bacterial cell surfaces with guanylate-binding proteins (GBPs)
                                    (Li et al., 2017; Wandel et al., 2017) or sequestering bacteria in Septin cage-like structures to
                                    restrict their motility (Mostowy et al., 2010). To reveal these mechanisms, cell-based studies have
                                    largely utilized attenuated variants (e.g. IcsB or IcsB/VirA double mutants of S.flexneri) or strains that
                                    inefficiently colonize the host cytosol (e.g. S.typhimurium which express SopF). Thus, observations
                                    from in vivo genetic models must be reconciled with observations made in cell-based systems to fully
                                    describe the roles of autophagy in antimicrobial immunity. Importantly, there is a lack of understand-
                                    ing of how autophagy contributes to immunity against non-attenuated S.flexneri. This insight is espe-
                                    cially lacking in relevant host cell types, such as macrophages that are infected by S.flexneri
                                    (Ashida et al., 2015).
                                        In this study, we investigated the role of ATG16L1 in myeloid cells in response to infection by vir-
                                    ulent S.flexneri (strain M90T). We observed that loss of Atg16l1 in murine bone-marrow-derived
                                    macrophages (BMDMs) enhanced S.flexneri elimination in cell culture, as well as by mice lacking
                                    ATG16L1 in the myeloid compartment (Atg16l1-cKO; LysM-Cre-mediated deletion of Atg16l1). We
                                    utilized multiplexed quantitative proteomics to characterize total protein, phosphorylation, and ubiq-
                                    uitination changes in wild type (WT) and ATG16L1-deficient (cKO) BMDMs either uninfected or
                                    infected with S.flexneri. Together these data provide a comprehensive catalogue of basal differences

Maculins et al. eLife 2021;10:e62320. DOI: https://doi.org/10.7554/eLife.62320                                                         2 of 30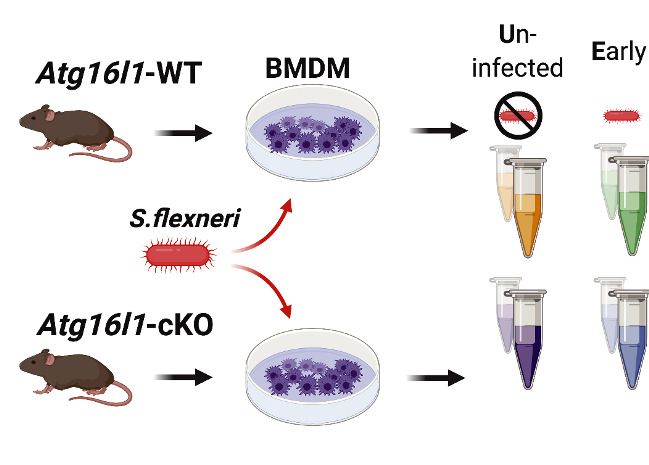
Research article                                                                         Cell Biology Immunology and Inflammation

                                    between WT and cKO BMDMs and the dynamic response of each to infection. Expectedly, signifi-
                                    cant differences were observed for components in the autophagy pathway, along with proteins
                                    involved in cell death, innate immune sensing and NF-kB signaling. However, pharmacological inhibi-
                                    tion of these pathways only modestly affected S.flexneri killing by BMDMs at later time points fol-
                                    lowing infection. One key difference between control and ATG16L1-deficient BMDMs was a basal
                                    oxidative stress response, highlighted by accumulation of the sodium-independent cystine-gluta-
                                    mate antiporter (XCT) and multiple components of the glutathione metabolic pathway. XCT is
                                    responsible for importing the constituents required for glutathione (GSH) biosynthesis, and the con-
                                    sequent detoxification of reactive oxygen species (ROS) and lipid peroxides. Consistently, sustained
                                    pharmacological XCT inhibition in ATG16L1-deficient BMDMs compromised their viability. Likewise,
                                    XCT inhibition enhanced S.flexneri clearance by wild type BMDMs, demonstrating a role for this
                                    pathway in eliminating cytosolic bacteria. Finally, pharmacological scavenging of ROS permitted bac-
                                    terial regrowth in BMDMs, thereby linking the antimicrobial capacity of ATG16L1-deficient macro-
                                    phages to elevated ROS.
                                       This study offers a comprehensive, multidimensional catalogue of proteome-wide changes in
                                    macrophages following infection by an enteric cytosolic pathogen, including key nodes of cell-auton-
                                    omous immunity regulated by autophagy. Our findings demonstrate that ATG16L1 tunes antimicro-
                                    bial immunity against cytosolic pathogens via oxidative stress as well as interferon responses.
                                    Pharmacological modulation of these pathways may represent opportunities for elimination of cyto-
                                    solic pathogens.

                                    Results
                                    Enhanced clearance of intracellular S.flexneri by loss of Atg16l1
                                    Recent studies identified that defective autophagy in macrophages enhances type I interferon and
                                    TNF-driven inflammatory signaling to promote antimicrobial immunity (Lim et al., 2019;
                                    Martin et al., 2018; Samie et al., 2018; Wang et al., 2020). Given these observations, we wanted
                                    to explore whether loss of Atg16l1 affects killing of the intracellular enteric pathogen S.flexneri
                                    (strain M90T). To test this directly in BMDMs, cells from either control (Atg16l1-WT) or mice lacking
                                    ATG16L1 in the myeloid compartment (Atg16l1-cKO) were subjected to the gentamycin protection
                                    assay that enables quantification of intracellular bacteria by enumerating colony forming units
                                    (CFUs). We first determined the kinetics of S.flexneri killing by following BMDM infection in a time-
                                    course experiment with multiplicity of infection (MOI) of 5. Compared to wild type (WT) controls,
                                    ATG16L1-deficient BMDMs (cKO) demonstrated enhanced bacterial clearance (Figure 1A and B and
                                    Figure 1—figure supplement 1A). Since prior studies demonstrated increased sensitivity of autoph-
                                    agy-deficient cells to programmed cell death following engagement of cytokine receptors or micro-
                                    bial ligands (Lim et al., 2019; Matsuzawa-Ishimoto et al., 2017; Orvedahl et al., 2019), BMDM
                                    viability was measured in parallel by quantifying the propidium iodide (PI)-positive population via
                                    live-cell imaging. WT and cKO BMDMs displayed similar cell death kinetics over the time course of
                                    infection, indicating that the phenotype was not driven by enhanced cell death, but potentially by
                                    other factors in cKO BMDMs (Figure 1C).
                                        We next asked whether ATG16L1 in myeloid cells similarly impacts antimicrobial immunity in vivo.
                                    Since chronic enteric infection with S.flexneri in wild-type mice is not possible, current murine mod-
                                    els are limited to acute infection via intravenous or intraperitoneal routes. We performed tail vein
                                    injection of S.flexneri and evaluated bacterial colonization in liver, spleen, and lung tissues at 6 or 24
                                    hr following infection. Infection of the lung was not detected (data not shown) and infection of the
                                    spleen was comparable between genotypes (Figure 1—figure supplement 1B). However, myeloid-
                                    specific loss of Atg16l1 resulted in a markedly decreased bacterial burden in the liver (Figures 1D, 6
                                    hr; Figures 1E, 24 hr). These findings indicate that ATG16L1 deficiency in macrophages enhances
                                    clearance of intracellular S.flexneri in vitro, while myeloid-specific loss of Atg16l1 accelerates hepatic
                                    clearance of S.flexneri in vivo. Although enhanced clearance of S.flexneri by Atg16l1-cKO mice at
                                    the early time point (6 hr) supported a role for ATG16L1 in hepatic myeloid cells including macro-
                                    phages, a Kupffer-cell-specific role cannot be asserted using the current model since the LysM-cre
                                    transgene induces Atg16l1-cKO in other myeloid cell populations that may also contribute to the in
                                    vivo phenotype.

Maculins et al. eLife 2021;10:e62320. DOI: https://doi.org/10.7554/eLife.62320                                                         3 of 30
Research article                                                                                  Cell Biology Immunology and Inflammation

                              A                                                                   B
                                                            2-fold dilution

                                                                                       Time (h)
                                  WT
                                                                                       0.5 h
                                  cKO

                                  WT
                                                                                       2h
                                  cKO

                                  WT
                                                                                       4h
                                  cKO

   C                                                                               D                                 E
                  40

                  30
   %PI-positive
   (Cell Death)

                                                                              ns
                  20

                  10

                   0
                       0      1         2      3        4        5       6
                                            Time (h)
                           uninfected                   +S. xneri

                                  WT                             WT
                                  cKO                            cKO

Figure 1. Enhanced clearance of intracellular S.flexneri by loss of Atg16l1. (A) Representative serial dilutions from gentamycin protection assays
following S.flexneri M90T infection of WT or cKO BMDMs at the indicated timepoints. (B) Comparison of colony forming units (CFUs) per well from
independent infection experiments using BMDM preparations from Atg16l1-WT or Atg16l1-cKO mice. 2 hr **p=0.002, 3 hr **** p =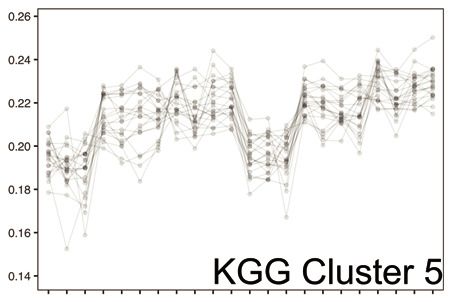
Research article Cell Biology Immunology and Inflammation
A
B C D E KGG(Ub)
Proteome 199
40
1207 Phospho
Proteome
1878 752
931 7260 1239 4631 9418 11564 4446 3691 2095
2382
3963
Plex 1 Plex 2 Plex 1 Plex 2 Plex 1 Plex 2
Global Proteome Phospho-sites KGG(Ub)-sites Global Proteome
F Cluster No. G Cluster No.
7 (n=135) 7 (n=12)
0.23
0.23
3 (n=901) 8 (n=37)
0.22
11 (n=1495) 0.22 16 (n=428)
12 (n=1457) 2 (n=513) 0.21
13 (n=489) 0.21
11 (n=533) 0.2
6 (n=629) 3 (n=254) 0.19
0.2
16 (n=807) 9 (n=220)
0.18
4 (n=196) 4 (n=112)
9 (n=260) 1 (n=405)
10 (n=354) 13 (n=325)
14 (n=454) 5 (n=22)
2 (n=31) 12 (n=45)
1 (n=54) 15 (n=154)
8 (n=293) 14 (n=80)
5 (n=314) 6 (n=148)
15 (n=452) 10 (n=226)
U E L U E L U E L U E L U E L U E L U E L U E L
WT cKO WT cKO WT cKO WT cKO
Phospho-sites Global Proteome KGG(Ub)-sites Global Proteome
H I
Normalized Abundance
Normalized Abundance
Figure 2. Multiplexed proteomic profiling of BMDMs following infection. (A) Schematic representation of multiplexed proteomic profiling of
macrophages during S.flexneri infection. (B–D) Venn diagrams show overlapping quantitative data collected in Plex1 and/or Plex2 for (B) global
proteins, (C) phospho-, and (D) KGG(Ub)-sites. (E) Venn diagram displays an overlap of quantitative data for phospho- and KGG(Ub)-sites with respect
to the global proteins quantified. (F and G) Heatmaps displaying K-means clustered quantitative data for (F) phospho- and (G) KGG(Ub)-sites relative to
Figure 2 continued on next page
Maculins et al. eLife 2021;10:e62320. DOI: https://doi.org/10.7554/eLife.62320 5 of 30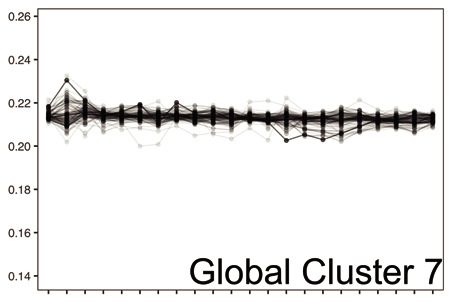
Research article                                                                            Cell Biology Immunology and Inflammation

Figure 2 continued
their corresponding global proteins. Note that the global proteins subjected to clustering differ between panels F and G based on the proteins from
which PTMs were quantified. (H, I) Line plots show representative clusters from the Heatmaps above. Phospho Cluster 7 (panel H) and KGG(Ub) Cluster
5 (panel I) each show PTM profiles that diverge from their corresponding global protein measurements. Proteins and PTMs making up each cluster are
presented in Supplementary file 1.
The online version of this article includes the following figure supplement(s) for figure 2:
Figure supplement 1. Quality control and PTM-Global comparative analysis of proteomics data.

                                        For global proteome profiling, quantitative data were obtained from >103,700 peptide features
                                    mapping to 9430 proteins. From the PTM enriched samples, quantitative data were obtained
                                    for >25,600 unique phospho- (5052 proteins) and >12,400 unique KGG(Ub)-sites (3324 proteins).
                                    When considering only features bearing data in both 11-plexes, the final dataset contained quantita-
                                    tive data for 7260 proteins (i.e. global proteome), 9418 phospho- and 3691 KGG(Ub)-sites
                                    (Figure 2B–D). As expected, ~90% of the post-translationally modified peptide spectral matches
                                    derived from proteins that were also identified and quantified in the global proteome dataset
                                    (Figure 2E). Both within and between plexes, peptide and protein level quantitative data were
                                    highly reproducible, with Pearson correlations ranging from 0.96 to 0.99 (Figure 2—figure supple-
                                    ment 1A). Phospho- and KGG(Ub)-sites profiling data were subjected to K-means clustering, each
                                    paired with the corresponding global proteome data. Heatmap representations revealed clusters of
                                    PTM changes that occur in genotype- and/or infection-dependent manners (Figure 2F and G). A
                                    subset of these clusters comprised PTMs whose quantitative profiles mirrored that of the underlying
                                    protein level due to altered protein expression or stability (e.g. phospho-sites Clusters 1–2 in
                                    Figure 2F and Figure 2—figure supplement 1B; KGG(Ub)-sites Cluster 7 in Figure 2G and Fig-
                                    ure 2—figure supplement 1C). In contrast, other clusters displayed PTM profiles that diverged from
                                    their underlying proteins (e.g. phospho-sites Cluster 7 in Figure 2F and H; KGG(Ub)-sites Cluster 5
                                    in Figure 2G and I). The composition of PTMs and proteins comprising each cluster are available in
                                    Supplementary file 1.
                                        Interrogation of the uninfected datasets revealed differences between the genotypes on the
                                    global protein level. Consistent with previous observations (Samie et al., 2018), cKO BMDMs
                                    showed upregulation in autophagy receptors and inflammatory regulators, such as SQSTM/p62 and
                                    ZBP1, respectively (Figure 3A). In the phosphoproteome and KGG(Ub) datasets interesting observa-
                                    tions concerned elevated phosphorylation of ubiquitin (RL40) at serine-57 (RL40_S57) (Figure 3B)
                                    and ubiquitination of FIS1 at lysine-20 (FIS1_K20) (Figure 3C), which are involved in endocytic traf-
                                    ficking (Lee et al., 2017; Peng et al., 2003) and mitochondrial and peroxisomal homeostasis
                                    (Bingol et al., 2014; Koch et al., 2005; Zhang et al., 2012), respectively.
                                        Similar analysis of the infected datasets revealed the dynamic nature of the macrophage response
                                    to infection, irrespective of ATG16L1 genotype. For example, global proteome analysis revealed
                                    broad changes in pro-inflammatory cytokines and chemokines at early (GROA), late (CXL10, IL1A,
                                    IL1B) or both (CCL2, TNFA) time-points, as well as marked changes in several key cell surface recep-
                                    tors (Figure 3D, Figure 3—figure supplement 1A and B). Time-dependent changes were also
                                    observed for components of innate immune signaling that intersect with the ubiquitin pathway
                                    (PELI1/Pellino), kinase-phosphatase signaling (DUS1/Dusp1), and interferon-mediated GTP/GDP sig-
                                    naling (GBP5) (Figure 3—figure supplement 1C). For phosphorylation, notable examples included
                                    tyrosine-431 of the PI3-kinase regulatory subunit (P85A_Y431) which decreased rapidly upon infec-
                                    tion in both genotypes, and S379 of the interferon regulatory factor (IRF3_S379) which was increased
                                    following infection, particularly in ATG16L1-deficient cells (Figure 3E). For ubiquitination, marked
                                    effects were seen for the selective autophagy receptor Tax1BP1 (TAXB1_K618) and an E3 ubiquitin
                                    ligase Pellino (PELI1_K202) (Figure 3F), both of which have defined roles at the intersection of cell
                                    death and innate immune signaling (Choi et al., 2018; Gao et al., 2011; Parvatiyar et al., 2010).
                                    Finally, annotation of the S.flexneri proteome permitted quantification of pathogen-derived proteins
                                    at the global level. These can be identified using the search term ‘*SHIFL’ in the interactive dash-
                                    board provided below.

Maculins et al. eLife 2021;10:e62320. DOI: https://doi.org/10.7554/eLife.62320                                                              6 of 30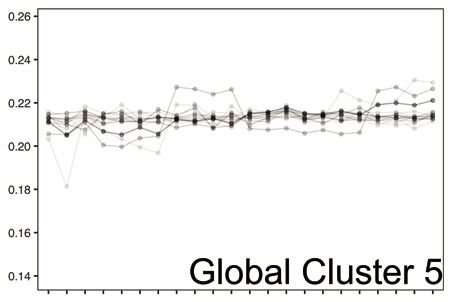
Research article                                                                                                      Cell Biology Immunology and Inflammation

                A              Global Proteins, Uninfected                       B           Phospho-sites, Uninfected                         C      KGG (Ub)-sites, Uninfected
                               (cKO vs. WT)                                                  (cKO vs. WT)                                             (cKO vs. WT)

                                      A16L1                        SQSTM                      RBCC1_S646                   RL40_S57                     DHC24_K446                   FIS1_K20
                                                     0.15                                                         0.15                         0.20
   Relative Abundance

                        0.15                                                                                                                                                0.15
                                                                                     0.10                                                      0.15
                        0.10                         0.10                                                         0.10                                                      0.10
                                                                                                                                               0.10
                                                     0.05                            0.05                         0.05
                        0.05                                                                                                                                                0.05
                                                                                                                                               0.05
                        0.00                         0.00                            0.00                         0.00                         0.00                         0.00
                               U E     L U E     L           U E    L U E    L              U E    L U E      L          U E   L U E   L              U E    L U E     L           U E   L U E    L
                                 WT        cKO                WT       cKO                    WT        cKO               WT     cKO                    WT       cKO                WT     cKO

                D              Global Proteins                                   E           Phospho-sites                                 F
                                                                                                                                           F
                                                                                                                                                       KGG (Ub)-sites
                               (Infected vs. Uninfected)                                     (Infected vs. Uninfected)                                 (Infected vs. Uninfected)

                                      TREM2                        TNAP3                      P85A_Y431                    IRF3_S379                    TAXB1_K618                  PELI1_K202
                                                     0.20
                                                                                                                  0.20                                                      0.20
   Relative Abundance

                        0.15
                                                     0.15                            0.2                          0.15                         0.2                          0.15
                        0.10                         0.10                                                         0.10                                                      0.10
                                                                                     0.1                                                       0.1
                        0.05                         0.05                                                         0.05                                                      0.05
                        0.00                         0.00                            0.0                          0.00                         0.0                          0.00
                               U E     L U E     L           U E    L U E    L              U E    L   U E    L          U E   L U E   L              U E    L   U E   L           U E   L U E    L
                                 WT        cKO                WT       cKO                    WT        cKO               WT     cKO                    WT       cKO                WT     cKO

Figure 3. A global overview of changes identified between the genotypes and upon infection. (A–C) Volcano plots showing differential expression of
global proteins (A), phospho- (B) and KGG(Ub)-sites (C) between uninfected cKO vs. WT BMDMs. Volcano plots display log2 fold changes and -log10
transformed adjusted p-values for the host proteome. Bar graphs at the bottom of each panel represent top hits with positive and negative log2 fold
changes. Uninfected (U) samples are shown with orange (WT) and purple (cKO), early infection (E) in green (WT) and blue (cKO) and late infection (L) in
yellow (WT) and red (cKO), respectively. Protein names are shown as UniProt identifiers with modification sites indicated by the modified amino acid (S/
T/Y/K) and residue number (e.g. RL40_S57). Features enriched in cKO and WT BMDMs are highlighted in red and blue, respectively. (D–F) Volcano
plots displaying differentially expressed global proteins (D), phospho- (E) and KGG(Ub)-sites (F) between infected and uninfected BMDMs. Infected
refers to the aggregate condition in which early and late infected samples for WT and cKO are each weighted as 0.25 relative to 0.5 each for the WT
and cKO uninfected samples. Features enriched in infected and uninfected BMDMs are highlighted in red and blue, respectively. As above, bar graphs
below each panel show example hits. The relative abundance of TMT reporter ions sums up to 2.0 for features quantified in both Plex1 and Plex2.
Figure 3 continued on next page

Maculins et al. eLife 2021;10:e62320. DOI: https://doi.org/10.7554/eLife.62320                                                                                                                  7 of 30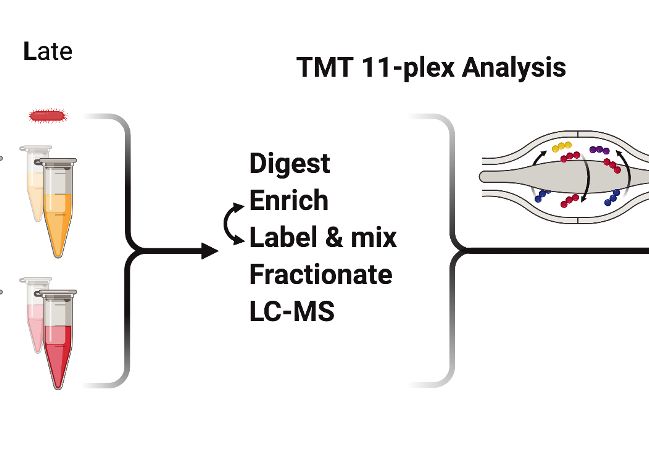
Research article                                                                        Cell Biology Immunology and Inflammation

Figure 3 continued
The online version of this article includes the following figure supplement(s) for figure 3:
Figure supplement 1. Dynamic macrophage response to infection.

                                          To facilitate further exploration of pathways within these data, we have prepared interactive Spot-
                                      fire dashboards and provided them as a resource to the community. These can be accessed at the
                                      following URL: https://info.perkinelmer.com/analytics-resource-center.

                                      Characterizing PTMs of autophagy proteins and inflammatory signaling
                                      nodes revealed by loss of Atg16l1 and infection
                                      To effectively integrate data for each protein within a single consolidated view, heatmaps were
                                      assembled to show proteome level changes alongside any PTMs that were quantified in the phos-
                                      pho- and KGG(Ub)-enriched samples. Using the selective autophagy receptor Tax1BP1 (TAXB1) as
                                      an example, heatmaps depict relative abundance of features present in one or both experiments
                                      (Plex1 and/or Plex2) (Figure 4A). Comparisons of interest include cKO versus WT (cKO/WT) for Unin-
                                      fected (U), Early (E) and Late (L) infection time-points. For TAXB1, these show that the global protein
                                      level is elevated upon Atg16l1 deletion, as are a number of individual phosphorylation and ubiquiti-
                                      nation sites. These include features quantified in one (e.g. T494, K624) or both plexes (e.g. S632,
                                      S693, K627). Additional comparisons depict time-dependent differences between infected and unin-
                                      fected conditions for each genotype – namely early versus uninfected (E/U) and late versus unin-
                                      fected (L/U). For TAXB1, certain PTMs such as phosphorylation at S632 and ubiquitination at K624
                                      and K627 track with the protein, while other PTMs such as phosphorylation at threonine-494 (T494)
                                      and S693 display time-dependent changes that diverge from the underlying protein level
                                      (Figure 4A). Shown individually, histograms depict the relative abundance of TAXB1 and its specific
                                      PTMs (Figure 4B) to mirror what is shown in the combined heatmaps (Figure 4A).
                                          One pathway where we expected to see marked proteome and PTM level changes upon infection
                                      was in autophagy (Figure 4C and Figure 4—figure supplement 1). We confirmed genotype-depen-
                                      dent loss of each component of the ATG16L1-ATG5~ATG12 complex that conjugates LC3 (MLP3A)
                                      to phosphatidylethanolamine (Figure 4D). Only modest changes were seen in the core autophagy
                                      machinery following infection, with the most notable effects being differential phosphorylation of
                                      FIP200 (RBCC1), ATG2B, and VPS15/p150 (PI3R4) (Figure 4—figure supplement 1C–E). More sub-
                                      stantial effects were seen for phosphorylation events on autophagy receptors such SQSTM/p62 and
                                      Optineurin (OPTN) (Figure 4E), in addition to TAXB1 (Figure 4A). In the case of SQSTM/p62, singly
                                      and multiply phosphorylated forms of T269, T271, T272, S275/6, S277 were elevated in ATG16L1-
                                      deficient macrophages. S28 phosphorylation of SQSTM/p62 was previously described to regulate
                                      activation of the antioxidant response (Xu et al., 2019a). We detected a substantial increase in basal
                                      SQSTM_S28 phosphorylation in cKO BMDMs, indicating that ATG16L1 deficiency may impact oxida-
                                      tive stress (Figure 4—figure supplement 1F). Previous work from several groups have demon-
                                      strated that TBK1 regulates OPTN and SQSTM through phosphorylation, although the sites
                                      quantified in this dataset differ from those previously characterized in detail (Heo et al., 2015;
                                      Matsumoto et al., 2015; Richter et al., 2016).
                                          Our PTM datasets showed dynamic regulation for a range of inflammatory signaling components
                                      by infection as well as autophagy (Figure 4—figure supplement 2). For example, we detected ubiq-
                                      uitination on K278 of NEMO (Figure 4—figure supplement 2F), consistent with increased LUBAC
                                      activity (Tokunaga et al., 2009). Interestingly, the global proteome data reported a peptide with
                                      the sequence GGMQIFVK that is derived from linear polyubiquitin chains formed by the LUBAC
                                      complex (Figure 3—figure supplement 1D). This linear ubiquitin peptide was elevated upon infec-
                                      tion in both WT and cKO BMDMs, further supporting increased E3 ubiquitin ligase activity of
                                      LUBAC. As noted above, TAXB1 phosphorylation was induced upon infection at a number of sites
                                      (Figure 4A). These changes in TAXB1 correlated with numerous elevated PTMs of the A20 (TNAP3)
                                      deubiquitinase, a protein whose anti-inflammatory activity modulates NF-kB signaling (Figure 4—
                                      figure supplement 2C). Phosphorylation at TAXB1 at S693 is important for the assembly of TNAP3-
                                      containing complex and negative regulation of NF-kB signaling (Shembade et al.,
                                      2011; Figure 4A).

Maculins et al. eLife 2021;10:e62320. DOI: https://doi.org/10.7554/eLife.62320                                                        8 of 30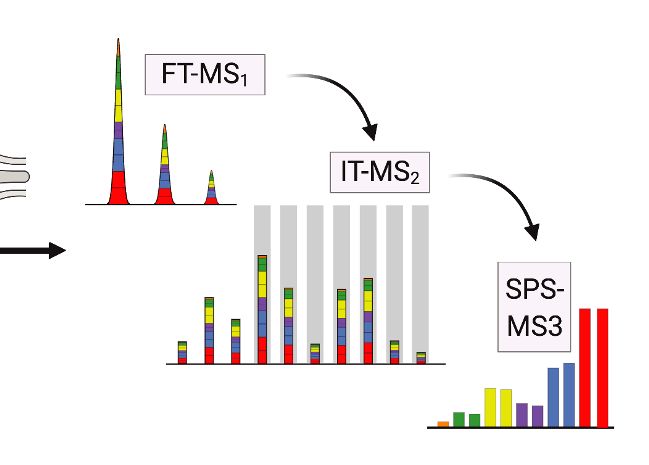
Research article Cell Biology Immunology and Inflammation
A Log2-fold change B
TAXB1 TAXB1_T494
-4 -2 0 2 4
Nos
Plex1/2 Ye 0.10
0.10
TAXB1 Global Proteome
0.05 0.05
S225
T426 0.00 0.00
T494 TAXB1_S632 TAXB1_S693
S632 Phospho- sites
0.15 0.15
S637
Relative Abundance
S693 0.10 0.10
S708 0.05 0.05
K284
0.00 0.00
K311
K479 TAXB1_K624 TAXB1_K627
K536 0.15 0.15
K551 KGG (Ub)- sites
0.10 0.10
K563
K618 0.05 0.05
K624 0.00 0.00
K627 U E L U E L U E L U E L
U E L E/U L/U E/U L/U WT cKO WT cKO
cKO/WT WT cKO
E
SQSTM/p62 NBR1
S24 T6
C S28 S657
S207 K538
T221
S224 CACO1
S226 S563
S266
S266_S275 OPTN
S266_T269 S184
T269 S187
T269_S275 T210
T269_T271 S218
T269_T272 S530
T271 S547
T271_T272 S556
T271_S275
T272 TOLIP
T272_S275 K63
T272_S276 K66
T272_S277 K143
S275
S276 RETR3
S277 S26
T278 S28
T280 T307
Log2-fold change S284 T310_S320
-4 -2 0 2 4 T286 S313_S320
S289 S320
S290 S360
S290_S292
D S290_S293 FUND2
S290_T310 K23
A16L1 ATG7 S292 K30
S287 K419 S292_S308 K114
S289 S293 K121
ATG4A S308 K123
ATG5 S334
K234 ATG4B S367 TBC17
K154 S368 T19
ATG12 K13 S20
MLP3A/LC3 K157 S176
ATG3 K39 K422 K23
K71 K42 K437 K105
U E L E/U L/U E/U L/U U E L E/U L/U E/U L/U U E L E/U L/U E/U L/U U E L E/U L/U E/U L/U
cKO/WT WT cKO cKO/WT WT cKO cKO/WT WT cKO cKO/WT WT cKO
Figure 4. Characterization of proteomic changes in the autophagy pathway. (A) Heatmap representation of log2 fold changes for global proteome
(unmarked), phospho-(yellow section) or KGG(Ub)-sites (purple section) measurements made for TAXB1. Data are shown for features quantified from
uninfected (U) WT and cKO BMDMs or cells infected at early (E) or late (L) time-points with S.flexneri. Log2 transformed ratios are shown for contrasting
genotypes (cKO/WT) at each infection timepoint (U, E, L) on the left and between infection timepoints (E/U and L/U) within each genotype on the right.
Figure 4 continued on next page
Maculins et al. eLife 2021;10:e62320. DOI: https://doi.org/10.7554/eLife.62320 9 of 30Research article Cell Biology Immunology and Inflammation
Figure 4 continued
Gray boxes denote quantification of the feature in Plex1 and/or Plex2. Modification sites on TAXB1 denote the modified amino acid (S/T/Y/K) and
residue number. (B) Bar graphs showing the relative abundance of TAXB1 global protein and representative phospho- and KGG(Ub)-sites in each of the
six conditions. Note that TAXB1_K624 (Plex1) and TAXB1_T494 (Plex2) represent data collected only in a single Plex, with the relative abundance of
TMT reporter ions summing up to 1.0. (C) Schematic representation of macro-autophagy and selective autophagy machinery. (D and E) Heatmap
representations of E1/E2/E3-like pathway components responsible for conjugating LC3 (MLP3A) to regulate autophagosome membrane elongation (D)
and selective autophagy receptors (E). The background shading for each panel corresponds to the functional color coding of proteins in the pathway
schematic shown in (C). See Supplementary file 2 for a curated list of PTMs.
The online version of this article includes the following figure supplement(s) for figure 4:
Figure supplement 1. Extended analysis of proteomic changes in the autophagy pathway.
Figure supplement 2. Characterization of proteomic changes in inflammatory signaling nodes.
Figure supplement 3. Analysis of proteomic changes in innate sensing and the interferon response.
We also identified notable changes across numerous components implicated in pathogen sensing
such as TLRs, RLRs, NLRs and STING/cGAS (Figure 4—figure supplement 3A and B). Our datasets
confirm several previously demonstrated PTMs that occur in response to infection, such as elevated
phosphorylation of RIPK1 at S321 (Figure 4—figure supplement 2E), XIAP at S429 or IRF3 on multi-
ple sites (Figure 4—figure supplement 3D and E). Similar effects were observed for ABIN1 (TNIP1),
which showed modest changes in global protein levels, but elevated ubiquitination at multiple
lysines including K360, K402, K480 at both timepoints and higher levels in cKO than WT (Figure 4—
figure supplement 2F). Caspase-8 ubiquitination was elevated at K169 in both WT and cKO early
post-infection, but was sustained through the late timepoint only in ATG16L1-deficient BMDMs (Fig-
ure 4—figure supplement 2G). Within the ubiquitin pathway, E3 ubiquitin ligases including HOIP
(RNF31), TRAF2, and Pellino (PELI1) showed marked infection-dependent changes at the level of
phosphorylation (e.g. RNF31_S445) and ubiquitination (e.g. PELI_K202 early, TRAF2_K313 late) (Fig-
ure 4—figure supplement 2C).
Cross-referencing all highlighted PTMs with PhosphoSitePlus revealed that ~40% were distinct
from those previously identified in large-scale proteomic screens, with only ~15% of PTMs having
been studied in connection to a biological function (Supplementary files 2 and 3). This analysis also
revealed that nearly 25% of PTMs from the autophagy, innate sensing, inflammatory, and cell death
signaling pathways identified in our study appear to be novel (summarized in Table 1).
Elevated oxidative stress and pro-inflammatory signaling in ATG16L1-
deficient macrophages contributes to accelerated bacterial killing
To obtain a global overview of the proteomics data, gene set enrichment analysis (GSEA) was per-
formed using Hallmark gene sets to identify which signatures emerged from each of the global pro-
teome (Figure 5—figure supplement 1A), phosphoproteome (Figure 5—figure supplement 1B),
and KGG(Ub) data (Figure 5—figure supplement 1C). These results, particularly from the global
proteome and KGG(Ub) datasets, showed a significant enrichment of pro-inflammatory gene signa-
tures upon infection (e.g. type I interferon and TNFa signaling), but also at baseline when comparing
cKO to WT cells (Figure 5—figure supplement 1A and C). To understand the transcriptional contri-
bution to these proteomic signatures, RNA-Seq analysis was performed on BMDMs infected with
S.flexneri. RNA-Seq results likewise showed a significant enrichment of pro-inflammatory gene signa-
tures in cKO cells (e.g. type I interferon and TNFa signaling) (Figure 5—figure supplement 2A and
B).
To explore if these pathways contribute to enhanced S.flexneri killing by cKO BMDMs, cells were
infected in the presence of recombinant TNFa receptor II-Fc (TNFRII-Fc) to inhibit TNF signaling, or
anti-IFNAR1 (a-IFNAR1) to block type I IFN signaling. In contrast to WT BMDMs (Figure 5—figure
supplement 2C and F), inhibition of TNFa or type I interferon signaling in cKO cells resulted in a
modest rescue of S.flexneri killing (Figure 5—figure supplement 2D, E, G and H), especially at later
time points.
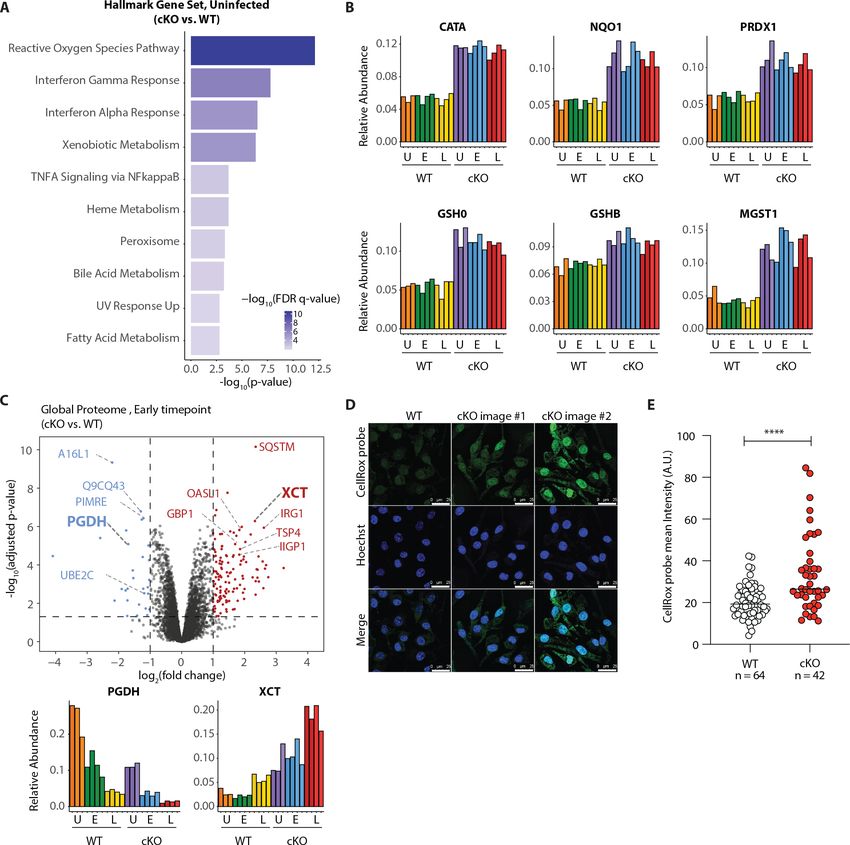
Our GSEA comparison between WT and cKO cells identified strong enrichment of the reactive
oxygen species (ROS) pathway, both in the global proteome and KGG(Ub) data (Figure 5A Fig-
ure 5—figure supplement 1A and Supplementary file 4 for protein set terms). This was true in the
Maculins et al. eLife 2021;10:e62320. DOI: https://doi.org/10.7554/eLife.62320 10 of 30Research article Cell Biology Immunology and Inflammation
Table 1. Novel post-translational modifications in specific autophagy, innate sensing, inflammatory
signaling and cell death pathways revealed by TMT-MS in WT and cKO BMDMs following S.flexneri
infection.
Please refer to heatmaps in Figure 4, Figure 4—figure supplements 1, 2 and 3 for PTM abundance
changes.
Autophagy
Post-translational modification
Protein name pSTY/Phosphorylation KGG/Ubiquitination
ATG5 K234
MLP3A/LC3 K39
TAX1BP1 T426, T494 K284, K311, K536, K551, K624
P62/SQSTM1 T280. S292, S308
NBR1 T6
FUND2 K114, K121
TBC17 S176 K105
RBCC1/FIP200 T642
PI3R4/VPS15 S903, T904
RUBIC S252, S552, S554
ATG2B S401 T1570
Innate sensing
Post-translational modification
Protein name pSTY/Phosphorylation KGG/Ubiquitination
DDX58/RIG-I K256
MAVS Y332
CGAS K55
TLR4 K692
MYD88 S136
IRAK2 S175, T587, S615
IRAK3 K60, K163, K392
IRAK4 T133, S134, S175_S186
TBK1 S509
IRF3 T126, S130
IRF7 S227, T277
IFIT1 S272, S296 K89, K117, K123, K406, K451
IFIT2 K41, K61, K158, K291
IFIT3 S327, S333 K246, K252, K266, K396
ISG15 K30
Inflammatory signaling, cell death
Post-translational modification
Protein name pSTY/Phosphorylation KGG/Ubiquitination
TNFR1B/TNFR2 K300
M3K7/TAK1 S331
TAB2 S353, T376, S584
TRAF1 K120
TRAF2 K194
IKBz T188 K5, K120, K132
NFKB1 K275
Table 1 continued on next page
Maculins et al. eLife 2021;10:e62320. DOI: https://doi.org/10.7554/eLife.62320 11 of 30Research article Cell Biology Immunology and Inflammation
REL S321
RNF31/HOIP S441, S973 K911
TNAP3/A20 S217, T567, S622, S730 K31, K213
TNIP1/ABIN1 S601 K288, K317, K386
TNIP2/ABIN2 T194, S196
CASP8 S60 K33, K274
CFLAR/cFLIP K175, K390
RIPK1 K429
RIPK2 S183, S381 K369
RIPK3 S173, S177, S254, T386, T392, T398, T407 K145, K230, K298
global proteome data for both uninfected and infected cells at both time-points (Figure 5—figure
supplement 1A), as well as in the KGG(Ub) data specifically for infected cells (Figure 5—figure sup-
plement 1C). This group of proteins included several factors involved in glutathione (GSH) synthesis,
such as the glutamate-cysteine ligase regulatory subunit (GSH0/Glcm) and GSH synthetase (GSHB/
Gss), as well as GSH regeneration, such as microsomal glutathione S-transferase (MGST1) and NAD
(P)H dehydrogenase 1 (NQO1), a major enzyme that assists in reducing oxidative stress in cells
(Figure 5B; Hayes et al., 2020). Additionally, several ROS converting enzymes including catalase
(CATA) and peroxiredoxin 1 (PRDX1) were also elevated in cKO BMDMs at steady state. Further-
more, a subset of these redox regulators changed abundance upon S.flexneri infection. For example,
prostaglandin dehydrogenase 1 (PGDH) displayed a time dependent decrease upon infection that
was accentuated in cKO versus WT cells, consistent with its known susceptibility to ROS
(Figure 5C; Wang et al., 2018). Conversely, levels of the cysteine-glutamate antiporter SLC7A11
(XCT) (Conrad and Sato, 2012; Sato et al., 1999) exhibited a significant increase in cKO BMDMs
following infection (Figure 5C). Thus, ATG16L1 deficiency and S.flexneri infection might each inde-
pendently elevate ROS levels, with ATG16L1 deficiency further driving a compensatory increase in
the redox regulators during infection to maintain macrophage viability.
We next asked whether ATG16L1-deficient BMDMs exhibit elevated basal oxidative stress using
a fluorogenic probe (CellRox green) that enables cellular ROS measurements via confocal fluores-
cence microscopy. Despite upregulation of numerous redox regulatory factors, CellRox probe inten-
sity was significantly higher in cKO BMDMs (Figure 5D and E; see also Figure 5—figure
supplement 3A for high content imaging). We also detected an increase in the ratio between oxi-
dized versus reduced GSH (GSSH/GSH) in lysates of cKO BMDMs (Figure 5—figure supplement
3B–D). Additionally, abundance of NQO1 was significantly higher in cKO BMDMs as determined by
a specific NQO1-activated fluorescent probe (Figure 5—figure supplement 3E and
F; Punganuru et al., 2019). Altogether, these findings indicate that cKO BMDMs are basally
exposed to higher oxidative stress, and suggest that upregulation of redox homeostasis factors is
required to maintain their viability (Tal et al., 2009). To test this hypothesis, we treated BMDMs with
Erastin, a small molecule inhibitor of XCT which increases oxidative stress by diminishing the levels
of reduced GSH in cells (Dixon et al., 2012). Time-course studies demonstrated that BMDMs exhib-
ited decreased viability upon prolonged XCT inhibition, and revealed a greater dependency on this
pathway when Atg16l1 is deleted (Figure 6—figure supplement 1A). Given the central role of
autophagy in mitochondrial turnover, we analyzed mitochondrial morphology and respiration as a
possible source of oxidative damage in uninfected cKO BMDMs (Figure 5—figure supplement 3G
and H). However, mitochondrial phenotypes remained consistent between WT and cKO groups.
This warrants further investigation into the underlying mechanism(s) of elevated oxidative stress in
ATG16L1-deficient BMDMs and posits that altered homeostasis of other organelles may contribute
to the ROS accumulation in cKO BMDMs. Interestingly, the KGG(Ub) data displayed a marked
response in the peroxisome gene set in cKO cells over WT (Figure 5—figure supplement 1C), sug-
gesting a possible link between this organelle and the elevated ROS signature.
Maculins et al. eLife 2021;10:e62320. DOI: https://doi.org/10.7554/eLife.62320 12 of 30Research article Cell Biology Immunology and Inflammation Figure 5. Elevated oxidative stress in ATG16L1-deficient BMDMs. (A) Gene set enrichment analysis (GSEA) of global proteome data showing Hallmark gene sets overrepresented in uninfected cKO over WT BMDMs. (B) Bar graphs show the relative abundances for selected proteins involved in redox regulation and detoxifying reactive oxygen species. (C) Volcano plot of global protein changes at early infection timepoint between the genotypes. Proteins enriched in cKO and WT BMDMs are highlighted in red and blue, respectively. Bar graphs showing the cumulative effects of genotype and infection on PGDH and XCT protein levels are shown below. (D) Representative images from experiments shown in (E) demonstrating CellRox probe intensity, Hoechst nuclear staining and merged images (scale bar 25 mM). (E) Quantification of CellRox green mean intensity in WT and cKO BMDMs. Graph shows single cell data representative of three independent experiments. Unpaired t test ****p
Research article                                                                                  Cell Biology Immunology and Inflammation

Figure 5 continued
Figure supplement 3. Elevated oxidative stress in ATG16L1-deficient BMDMs.

                                         Based on these observations, we hypothesized that higher levels of basal oxidative stress in cKO
                                     BMDMs may drive their enhanced ability eliminate cytosolic S.flexneri. To test this, we modulated
                                     oxidative stress in BMDMs using either Erastin, an oxidative stress inducer, or butylated hydroxyani-
                                     sole (BHA), a ROS scavenger. BMDMs were pre-treated with Erastin or BHA prior to infection and
                                     the treatments were maintained throughout the time-course experiments (schematic in Figure 6—
                                     figure supplement 1B). Importantly, neither Erastin (Figure 6—figure supplement 1C and D) nor
                                     BHA (Figure 6—figure supplement 1E and F) treatments increased BMDM cell death throughout
                                     the experimental time-course. However, Erastin-treated BMDMs exhibited enhanced elimination of
                                     S.flexneri at early time-points following infection (Figure 6A–C). Conversely, BHA treatment pro-
                                     moted S.flexneri survival in BMDMs (Figure 6D–F). Together, these findings demonstrate a role for
                                     ATG16L1 in restraining oxidative stress, which in turn constrains macrophage microbicidal capacity.

   A                                                B                                             C
                                                                                                                        2-fold dilution

                                                                                                  DMSO
                                                                                                                                                   WT
                                                                                                  Erastin

                                                                                                  DMSO
                                                                                                                                                   cKO
                                                                                                  Erastin

   D                                                E                                             F                     2-fold dilution

                                                                                                  DMSO
                                                                                                  DM
                                                                                                                                                   WT
                                                                                                      BHA

                                                                                                  DM
                                                                                                  DMSO
                                                                                                                                                   cKO
                                                                                                      BHA

Figure 6. Manipulation of ROS levels modulates S.flexneri clearance. (A, B) Comparison of CFUs per well from three independent infection experiments
in the presence of 4 mg/ml Erastin using BMDM preparations from three different Atg16l1-WT (A) or Atg16l1-cKO (B) mice. In A, 0.5 hr *p=0.04, 1 hr
*p=0.01, 2 hr ns, non-significant p=0.11, multiple t-test comparison. In (B), 0.5 hr ns p=0.08, 1 hr **p=0.005, 2 hr **p=0.009, multiple t-test comparison.
(C, F) Representative serial dilutions from gentamycin protection assays following S.flexneri M90T infection of WT or cKO BMDMs in the presence of
Erastin 4 mg/ml, (C, 1 hr timepoint) or BHA 150 mM (F, 3 hr timepoint). (D, E) Comparison of CFUs per well from four independent infection experiments
in the presence of 150 mM BHA using BMDM preparations from four different Atg16l1-WT (D) or Atg16l1-cKO (E) mice. In (D), 2 hr *p=0.02, 3 hr ns,
non-significant p=0.13, 4 hr ns p=0.14, multiple t-test comparison. In (E), 2 hr *p=0.01, 3 hr *p=0.03, 4 hr *p=0.02, multiple t-test comparison.
The online version of this article includes the following figure supplement(s) for figure 6:
Figure supplement 1. Erastin, BHA sensitivity and cell death kinetics in infection experiments.

Maculins et al. eLife 2021;10:e62320. DOI: https://doi.org/10.7554/eLife.62320                                                                    14 of 30
Research article Cell Biology Immunology and Inflammation
Discussion
Emerging insights from genetic mouse models have revealed that loss of Atg16l1 in the immune and
epithelial compartments lowers the threshold for an inflammatory response (Cadwell et al., 2010;
Hubbard-Lucey et al., 2014; Lim et al., 2019; Matsuzawa-Ishimoto et al., 2017). Consistently,
deletion of autophagy-related genes in the innate and adaptive immune compartments have demon-
strated enhanced pathogen clearance (Marchiando et al., 2013; Martin et al., 2018; Samie et al.,
2018; Wang et al., 2020) as well as tumor control in vivo (Cunha et al., 2018; DeVorkin et al.,
2019; Lim and Murthy, 2020). These observations prompted a re-evaluation of the pathway in anti-
microbial immunity to better understand how loss of autophagy-related genes impacts cell-autono-
mous innate immunity against intracellular bacteria.
In this study, we show that macrophages lacking Atg16l1 demonstrate enhanced killing of S.flex-
neri. To identify mechanisms behind this phenotype we employed TMT-based multiplexed proteo-
mic analysis – a technology capable of near-comprehensive characterization of the global proteome
(Lapek et al., 2017). When isobaric multiplexing methods are coupled with enrichment, it enables
quantification of PTMs on thousands of individual proteins (Rose et al., 2016). This method is ideally
suited for interrogation of a complex response such as infection of a host cell with an intracellular
pathogen, where the diversity of downstream changes does not lend themselves to candidate
approaches involving immunoblotting.
Our approach identifies multiple novel PTMs in components of inflammatory cytokine signaling,
innate sensing and the core autophagy machinery that emerge as a consequence of S.flexneri infec-
tion. The comparison of early and late infection time-points shows complex dynamics that reflect
PTM as well as global protein abundance. The comparison of WT versus ATG16L1-deficient BMDMs
further reveals critical nodes in each of the above pathways that are under regulatory control by
autophagy. The PTMs listed in Table 1 and Supplementary files 2 and 3 represent a sizeable frac-
tion of the relevant post-translational changes that occur in macrophages during infection and/or
upon loss of autophagy. We have provided interactive, web-accessible Spotfire Dashboards to
enable user interrogation of the global proteome, phosphoproteome, and the KGG(Ub) datasets
(https://info.perkinelmer.com/analytics-resource-center).
Our study reveals that basal accumulation of cellular ROS in cKO BMDMs enforces a compensa-
tory increase in antioxidant responses exemplified by elevated protein abundances of key compo-
nents of the glutathione metabolic pathway. This permits cellular viability under relatively elevated
cytosolic ROS levels, which in turn suppresses S.flexneri expansion in BMDMs. However, overall mac-
rophage fitness is likely compromised owing to a shift in the basal redox pathway set-point. Pharma-
cological depletion of GSH phenocopies genetic loss of Atg16l1 and enhances S.flexneri clearance
in wild-type cells, whereas the ROS scavenger BHA reverses this phenotype, demonstrating a direct
role for cellular ROS in bacterial clearance upon loss of autophagy.
Mice lacking Atg16l1 in myeloid cells also demonstrate accelerated hepatic bacterial clearance in
vivo. However, these findings have some limitations. First, murine enteric infection by S.flexneri
requires deletion of the NAIP-NLRC4 inflammasome in intestinal epithelial cells (recently described
in Mitchell et al., 2020). Thus, the scope of our observations is limited by the availability of murine
models and primarily reveal a role of ATG16L1 in myeloid cells during acute bacterial infection. Sec-
ond, we observe a liver-specific impact of ATG16L1 deletion in the myeloid compartment because
splenic S.flexneri colonization was comparable between genotypes, while no colonization of lung tis-
sue was detected. However, the broad deletion of Atg16l1 in the myeloid lineage via LysM-Cre
raises a possibility that Kupffer cells alone may not be the sole drivers of accelerated hepatic clear-
ance in vivo. Additional genetic models are required to directly test the role of autophagy in Kupffer
cells, and the intestinal epithelium, as relevant sites of mucosal antimicrobial immunity.
In addition to demonstrating a role for autophagy in antimicrobial immunity via modulation of oxi-
dative stress, our study provides the most comprehensive multiplexed proteomic analysis to date of
the macrophage response to cytosolic bacterial infection. We hope this novel resource will be of
broad utility to the study of myeloid signal transduction, host-pathogen interaction, and innate
immunity.
Maculins et al. eLife 2021;10:e62320. DOI: https://doi.org/10.7554/eLife.62320 15 of 30Research article Cell Biology Immunology and Inflammation
Materials and methods
Mice
All animal experiments were performed under protocols approved by the Genentech Institutional
Animal Care and Use Committee. Generation of myeloid-specific deletion of Atg16L1 was achieved
by crossing Lyz2-Cre + mice with Atg16L1loxp/loxp mice (Atg16l1-cKO) and was described previously
(Murthy et al., 2014). All mice were bred onto the C57BL/6N background. All in vivo experiments
were performed using age-matched colony controls.
Bacterial strains and culture
Shigella flexneri 5a strain M90T used in this study was obtained from ATCC (ATCC BAA-2402). Fro-
zen bacterial stocks were streaked onto tryptic soy agar (TSA) plates and grown at 37˚C overnight.
Plates were kept at 4˚C for up to 2 weeks.
Bone-marrow-derived macrophage isolation
Femurs and tibias were collected aseptically. After removing most of the muscle and fat, the epiphy-
ses were cut and bones were placed into PCR tubes individually hung by the hinge into a 1.5 ml
Eppendorf. The bone marrow was flushed by short centrifugation at 10,000 rpm for 30 s. Red blood
cells were lysed with RBC lysis buffer (Genentech) by incubating for 5 min at RT. Cells were then pel-
leted and resuspended in BMDM media [high glucose Dulbecco’s Minimum Essential Media (DMEM)
(Genentech) + 10% FBS (heat inactivated, custom manufactured for Genentech)+GlutaMAX (Gibco,
30050–061)+Pen/Strep (Gibco, 15140–122) supplemented with 50 ng/ml recombinant murine mac-
rophage-colony stimulating factor (rmM-CSF, Genentech)] and plated in 15 cm non-TC treated
dishes for 5 days (Petri dish, VWR, 25384–326). Fresh BMDM media was added on day three without
removal of original media. On day 5, macrophages were gently scraped from dishes, counted and
re-plated on TC-treated plates of the desired format for downstream assays in fresh BMDM media.
After overnight culture in BMDM media, assays were performed on day 6 BMDMs.
BMDM infections in 24-well plates
BMDMs isolated from control Atg16l1-WT or Atg16l1-cKO mice were plated at 2.5 105 cells/well
in 24-well assay plates (Corning, 353047) in BMDM media. A duplicate plate was always plated for
total PI-positive cell number enumeration after overnight incubation using IncuCyte ZOOM as
described elsewhere. Bacterial cultures were prepared by picking a single bacterial colony from TSA
plates and grown in 10 mL tryptic soy broth (TSB) in a shaking incubator overnight at 37˚C. After
overnight incubation, bacteria were sub-cultured in fresh 10 mL of TSB at 37˚C until OD600 0.5–0.8,
pelleted by centrifugation, resuspended in 1:1000 poly-L-lysine (Sigma-Aldrich, P4707) in PBS and
incubated for 10 min at RT. Cell suspension was then centrifuged and the pellet washed twice with
PBS and once with the infection media [high glucose DMEM (Genentech) +10% FBS (heat inacti-
vated, custom manufactured for Genentech)+GlutaMAX (Gibco, 30050–061)]. After the final wash
the bacterial pellet was resuspended in the infection media and OD600 was remeasured. To prepare
multiplicity of infection (MOI) of 5 in the infection media, total PI-positive object count per well was
used for accurate MOI calculations for every independent infection experiment. A cell suspension
containing lysine coated bacteria were added to the wells at MOI five in a total volume of 250 ml/
well and allowed to adhere by incubating for 30 min at 37˚C in a CO2 incubator. After 30 min, bacte-
rial suspension was aspirated and replaced with 500 ml/well of fresh infection media supplemented
with gentamicin at 50 mg/mL (Sigma-Aldrich, G1397). This was defined as the time-point T = 0 min.
Assay plates were subsequently incubated at 37˚C in a CO2 incubator and used at the indicated
time-points for CFU enumeration.
BMDM infections in 24-well plates with compounds and antibodies
For experiments with Erastin (Sigma-Aldrich, E7781), BHA (Sigma-Aldrich, 78943), anti-IFNAR1
(Leinco Technologies, I-401), isotype control antibody clone HKSP (Leinco Technologies, I-536) or
TNFRII-Fc (R and D, 9707-R2) day 5 BMDMs were plated at 2.5 105 cells/well in 24-well assay
plates (Corning, 353047) in BMDM media and incubated overnight. A duplicate plate was also
seeded and used for PI-positive object count per well enumeration to ensure accurate MOI as
Maculins et al. eLife 2021;10:e62320. DOI: https://doi.org/10.7554/eLife.62320 16 of 30Research article Cell Biology Immunology and Inflammation
described elsewhere. For experiments with Erastin, BMDMs were plated in media supplemented
with Erastin at 4 mg/ml and incubated at 37˚C in a CO2 incubator for 18 hr before infection. For
experiments with BHA, anti-IFNAR1 or TNFRII-Fc overnight media was replaced with fresh media
containing 150 mM BHA, 5 mg/ml anti-IFNAR1, or 500 ng/ml TNFRII-Fc and incubated for 2 hr prior
infection. The bacterial culture was prepared essentially as described elsewhere with the following
modifications. After the final wash with infection media the bacterial pellet was resuspended in the
infection media, OD600 was remeasured and bacterial suspension of MOI 10 was prepared. A cell
suspension containing lysine coated bacteria was mixed 1:1 with infection media containing double
concentrations of compounds and added to the wells in a total volume of 250 ml/well and allowed to
adhere by incubating for 30 min at 37˚C in a CO2 incubator. After 30 min, bacterial suspension was
aspirated and replaced with 500 ml/well of fresh infection media supplemented with gentamicin at
50 mg/mL (Sigma-Aldrich, G1397) and compounds as indicated.
BMDM infections in 15 cm dishes for TMT proteomics
For large scale infections, 5 day differentiated BMDMs isolated from control Atg16l1-WT or
Atg16l1-cKO mice were plated at 10 106 cells per 15 cm non-TC treated dish (Petri dish, VWR,
25384–326) in BMDM media. Bacterial suspension was prepared essentially as described elsewhere
with the following modifications. A suspension of lysine coated bacteria in infection media were
added to the dishes containing BMDMs at MOI five in a volume of 15 ml/dish and allowed to adhere
by incubating for 30 min at 37˚C in a CO2 incubator. After 30 min, the medium was aspirated and
replaced with 50 ml/dish of fresh infection media supplemented with gentamicin at 50 mg/mL
(Sigma-Aldrich, G1397). This was defined as the time-point T = 0 min. Assay plates were subse-
quently placed at 37˚C in a CO2 incubator and samples collected after 30–45 min incubation (‘early’
infection time-point) or after 3–3.5 hr incubation (‘late’ infection time-point). At the indicated time-
points a set of 10 dishes per genotype was used to prepare cell lysates for downstream proteomic
analysis. To prepare cell lysates, infection media was first aspirated and cells washed once with PBS.
Cells were then scrapped in the presence of Urea lysis buffer (20 mM HEPES pH 8.0, 9M Urea, 1 mM
sodium orthovanadate, 2.5 mM sodium pyrophosphate, 1 mM b-glycerolphosphate) and cell suspen-
sion stored at 80˚C until further processing (Kirkpatrick et al., 2013).
In vivo Shigella flexneri infection
Mice were injected intravenously in the tail vein with Shigella flexneri (M90T) bacterial culture that
was prepared by picking a single bacterial colony from TSA plates and grown in 10 mL tryptic soy
broth (TSB) in a shaking incubator overnight at 37˚C. After overnight incubation, bacteria were sub-
cultured in fresh 10 mL of TSB at 37˚C until OD600 0.5–0.8, pelleted by centrifugation, washed with
PBS once, resuspended in PBS and OD600 was recounted. Each animal was injected with 100 ml of
bacterial suspension in PBS containing 2 106 Colony Forming Units (CFUs) S.flexneri strain M90T.
Mice were euthanized six or 24 hr post infection to harvest spleen, liver, and lung for CFUs
enumeration.
Colony-forming units (CFUs) assays
To determine CFUs in infected BMDMs, infection media was aspirated, cells were washed once with
PBS and lysed by adding 250 ml/well of 0.1% Igepal CA-630 (Sigma-Aldrich, I8896) in PBS, incubated
for 5 min, resuspended and an aliquot of 200 ml was transferred to 96-well U-bottom plate (Costar,
3799) for making two-step serial dilutions in 0.1% Igepal CA-630 in PBS. Subsequently, 5 ml of each
serial dilution was plated on TSA plates in triplicates, allowed to evaporate at RT after which the
plate was placed in a 37˚C incubator overnight. After overnight incubation, colonies from individual
dilutions were counted and used for determining CFUs per well. To determine CFUs in the liver,
spleen, and lung, mice were euthanized at the indicated time-points after infection and the organs
surgically removed and placed in PBS on ice. Livers were processed in 5 ml of 0.1% Igepal CA-630
(Sigma-Aldrich, I8896) in PBS using the gentleMACS C Tubes (Miltenyi Biotec, 130-096-334) in com-
bination with the gentleMACS Octo Dissociator (Miltenyi Biotec, 130-095-937) for the automated
dissociation of tissues using standard tissue dissociation programs (program sequence:
m_liver_01_02; m_liver_02_02, m_liver_01_02). Tissue suspensions were filtered through 100 mM fil-
ters (CellTreat, 229485) and remaining liver tissue was additionally homogenized using the rubber
Maculins et al. eLife 2021;10:e62320. DOI: https://doi.org/10.7554/eLife.62320 17 of 30You can also read


