Committed and projected future changes in global peatlands - continued transient model simulations since the Last Glacial Maximum
←
→
Page content transcription
If your browser does not render page correctly, please read the page content below
Biogeosciences, 18, 3657–3687, 2021
https://doi.org/10.5194/bg-18-3657-2021
© Author(s) 2021. This work is distributed under
the Creative Commons Attribution 4.0 License.

Committed and projected future changes in global peatlands
– continued transient model simulations since
the Last Glacial Maximum
Jurek Müller1,2 and Fortunat Joos1,2
1 Climate   and Environmental Physics, Physics Institute, University of Bern, Bern, Switzerland
2 Oeschger   Centre for Climate Change Research, University of Bern, Bern, Switzerland

Correspondence: Jurek Müller (jurek.mueller@climate.unibe.ch)

Received: 30 March 2021 – Discussion started: 6 April 2021
Revised: 19 May 2021 – Accepted: 22 May 2021 – Published: 18 June 2021

Abstract. Peatlands are diverse wetland ecosystems dis-            portance of extended transient future scenarios for long-term
tributed mostly over the northern latitudes and tropics. Glob-     carbon cycle projections.
ally they store a large portion of the global soil organic car-       The spread between simulations forced with different cli-
bon and provide important ecosystem services. The future of        mate model anomalies suggests a large uncertainty in pro-
these systems under continued anthropogenic warming and            jected peatland changes due to uncertain climate forcing.
direct human disturbance has potentially large impacts on at-         Our study highlights the importance of quantifying the fu-
mospheric CO2 and climate.                                         ture peatland feedback to the climate system and its inclusion
   We performed global long-term projections of peatland           into future earth system model projections.
area and carbon over the next 5000 years using a dynamic
global vegetation model forced with climate anomalies from
10 models of the Coupled Model Intercomparison Project
(CMIP6) and three standard future scenarios. These projec-         1   Introduction
tions are seamlessly continued from a transient simulation
from the Last Glacial Maximum to the present to account for        Peatlands are a wetland type that is characterized by thick
the full transient history and are continued beyond 2100 with      layers of accumulated organic matter facilitated by perma-
constant boundary conditions.                                      nently waterlogged conditions (Moore, 1989; Blodau, 2002).
   Our results suggest short to long-term net losses of global     Suitable conditions can vary globally and can depend on lo-
peatland area and carbon, with higher losses under higher-         cal hydrology, topography, climate, and vegetation (Gorham,
emission scenarios. Large parts of today’s active northern         1957), resulting in multiple forms from minerotrophic fens to
peatlands are at risk, whereas peatlands in the tropics and,       ombrotrophic bogs and forested tropical peat swamps (Rydin
in case of mitigation, eastern Asia and western North Amer-        and Jeglum, 2013; Page and Baird, 2016; Lindsay, 2018). Al-
ica can increase their area and carbon stocks.                     though peatlands cover only 3 % of the global land area (Xu
   Factorial simulations reveal committed historical changes       et al., 2018b), they have an integral role in the global car-
and future rising temperature as the main driver of future         bon cycle (Gorham, 1991; Yu, 2011; Page et al., 2011). They
peatland loss and increasing precipitations as the driver for      function as long-term carbon stores holding up to a third of
regional peatland expansion.                                       the total global soil organic carbon (Page et al., 2011; Yu,
   Additional simulations forced with climate anomalies            2012). Most of today’s peatlands formed and accumulated
from a subset of climate models which follow the extended          carbon over the last 12 000 years, driven by deglacial cli-
CMIP6 scenarios, transient until 2300, show qualitatively          mate change and ice sheet retreat (e.g., Halsey et al., 2000;
similar results to the standard scenarios but highlight the im-    Gajewski et al., 2001; MacDonald et al., 2006; Gorham et al.,
                                                                   2007; Yu et al., 2010; Ruppel et al., 2013; Morris et al., 2018;

Published by Copernicus Publications on behalf of the European Geosciences Union.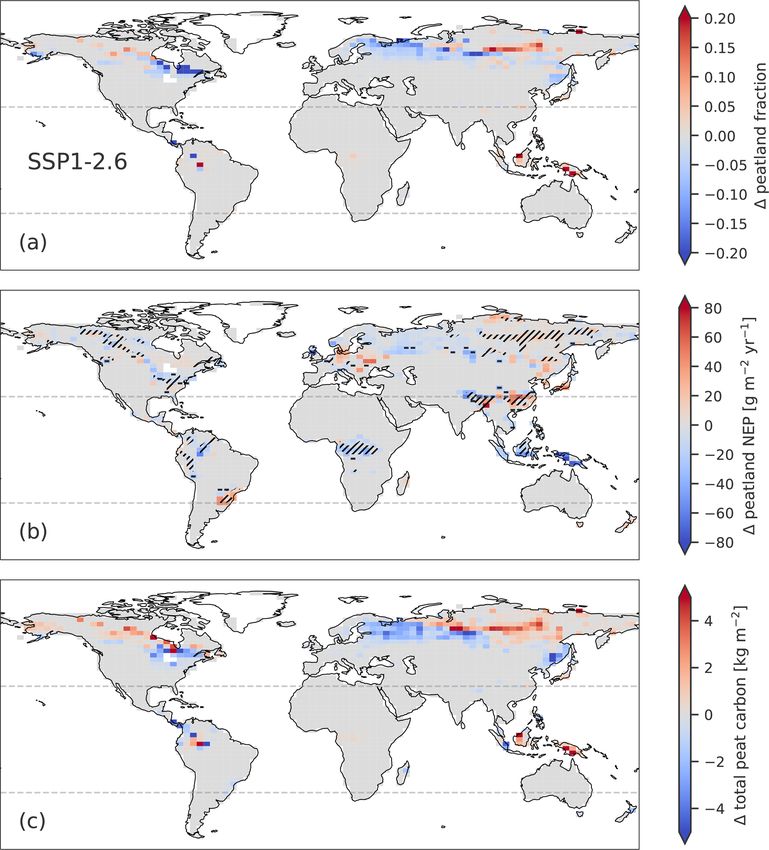
3658                                   J. Müller and F. Joos: Committed and projected future changes in global peatlands

Treat et al., 2019; Müller and Joos, 2020). Peatlands often       Zhang et al., 2020) and eastern Canada peatlands (Pellerin
are at the same time long-term sinks of carbon (e.g., Gorham      and Lavoie, 2003). The water table is an important regulator
et al., 2012; Lähteenoja et al., 2012; Leifeld et al., 2019)      in peatland ecosystems with complex feedbacks to vegeta-
as well as large natural sources of methane (e.g., Frolking       tion and carbon cycling (Sawada et al., 2003; Zhong et al.,
and Roulet, 2007; LAI, 2009; Korhola et al., 2010; Yu et al.,     2020). A water table drawdown leads to increased fire fre-
2013; Packalen et al., 2014; Dommain et al., 2018). The net       quency (Turetsky et al., 2015) and a shift in vegetation cover
radiative effect over the Holocene has been a cooling (Frolk-     from moss-dominated to shrub- and tree-dominated (Pellerin
ing and Roulet, 2007).                                            and Lavoie, 2003; Talbot et al., 2010; Pinceloup et al., 2020;
   Apart from their function as long-term carbon stores, and      Beauregard et al., 2020). Lower water tables also lead to the
net carbon sinks, peatlands provide many more important           exposure of progressively deeper peat layers to oxic condi-
ecosystem services (Kimmel and Mander, 2010; Page and             tions, increasing decomposition (Ise et al., 2008; Zhong et al.,
Baird, 2016). Peatlands act as hydrological buffers providing     2020). Higher temperatures also generally lead to higher
purified drinking water (Xu et al., 2018a). As unique ecosys-     decomposition rates with increases in both measured CO2
tems, peatlands are a habitat to many rare and specialized        (Hopple et al., 2020; Kluber et al., 2020) and methane emis-
species and thus preserve global biodiversity (Minayeva and       sions (Turetsky et al., 2014). Although some studies suggest
Sirin, 2012). Culturally they can serve recreational and spir-    deep peat carbon to be robust under future warming (Wil-
itual functions. For environmental researchers, they provide      son et al., 2016). In the northern high latitudes, this might
a unique archive for environmental and cultural change over       be offset by increases in plant productivity, even leading to
millennia (de Jong et al., 2010).                                 net increases in carbon accumulation (Charman et al., 2013;
   Direct and indirect anthropogenic disturbances, however,       Gallego-Sala et al., 2018).
have exerted increasing pressures on global peatlands, threat-       About 46 % of northern peatlands are underlain by per-
ening their important ecosystem services and potentially          mafrost (Hugelius et al., 2020), which in some regions is
putting large carbon stocks at risk (Posa et al., 2011; Gold-     quickly thawing as a response to global warming (Camill,
stein et al., 2020). Direct disturbances include peatland         2005; Lara et al., 2016; Mamet et al., 2017). Permafrost thaw
drainage for land-use conversion and peat mining, which           is projected to accelerate dramatically depending on the fu-
has led to large carbon losses in temperate and tropical re-      ture scenario (Lawrence et al., 2012; Guo and Wang, 2016).
gions (Hergoualc’h and Verchot, 2011; Dohong et al., 2017;        Permafrost peatlands have been found to often collapse af-
Leifeld et al., 2019; Dommain et al., 2018; Hoyt et al., 2020).   ter thaw and form thermokarst landscapes and collapse-scar
Low water tables after drainage also facilitate increased peat    wetlands (Payette et al., 2004; Olefeldt et al., 2016; Mag-
burning (Turetsky et al., 2015; Page and Hooijer, 2016).          nússon et al., 2020) characterized by carbon loss and high
Drainage of agricultural areas can also affect neighboring        methane emissions (Jiang et al., 2020; Voigt et al., 2019;
unmanaged peatlands (Beauregard et al., 2020). Degradation        Turetsky et al., 2020; Estop-Aragonés et al., 2020). Given
following past land-use conversion will continue to release       sustained inundation, renewed and invigorated accumulation
large amounts of carbon over decades to come (Leifeld and         is assumed to set in after collapse, leading to an eventual re-
Menichetti, 2018). Given prompt action, this committed and        turn to a net cooling effect after decades to millennia of net
additional carbon loss could be partly mitigated with large-      warming (Swindles et al., 2015; Jones et al., 2017; Magnús-
scale restoration and re-wetting efforts (Warren et al., 2017;    son et al., 2020). However, some peatlands show an increase
Nugent et al., 2019; Günther et al., 2020) in conjunction         in carbon accumulation already directly after thaw (Estop-
with strong protection policies (Humpenöder et al., 2020;         Aragonés et al., 2018).
Wibisana and Setyorini, 2021).                                       Investigating the potential future trajectories of global
   Indirect human disturbances are mediated through anthro-       peatlands is of great importance, given the multiple pres-
pogenic climate change which is rapidly changing the bound-       sures on peatlands as unique ecosystems and carbon stores,
ary conditions for global peatlands. Mean annual precipita-       which will further increase with future climate and land-use
tion is projected to increase in regions of large peatland ex-    change. Although the potential feedbacks between peatlands,
tent such as the northern high latitudes and Southeast Asia       the carbon cycle, and the climate system could be immense,
(Collins et al., 2013), possibly improving conditions for peat-   peatlands are in general still not included in state-of-the-art
land development and carbon accumulation. However, in-            earth system models (ESMs) (Loisel and Bunsen, 2020), with
creases in precipitation are often offset by increased evapo-     only a few exceptions (Schuldt et al., 2013). A large part of
transpiration under a warmer climate. Temperatures are pro-       the global carbon cycle is thus also missing in the future cli-
jected to disproportionately increase in the northern high lat-   mate and carbon cycle projections used for the determina-
itudes (Collins et al., 2013), where the largest portion of       tion of international climate mitigation targets, such as the
global peatlands reside (Xu et al., 2018b). Industrial warming    sixth phase of the Coupled Model Intercomparison Project
has already led to increases in peatland evapotranspiration       (CMIP6) (Eyring et al., 2016). Different approaches have
(Helbig et al., 2020b), leading to a widespread drying trend      been used to independently project different aspects of future
in the peatlands of northern Europe (Swindles et al., 2019;       peatland dynamics under future scenarios. Paleo-data-driven

Biogeosciences, 18, 3657–3687, 2021                                                  https://doi.org/10.5194/bg-18-3657-2021
J. Müller and F. Joos: Committed and projected future changes in global peatlands                                               3659

approaches can be used to investigate future peatland carbon        2     Methods
accumulation rates (Gallego-Sala et al., 2018). Bioclimatic
envelope models enable estimates of regional peatland area          2.1    Model description
changes in blanket bogs in the United Kingdom (Gallego-
Sala et al., 2016; Ferretto et al., 2019) and China (Cong et al.,   All simulations were performed with the Land surface Pro-
2020). Process-based models provide another way to project          cesses and eXchanges (LPX-Bern) dynamic global vegeta-
potential futures of complex systems under changing bound-          tion model (DGVM) version 1.4 (Lienert and Joos, 2018).
ary conditions. Peatland projections, however, have mostly          The model setup is mostly identical to Müller and Joos
focused on peatland area (Alexandrov et al., 2016) and peat-        (2020), which is briefly described below. LPX-Bern includes
land carbon dynamics (Spahni et al., 2013; Warren et al.,           an interactive carbon, water, and nitrogen cycle and simu-
2017; Wang et al., 2018; Chaudhary et al., 2017; Voigt et al.,      lates dynamic vegetation composition with plant functional
2019; Swinnen et al., 2019; Chaudhary et al., 2020) inde-           types (PFTs), which compete for water, light, and nutrients
pendently. A still limited but increasing number of dynamic         (Sitch et al., 2003; Xu-Ri et al., 2012; Spahni et al., 2013).
global vegetation models (DGVMs) with dynamically de-               The implementation of permafrost and peatlands as long-
termined peatland area (Kleinen et al., 2012; Stocker et al.,       term carbon stores is based on the LPJ-WHyMe model (Wa-
2014b; Largeron et al., 2018; Qiu et al., 2018) enables, for        nia et al., 2009a, b) with the addition of dynamic peatland
the first time, the projection of peatland area and carbon dy-      area (Stocker et al., 2014b).
namics on a large spatial scale (Qiu et al., 2020). The focus,         Peatland vegetation is represented by five peat plant func-
however, is still often put on northern boreal peatlands alone      tional types (PFTs): Sphagnum and flood-tolerant graminoids
(Chaudhary et al., 2020; Qiu et al., 2020).                         as indicative mostly for high-latitude peatlands, and flood-
   The dynamic simulation of peatlands is complicated by the        tolerant tropical evergreen, deciduous tree PFTs, and a flood-
non-trivial model spinup. Peatland initiation, expansion, and       tolerant C4 type grass as indicative mostly for tropical peat-
peat carbon accumulation and loss occurred at different times       lands (Stocker et al., 2014b). Carbon cycling in peat soils is
in different regions during the glacial termination and the         based on the distinction between a lower, fully water satu-
Holocene as climate and environmental conditions changed.           rated slow overturning pool (catotelm; from 0.3 to 2 m of the
However, peat models are typically spun up uniformly for            soil column) and an upper, fast-overturning pool (acrotelm;
all regions, over a constant period, and by applying constant       upper 0.3 m of the soil column) with fluctuating water table
preindustrial climate and environmental (e.g., CO2 , total land     position (WTP) (Spahni et al., 2013). Decay rates are modu-
area, and land-use area) conditions. This common spinup ap-         lated by temperature in the catotelm and by temperature and
proach does not fully account for the transient and gradual         WTP in the acrotelm (Wania et al., 2009a). The size and sign
evolution of peatlands, driven and constrained by transient         of the carbon flux between acrotelm and catotelm are deter-
climate evolution, ice sheet retreat, and sea-level rise (Loisel    mined by the acrotelm carbon balance. Methane emissions
et al., 2017). In a system with long timescales such as peat-       from peatlands are simulated but not part of the analysis in
lands, the system’s history might be a strong determinant of        this study.
future changes.                                                        The area fraction covered by peat in a given grid cell is
   Here we present the first combined projection of global          determined dynamically with the DYPTOP module (Dynam-
peatland area and carbon dynamics. A previously published           ical Peatland Model Based on TOPMODEL) (Stocker et al.,
transient simulation from the Last Glacial Maximum (LGM,            2014b). The TOPMODEL approach (Beven and Kirkby,
22 000 years before present) to the present (Müller and             1979) is used to predict the monthly inundated area fraction
Joos, 2020) is used to base the projections on a fully tran-        given sub-grid-scale topographic information and mean grid
sient spinup. This allows not only the consideration of all         cell WTP, averaged over all land classes. The area potentially
legacy effects of the transient peatland development but also       available for peatlands is then determined by inundation per-
the consideration of former peatlands in the carbon bal-            sistency. Peatlands expand or shrink towards a changing po-
ance calculation. Committed and future peatland responses           tential extent with a rate of 1 % of their current grid cell frac-
to three different standard future emission and land-use sce-       tion per year. The grid cell fraction lost during peatland re-
narios are investigated using the DGVM LPX-Bern. Sim-               treat is treated as a separate land class for former peatlands.
ulations are continued with constant forcing beyond 2100            It inherits the carbon stocks of the shrinking peatland and is
to reveal delayed long-term effects on peatlands over the           subsequently treated in the same way as the mineral soils re-
next 5000 years. Standard simulations are compared to ad-           garding vegetation, hydrology, and carbon cycling. Growing
ditional simulations with extended transient scenario forcing       active peatlands first expand on former peatlands inheriting
until 2300 and constant forcing thereafter. Uncertainties and       the remaining carbon there. This treatment prevents carbon
drivers are analyzed using multiple climate model forcings          dissolution into mineral soils due to fluctuations in peatland
and factorial simulations.                                          area.
                                                                       Different to Müller and Joos (2020) we also consider
                                                                    changing land-use area in our simulations. Land-use area in

https://doi.org/10.5194/bg-18-3657-2021                                                     Biogeosciences, 18, 3657–3687, 2021
3660                                   J. Müller and F. Joos: Committed and projected future changes in global peatlands

the model is represented by three specific land classes: pas-     converted to land-use areas. Yet, this peat carbon is mixed
ture, cropland, and urban (Lienert and Joos, 2018). Pastures      within the model’s soil pools and cannot be directly distin-
and croplands have specific vegetation represented by two         guished from carbon transferred to soils from more recently
herbaceous PFTs each. Changes in land-use area are treated        established vegetation. It is, however, possible to track peat
as net changes, where all growing land classes proportionally     carbon that at one point was sequestered in the catotelm of
inherit the carbon, water, and nutrients of all shrinking land    active peatlands through the soil pools of other land classes
classes. A more complex implementation, which considers           using post processing. For this, transient model output for
gross changes, exists but is not compatible with the peat-        peatland area changes, the decay rates of slow overturning
land module used here (Stocker et al., 2014a). In the absence     pools, and the carbon input into the catotelm of active peat-
of gross change information, three assumptions were made.         lands is needed. Area changes are used to transfer carbon
(1) Changes within the three land-use classes that do not af-     between active peatlands, former peatlands, land-use areas,
fect the total land-use area are assumed as shifts between        and natural vegetation classes. Transient decay rates are used
land-use types (e.g., shift from pasture to cropland). (2) In-    to decay the carbon in the respective pools. Carbon is thus
creases in total land-use area reduce all other land classes      tracked from its entry into the catotelm of an actively accu-
proportionally, including peatlands. (3) Peatland area that is    mulating peatland until its decay there or in a former peat-
converted to land-use area cannot be reclaimed by expanding       land or land-use area. This approach cannot take account of
peatlands at a later stage. These assumptions are simplifica-     the acrotelm carbon. However, acrotelm carbon constitutes
tions that fail especially in areas where peatlands are prefer-   only a small part of simulated total peatland carbon (5 % at
entially targeted for land-use conversion, such as in Indone-     1975), and we can assume that this carbon at the peat sur-
sia (Dommain et al., 2018; Hoyt et al., 2020), or are sub-        face is quickly respired after peatland transformation. For
ject to restoration efforts after conversion (e.g., Haapalehto    the analysis, we refer to two different variables related to
et al., 2011; Young et al., 2017). However, given the techni-     peat carbon: (1) peatland carbon, which refers to the car-
cal restrictions and the lack of detailed worldwide informa-      bon stored in the acrotelm and catotelm pools of active peat-
tion about gross land-use changes on peatlands, we think this     lands, and (2) total peat carbon, which is calculated in post-
simplified approach is the most robust.                           processing and represents all carbon in the catotelm of active
   The above-described representation of peatlands in the         peatlands and organic, not-yet-decomposed carbon that was
LPX is a simplification in many respects. The absence of lo-      at some point sequestered into a catotelm on peatlands trans-
cal processes and information such as lateral water flow, lo-     formed to land-use areas and other former peatlands. After
cal soil features, or influence of animals by grazing and river   ecosystem transformation, depending on the transition and
damming can limit the ability of the TOPMODEL approach            the conditions thereafter, former peatlands can see a fast col-
to predict peatlands on a regional to local scale. Further, di-   lapse or erosion of carbon stocks (Hoyt et al., 2020; Li et al.,
rect human-caused influences such as land use, drainage, or       2018) as well as buried peat carbon layers preserved for mil-
peat mining are only considered in a strongly simplified way.     lennia (Treat et al., 2019). The two carbon variables can be
The lack of a distinction and transition between different        interpreted as two bounding cases to the fate of peat carbon
peatland types like fens, bogs, blanket bogs, or marshes ne-      in former peatlands. Changes in the variable peatland car-
glects possible differences in the constraints on their forma-    bon can represent a fast emission bounding case where peat-
tion and evolution. The treatment of acrotelm and catotelm as     land carbon is lost immediately after ecosystem or land-use
single carbon pools, and the absence of strong disturbances       transformation. The slow emission bounding case, with peat
such as peat fires, constitute limits on the comparability of     carbon decaying in former peatlands over a long timescale,
the model results to peat core carbon profiles. This simpli-      can be represented by changes in the variable total peat car-
fied representation, nevertheless, has been shown to repro-       bon. The true fate of peat carbon in former peatlands in most
duce peatland area and carbon accumulation well within the        cases will lie somewhere in between these worst- and best-
observational constraints (Wania et al., 2009a; Spahni et al.,    case scenarios.
2013; Stocker et al., 2014b, 2017; Müller and Joos, 2020)
while using a minimal set of free parameters.                     2.3   Simulation setup

2.2    Calculation of peat carbon                                 The simulations presented here are a direct continuation of a
                                                                  transient simulation from the Last Glacial Maximum (LGM)
Peat carbon can be present not only in soils of active but also   to the present, which was discussed in detail in Müller and
in the soils of former peatlands. Peat may be preserved dur-      Joos (2020). This enables future projections starting from
ing peatland conversion and form distinct organic soil layers     a truly transient spinup, including all potential legacy ef-
on non-peatland areas (Lähteenoja et al., 2012; Broothaerts       fects of the past 22 000 years. The LGM simulation was
et al., 2014; Xu et al., 2016; Campos et al., 2016; Treat         run with a model resolution of 2.5◦ latitude × 3.75◦ longi-
et al., 2019). In the model, subsequent land classes inherit      tude and was forced with CO2 (Joos and Spahni, 2008) and
the soil carbon from former peatlands, including peatlands        temperature and precipitation fields. Temperature and precip-

Biogeosciences, 18, 3657–3687, 2021                                                  https://doi.org/10.5194/bg-18-3657-2021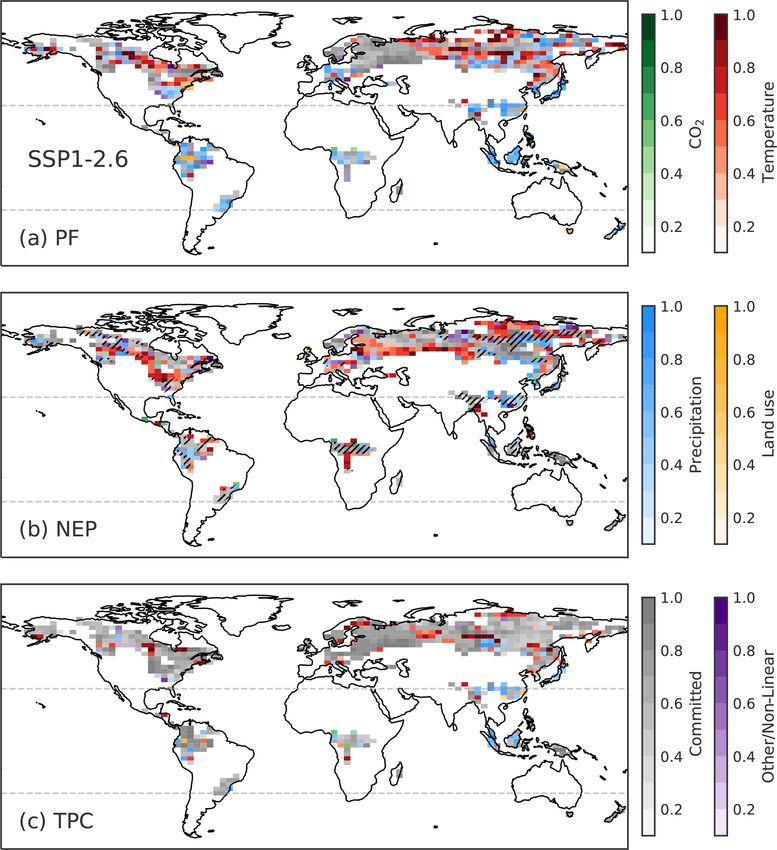
J. Müller and F. Joos: Committed and projected future changes in global peatlands                                        3661

itation anomalies were taken from the transient CCSM3 run        ditions at 2014 levels for each ensemble member. Here cli-
TraCE21k (Liu et al., 2009). The TraCE21k anomalies were         mate forcing was extended with a detrended version of the
imposed on the CRU TS 3.1 (Mitchell and Jones, 2005) base        last 30 years of the historical forcing. Similarly, a control
climate from 1960 to 1990. Interannual variability thus came     simulation was performed with constant boundary conditions
from TraCE21k. Temperature anomalies were calculated as          after 1500 to show the undisturbed model state. These sim-
absolute and precipitation anomalies as relative values.         ulations reveal the committed changes in peatland area and
   The resolution of the LGM simulation was adopted for          carbon induced by the deglacial changes prior to the prein-
the future simulations. This ensures a truly seamless tran-      dustrial state at 1500 and the changes over the historical pe-
sition between the simulations, without unpredictable effects    riod until 2014 respectively.
of downscaling on peatland dynamics.
   In the original LGM simulation, land use was not consid-      2.4   Driver contributions
ered as the focus of the study was on the natural develop-
ment and evolution of peatlands since the LGM. To integrate      To determine the different driver contributions to the changes
a transient history of land use, the simulation was restarted    in peatland variables, additional factorial simulations were
in the year 1500 with subsequent transient land-use forcing      performed for all scenarios and climate model ensemble
(Hurtt et al., 2020) and otherwise unchanged boundary con-       members. For each standard simulation, there are five facto-
ditions.                                                         rial simulations with one of the five transient forcings (tem-
   In the year 1975, the midpoint of the base climate period,    perature, precipitation, cloud cover, CO2 , and land use) kept
forcing transitions from TraCE21k to CMIP6 climate anoma-        constant at 2014.
lies (temperature, precipitation, and cloud cover) (O’Neill         The driver contribution to the anomaly of peatland vari-
et al., 2016, see Fig. 1), whereas the base climate remains      ables was determined as the difference between the standard
unchanged. From this point on, simulations are done for          run anomaly and the anomaly in the respective factorial run.
each model of a 10-member climate model ensemble (see            The contribution from already committed changes due to past
Sect. 2.5). Short historical simulations from 1975 to 2014       climate and land-use change was determined as the anoma-
bridge the gap between the LGM simulation and the start of       lies in the simulations with overall constant forcing after
the CMIP6 scenarios with anomalies taken from the CMIP6          2014 (see Sect. 2.3). The residual of the difference between
historical simulation of the climate model ensemble.             the sum of all contributions and the standard run anomaly
   Simulations corresponding to three different CMIP6 sce-       was identified as the contributions from non-linear interac-
narios start from the year 2015. One strong-mitigation sce-      tions and other factors not considered in the analysis. Cloud
nario (SSP1-2.6), one middle-of-the-road scenario (SSP2-         cover was found to have only a minimal effect on the con-
4.5) and one high-emission scenario (SSP5-8.5) were se-          sidered peat variables in the LPX-Bern, and thus for further
lected to represent the scenario range. The standard CMIP6       analysis its contribution was added to the other/non-linear
scenarios end in the year 2100. To investigate the delayed       category.
long-term responses of peatlands, the forcing is extended into      As a second step, driver contributions were classified
the future with a detrended version of the last 30 years of      as driving contributions (same sign as peatland variable
each time series repeated over almost 5000 years until the       anomaly) and dampening contributions (opposite sign as
year 7000. The trend correction was done per grid cell and       peatland variable anomaly) and re-normalized respectively.
month and with respect to the end of the time series. Scenario   Figures show only the driving contributions of the respective
CO2 forcing was adopted from Meinshausen et al. (2020).          positive and negative peatland variable anomalies.
Land-use forcing is taken from the Land-Use Harmonization
(LUH2) project (see Fig. 2g–i, Hurtt et al., 2020).              2.5   Climate model selection
   CMIP6 also includes extended versions of the scenarios
SSP1-2.6 and SSP5-8.5 that range until 2300. At the time of      We chose a subset of 10 climate models out of a CMIP6 en-
this study, however, only three climate models had provided      semble of 22 models (see Figs. 2a–f and S1) that at the time
output for these extended scenarios. Climate projections of      (June 2020) provided monthly output for all necessary forc-
these three models alone are not representative of the full      ing variables – precipitation, near-surface temperature, and
CMIP6 scenario. They were, however, included in the 10-          cloud cover – and for all considered experiments – historical,
member climate model ensemble used here (see Sect. 2.5 and       SSP1-2.6, SSP2-4.5, and SSP5-8.5. Climate model output
Fig. S1) and additional simulations with transient climate and   was downloaded from the earth system grid database. One
CO2 forcing until 2300 were performed to compare results to      additional model, the Community Integrated Earth System
the standard simulations.                                        Model (CIESM), had to be excluded from the CMIP6 en-
   To disentangle future changes in peatlands that are induced   semble as it showed a discontinuity in the precipitation data
by changes in climate, CO2 , and land use up to 2014 from        between the historical and the scenario simulations.
those induced by future changes in these drivers, we per-           Three models, IPSL-CM6A-LR, MRI-ESM2-0, and
formed an additional simulation with constant boundary con-      CanESM5, were included in the subset a priori as they were

https://doi.org/10.5194/bg-18-3657-2021                                                Biogeosciences, 18, 3657–3687, 2021
3662                                    J. Müller and F. Joos: Committed and projected future changes in global peatlands

Figure 1. Diagram of the simulation setup. A transient simulation from the LGM to 1975 and with additional land-use forcing after 1500
(LGM∗ ) is followed by short historical simulations until 2014 (HIST) and subsequent standard and extended Shared Socioeconomic Pathway
(SSP) scenario simulations forced by CMIP6 climate anomalies. After the end of the transient forcing (solid arrows), SSP scenarios are
continued with constant forcing (light color arrows). Additional commitment simulations with constant boundary conditions start at 1500
and 2014.

the only ones that also provided output for both of the ex-           2.6   Present-day model state
tended SSP1-2.6 and SSP5-8.5 scenarios (see Sect. 2.3). The
other seven were chosen for the ensemble subset to optimally          There are still considerable uncertainties connected to esti-
represent the full CMIP6 ensemble as a whole. The optimiza-           mates of the global area covered by peatlands and the amount
tion targets of ensemble total range, interquartile range, and        of organic carbon stored within them. Estimates for northern
median, were defined with respect to the anomalies (from              peatland area, using various methods ranging from inventory
1961–1990 to 2071–2100) in precipitation and temperature              based to machine learning, lie between 2.4 and 4.0 million
as the most important forcings to the LPX-Bern. The opti-             square kilometers (Mkm2 ) (Yu et al., 2010; Loisel et al.,
mization was inspired by McSweeney and Jones (2016). A                2017; Xu et al., 2018b; Hugelius et al., 2020). For tropical
total of 2000 randomly drawn subsets were ranked accord-              peatlands, which are still much less studied than northern
ing to the distance of the subset to the targets with normal-         peatlands, peatland area estimates have increased in recent
ized scores calculated and averaged over all individual grid          years following the discovery of large new peatland com-
cells, months, scenarios, and variables. The rating of the best-      plexes, such as in the Congo Basin (Dargie et al., 2017),
performing subsets was further improved by a careful hand-            and due to new methodologies trying to account for poten-
picked combination, resulting in the final subset including           tially undiscovered peatlands (Gumbricht et al., 2017). Ear-
the climate models referenced in Table 1.                             lier estimates of tropical peatland area thus range from 0.37
   This subset performs best when calculated both over the            to 0.44 Mkm2 (Yu et al., 2010; Page et al., 2011) and more
total land area and over the simulated peatland area alone.           recent estimates from 1.0 to 1.7 Mkm2 (Gumbricht et al.,
Over land, temperature anomaly total range, interquartile             2017; Xu et al., 2018b). Peatland areas simulated by LPX
range, and median differ between the ensemble subset and              in the year 1975, the end of the transient simulation from
the full ensemble by 0.25, −0.18, and 0.02 ◦ C respectively,          the LGM, are within the range of literature estimates with
with larger distance at higher-emission scenarios. Averaged           a global, northern (> 30◦ N), and tropical (30◦ S to 30◦ N)
over the simulated peatland area at 1975, the distances are           peatland area of 3.8, 2.8, and 1.0 Mkm2 respectively. Global
0.28, −0.31, and 0.03 ◦ C respectively. For precipitation,            peatland area is shifted more towards the tropics as in most
anomaly total range, interquartile range, and median differ           estimates. However, most major peatland complexes seen in
between full ensemble and ensemble subset by 9.7, 0.64, and           global peatland maps, e.g., PEATMAP (Xu et al., 2018b, see
−0.15 mm over all land area and 7.3, 0.54, and −0.49 mm               Fig. 3), are captured well. Major regional differences exist
over the peatland area respectively. The optimization proce-          in Africa, where LPX-Bern fails to simulate the large Congo
dure thus yielded an ensemble subset representative of the            Basin peatland complex. Peatland area is also underestimated
full CMIP6 ensemble, although, given the number of pos-               in northern Europe. In North America the model overesti-
sible combinations, optimization could be improved further            mates peatland area in Alaska and Quebec and underesti-
with further sampling.                                                mates peatland extent in western Canada.
                                                                         Estimates of global peatland carbon are directly depen-
                                                                      dent on peatland area estimates and thus also come with a
                                                                      large uncertainty range. Northern peatlands have been esti-

Biogeosciences, 18, 3657–3687, 2021                                                      https://doi.org/10.5194/bg-18-3657-2021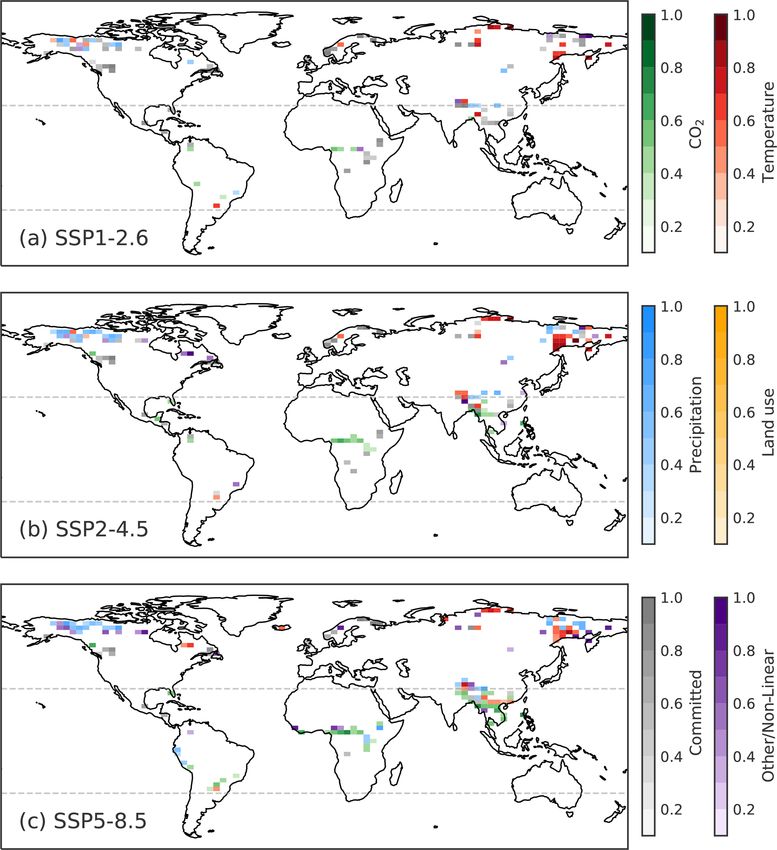
J. Müller and F. Joos: Committed and projected future changes in global peatlands 3663
Table 1. Ensemble of CMIP6 earth system models used to force the LPX-Bern. Output data were used for monthly precipitation, surface
temperature, and cloud cover from the “r1i1p1f1” variant of the respective historical simulations and future scenarios SSP1-2.6, SSP2-4.5,
and SSP5-8.5
Model Model reference Data reference
CAMS-CSM1-0 Rong et al. (2018) Rong (2019a, b)
GFDL-ESM4 Dunne et al. (2020) Krasting et al. (2018); John et al. (2018)
CanESM5 Swart et al. (2019a) Swart et al. (2019b, c)
EC-Earth3 Döscher et al. (2021) EC-Earth Consortium (EC-Earth) (2019a, b)
INM-CM5-0 Volodin et al. (2017) Volodin et al. (2019a, b)
IPSL-CM6A-LR Boucher et al. (2020) Boucher et al. (2018, 2019)
MPI-ESM1-2-LR Mauritsen et al. (2019) Wieners et al. (2019b, a)
MRI-ESM2-0 Yukimoto et al. (2019a) Yukimoto et al. (2019b, c)
KACE-1-0-G Lee et al. (2020) Byun et al. (2019b, a)
NorESM2-LM Seland et al. (2020) Seland et al. (2019a, b)
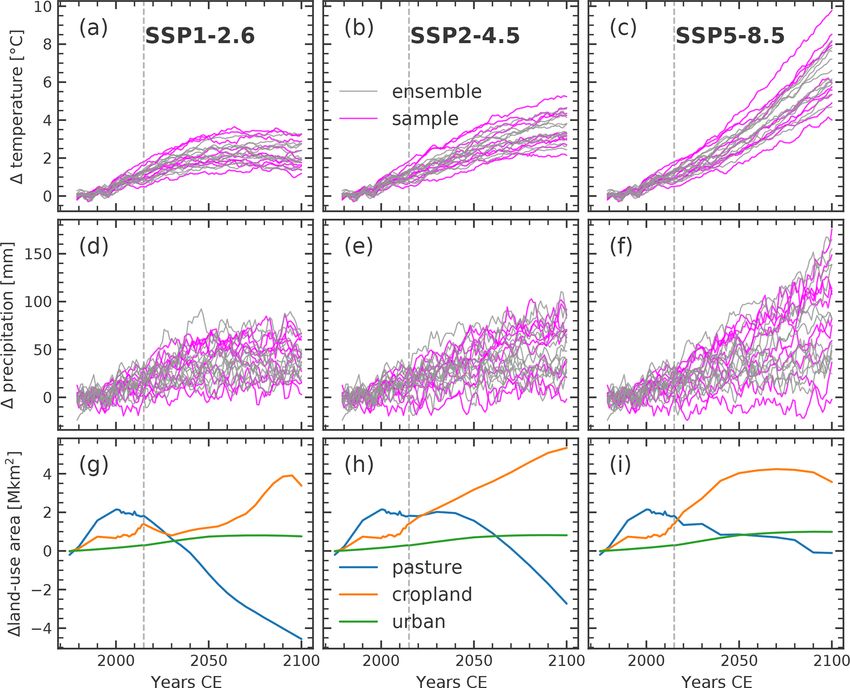
Figure 2. Global surface air temperature (a–c), precipitation (d–f), and land-use area (g–i) anomalies for the 1961-1990 average for three
CMIP6 scenarios: SSP1-2.6 (a, d, g), SSP2-4.5 (b, e, h), SSP5-8.5 (c, f, i). Magenta lines show anomalies of the climate model ensemble
subset applied to force LPX-Bern versus the rest of the CMIP6 ensemble in gray. Dashed vertical gray lines show the year 2015 from which
the future scenarios diverge. Pasture, cropland, and urban land-use areas amount to 31.2, 14.4, and 0.3 Mkm2 during the 1961–1990 baseline
period respectively.
mated to store 270 to 604 gigatons of carbon (GtC), using accumulated about 441 GtC of soil organic carbon globally.
various methods and area estimates (see Yu, 2012, and Yu From this, northern and tropical peatlands make up 319 and
et al., 2014, for a review). For tropical peatlands, estimates 121 GtC respectively. Simulated carbon stocks thus lie within
of organic carbon storage range from 44 to 92 GtC in ear- the literature estimates but again with a distribution shifted
lier estimates (Yu et al., 2010; Page et al., 2011) and increase more towards the tropics than most estimates suggest.
as a result of larger assumed areas in recent estimates from Throughout the 22 000 years of the transient simula-
70 to 288 GtC (Dargie et al., 2017; Ribeiro et al., 2021). In tion up to the year 1975, peatland area was highly dy-
the year 1975, peatlands simulated by the LPX-Bern have namic with today’s peatlands gradually expanding but also
https://doi.org/10.5194/bg-18-3657-2021 Biogeosciences, 18, 3657–3687, 2021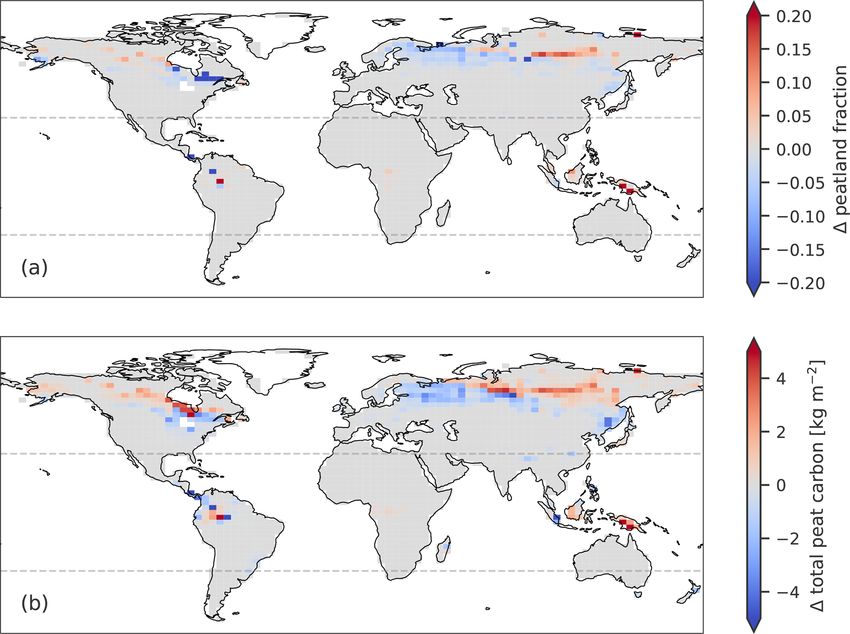
3664                                   J. Müller and F. Joos: Committed and projected future changes in global peatlands

large paleo-peatlands vanishing over time (Müller and Joos,       3.1.2   Committed 2015–2300
2020). There, similarly as described in Sect. 2.2, the carbon
from former peatlands was tracked through subsequent land         Past changes in climate and land use have long-lasting ef-
classes until its decay. At 1975 LPX-Bern gives a total of        fects on global peatlands that are superimposed on changes
195 GtC of peat carbon leftover from former peatlands on          induced by future disturbances. To disentangle the effects
land, with 165 GtC in northern latitudes and 28 GtC in the        of past and future changes in drivers, simulations with con-
tropics. Total peat carbon is thus simulated to be 612 GtC.       stant 2014 boundary conditions were made for each climate
Very little is known about the amount and location of peat        model ensemble member. These “commitment” simulations
leftover and buried from former peatlands, although various       reveal the delayed response to disturbances in the past and
deposits have been found (Treat et al., 2019). Peat carbon        thus represent the committed changes independent of the
lost due to past or future sea-level rise is not considered in    future scenario for climate, land use, and CO2 (Figs. 4, 5,
this study.                                                       and S2).
   Unlike the original LGM simulation in Müller and Joos              In most commitment simulations, global peatland area
(2020), here land use and land-use change is considered since     continues to decrease and reaches a new equilibrium un-
the year 1500, with land-use areas being able to expand onto      til 2300. Gross changes reveal, however, also regions of local
peatlands (see Sect. 2.3). Up to 1975 about 0.42 Mkm2 of          peatland expansion (Fig. 4). Northeastern Canada, northern
peatland area and 50 GtC of peatland carbon are lost from         Europe, and East Asia are regions with large losses, whereas
active peatlands due to land-use change in the simulation.        northwestern Canada, northeastern Asia, and Southeast Asia
Carbon loss is reduced to about 5 GtC when considering to-        see an increase in peatland area up to 2300.
tal peat carbon, which does not assume an immediate loss but          Peatland carbon decreases together with global area in
a slow decay in former peatlands. Leifeld et al. (2019) esti-     most simulations, with the new peatland area showing lower
mate that about 0.51 Mkm2 of peatland area and 22 ± 5 GtC         carbon density as lost areas. Total peat carbon, depending on
of peatland carbon was lost globally from 1850 to 2015            the overall balance of accumulation and decay rather than on
due to drainage and land-use conversion of peatlands, which       peatland area dynamics, is changing only slightly but is de-
is in rough agreement with the simulated values (see also         clining in 8 out of 10 simulations. Taken together, the simu-
Sect. 3.1.1).                                                     lations suggest a small to moderate peat carbon loss to the at-
                                                                  mosphere over the next 300 years given 2014 conditions. Un-
                                                                  certainties, however, are large. The spread between the sim-
3     Results and discussion                                      ulations increases significantly after 2014 despite boundary
                                                                  conditions being kept constant. In the year 2300, the simu-
3.1     Historical and committed changes                          lated global peatland area anomaly relative to 1995–2014 av-
                                                                  erages ranges from −13 % to +4 %, with a median of −4 %
3.1.1    Historical 1975–2014
                                                                  and interquartile range (IQR) from −6 % to −2 % (Table 2).
The gap between the end of the transient LGM run in               Global carbon stored in active peatlands and global total peat
1975 and the beginning of the future scenarios in 2015 is         carbon are simulated to change by −9 (total range: −16 to
bridged by short historical simulations. These are forced         −0; IQR: −10 to −7) % and −1 (−2 to +1; −1 to −0) %
with climate anomalies from the 10 ensemble climate mod-          respectively. The increasing uncertainty highlights how rel-
els (see Sect. 2.3). During this short period, climate anoma-     atively small differences in forcing can propagate and result
lies already drift apart substantially between the different      in large long-term ecosystem and carbon cycle uncertainties.
climate models (see Fig. 2). Differences in climate forcing
                                                                  3.1.3   Committed after 2300
are propagated to differences in peatland responses. Aver-
aged over 1995–2014 simulated global peatland area varies         Some simulated peatland responses to historical changes in
between 3.6–3.8 Mkm2 . Legacy effects and accelerating cli-       climate and land use are delayed even beyond 2300. Be-
mate change lead to a reduction in peatland area with re-         tween about 2700 and 3500 all simulations see a rapid peat-
spect to 1975 in most simulations, resulting in a median of       land expansion. At 3500 the global peatland area anomaly
3.7 Mkm2 . A part of this reduction (median: −0.1 Mkm2 ) is       compared to 1995–2014 averages is +8 (−1 to +16; +5 to
also attributable to an increase in land-use area, which claims   +11) %. With that, peatland area is simulated even larger
an additional 0.06 Mkm2 from 1975 to 2014.                        than at present but with a dramatically shifted global and re-
   The respective carbon stored in global peatlands is simu-      gional distribution. The delayed peatland expansion is lim-
lated to be 423 (419–432) GtC, with changes mostly a result       ited to the northern highest latitudes and the tropics. The re-
of the peatland area changes. Changes in total peat carbon,       sulting peatland distribution at 3500 shows loss of sizable
including carbon in former peatlands (see Sect. 2.2), also are    parts of today’s northern peatlands, with new peatlands partly
mostly negative but small, with global peat carbon stocks at      expanding into permafrost regions and the tropics.
611 (610–612) GtC.

Biogeosciences, 18, 3657–3687, 2021                                                 https://doi.org/10.5194/bg-18-3657-2021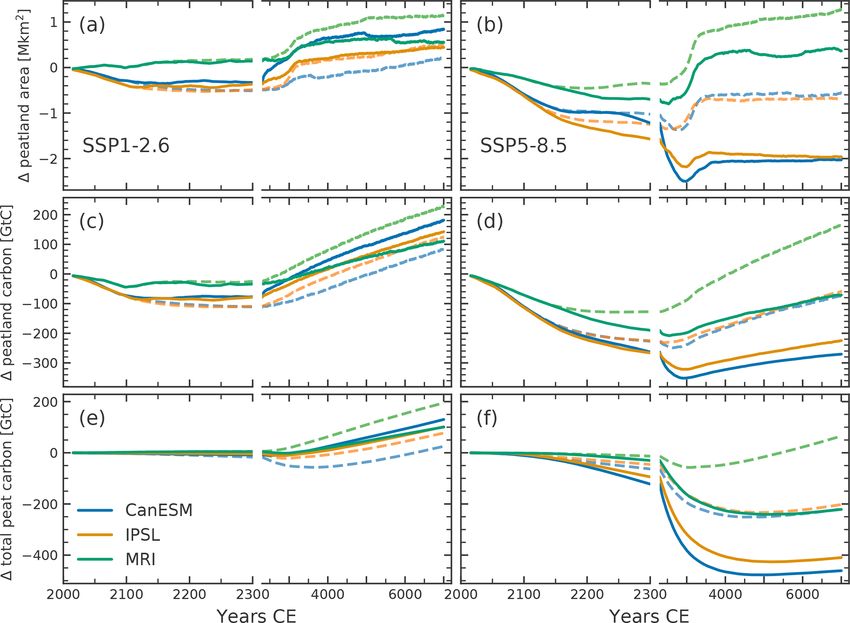
J. Müller and F. Joos: Committed and projected future changes in global peatlands                                                       3665

Figure 3. Global peatland area fraction as (a) estimated by PEATMAP (Xu et al., 2018b), shown here in a 0.5◦ × 0.5◦ gridded version,
and (b) simulated by LPX in the year 1975 after a transient simulation from the Last Glacial Maximum.

Table 2. Median and corresponding interquartile range (IQR) in parentheses of relative anomalies for simulated peatland area, peatland
carbon, and total peat carbon as defined in Sect. 2.2. Medians and the IQR are given relative to 1995–2014 averages. IQR boundaries are
listed in Table S1. Values are rounded to integer values. Northern latitudes are defined as > 30◦ N and tropical latitudes as 30◦ S–30◦ N. For
the reference period, simulated median peatland area, carbon, and total peat carbon is 3.7 Mkm2 , 423 GtC, and 611 GtC for global peatlands;
2.7 Mkm2 , 301 GtC, and 500 GtC for northern peatlands; and 1 Mkm2 , 121 GtC, and 142 GtC for tropical peatlands respectively

                                1 peatland area [%]                  1 peatland carbon [%]               1 total peat carbon [%]
                            2100         2300          3500         2100         2300        3500       2100      2300         3500
         Global
         Committed        −3 (4)       −4 (4)        +8 (5)       −7 (3)     −9 (3)        +4 (6)     −0 (0)    −1 (1)      +1 (4)
         SSP1−2.6         −7 (5)      −4 (17)      +16 (22)      −14 (8)    −12 (21)      +7 (26)     −0 (1)    −0 (3)     +3 (14)
         SSP2−4.5       −11 (10)     −23 (19)        0 (27)     −19 (11)    −33 (22)     −17 (31)     −0 (1)    −2 (4)     −4 (18)
         SSP5−8.5        −14 (9)     −29 (13)       −2 (27)     −22 (10)    −43 (16)     −29 (20)     −1 (1)    −5 (6)    −17 (21)
         Northern
         Committed        −8 (4)      −11 (6)        −4 (5)      −10 (4)     −12 (4)       −1 (4)     +0 (0)    −0 (0)      −0 (2)
         SSP1−2.6       −15 (12)     −18 (28)       −8 (25)     −19 (10)    −18 (30)      −5 (35)     −0 (1)    −1 (3)     −2 (14)
         SSP2−4.5       −22 (15)     −41 (29)      −31 (31)     −26 (15)    −47 (30)     −37 (37)     −0 (1)    −3 (4)    −14 (19)
         SSP5−8.5        −28 (9)     −61 (20)      −54 (30)     −32 (12)    −65 (16)     −61 (27)     −1 (1)    −7 (6)    −32 (25)
         Tropical
         Committed        +9 (7)     +14 (10)      +37 (8)        −0 (3)       +2 (5)     +21 (8)     −0 (1)    −1 (1)     +5 (4)
         SSP1−2.6       +14 (11)     +27 (19)     +66 (26)        +2 (3)       +5 (8)    +32 (21)     +0 (1)    −0 (5)    +13 (16)
         SSP2−4.5       +14 (10)     +34 (15)     +84 (19)        −1 (2)       +2 (6)    +32 (13)     −1 (1)    −1 (4)    +13 (10)
         SSP5−8.5        +19 (9)     +60 (34)    +143 (31)        −0 (4)      +7 (13)    +56 (31)     −1 (1)    +1 (9)    +28 (28)

https://doi.org/10.5194/bg-18-3657-2021                                                           Biogeosciences, 18, 3657–3687, 2021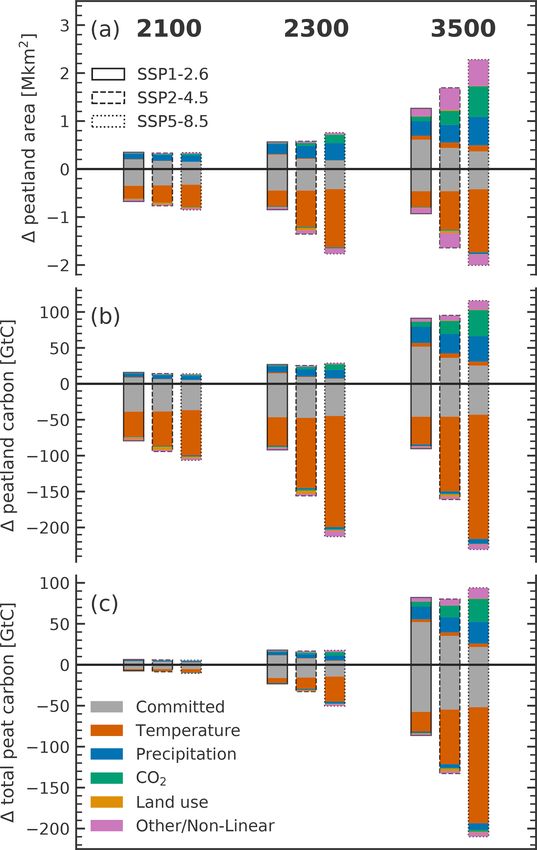
3666                                     J. Müller and F. Joos: Committed and projected future changes in global peatlands

Figure 4. Median anomalies for the simulations with constant 2014 forcing at 2300 in (a) peatland area fraction and (b) total peat carbon as
defined in Sect. 2.2. Anomalies are calculated between 20-year averages spanning 1995–2014 and 2291–2310.

   Carbon accumulation within old, as well as newly formed,             tions could exceed storage under 1500 conditions but only
active peatlands continues over millennia, reaching a global            after millennia of ecosystem transformations and renewed
peatland carbon stock of +4 (−4 to +16; +1 to +8) % in                  carbon accumulation. Another study investigating the fate
the year 3500 compared to 1995–2014 averages, illustrating              of permafrost peatland carbon in the circum-Arctic region
a large long-term accumulation potential (Fig. S2).                     comes to similar conclusions about the future long-term stor-
   For global total peat carbon, the expansion in peatland              age capacity of peatlands (Swindles et al., 2015).
area also results in a trend reversal in most simulations. The
large accumulation in the newly established peatlands helps             3.2     Future projections
to shift the balance from decay-dominated to accumulation-
dominated. At 3500 total peat carbon is simulated at +1 (−5             3.2.1    Standard scenarios
to +7; −1 to +2) % compared to 1995–2014 averages and
continues to increase with continued accumulation until the             2015–2300
end of the simulation.
                                                                        The standard CMIP6 scenarios provide transient climate
3.1.4   1500 control simulation                                         anomalies from 2015 to 2100, after which boundary condi-
                                                                        tions are held constant. Until the end of the century, global
An additional simulation with constant 1500 CE boundary                 peatland area, peatland carbon, and total peat carbon are sim-
conditions, and thus with only limited land use and no indus-           ulated to decline (Table 2). This decline is larger than com-
trial climate change, shows that without major disturbance              mitted changes alone and increases with increasing scenario-
peatland area remains stable, with only a small increase of             based emissions for all three variables (Figs. 5 and 6). These
2 % over the whole 5500 years of simulation (Figs. 5 and                results suggest a clear relationship between future emissions
S2). Carbon shows a stronger positive trend reflecting the              pathways and resulting peatland area and carbon losses until
still large accumulation potential of undisturbed global peat-          the end of the century.
lands, with an increase of 22 % and 17 % for peatland and                  From 2100 to 2300, global peatland area, peatland car-
total peat carbon respectively. Millennium-scale accumula-              bon, and total peat carbon continue to decrease for scenar-
tion rates, however, are larger in simulations with constant            ios SSP2–4.5 and SSP5–8.5 despite constant boundary con-
2014 boundary conditions, due to higher productivity in high            ditions after 2100 (Table 2). Only under the strong-mitigation
latitudes and newly emerging peatlands. This indicates that             scenario SSP1–2.6 do most simulations show an increase in
despite an initial loss peat carbon storage under 2014 condi-           peatland area and partly in carbon compared to 2100. Medi-

Biogeosciences, 18, 3657–3687, 2021                                                         https://doi.org/10.5194/bg-18-3657-2021
J. Müller and F. Joos: Committed and projected future changes in global peatlands 3667
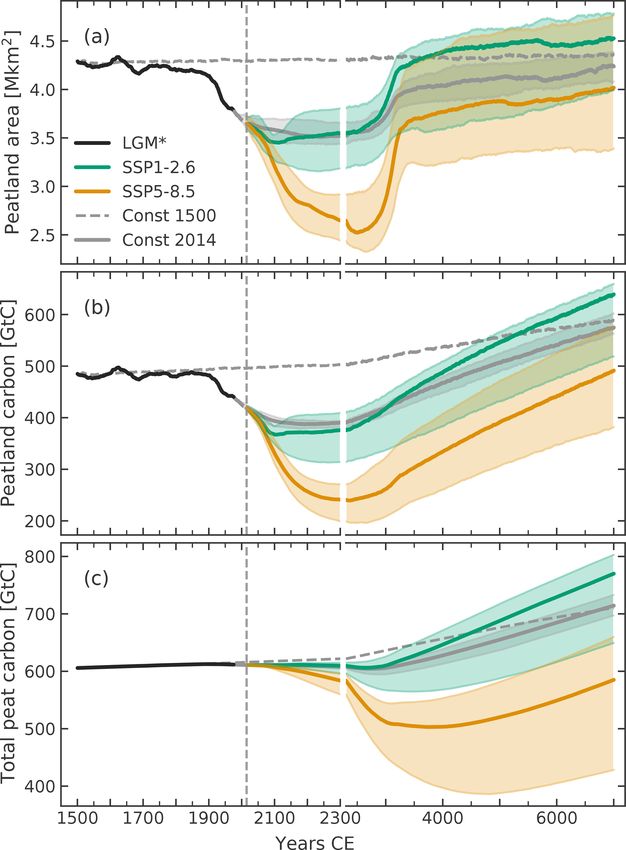
Figure 5. Simulated continued transient evolution after the LGM
run (LGM∗ ) of (a) global peatland area, (b) global peatland car-
bon, and (c) global total peat carbon as defined in Sect. 2.2 under
the SSP1–2.6 and SSP5–8.5 scenarios and under constant 1500 and
2014 forcing. SSP2–4.5 is not plotted to increase readability. Lines
and shading for SSP1–2.6, SSP5–8.5, and constant 1500 forcing
show ensemble medians and interquartile ranges respectively. The Figure 6. Boxplots of anomalies in (a) global peatland
dashed vertical line indicates the year 2014. Note the change in the area, (b) global peatland carbon, and (c) global total peat carbon
time axis after the year 2300. as defined in Sect. 2.2 for simulations under three future scenar-
ios and constant 2014 forcing. Black dots indicate the individual
simulations forced with different climate model anomalies. Boxes
indicate the interquartile range, whiskers the total range, solid lines
ans are similar to the simulations under constant 2014 forc-
the median, and dashed lines the mean. Brown stars indicate addi-
ing. However, the uncertainty, represented by the spread be- tional simulations forced with extended versions of scenario SSP1–
tween the simulations, is larger in the SSP scenarios than in 2.6 and SSP5–8.5. Anomalies are calculated between 20-year av-
the commitment simulations. This uncertainty increases with erages (2091–2110, 2291–2310, and 3491–3510) and the reference
time for all scenarios. period 1995–2014.
Spatial anomaly patterns at 2300 for the strong-mitigation
scenario SSP1–2.6 (Fig. 7) are similar to the committed
changes (Fig. 4). The regions of peatland area loss are north- northern high latitudes become and the more reduced the re-
eastern Canada, northern Europe, central Russia, and East gions of gains are. In the high-emission scenario SSP5–8.5,
Asia, and peatland area increases can be found in northwest- losses dominate most of the northern high latitudes (Fig. 8).
ern Canada, northeastern Asia, and Southeast Asia. Losses Small regions of area gains remain in northeastern Asia but
and gains are further amplified with respect to the commit- with weakened expansion compared to lower-emission sce-
ted changes. Thus, the increase in global area after 2100 in narios. The northern peatland area is simulated to reduce
SSP1–2.6 is not due to a recovery of lost peatlands but rather by 18 %, 41 %, and up to 61 % until 2300 under SSP1–2.6,
due to a stronger increase of peat area in the regions of local SSP2–4.5, and SSP5–8.5 respectively. These results suggest
peatland expansion. that large parts of today’s northern peatlands might be at risk
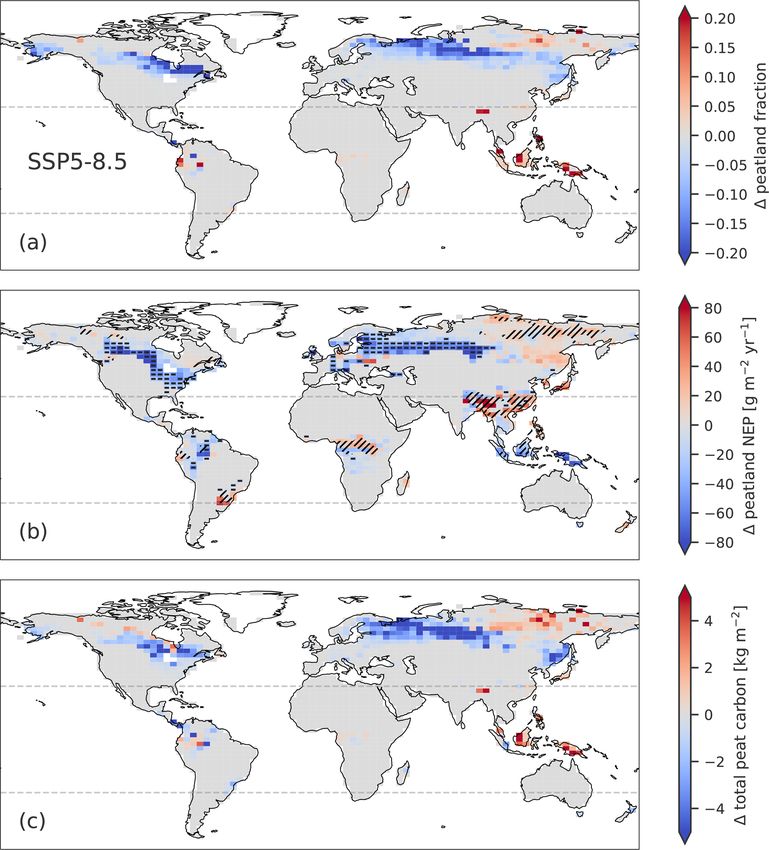
The higher the scenario-based emissions are, the more ex- under future climate change. In the tropics, this trend is re-
tensive the regions of peatland area and carbon loss in the versed, with area expansion in South America and Southeast
https://doi.org/10.5194/bg-18-3657-2021 Biogeosciences, 18, 3657–3687, 20213668 J. Müller and F. Joos: Committed and projected future changes in global peatlands Asia amplified under higher-emission scenarios. Although ern peatland dynamics rather than of declining carbon ac- net area gains in the tropics are substantial, carbon anoma- cumulation rates. Figure 7b shows that the net ecosystem lies remain small and at 2100 only positive for the strong- production (NEP) of active peatlands, which represents the mitigation scenario, indicating a strong concurrent increase net carbon uptake from the atmosphere per year, changes in heterotrophic respiration. only slightly until 2300, with decreases throughout the trop- Taken together these results suggest a likely net loss of ics and in parts of the northern latitudes. Regional increases global peatland area as well as carbon until the end of the in NEP are simulated in central and eastern Europe as well century, driven mostly by northern peatlands, even under the as East Asia. The same is true for the SSP2–4.5 scenario but strongest mitigation scenario and continued net loss up to with slightly larger decreases in the northern mid-latitudes. 2300 for the scenarios SSP2–4.5 and SSP5–8.5, with climate Under the high-emission scenario SSP5–8.5, simulated NEP assumed to remain constant after 2100. This is in contrast decreases strongly in North America, Europe, and western to another recent modeling study investigating future north- Asia, with most mid- to high-latitude active peatlands turn- ern peatland area and carbon dynamics. Qiu et al. (2020) ing from a carbon sink to a carbon source and thus con- used the ORCHIDEE-PEAT DGVM model, with similar tributing directly to the net carbon loss. Regionally NEP in- TOPMODEL-driven peatland area dynamics as the LPX- creases are simulated again mostly in East Asia, with larger Bern and forced by IPSL-CM5A-LR and GFDL-ESM2M increases compared to SSP1–2.6. (Fig. 8b). It has to be noted model climate to simulate northern peatland dynamics from that in the case of regional peatland expansion NEP might 1861–2099. They found a strong positive trend in northern increase independent of environmental drivers, simply due peatland area and together with a sustained sink also in peat- to the dilution of soil carbon. The results are in broad ac- land carbon over the whole historical period and the two in- cordance with a previous study conducted with an older ver- vestigated scenarios RCP2.6 and RCP6.0. They identified the sion of the LPX-Bern. Spahni et al. (2013) conducted tran- main driver of this trend as an internal feedback between grid sient northern peatland simulations from the LGM up to 2100 cell water table position and peatland area, which is indepen- with prescribed peatland area using CMIP5 future climate dent of the climate forcing. This feedback is also part of the anomalies together with the LPX-Bern version 1.0. They LPX-Bern implementation; however, here it does not lead to found mean northern peatland NEP to slightly decrease over a strong sustained historical or future increase in northern time under the RCP2.6 scenario and strongly decrease un- peatland area, illustrated by the relatively stable control sim- der RCP8.5. Qiu et al. (2020), however, simulate net NEP of ulation under constant 1500 boundary conditions (Fig. 5). On northern peatlands to increase slightly and peak mid-century the contrary, here it amplifies the simulated negative trend before a decline back to roughly 2005 levels at 2099. Re- (see Sect. 3.3). One of the main reasons for the different be- gionally, Qiu et al. (2020) project NEP to decline in west- haviors might be the spinup procedure, which is very differ- ern Canada, western Europe, and the China–Russia border, ent in both cases. Whereas Qiu et al. (2020) used an idealized especially under the RCP6.0 scenario, but only matching spinup with constant climate conditions, the spinup in this western Canada as a region of NEP decline simulated by study corresponds to a full transient simulation. Other factors LPX-Bern. In both models, northern peatland productivity could be the different parametrization and implementation and soil carbon respiration increase concurrently but balance details. Despite the differences in projected net peatland area slightly differently. Chaudhary et al. (2020) investigated past trends, there are also regional agreements. Qiu et al. (2020) and future carbon accumulation rates (CARs) of northern- found central and northern Europe to be regions of future high-latitude peatlands up to 2100 using a dynamic vegeta- peatland loss, especially given the warmer IPSL-CM5A-LR tion model and similarly found net increases in simulated forcing, and northeastern Asia to be a region of particularly CARs until the mid-century and declining rates thereafter, strong peatland expansion, partly matching regional patterns which are most pronounced under the RCP8.5 scenario. They presented here. For central Russia, the simulated dynamics found Siberian and highest-latitude peatlands to potentially partly agree with another modeling study. Alexandrov et al. increase their CARs, whereas northern European and North (2016) projected the potential future peatland area in west- American mid-latitude peatlands were most vulnerable to ern Siberia using an impeded drainage model and MPI-ESM carbon sink decreases or even carbon loss, roughly matching climate anomalies. They found a strong increase in potential regions of NEP increases and decreases simulated by LPX- area north of 60◦ N and a strong decrease south of 60◦ N. Bern. Gallego-Sala et al. (2018) used data-derived relation- A similar response pattern can be found in the simulations ships between CARs and climate variables for global future forced with MPI-ESM1-2-LR climate anomalies and weaker projections. They found a latitude-dependent response, with also in the ensemble medians but only up to the SSP2–4.5 CARs increasing continuously until 2300 in high latitudes scenario, after which losses dominate over western Siberia. and decreasing in low latitudes. Under a high-emission sce- Peatland area dynamics translate directly and indirectly nario, CARs switched in mid-latitudes from an increasing into the simulated carbon dynamics. In the strong-mitigation to a decreasing trend with rising temperatures. Changes in scenario, the simulated net loss of northern peatland car- peatland NEP simulated by LPX-Bern have a less-latitude- bon and total peat carbon is mainly a result of the north- dependent pattern but also project carbon uptake to decrease Biogeosciences, 18, 3657–3687, 2021 https://doi.org/10.5194/bg-18-3657-2021
You can also read