Factors controlling marine aerosol size distributions and their climate effects over the northwest Atlantic Ocean region
←
→
Page content transcription
If your browser does not render page correctly, please read the page content below
Atmos. Chem. Phys., 21, 1889–1916, 2021
https://doi.org/10.5194/acp-21-1889-2021
© Author(s) 2021. This work is distributed under
the Creative Commons Attribution 4.0 License.

Factors controlling marine aerosol size distributions and their
climate effects over the northwest Atlantic Ocean region
Betty Croft1 , Randall V. Martin2,1 , Richard H. Moore3 , Luke D. Ziemba3 , Ewan C. Crosbie3,4 , Hongyu Liu5 ,
Lynn M. Russell6 , Georges Saliba6 , Armin Wisthaler7,8 , Markus Müller7 , Arne Schiller7 , Martí Galí9 ,
Rachel Y.-W. Chang1 , Erin E. McDuffie1,2 , Kelsey R. Bilsback10 , and Jeffrey R. Pierce10
1 Department    of Physics and Atmospheric Science, Dalhousie University, Halifax, Nova Scotia, Canada
2 McKelvey    School of Engineering, Washington University in St. Louis, St. Louis, MO, USA
3 NASA Langley Research Center, Hampton, VA, USA
4 Science Systems and Applications, Inc., Hampton, VA, USA
5 National Institute of Aerospace, Hampton, VA, USA
6 Scripps Institute of Oceanography, University of California San Diego, La Jolla, CA, USA
7 Institute for Ion Physics and Applied Physics, University of Innsbruck, Technikerstrasse 25, 6020 Innsbruck, Austria
8 Department of Chemistry, University of Oslo, P.O. Box 1033 – Blindern, 0315 Oslo, Norway
9 Barcelona Supercomputing Center (BSC)
10 Department of Atmospheric Science, Colorado State University, Fort Collins, CO, USA

Correspondence: Betty Croft (betty.croft@dal.ca) and Jeffrey Pierce (jeffrey.pierce@colostate.edu)

Received: 3 August 2020 – Discussion started: 7 August 2020
Revised: 17 December 2020 – Accepted: 22 December 2020 – Published: 10 February 2021

Abstract. Aerosols over Earth’s remote and spatially ex-         20–50◦ W) cloud-albedo aerosol indirect effect (AIE) and
tensive ocean surfaces have important influences on plan-        direct radiative effect (DRE) processes during the phyto-
etary climate. However, these aerosols and their effects         plankton bloom. These key factors and their associated sim-
remain poorly understood, in part due to the remoteness          ulated radiative effects in the region include the following:
and limited observations over these regions. In this study,      (1) particle formation near and above the marine boundary
we seek to understand factors that shape marine aerosol          layer (MBL) top (AIE: −3.37 W m−2 , DRE: −0.62 W m−2 );
size distributions and composition in the northwest Atlantic     (2) particle growth due to marine secondary organic aerosol
Ocean region. We use the GEOS-Chem model with the                (MSOA) as the nascent particles subside into the MBL, en-
TwO-Moment Aerosol Sectional (TOMAS) microphysics al-            abling them to become cloud-condensation-nuclei-sized par-
gorithm model to interpret measurements collected from           ticles (AIE: −2.27 W m−2 , DRE: −0.10 W m−2 ); (3) parti-
ship and aircraft during the four seasonal campaigns of          cle formation and growth due to the products of dimethyl
the North Atlantic Aerosols and Marine Ecosystems Study          sulfide, above and within the MBL (−1.29 W m−2 , DRE:
(NAAMES) conducted between 2015 and 2018. Observa-               −0.06 W m−2 ); (4) ship emissions (AIE: −0.62 W m−2 ,
tions from the NAAMES campaigns show enhancements                DRE: −0.05 W m−2 ); and (5) primary sea spray emis-
in the campaign-median number of aerosols with diame-            sions (AIE: +0.04 W m−2 , DRE: −0.79 W m−2 ). Our re-
ters larger than 3 nm in the lower troposphere (below 6 km),     sults suggest that a synergy of particle formation in the
most pronounced during the phytoplankton bloom maxima            lower troposphere (particularly near and above the MBL
(May/June) below 2 km in the free troposphere. Our sim-          top) and growth by MSOA contributes strongly to cloud-
ulations, combined with NAAMES ship and aircraft mea-            condensation-nuclei-sized particles with significant regional
surements, suggest several key factors that contribute to        radiative effects in the northwest Atlantic. To gain confi-
aerosol number and size in the northwest Atlantic lower          dence in radiative effect magnitudes, future work is needed
troposphere, with significant regional-mean (40–60◦ N and        to understand (1) the sources and temperature dependence of

Published by Copernicus Publications on behalf of the European Geosciences Union.
1890                         B. Croft et al.: Factors controlling marine aerosol size distributions and their climate effects

condensable marine vapors forming MSOA, (2) primary sea           Mott et al., 2016; Irish et al., 2017), and be more closely
spray emissions, and (3) the species that can form new parti-     linked with biogenic activity in other regions (Ault et al.,
cles in the lower troposphere and grow these particles as they    2013; Cravigan et al., 2015; O’Dowd et al., 2015; Quinn
descend into the marine boundary layer.                           et al., 2015, 2019; Wang et al., 2015; Schiffer et al., 2018;
                                                                  Christiansen et al., 2019). Recent studies have highlighted
                                                                  knowledge gaps related to sea spray emissions, particularly
                                                                  related to the submicron sizes (e.g., Bian et al., 2019; Re-
1   Introduction                                                  gayre et al., 2020). Measurement and modeling studies are
                                                                  needed to better understand and simulate the size-resolved
Marine atmospheric particles have important roles in Earth’s      contribution of sea spray to the northwest Atlantic MBL.
climate system. Similar to particles in other regions, marine        For the North Atlantic, secondary aerosol of biogenic ori-
aerosols scatter and absorb solar radiation (Charlson et al.,     gin is observed to be an important seasonally varying con-
1992) and modify cloud properties by acting as the seeds          tributor to marine particles and their growth to yield CCN
for cloud droplet formation (Boucher and Haywood, 2000;           (Sanchez et al., 2018). Marine secondary aerosol can arise
Lohmann and Feichter, 2005). Aerosols in the atmosphere’s         from the condensation of a variety of marine-vapor-oxidation
marine boundary layer (MBL) strongly influence the highly         products, which form and grow particles (Ceburnis et al.,
prevalent, low-altitude marine clouds, which have key cli-        2008; Rinaldi et al., 2010; Decesari et al., 2011). Forma-
mate cooling effects due to their reflection of incoming solar    tion of new aerosol particles in the marine environment is
radiation (Wood, 2012; Chen et al., 2014). However, there re-     observed to be favored in clean atmospheric layers just be-
mains high uncertainty about the magnitude of these aerosol       low the marine inversion and also above the MBL top (Kazil
effects (IPCC, 2013), due in part to limited understanding        et al., 2011; Takegawa et al., 2020). Newly formed parti-
about the processes that control aerosols over Earth’s expan-     cles, including those from the free troposphere can grow to
sive and remote ocean surfaces (Willis et al., 2018). Marine      CCN sizes (diameters larger than about 50 nm) through the
aerosols are strongly influenced by natural but poorly under-     condensation of available organic- and sulfur-containing va-
stood sources, making a large contribution to uncertainty in      pors on descent into the MBL (Korhonen et al., 2008). Once
aerosol–climate effects (Carslaw et al., 2010, 2013). Limited     the particles reach CCN sizes, cloud processing (including
observations of aerosols and their precursors over Earth’s re-    aqueous-phase aerosol production and cloud droplet coagu-
mote marine regions contribute to these knowledge gaps. In        lation with other droplets and interstitial aerosols) also con-
this study, we focus on investigation of several factors con-     tributes to shaping the size distribution (Hoppel et al., 1986;
trolling the seasonal cycle of aerosol size and number and        Hoose et al., 2008; Pierce et al., 2015). For the North Atlantic
their resultant climate effects over the northwest Atlantic       MBL, entrainment of new growing particles formed in the
Ocean.                                                            relatively cleaner free troposphere is an important contributor
   Aerosol particles in the remote MBL have several season-       to MBL particle number (Quinn et al., 2017; Sanchez et al.,
ally varying sources (O’Dowd et al., 2004; Leck and Bigg,         2018; Zheng et al., 2018). In the pristine conditions of the
2005; de Leeuw et al., 2011; Karl et al., 2012). Primary parti-   summertime Arctic, both new particle formation (NPF) and
cles are emitted through wave-breaking and bubble-bursting        growth (by condensation of organic- and sulfur-containing
processes that eject sea spray aerosols (SSAs) of sea salt and    vapors) are frequently observed within the boundary layer it-
organic composition (Russell et al., 2010; de Leeuw et al.,       self (Leaitch et al., 2013; Croft et al., 2016a; Willis et al.,
2011; Ovadnevaite et al., 2011; Gantt and Meskhidze, 2013;        2016; Collins et al., 2017; Burkart et al., 2017b). In addi-
Prather et al., 2013; Hamacher-Barth et al., 2016; Brooks         tion to sulfuric acid, other vapors including amines, methane
and Thornton, 2018). SSAs have a not-yet-well-understood          sulfonic acid (MSA), ammonia, and iodine all contribute to
dependence on wind speed (Monahan et al., 1983; O’Dowd            NPF in marine regions (O’Dowd, 2002; Facchini et al., 2008;
et al., 1997; Ovadnevaite et al., 2012; Grassian et al., 2015;    Allan et al., 2015, Chen et al., 2016; Croft et al., 2016a;
Brooks and Thornton, 2018; Saliba et al., 2019) and sea sur-      Dall’Osto et al., 2018). Interpretation of a combination of air-
face temperature (Mårtensson et al., 2003; Jaeglé et al., 2011;   craft and shipboard observations with a size-resolved aerosol
Kasparian et al., 2017; Saliba et al., 2019). For the North At-   microphysics model is needed to develop understanding of
lantic, observations indicate that primary SSAs make a lim-       the relative importance of near and above MBL top NPF as a
ited (less than 30 %) contribution to cloud condensation nu-      contributor to aerosol size distributions in the northwest At-
clei (CCN) (Quinn et al., 2017, 2019; Zheng et al., 2018) with    lantic MBL.
no direct connection between SSA emissions and plankton              Dimethyl sulfide (DMS) is one of the key contributors
ecosystems, because the organic SSA appears to arise from         to secondary particle formation and growth that is released
the ocean’s large pool of dissolved organic carbon (Quinn         from the oceans as a result of marine biogenic activity (Lana
et al., 2014; Bates et al., 2020). SSA, however, could modify     et al., 2012a; Galí and Simó, 2015; Sanchez et al., 2018).
the CCN number that activates to form cloud droplets (Fos-        The oxidation products of DMS include sulfuric acid and
sum et al., 2020), act as ice nuclei (Wilson et al., 2015; De-    MSA (Barnes et al., 2006), which can form new particles

Atmos. Chem. Phys., 21, 1889–1916, 2021                                             https://doi.org/10.5194/acp-21-1889-2021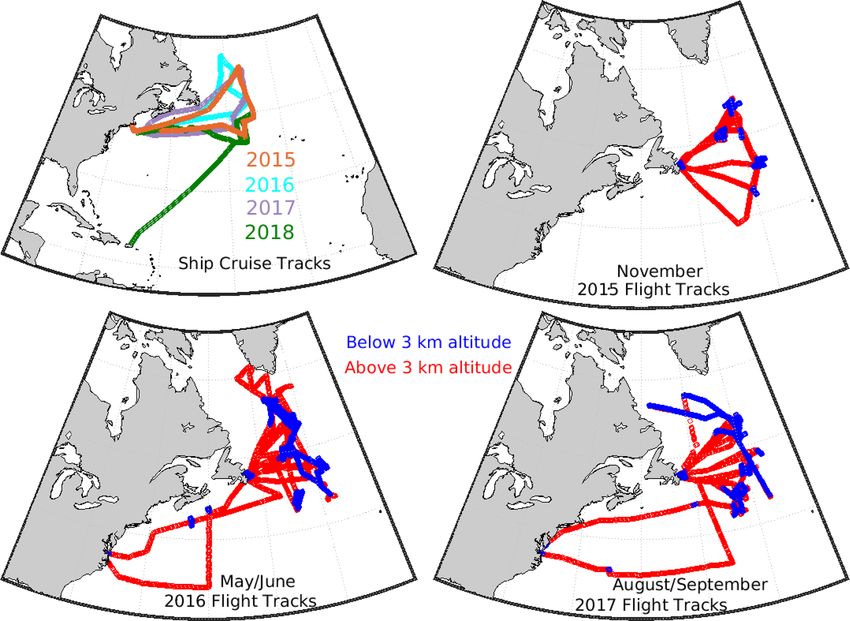
B. Croft et al.: Factors controlling marine aerosol size distributions and their climate effects                             1891

and grow existing particles to sizes that can act as CCN          marine environment with sources that vary seasonally and re-
(Hoffman et al., 2016; Hodshire et al., 2019). As well, hy-       gionally (Cavalli et al., 2004; Decesari et al., 2011; Cravigan
droperoxymethyl thioformate (HPMTF) is a recently discov-         et al., 2020; Liu et al., 2018; Leaitch et al., 2018; Lapina et
ered DMS-oxidation product, which could also contribute to        al., 2011).
NPF and growth (Veres et al., 2020). The role of DMS in               Anthropogenic activity is also an important source of
the climate system has undergone much debate since 1987           aerosols over portions of the Earth’s oceans. For the North
when the CLAW hypothesis proposed that DMS could act as           Atlantic, several previous studies (e.g., Savoie et al., 2002;
a regulator in a warming climate (Charlson et al., 1987). For     Stohl et al., 2003; Huntrieser et al., 2005; Fast et al., 2016)
the North Atlantic and Arctic, observations have linked DMS       found a key role for synoptic-scale motions in lifting aerosols
to the formation of aerosols during the times of phytoplank-      arising from North American continental emissions and
ton blooms (Rempillo et al., 2011; Chang et al., 2011; Park       transporting them in layers over the North Atlantic with in-
et al., 2017; Sanchez et al., 2018; Abbatt et al., 2019; Quinn    trusions into the MBL. As well, ship traffic is an impor-
et al., 2019). As well, modeling studies have supported a role    tant source of both particles and oxidants in the MBL (Cor-
for DMS, linked to phytoplankton blooms, as a contributor to      bett et al., 2007; Zanatta et al., 2019; Bilsback et al., 2020).
CCN number concentrations in the North Atlantic and Arctic        Ship emissions of nitrogen oxides have a significant control
MBLs (Woodhouse et al., 2013; Zheng et al., 2018; Ghahre-         on levels of oxidants such as ozone, the hydroxyl radical
maninezhad et al., 2019; Mahmood et al., 2019) and South-         (OH), and NO3 in the MBL (Vinken et al., 2011; Holmes
ern Ocean MBL (Korhonen et al., 2008; McCoy et al., 2015;         et al., 2014). In the remote MBL, both OH and NO3 are
Revell et al., 2019). However, the extent to which DMS can        key oxidants of DMS, along with natural-source halogens
act as a climate regulator remains unclear (Schwinger et al.,     such as BrO, with an important role for multiphase chem-
2017; Fiddes et al., 2018), and this role has been refuted        istry (Chen et al., 2018). Interpretation of aerosol observa-
(Quinn and Bates, 2011). Analysis of in situ observations of      tions across several seasons is needed to better understand
DMS and its products across the seasonal cycle of marine          the relative contribution of ship emissions to marine particles
biogenic activity and in various ocean regions is needed to       in the northwest Atlantic region.
improve understanding related to the role of DMS in Earth’s           In this study, as part of the Ocean Frontier Institute (http:
climate system.                                                   //www.oceanfrontierinstitute.com, last access: 17 Decem-
   Marine secondary organic aerosol (MSOA) is another im-         ber 2020), we address the knowledge gaps that were iden-
portant contributor to submicron-diameter marine aerosols,        tified above, concerning several key factors shaping north-
but it is not well characterized (Rinaldi et al., 2010). The      west Atlantic MBL aerosol size distributions and their sea-
oceans are a source of a variety of organic vapors that could     sonal cycle. We consider the role of (1) new particle for-
lead to SOA formation (O’Dowd and de Leeuw, 2007; Yas-            mation in clean atmospheric layers near and above the
saa et al., 2008; Carpenter et al., 2012; Lana et al., 2012b;     MBL top, (2) particle growth by MSOA on descent into
Hu et al., 2013; Carpenter and Nightingale, 2015; Kim et al.,     the MBL, (3) DMS contributions, (4) ship traffic emissions,
2017; Rodríguez-Ros et al., 2020a). Oxygenated volatile or-       and (5) primary sea spray emissions. Aerosol measurements
ganic compounds (OVOCs) recently linked to photochemical          from the North Atlantic Aerosols and Marine Ecosystems
oxidative processes at the sea surface microlayer are possi-      Study (NAAMES) (Behrenfeld et al., 2019) provide an ex-
ble contributors to MSOA (Mungall et al., 2017). Isoprene         cellent basis for addressing the role of these five factors in
and monoterpenes appear to make relatively minor contri-          the northwest Atlantic Ocean region. The NAAMES aircraft
butions to MSOA by mass, e.g., less than 1 % for particles        and ship campaigns were conducted during four phases of
with diameters smaller than 10 µm at Cape Grim (Cui et al.,       the northwest Atlantic annual plankton cycle from 2015–
2019). The global annual source of organic vapors from the        2018. We interpret the NAAMES aerosol measurements
oceans is highly uncertain, but current estimates are about       using a state-of-the-art size-resolved global aerosol mi-
23 to 92 Tg C yr−1 (Brüggemann et al., 2018). Laboratory          crophysics model, GEOS-Chem-TOMAS (http://acmg.seas.
studies indicate that emissions of marine organic vapors in-      harvard.edu/geos/, last access: 17 December 2020). Our syn-
crease with both temperature and incident radiation for tem-      ergistic approach of bringing together NAAMES measure-
peratures up to about 26 ◦ C (Meskhidze et al., 2015). Recent     ments and size-resolved aerosol process modeling enables a
observations and modeling studies support a role for Arctic       unique consideration of several key factors shaping north-
marine secondary organic aerosol as a contributor to parti-       west Atlantic MBL aerosol size distributions and their annual
cle growth to CCN sizes (Burkart et al., 2017a; Collins et al.,   cycle. We also quantify the impact of these factors on aerosol
2017; Willis et al., 2017, 2018; Tremblay et al., 2019; Leaitch   radiative effects over the North Atlantic.
et al., 2018; Croft et al., 2019; Abbatt et al., 2019). For the       The second section provides an overview of our measure-
North Atlantic, organics are also found to make a large con-      ment and modeling methodology. The third section presents
tribution to particle growth to CCN sizes (Sanchez et al.,        results using the GEOS-Chem-TOMAS model to interpret
2018; Zheng et al., 2020a). The result of the above-noted pro-    NAAMES aerosol measurements and their seasonal cycle
cesses is a large and complex pool of organic aerosol in the      with a focus on the roles of near-and-above-MBL-top NPF,

https://doi.org/10.5194/acp-21-1889-2021                                           Atmos. Chem. Phys., 21, 1889–1916, 2021
1892                         B. Croft et al.: Factors controlling marine aerosol size distributions and their climate effects

MSOA, DMS, sea spray, and ship emissions. We also quan-           eters 10 to 282 nm) from the scanning mobility particle sizer
tify the direct and cloud-albedo aerosol indirect radiative ef-   (SMPS, TSI Inc., Shoreview, MN, USA) aboard the C-130
fects attributed to each of these factors during the seasonal     aircraft. As well, we give attention to measurements of total
cycle. The final section gives our summary and outlook.           particle number concentration from the condensation particle
                                                                  counters (CPCs) with differing nominal lower detection di-
                                                                  ameters: 3 nm for the CPC 3025 (yielding N3 measurements)
2     Methodology                                                 and 10 nm for the CPC 3772 (TSI Inc., St. Paul, MN, USA)
                                                                  (yielding N10 measurements) aboard the C-130 aircraft. We
2.1    Aerosol measurements during the NAAMES                     also consider submicron, non-refractory sulfate (SO=4 ) and
       campaigns                                                  organic mass (OM) concentrations from an Aerodyne high-
                                                                  resolution time-of-flight aerosol mass spectrometer (HR-
NAAMES campaigns were conducted during four key peri-             ToF-AMS; DeCarlo et al., 2006) and refractory black carbon
ods in the annual cycle of marine biogenic activity, namely,      from the single particle soot photometer (SP2; Schwarz et al.,
the winter transition (November 2015), the accumulating           2006) aboard the aircraft. HR-ToF-AMS and SP2 measure-
phase (March/April 2018), the climax transition (May/June         ments are restricted to accumulation-mode aerosol (60–600
2016), and the declining phase (August/September 2017)            and 105–600 nm diameter, respectively). All aircraft obser-
(Behrenfeld et al., 2019). These periods are defined by shifts    vations are made behind a forward-facing, shrouded, solid
in net phytoplankton growth rates and span a wide range           diffuser inlet that efficiently transmits particles with aero-
in phytoplankton biomass, which are here estimated from           dynamic diameter less than 5.0 µm to cabin-mounted instru-
chlorophyll a concentrations (Chl a). The winter transition       mentation (McNaughton et al., 2007). Cloud-contaminated
is characterized by the annual minimum in Chl a concentra-        aerosol observations have been removed using a combination
tions (generally < 1 mg m−3 ) and a shift to favor phytoplank-    of wing-mounted cloud probe and relative humidity measure-
ton growth over loss as the increasing ocean-mixed-layer          ments. This filtering may possibly obscure some NPF events
depth leads to fewer encounters between phytoplankton and         in proximity to clouds and remove some cloud-processed
their grazers. The accumulation phase occurs in early spring-     samples from the vertical profiles. Aerosol number and mass
time when increasing sunlight and decreasing ocean-mixed-         concentrations are reported at standard temperature and pres-
layer depths promote increasing phytoplankton growth rates        sure. A proton-transfer-reaction time-of-flight mass spec-
and concentrations (Chl a between 1 and 2 mg m−3 ). The cli-      trometer (PTR-ToF-MS) (Müller et al., 2014; Schiller, 2018)
max transition is the time of the annual maximum in phyto-        was used aboard the NASA C-130 to measure volatile or-
plankton biomass (Chl a between 2 and 9 mg m−3 ) and marks        ganic compounds including DMS and acetonitrile. Both ob-
the shift from positive to negative growth rates owing to high    servational and model data for periods when acetonitrile con-
grazing rates and depletion of nutrients. The declining phase     centrations exceed 200 ppt are filtered out following Singh
(Chl a between 1 and 2 mg m−3 ) occurs later in the summer-       et al. (2012) to remove significant biomass burning contribu-
time when the ocean-mixed-layer depth increases and inci-         tions that are not the focus of this study.
dent sunlight decreases, leading to further declines in phyto-
plankton growth and concentrations. Behrenfeld et al. (2019)      2.2   GEOS-Chem-TOMAS model description
provide an overview of the four measurement campaigns and
further details about Chl a during NAAMES. The R/V At-            We use the GEOS-Chem model (v12.1.1) (http://acmg.seas.
lantis cruise tracks and NASA C-130 flight paths are shown        harvard.edu/geos/, last access: 17 December 2020) coupled
in Fig. 1. Due to aircraft mechanical problems, there were no     to the TwO Moment Aerosol Sectional (TOMAS) micro-
flights in 2018 during the accumulating phase.                    physics scheme (Adams and Seinfeld, 2002; Lee and Adams,
   In this study, we examine the NAAMES size-resolved             2012; Kodros and Pierce, 2017), with 15 sections, represent-
aerosol measurements (particle diameters 20 to 500 nm) from       ing particle sizes from 3 nm to 10 µm. All simulations are
the scanning electrical mobility sizer (SEMS, model 138,          at a 4◦ × 5◦ resolution with 47 vertical levels extending to
2002, BMI, Hayward, CA, USA) aboard the R/V Atlantis              0.01 hPa. The meteorological fields are from the GEOS For-
ship. Aerosol particles were isokinetically drawn through an      ward Processing offline fields (GEOS-FP; https://gmao.gsfc.
inlet positioned 18 m a.s.l. (Bates et al., 2002) and were sub-   nasa.gov/GMAO_products/, last access: 17 December 2020).
sequently dried below 20 % relative humidity using silica         Our size-resolved aerosol simulations parameterize the pro-
diffusion driers prior to sampling by the SEMS. Clean ma-         cesses of particle nucleation, coagulation, and condensation,
rine periods were identified with criteria of relative wind di-   along with wet and dry deposition, and include the in-cloud
rections within 90◦ of the bow, condensation nuclei number        aerosol coagulation scheme of Pierce et al. (2015). Sulfate,
concentrations less than 2000 cm−3 , ammonium and organic         organic and black carbon, sea salt, dust, and aerosol water
aerosol not covarying, ammonium < 100 ng m−3 , and having         are simulated. TOMAS is coupled to the full tropospheric
back-trajectories primarily over the ocean surface. We also       aerosol/chemistry scheme of GEOS-Chem. Wet deposition
consider aerosol size-resolved measurements (particle diam-       follows Liu et al. (2001), Wang et al. (2011), and Wang

Atmos. Chem. Phys., 21, 1889–1916, 2021                                            https://doi.org/10.5194/acp-21-1889-2021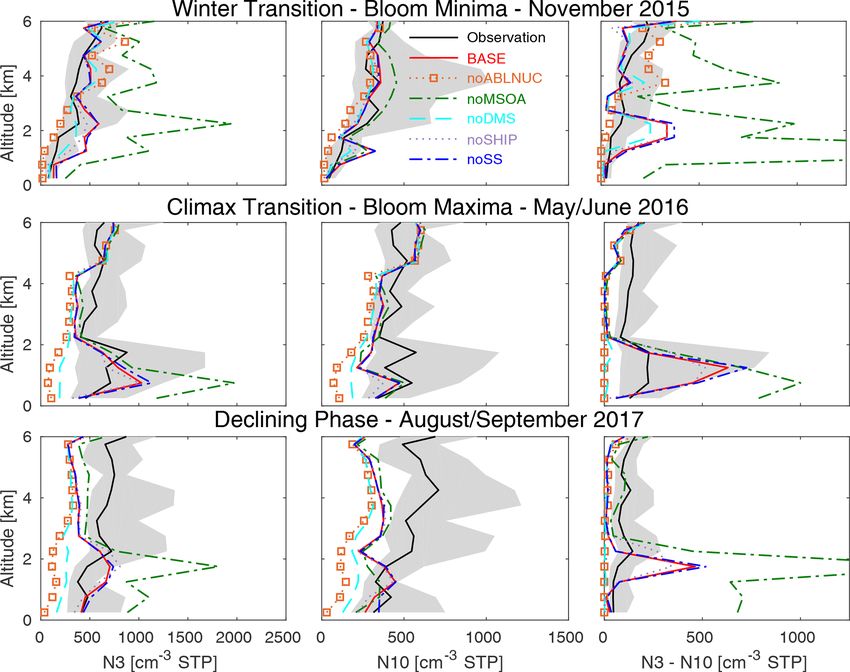
B. Croft et al.: Factors controlling marine aerosol size distributions and their climate effects                                1893

Figure 1. Cruise and aircraft tracks for the 2015–2018 NAAMES campaigns. Flight altitudes below 3 km are color-coded in blue and above
3 km in red. Ship-track campaigns are color-coded for each year as shown by the legend and as follows. Orange: November 2015 winter
transition (bloom minima); cyan: May/June 2016 climax transition (bloom maxima); purple: August/September 2017 declining phase; and
green: March/April 2018 accumulation phase.

et al. (2014). To represent efficient wet removal by North           for in-plume chemical processing of ship emissions, we use
Atlantic drizzle in October and November, we implement a             the PARANOX scheme of Holmes et al. (2014). CEDS emis-
fixed in-cloud removal efficiency of 0.001 s−1 in the low-           sions are overwritten over the United States by the Na-
est 2 km of the model atmosphere over the ice-free ocean             tional Emissions Inventory (NEI11) with updated scale fac-
and enable wet removal of sulfate and organic aerosol in             tors for our simulation years (2015–2018). We calculated
clouds with temperatures between 237 and 258 K. In all sea-          these factors based on emission data for these years from
sons, we use the GEOS-FP cloud fraction as the precipitation         the United States Environmental Protection Agency. Over
fraction in the model layers where precipitation occurs for a        Canada, we use the Air Pollutant Emission Inventory (APEI).
closer connection with the meteorological fields (Croft et al.,      The Global Fire Emissions Database (GFED4s) is used for
2016b; Luo et al., 2019, 2020). Dry deposition uses the re-          biomass burning emissions (van der Werf et al., 2017) for the
sistance in series approach of Wesley (1989). Simulated gas-         years 2015/16, with GFED4s climatological values for 2017
phase species are also removed by dry and wet deposition as          and 2018 since exact-year emissions were not available when
described in Amos et al. (2012).                                     we conducted our simulations. Dust emissions are from the
   For emissions, we use the GEOS-Chem v 12.1.1 de-                  scheme of Zender et al. (2003).
fault setup for gas-phase and primary aerosol emissions. We             Sea salt emissions follow Jaeglé et al. (2011). This
use emissions from the Community Emissions Data System               temperature-dependent parameterization decreases global
(CEDS) for global anthropogenic sources of NOx , CO, SO2 ,           emissions relative to the Gong (2003) parameterization. A
NH3 , non-methane VOCs, black carbon, and organic carbon,            coupled parameterization for primary organic aerosol from
including from international shipping as a source of both pri-       sea spray was not available for our aerosol size-resolved
mary and secondary particles. Primary particles are emitted          GEOS-Chem-TOMAS simulations, such that some sea spray
with a lognormal distribution (Lee et al., 2013). The most           organics could be misrepresented as sea salt, since all sea
recent CEDS emissions dataset extends to the year 2017, as           spray in our simulations is considered sea salt. Such pri-
described in McDuffie et al. (2020). In this work, monthly           mary organic emissions are expected to have no seasonal cy-
CEDS emission totals for each compound are spatially grid-           cle when averaged over the NAAMES region (Bates et al.,
ded by source sector, according to the 0.1◦ × 0.1◦ gridded           2020).
EDGAR v4.2 emissions inventory (EC-JRC/PBL, 2012) and                   Exchange of DMS between the ocean and atmosphere
population, as described in Hoesly et al. (2018). To account         is parameterized using the default GEOS-Chem parameter-

https://doi.org/10.5194/acp-21-1889-2021                                               Atmos. Chem. Phys., 21, 1889–1916, 2021
1894                         B. Croft et al.: Factors controlling marine aerosol size distributions and their climate effects

ization, which follows Johnson (2010), largely based on           Additionally, the particle-nucleating capacity of MSOA is
Nightingale et al. (2000a, b). We use the 8 d mean satellite-     unclear and particle formation parameterizations are not yet
retrieval seawater DMS dataset of Galí et al. (2019), devel-      developed to represent NPF when several gas-phase precur-
oped using the methodology of Galí et al. (2018), for avail-      sors interact. These precursors include (but are not limited
able years (2015 and 2016) for the region north of about          to) MSA (Chen et al., 2016), HPMTF (Veres et al., 2020),
40◦ N. The Lana et al. (2011) DMS climatology is used else-       amines (Facchini et al., 2008), iodine (Allan et al., 2015), and
where. Terrestrial biogenic emissions are from MEGAN2.1           other extremely low volatility organic compounds (ELVOCs)
as described in Guenther et al. (2012). Following Croft           (Riccobono et al., 2014). The extra nucleation in the lower
et al. (2019), we add a source of MSOA coupled to the             troposphere with the activation-type parameterization repre-
simple SOA scheme described in Pai et al. (2020). Emis-           sents particle precursors that could have the same source as
sions of MSOA-precursor vapors have been found to in-             sulfuric acid. This approach may not capture the timing and
crease with temperature (Meskhidze et al., 2015; Rodríguez-       magnitude of the variability in NPF correctly, because the
Ros et al., 2020a, b). Here, we use a temperature-dependent       vapors participating in this nucleation are likely not just sul-
simulated source of MSOA-precursor emissions (SMSOA ),            furic acid. Future work is needed to better understand the na-
SMSOA = 70T + 350 µg m−2 d−1 , where T is atmospheric             ture of the nucleating species in the lower troposphere over
temperature (◦ C) at 2 m altitude. The values of 70 and 350 are   the oceans.
found to yield acceptable model–measurement agreement                We also conduct offline radiative transfer calculations us-
for NAAMES campaign-median ship-track and aircraft mea-           ing the Rapid Radiative Transfer Model for Global Climate
surements (Figs. S1–S4 and Tables S1 and S2 in the Supple-        Models (RRTMG) (Iacono et al., 2008) to assess the aerosol
ment). This simulated source of condensable vapors is emit-       direct radiative effect (DRE) and cloud-albedo aerosol indi-
ted with a 50/50 split between vapors that are immediately        rect effect (AIE). The aerosol optical properties are calcu-
available to form MSOA and vapors with 1 d aging prior to         lated using the Mie code of Bohren and Huffman (1983) to
availability (and not susceptible to wet removal). MSOA con-      find the extinction efficiency, single scattering albedo, and
tributes to particle growth in our simulations (in agreement      asymmetry factor. Then, these optical properties, along with
with observational-based studies; e.g., Sanchez et al., 2018;     the monthly-mean cloud fraction and surface albedo from
Zheng et al., 2020a), along with sulfuric acid, but since the     the GEOS-FP meteorology fields, are input to the RRTMG
particle nucleating abilities of MSOA are unclear, it does not    to determine the change in top-of-the-atmosphere solar flux
contribute to new particle formation.                             (DRE) between two simulations (our control simulation and
   All simulations include particle nucleation in the boundary    one of the sensitivity simulations, Sect. 2.3). Our DRE calcu-
layer that is parameterized with the ternary (H2 SO4 -NH3 -       lations follow Kodros et al. (2016), with updates to include
H2 O) scheme of Napari et al. (2002), which was scaled by         ammonium nitrate as described in Bilsback et al. (2020). All
10−5 to better match continental boundary-layer measure-          particles except black carbon are treated as internally mixed
ments (Westervelt et al., 2013). The binary (H2 SO4 -H2 O)        within each size section. We also calculate the cloud-albedo
scheme of Vehkamaki et al. (2002) is employed in the free         AIE as described in Kodros et al. (2016), Croft et al. (2016a),
troposphere at low NH3 concentrations. Growth and loss of         and Ramnarine et al. (2019). The Abdul-Razzak and Ghan
particles smaller than 3 nm are approximated following Ker-       (2002) parameterization is used to calculate offline cloud
minen et al. (2004). In our simulations, as a surrogate for       droplet number concentrations (CDNCs) using the aerosol
unparameterized processes in the lower free troposphere and       mass and number concentrations from our simulations. We
near the MBL top, we also employ an activation-type nucle-        assume an updraft velocity of 0.5 m s−1 and the hygroscop-
ation parameterization from the MBL top to about 2 km al-         icity parameters used by Kodros et al. (2016) and Kodros and
titude. This activation-type scheme parameterizes nucleation      Pierce (2017), assuming aerosol internal mixture, including
rates as a linear function of sulfuric acid concentrations, us-   ammonium nitrate following Bilsback et al. (2020). For each
ing an empirical factor (A = 2 × 10⁻⁶ s−1 ) (Kulmala et al.,      model grid box, we assume cloud droplet radii of 10 µm and
2006; Sihto et al., 2006), and serves as a proxy representing     perturb this value with the ratio of the monthly mean CDNC
several unknown or unparameterized mechanisms related to          between two simulations (our control simulation and one
NPF. Pockets of very clean air with low condensation sink         of the sensitivity simulations, Sect. 2.3), assuming constant
near MBL clouds, which favor new particle formation (Kazil        cloud liquid water content. The RRTMG is used to calculate
et al., 2011), are not resolved by large-scale models such        the change in the top-of-the-atmosphere solar flux (AIE) due
as ours, with grid boxes on the scale of hundreds of square       to changes in cloud droplet radii.
kilometers. Efficient wet removal by drizzling MBL clouds            As one evaluation of simulation performance, we calcu-
contributes to these pristine conditions (Wood et al., 2017).     late the mean fractional error (MFE) of the zeroth to third
As well, MBL clouds reflect ultraviolet (UV) radiation and        moments between the simulated and observed MBL aerosol
create pockets of enhanced UV, which favors photochemical         size distributions, following Boylan and Russell (2006) and
production of aerosol precursor vapors (Weber et al., 2001;       using the same methodology as Hodshire et al. (2019) and
Wehner et al., 2015), which are not resolved by our model.        Croft et al. (2019). The MFE is defined as a mean over the N

Atmos. Chem. Phys., 21, 1889–1916, 2021                                             https://doi.org/10.5194/acp-21-1889-2021
B. Croft et al.: Factors controlling marine aerosol size distributions and their climate effects                             1895

Table 1. GEOS-Chem-TOMAS simulation acronyms. Simulations and methodology are described in detail in Sect. 2.2 and 2.3.

             Simulation      Description
             BASE            Control simulation with GEOS-Chem-TOMAS model (GCT12.1.1) as described in Sect. 2.2

             noABLNUC        Same as BASE but excluding the surrogate activation-type particle nucleation parameterization
                             above the marine boundary layer to about 2 km altitude, as described in Sect. 2.2

             noMSOA          Same as BASE but excluding the temperature-dependent marine organic vapors, forming marine
                             secondary organic aerosol (MSOA)

             noDMS           Same as BASE but excluding all emissions of DMS

             noSHIPS         Same as BASE but excluding all ship emissions

             noSS            Same as BASE but excluding all sea spray emissions

aerosol size distribution moments,                                    the NAAMES study region. Simulation noABLNUC is the
                                                                      same as BASE except without the sulfuric acid-dependent
        1 Xi=N −1 abs|Cm (i) − Co (i)|
MFE =                                  ,                     (1)      activation-type surrogate nucleation parameterization, which
        N  i=0    (Cm (i) + Co (i))/2                                 we implemented from the MBL top to about 2 km. Simula-
where Cm (i) is the integrated value of the ith moment of             tion noMSOA is the same as BASE but without the source of
the simulated aerosol size distribution, and Co (i) is the inte-      temperature-dependent condensable marine organic vapors,
grated value of the ith moment of the observed aerosol size           forming MSOA. Simulation noDMS is the same as BASE
distribution. The MFE can range from 0 to +2. We adopt the            but without DMS. Simulation noSHIPS is the same as BASE
convention of Boylan and Russell (2006) to consider an MFE            but without any ship emissions. Finally, simulation noSS is
of 0.5 or less as acceptable.                                         the same as BASE but without any primary sea spray emis-
   For consideration of vertical profiles, we binned the mea-         sions. All simulations are sampled coincidentally with the
surement and simulation values using a 500 m height res-              measurements using hourly output along the NAAMES air-
olution, starting from the surface to 500 m as the first bin.         craft and ship tracks within the respective model grid boxes,
Campaign-median values are calculated within each bin and             using the NAAMES campaign’s 1 min resolution navigation
plotted at the midpoint of the bin, starting at 250 m. Dur-           data. To manage computational expense, the simulations are
ing NAAMES, the lowest aircraft-flight-level altitude was             necessarily at a coarse resolution, which can bias model–
around 150–200 m GPS altitude. We use a plane-flight di-              measurement comparisons. However, these biases will be
agnostic in the model to sample the simulation interpolated           lower for remote marine regions such as the NAAMES study
between grid-cell centers to the aircraft-flight-track position,      region than over land regions, which generally have greater
during the times when measurement data were available for             spatial inhomogeneity. Representativeness errors were also
each respective instrument. We find consistent results with           reduced by limiting our model–measurement comparisons to
bin resolutions of 250, 500, and 1000 m, giving support for           campaign-median values.
our selected binning resolution. The vertical profiles show
measurements and model output along the aircraft flight
tracks only and do not include any measurements or model              3     Results and discussion
output for the ship track. Vertical profile MFEs (Eq. 1) are
calculated by summation over the altitude bins.                       3.1    Key features of aerosols observed during NAAMES

2.3   Summary of GEOS-Chem-TOMAS simulations                          Aerosol observations made during the NAAMES campaigns
                                                                      were in four seasons, capturing different stages of the an-
Table 1 summarizes the simulations conducted. Simulation              nual cycle of northwest Atlantic marine biogenic activity
BASE is our control simulation and includes all emissions             (Behrenfeld et al., 2019). Figure 2 shows the campaign-
and process parameterizations described above. We conduct             median marine-influenced aerosol size distributions from
five sensitivity simulations to examine the role of several key       SEMS (particle diameters 20–500 nm) for the four R/V At-
factors involved in shaping the aerosol distributions within          lantis cruises. November 2015 (winter transition, bloom

https://doi.org/10.5194/acp-21-1889-2021                                                Atmos. Chem. Phys., 21, 1889–1916, 2021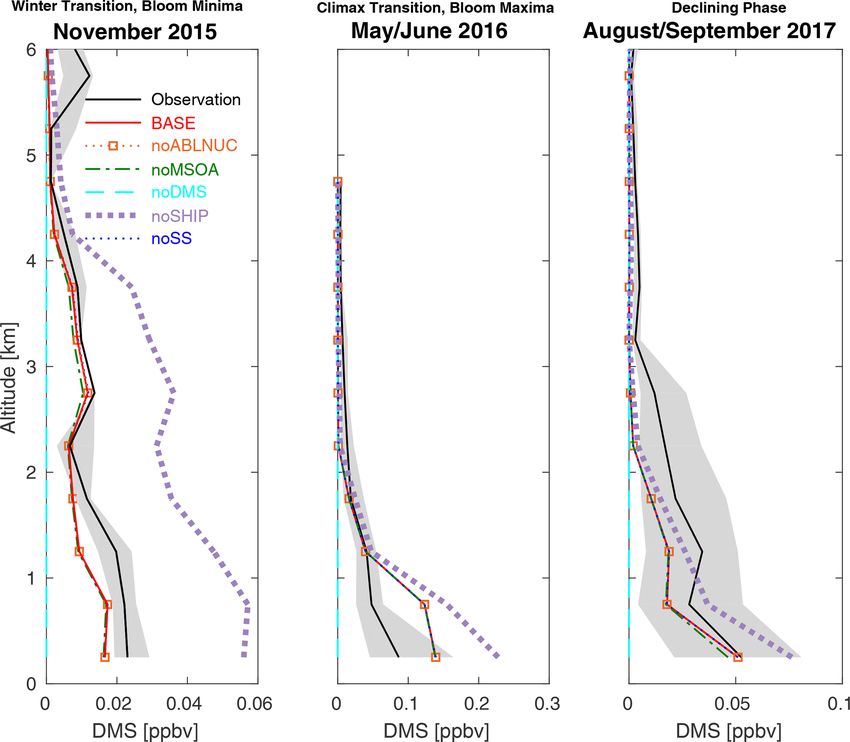
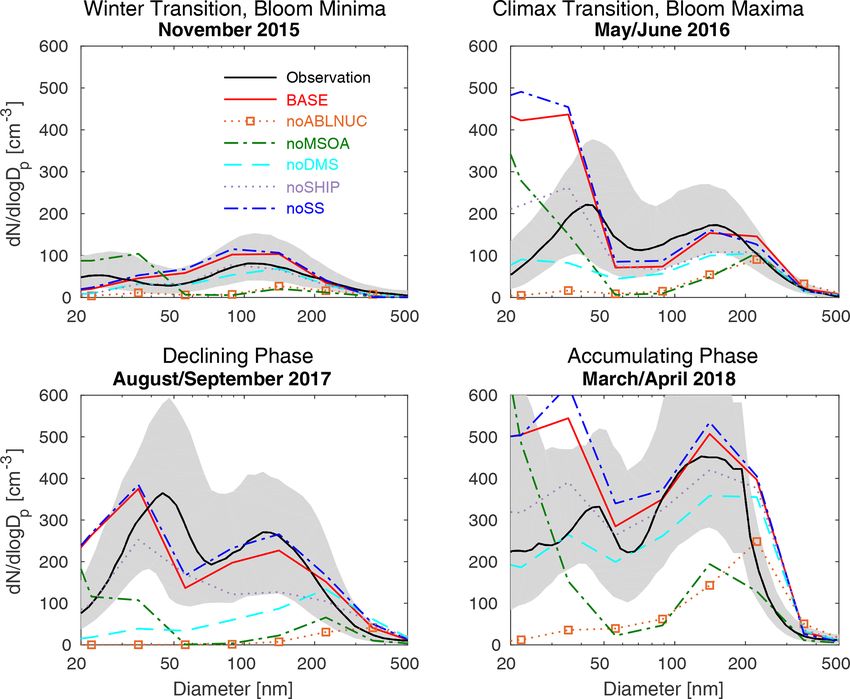
1896                         B. Croft et al.: Factors controlling marine aerosol size distributions and their climate effects

Figure 2. NAAMES cruise-track campaign-median marine-boundary-layer aerosol size distributions from marine-influenced SEMS (particle
diameters 20–500 nm) observations (black, with 25th to 75th percentiles in grey) and for the six GEOS-Chem-TOMAS simulations as
described in Table 1 (color-coded as shown in the legend).

minima) is characterized by the lowest aerosol number               vors NPF over growth of pre-existing particles as available
concentrations. The peak of the northwest Atlantic driz-            vapors condense in these relatively cleaner atmospheric lay-
zle season occurs at this time, with efficient wet removal          ers (Kazil et al., 2011). Transport of aerosols (in part as-
of accumulation-sized aerosol (diameters larger than about          sociated with continental emissions) contributes to particles
50 to 100 nm) (Browse et al., 2012). As well, relative to           in all seasons. Fast et al. (2016) characterized summertime
other seasons, marine biogenic emissions are low at this            North Atlantic transport layers in the free troposphere asso-
time of minimal phytoplankton biomass. The summertime               ciated with synoptic-scale lifting. The late fall (November
observations during both May/June 2016 (climax transition,          2015, Fig. 3) is characterized by the lowest aerosol number,
phytoplankton bloom maxima) and August/September 2017               surface, and volume concentrations, similar to the findings
(declining phase) are characterized by a weakly dominant            shown in Fig. 2.
Aitken mode (particle diameters < 100 nm). The winter tran-            Figure 4 shows the vertical-profile campaign-median to-
sition (November 2015) and early spring accumulation phase          tal particle number concentrations from CPCs for aerosols
observations (March/April 2018) are characterized by the            with diameters larger than 3 nm (N3), larger than 10 nm
dominance of accumulation-mode aerosols (particle diame-            (N10), and the difference between the two (N3–N10). For
ters > 100 nm).                                                     the May/June 2016 climax transition (phytoplankton bloom
   The vertical profiles of campaign-median integrated-             maximum), there are enhancements in observed number
SMPS (particle diameters of 10 to 282 nm) observations are          concentration (N3, N10, and N3–N10) below about 2 km
shown in Fig. 3. There are several key features of the ob-          in the free troposphere, indicating NPF at these altitudes
served aerosol vertical profiles for the three NAAMES flight        (Fig. 4). The MBL top ranged from about 0.5 to 2 km for
campaigns. These profiles exhibit several particle number           the NAAMES cruises (Behrenfeld et al., 2019). The lower
maxima in the lower free troposphere below 6 km, includ-            free tropospheric region near and above the MBL top is an
ing below 2 km during the May/June climax transition pe-            important region for marine NPF. These altitudes above the
riod. As shown in Fig. 3, aerosol surface area and volume are       MBL clouds are generally very clean, which favors NPF, and
less at altitudes below about 3 km relative to altitudes above      strongly sunlit, which favors the photochemical oxidative
3 km. This lower particle surface area at these altitudes fa-       production of particle precursors for NPF. Previous studies

Atmos. Chem. Phys., 21, 1889–1916, 2021                                               https://doi.org/10.5194/acp-21-1889-2021
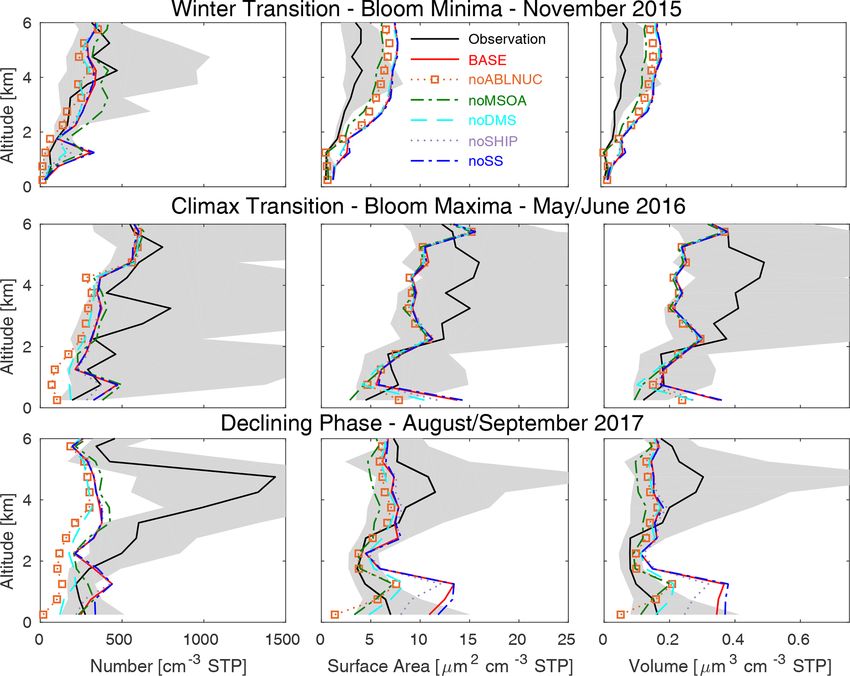
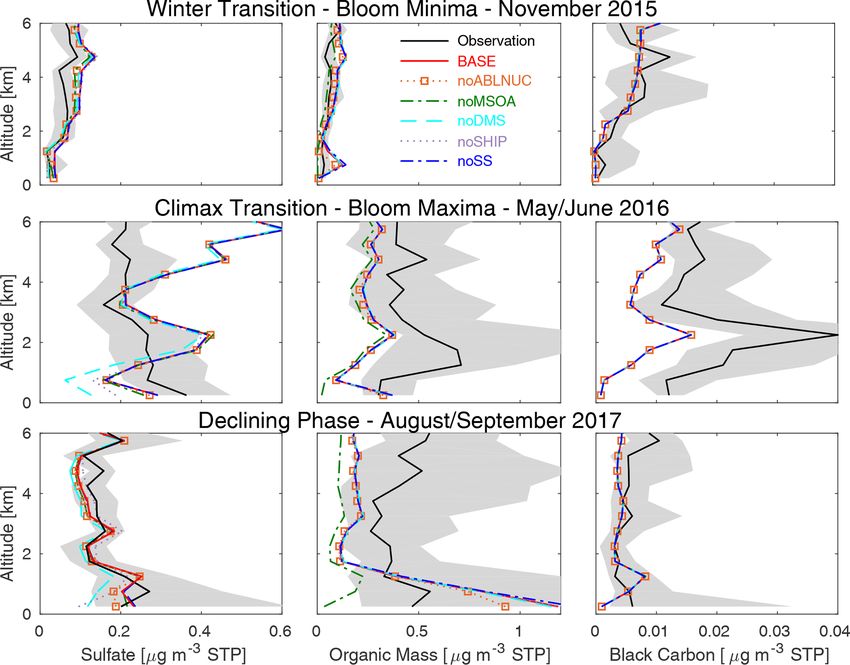
B. Croft et al.: Factors controlling marine aerosol size distributions and their climate effects                                     1897

Figure 3. Vertical profiles of NAAMES campaign-median integrated SMPS observations aboard aircraft at standard temperature and pres-
sure (STP) for particles with diameters of 10 to 282 nm (black, with 25th–75th percentiles in grey) and for the six GEOS-Chem-TOMAS
simulations described in Table 1 (color-coded as shown in the legend). All measurement and model output is binned at 500 m resolution, and
campaign-median values are plotted at the midpoint of each bin starting at 250 m above the surface. Lines show linear interpolation between
these values.

based on observations from other marine regions have also               surface source, similar to summertime Arctic marine profile
found a cloud-processed ultra-clean layer with weak conden-             observations (Willis et al., 2017). Black carbon (BC) con-
sation and/or coagulation sinks at about 1 km altitude, where           centrations are also shown in Fig. 5 and have several peaks
NPF is favored (Kazil et al., 2011; Takegawa et al., 2020).             in the free troposphere in all seasons, consistent with a long-
Figure 4 also shows enhancements in the observed N3 and                 range transport source. Maximum BC concentrations are in
N10 concentrations below 6 km during the declining phase                May/June, likely associated with greater transport of anthro-
and winter transition (bloom minima). However, the total                pogenic continental pollution and biomass burning during
number concentration enhancements below 2 km are most                   this time relative to other seasons. Springtime has also been
pronounced during the phytoplankton bloom maximum, sug-                 associated with peak BC concentrations in the Arctic due
gesting a connection between particle number and the level              to long-range transport (Sharma et al., 2004, 2006; Fisher
of marine biogenic activity.                                            et al., 2010; Wang et al., 2011; Xu et al., 2017). All aerosol
   SO=4 and OM are dominant non-refractory components                   mass concentrations in the lowest 2 km of the atmosphere
of the submicron-diameter aerosols, and vertical profiles of            (Fig. 5) are lowest in the November 2015 winter transition,
campaign-median observations are shown in Fig. 5. During                which is a time of efficient wet removal by drizzle (Browse
the summertime (May/June 2016 (climax transition) and Au-               et al., 2012; Wood et al., 2017), diminishing marine emis-
gust/September 2017 (declining phase)), the OM contribu-                sions due to diminishing phytoplankton biomass, and out-
tion exceeds that of SO=4 at most altitudes up to 6 km. Non-            breaks of relatively less polluted polar air advected down the
refractory SO=4 has its peak contribution during the climax             Labrador Strait (Behrenfeld et al., 2019). For the Arctic, the
transition season. This May/June phytoplankton bloom max-               fall season has also been associated with a relative minimum
ima period is the time of peaks observed for near-surface at-           in aerosol number concentrations (Tunved et al., 2013; Croft
mospheric DMS mixing ratios, as shown in Fig. 6. During the             et al., 2016b).
climax transition (bloom maxima), non-refractory SO=4 con-                 The GEOS-Chem-TOMAS model (described in Sect. 2.2
centrations increase towards the surface, suggesting a marine           and 2.3) is generally able to simulate the above-noted fea-

https://doi.org/10.5194/acp-21-1889-2021                                                  Atmos. Chem. Phys., 21, 1889–1916, 2021
1898                          B. Croft et al.: Factors controlling marine aerosol size distributions and their climate effects

Figure 4. Vertical profiles of NAAMES campaign-median total number concentrations for particles with diameters larger than 3 nm (N3),
10 nm (N10), and between 3 and 10 nm (N3–N10) from CPC observations aboard aircraft at standard temperature and pressure (STP) (black,
with 25th–75th percentiles in grey) and for the six GEOS-Chem-TOMAS simulations described in Table 1 (color-coded as shown in the
legend). All measurement and model output is binned at 500 m resolution, and campaign-median values are plotted at the midpoint of each
bin starting at 250 m above the surface. Lines show linear interpolation between these values.

tures of the aerosols over the northwest Atlantic. Simulation         (BASE vs. measurements, Table S2) is satisfactory (MFE
BASE captures key aspects of the MBL size distributions, in-          ranges from 0.43 to 0.50). In the next four subsections, we
cluding the minimum in aerosol number during the Novem-               use the GEOS-Chem-TOMAS BASE simulation, relative to
ber winter transition, the weakly dominant Aitken mode dur-           a set of sensitivity simulations, to examine the potential of
ing the May/June climax transition, August/September de-              five key factors to shape aerosol size distributions in the
clining phase, and the maximum in number of accumulation-             northwest Atlantic during four stages of the annual cycle of
mode particles (diameters greater than 100 nm) during the             marine biogenic activity.
March/April accumulation phase, despite errors such as be-
tween 20–50 nm (Fig. 2). As well, the BASE simulation                 3.2   Role of new particle formation (NPF) in the lower
captures several lower-tropospheric enhancements in parti-                  troposphere
cle number concentration, although the simulated altitude for
the maximum is sometimes displaced and there are errors in            Our simulations (BASE relative to noABLNUC, Fig. 4) sug-
the magnitude (Figs. 3 and 4). In the lowest 2 km of the at-          gest that NPF near and above the MBL has a strong control
mosphere, SO=4 , OM, and BC mass concentrations for simu-             on the development of the total particle number (N3) max-
lation BASE are generally within the 25th to 75th measure-            ima, with peak magnitude during the phytoplankton bloom
ment percentiles, except for BC and OM underpredictions in            maxima in layers below 2 km. Without the surrogate NPF
May/June 2016 and OM overprediction in November 2015.                 scheme employed near and above the MBL top, the ternary
All simulated SO=4 presented in this study is non-sea-salt            NPF scheme in the MBL in simulation noABLNUC fails to
SO=4 . Simulation BASE also captures the facts that the near-         simulate sufficient particle number, although vertical-profile
surface SO=4 is greatest during the May/June climax transi-           campaign-median ammonium concentrations below 4 km al-
tion and the near-surface OM has its maximum value during             titude had acceptable agreement with observations (MFE
the August/September declining phase. For each season, the            ranges from 0.12 to 0.48, not shown). Figure 4 shows about
mean MFE across the parameters considered in Figs. 2 to 5             a 1 order-of-magnitude underprediction of N3 below about

Atmos. Chem. Phys., 21, 1889–1916, 2021                                                 https://doi.org/10.5194/acp-21-1889-2021
B. Croft et al.: Factors controlling marine aerosol size distributions and their climate effects                                  1899

Figure 5. Vertical profiles of NAAMES campaign-median aerosol non-refractory sulfate and organic mass concentrations at standard tem-
perature and pressure (STP) from aerosol mass spectrometer and refractory black carbon from single particle soot photometer observations
aboard aircraft (black, with 25th–75th percentiles in grey) and for the six GEOS-Chem-TOMAS simulations described in Table 1 (color-
coded as shown in the legend). Simulated sulfate shown is non-sea-salt sulfate. All measurement and model output is binned at 500 m
resolution, and campaign-median values are plotted at the midpoint of each bin starting at 250 m above the surface. Lines show linear
interpolation between these values.

2 km for noABLNUC. noABLNUC has an unacceptable                       condensation sink is low, and conditions favor high oxidation
seasonal-mean model–measurement agreement across the                  rates. We acknowledge that this approach will miss variabil-
measurement set (MFE ranges from 0.66 to 0.78, Table S2).             ity in the timing and rates, because it is a surrogate and not
Figure 3 also shows that NPF near and above the MBL top               exactly the correct mechanism. As well, in the summertime,
makes a significant contribution to simulated particle number         the simulations underpredict N3–N10 concentrations above
concentrations for aerosol diameters of 10 to 282 nm in the           2 km, suggesting the need for future work to better under-
lower troposphere, most strongly in the summertime (BASE              stand the NPF processes at these levels, where the binary
relative to noABLNUC). There is little impact on aerosol              scheme of Vehkamaki et al. (2002) does not generate suf-
mass concentrations for simulation noABLNUC relative to               ficient NPF.
BASE (Fig. 5).                                                           NPF also makes a very strong contribution to the simulated
   The simulated N3–N10 (Fig. 4) illustrates that representa-         aerosol size distributions within the MBL near the ocean sur-
tion of NPF is a challenge for models, because there are diffi-       face (BASE vs. noABLNUC, Fig. 2). Although our simula-
culties capturing the magnitude and altitudes of the N3–N10           tions do include NPF within the MBL, simulated NPF occurs
maxima. These discrepancies reflect key knowledge gaps re-            more strongly near and above the MBL top and the resul-
lated to the species that can form new particles in the marine        tant particles grow by condensation of available vapors and
environment (e.g., Veres et al., 2020). As well, the coeffi-          cloud processing while descending into the MBL. This role
cient that we used for the surrogate activation-style nucle-          for NPF is in agreement with previous studies including those
ation parameterization was derived for a continental environ-         of Clarke et al. (2013), Quinn et al. (2017), and Williamson
ment. The empirical (“A”) value used by the parameteriza-             et al. (2019). As a result, NPF from several altitudes above
tion appears to yield excessive NPF for the NAAMES ma-                the ocean surface contributes to the near-ocean-surface par-
rine environment. Activation-style nucleation was added in            ticles, with diameters from 20 to 200 nm. NPF does occur in
our simulations as a proxy for missing nucleation when the            the MBL. However, those levels above the MBL clouds favor

https://doi.org/10.5194/acp-21-1889-2021                                                Atmos. Chem. Phys., 21, 1889–1916, 2021
1900                           B. Croft et al.: Factors controlling marine aerosol size distributions and their climate effects

Figure 6. Vertical profiles of NAAMES cruise-track campaign-median observed dimethyl sulfide (DMS) mixing ratios (black, 25th–75th
percentiles in grey) from aboard aircraft and for the six GEOS-Chem-TOMAS simulations described in Table 1 (color-coded as shown in
the legend). Simulations BASE, noABLNUC, noMSOA, and noSS are nearly coincident. All measurement and model output is binned at
500 m resolution, and campaign-median values are plotted at the midpoint of each bin starting at 250 m above the surface. Lines show linear
interpolation between these values. Note the horizontal scale change between panels.

Table 2. Mean fractional error (MFE) between observations and the six GEOS-Chem-TOMAS simulations described in Sect. 2.2 and Table 1
for the ship-track campaign-median aerosol size distributions shown in Fig. 2.

         Simulation      Nov 2015              May/Jun 2016         Aug/Sep 2017         Mar/Apr 2018          Annual mean
                         bloom minima          bloom maxima         declining phase      accumulating
         BASE                 0.20                 0.33                 0.04                  0.28                 0.21
         noABLNUC             0.95                 0.51                 0.89                  0.50                 0.71
         noMSOA               0.76                 0.31                 0.84                  0.59                 0.63
         noDMS                0.44                 0.27                 0.43                  0.06                 0.30
         noSHIPS              0.31                 0.13                 0.23                  0.21                 0.22
         noSS                 0.31                 0.24                 0.12                  0.28                 0.24

oxidative chemistry that yields particle precursors, particu-              Extending the surrogate activation-style parameterization
larly from the widespread and persistent DMS sources in the             to the surface (Figs. S5–S8 and Table S3) leads to overpre-
marine environment (Kazil et al., 2011). Table 2 shows that             diction of the number of particles with diameters less than
for all seasons, the surrogate nucleation (simulation BASE,             50 nm in the MBL and yields higher MFEs (ranging from
MFEs ranging from 0.04 to 0.33) represents an improvement               0.20 to 0.56) than for simulation BASE, although the errors
over simulation noABLNUC (without this surrogate NPF pa-                were not as large as those for noABLNUC. For the vertical
rameterization, MFEs ranging from 0.50 to 0.95).                        profiles, this extra NPF extended into the MBL yields over-
                                                                        prediction of N3, N10, and N3–N10 below 1 km in all sea-

Atmos. Chem. Phys., 21, 1889–1916, 2021                                                    https://doi.org/10.5194/acp-21-1889-2021
B. Croft et al.: Factors controlling marine aerosol size distributions and their climate effects 1901
sons. Aerosol surface area and volume (in the SMPS particle- the simulated number concentration of particles with diam-
diameter size range of 10–282 nm) were also overpredicted eters larger than 50 nm in the MBL by up to a factor of 2,
during the August/September declining phase, when the sim- with the greatest sensitivity during the summertime (Fig. S1).
ulated temperature-dependent MSOA source was strongest, For the NAAMES MBL size distributions, the annual-mean
growing these extra new particles to larger sizes. These chal- model–measurement MFEs are acceptable (ranging from
lenges highlight the relevance of ongoing research to better 0.23–0.38, lowest for BASE) for all temperature-dependent
understand NPF in the marine environment. parameterizations that we tested, except for the factor of 10
scaling up of the BASE MSOA parameterization (simula-
3.3 Role of particle growth by condensing marine tion 10 × (70T − 350), Table S1, MFE of 0.75) and with the
organic vapors MSOA parameterization removed (simulation noMSOA, Ta-
ble S1, MFE of 0.63). While this source flux is reasonably
Condensing marine organic vapors forming MSOA are constrained for our simulations, future work is needed to bet-
needed in our simulations (in addition to H2 SO4 ) for ter understand and parameterize this source.
sufficient particle growth to yield satisfactory model– The vertical profiles are also sensitive to the MSOA pa-
measurement agreement for MBL size distributions (BASE rameterization (Figs. S2–4). Between noMSOA and the var-
vs. noMSOA, Fig. 2). For simulation noMSOA, the model ious MSOA parameterizations that we tested, concentra-
overpredicts the number of particles with diameters smaller tions vary by up to a factor of about 2 for aerosol number
than about 30 nm in the MBL. Due to insufficient particle (N3, N10, and N3–N10), SMPS-size-range (diameters 10–
growth of these sub-30 nm particles, the number of particles 282 nm) number, surface area, volume, and also OM. Simula-
with diameters between about 30 and 200 nm is underpre- tion noMSOA has relatively greater error in the mean across
dicted by more than 50 % for simulation noMSOA. the entire measurement set for each season (MFE ranges
In our simulations, MSOA enables particle growth to CCN from 0.53–0.68) relative to BASE (MFE ranges from 0.42–
sizes (diameters of about 50 nm or larger). After particles 0.50) (Table S2).
reach CCN sizes, cloud processing can also contribute to Although the chosen MSOA parameterization reasonably
simulated particle growth towards accumulation-mode par- represents the observations, major knowledge gaps remain
ticles (diameters of 100–1000 nm) due to aqueous-phase regarding MSOA precursor species and their chemical life-
aerosol production. Other cloud processes include coagula- times. While the nature of MSOA precursors is not well-
tion of cloud droplets with each other and with interstitial understood, recent measurements suggest that these precur-
aerosols (Hoose et al., 2008; Pierce et al., 2015). Our simula- sors could include a variety of chemical compounds. For ex-
tions include the latter and aqueous-phase sulfate production. ample, measurements from the Arctic indicate that the or-
As clouds evaporate, cloud processing leads to development ganics in marine aerosols were not typical biogenic SOAs
of the “Hoppel minima” of the MBL aerosol size distribu- but had a long hydrocarbon chain, implying a fatty-acid-type
tions (Hoppel et al., 1986), which is the minimum aerosol precursor (Willis et al., 2017). In other marine regions, iso-
diameter that activates to form a cloud droplet (about 50– prene (Ciuraru et al., 2015) and carboxylic acids (Chiu et al.,
70 nm for the observations in Fig. 2). This minimum diame- 2017) may also be important. Given the limitations of current
ter is smallest in the winter transition (November 2015), sug- knowledge and the indications for a variety of MSOA pre-
gesting that smaller particles activated under the clean con- cursors, the improved MFEs for BASE relative to noMSOA
dition of this season relative to the other seasons. As shown provide support for the employed MSOA parameterization.
by Table 2, simulation noMSOA has an unacceptable annual- The near-surface campaign-median climax transition and
mean MFE of 0.63, larger than the MFE of 0.21 for simula- declining phase OM concentrations are within the 25th to
tion BASE, which includes particle growth due to MSOA. 75th measurement percentiles for simulation BASE and be-
The nature and flux of marine vapors forming MSOA low the 25th percentile of the observations for simulation
are not well understood. As a result, we developed a noMSOA (Fig. 5). On average over the lowest 2 km of
simplistic MSOA parameterization for use in this study, the atmosphere during the May/June climax transition and
such that the MSOA precursors vapor emissions are an August/September declining phase, simulation BASE rel-
increasing function of temperature. This approach yields ative to noMSOA indicates that MSOA contributes about
a seasonal cycle and is in agreement with the tempera- 200–400 ng m−3 to simulated OM. Saliba et al. (2020) sug-
ture dependence trend found by previous studies, includ- gest that MBL measurement of non-refractory OM during
ing Meskhidze et al. (2015), Rodríguez-Ros et al. (2020a), NAAMES clean marine periods provides a good estimate of
and Rodríguez-Ros et al. (2020b). We find that the simu- MSOA. Their seasonal-average non-refractory OM value of
lated NAAMES cruise-track median aerosol size distribu- about 300–400 ng m−3 for the May/June 2016 climax transi-
tions are sensitive to the coefficients used in the parameter- tion (phytoplankton bloom maxima) and August/September
ization (SMSOA = 70T − 350 µg m−2 d−1 ) (Figs. S1 and Ta- 2017 declining phase is similar to our model result. This con-
ble S1). For example, varying the temperature sensitivity be- tribution is about three- to fourfold greater than the contri-
tween 50–100 and the intercept between 300–500 changes bution upwards of 100 ng m−3 from previous studies, noted
https://doi.org/10.5194/acp-21-1889-2021 Atmos. Chem. Phys., 21, 1889–1916, 2021You can also read