DECARBONISATION OPTIONS FOR THE DUTCH POLYOLEFINS - INDUSTRY A. Negri, T. Ligthart - PBL
←
→
Page content transcription
If your browser does not render page correctly, please read the page content below
DECARBONISATION OPTIONS
FOR THE DUTCH POLYOLEFINS
         INDUSTRY

                     A. Negri, T. Ligthart

                       02 February 2021

Manufacturing Industry Decarbonisation Data Exchange Network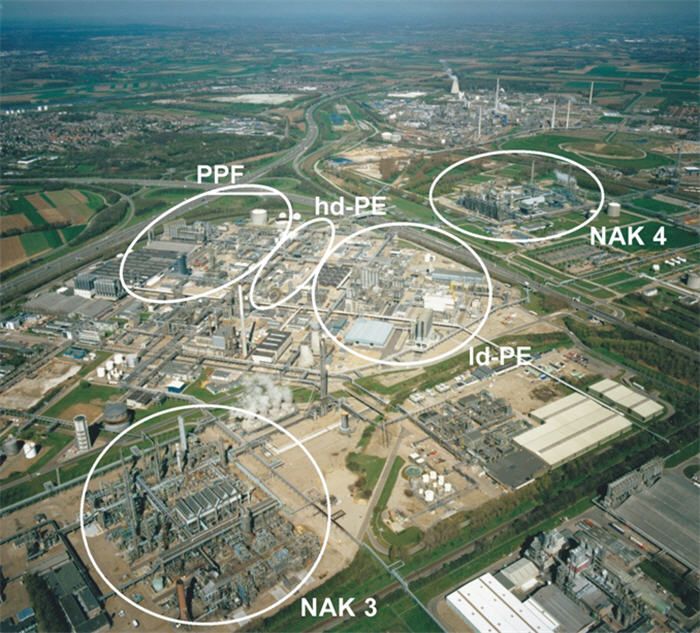
Decarbonisation options for the Dutch Polyolefins industry
© PBL Netherlands Environmental Assessment Agency; © TNO
The Hague, 2020
PBL publication number: 4236
TNO project no. 060.43373 | TNO 2020 P11985

Author(s)
Aurelio Negri and Tom Ligthart

Acknowledgements
We are thankful to Kees Biesheuvel (Dow Petrochemicals) and Bart Eurlings (SABIC Limburg)
for providing us with valuable insight and feedback regarding the current PE and PP
production processes. We are also thankful to many colleagues at TNO and PBL for their help
and support while working on this project.

MIDDEN project coordination and responsibility
The MIDDEN project (Manufacturing Industry Decarbonisation Data Exchange Network) was
initiated and is also coordinated and funded by PBL and TNO EnergieTransitie. The project
aims to support industry, policymakers, analysts, and the energy sector in their common
efforts to achieve deep decarbonisation. Correspondence regarding the project may be
addressed to:
D. van Dam (PBL), Dick.vanDam@pbl.nl
S. Gamboa Palacios (TNO), Silvana.Gamboa@tno.nl

Production coordination

This publication is a joint publication by PBL and TNO EnergieTransitie and can be
downloaded from: www.middenweb.nl. Parts of this publication may be reproduced,
providing the source is stated, in the form: Negri, A. & Ligthart, T. (2020), Decarbonisation
options for the Dutch polyolefins industry. PBL Netherlands Environmental Assessment
Agency and TNO EnergieTransitie, The Hague.

PBL Netherlands Environmental Assessment Agency is the national institute for strategic
policy analysis in the fields of the environment, nature and spatial planning. PBL contributes
to improving the quality of political and administrative decision-making by conducting
outlook studies, analyses and evaluations in which an integrated approach is considered
paramount. Policy relevance is the prime concern in all of PBL’s studies. PBL conducts
solicited and unsolicited research that is both independent and scientifically sound.

TNO EnergieTransitie has a twofold mission: to accelerate the energy transition and to
strengthen the competitive position of the Netherlands. TNO conducts independent and
internationally leading research and we stand for an agenda-setting, initiating, and
supporting role for government, industry and NGOs.

This report was offered to review to Dow Benelux, SABIC Limburg, Ducor Petrochemicals.
Both SABIC Limburg and Dow Benelux gave comments that have been incorporated into this
report. PBL and TNO remain responsible for the content. The decarbonisation options and
parameters are explicitly not verified by the companies.
Contents
List of abbreviations                                                              4
Summary                                                                            5

INTRODUCTION                                                                       6
1   POLYOLEFIN PRODUCTION IN THE NETHERLANDS                                       8
1.1   Introduction to the Dutch chemical industry                                  8
1.2   DOW                                                                         10
1.3   SABIC                                                                       11
1.4   DUCOR                                                                       13

2     POLYOLEFINS PRODUCTION PROCESSES                                           15
2.1   General overview                                                            15
2.2   Ethylene and propylene                                                      16
2.3   Low-Density Polyethylene                                                    17
2.4   Linear Low-Density Polyethylene                                             19
2.5   High-Density Polyethylene                                                   20
2.6   Polypropylene                                                               22
2.7   Recap of energy demand and carbon emissions                                 24

3     POLYOLEFINS PRODUCTS AND APPLICATION                                       25
3.1   General overview                                                            25
3.2   Low-Density Polyethylene                                                    26
3.3   Linear Low-Density Polyethylene                                             27
3.4   High-Density Polyethylene                                                   29
3.5   Polypropylene                                                               30

4     DECARBONISATION OPTIONS FOR POLYOLEFINS                                    33
4.1   Fuel substitution                                                           34
4.2   Feedstock substitution to bio-based materials                               37
4.3   Process design                                                              45
4.4   Recycling                                                                   45
4.5   Product design                                                              52
4.6   Use of residual energy                                                      53
4.7   CO2 capture, storage, and usage                                             53

5     DISCUSSION AND CONCLUSION                                                  54
5.1   Discussion                                                                  54
5.2   Conclusion                                                                  55

REFERENCES                                                                       57
APPENDIX: SIMPLIFIED SCENARIO FOR THE POLYOLEFINS
INDUSTRY                                                                         64
A1    Introduction                                                                64
A.2   Results                                                                     64

                                                      A MIDDEN report – PBL – TNO | 3
List of abbreviations
BAT               Best Available Technique
CAPEX             Capital Expenditures
CCS               Carbon Capture and Storage
CCU               Carbon Capture and Utilization
CHP               Combined Heat and Power
CO                Carbon Monoxide
CO2               Carbon Dioxide
EEI               Energy Efficiency Improvement
EFA               Energy Flow Analysis
EU ETS            European Union Emission Trading System
GHG               Greenhouse Gases
GWP               Global Warming Potential
HDPE              High-density Polyethylene
IHP               Industrial Heat Pump
LDPE              Low-density Polyethylene
LLDPE             Linear Low-density Polyethylene
MFA               Material Flow Analysis
MSF               Municipal Solid Waste
MTO               Methanol-to-Olefins
MIDDEN            Manufacturing Industry Decarbonisation Data Exchange Network
NEa               Dutch Emission Authority (Nederlandse Emissieautoriteit)
NOX               Nitrogen Oxides
OPEX              Operating Expenditures
PE                Polyethylene
PP                Polypropylene
PV                Photovoltaic
TRL               Technology Readiness Level
WGS               Water-Gas Shift

PBL – TNO | 4 – A MIDDEN report
FINDINGS

Summary
The Dutch chemical industry is the fourth largest in Europe and tenth in the world, having a
turnover of over 50 billion euros. Characterised by a central position in the European market
and by the presence of highly integrated clusters such as the Port of Rotterdam and the
Chemelot industrial park in Limburg, The Netherlands hosts some of the biggest producers of
polyethylene (PE) and polypropylene (PP), the two most common plastic polymers
worldwide. Lightweight, cheap, and reliable, these two polyolefins compose about half of the
European demand for plastic products, especially for packaging, agriculture, construction,
automotive, and household objects.

In the Netherlands, the main producers of PE and PP are Dow in Terneuzen (Zeeland), SABIC
in Geleen (Limburg), and Ducor in Rozenburg (Zuid-Holland), for a total yearly production of
2.6 Mt, equal to 4% of the total polyolefins production in Europe. Dow and SABIC are
registered with the European Emissions Trading Systems (EU ETS), while Ducor provides an
annual environmental report to the Dutch government. Together, the production of PE and
PP by these three companies cause the consumption of 5.2 PJ of primary energy and the
(declared) emissions of 233 kt of CO2-eq.

The main processes involved in the production of the polyolefins are naphtha cracking for
ethylene and propylene, high-pressure polymerisation for low-density polyethylene (LDPE),
solution polymerisation for linear low-density polyethylene (LLDPE), suspension
polymerisation for high-density polyethylene (HDPE), and gas phase polymerisation for PP.
The electricity, heat, and material consumption of these processes, as well as the emissions
of greenhouse gases (GHG) is obtained from available literature together with data from Dow
Terneuzen, SABIC Geelen, and Ducor Rozenburg.

As the polymerisation processes do not offer much potential for efficiency improvements and
energy demand reduction, the most promising decarbonisation options for the Dutch
polyolefins industry involve system-wide changes and the integration of a bio-based supply
chain with a plastic-to-plastic circular economy loop based on innovative recycling techniques
to recover the plastic waste. The deployment of industrial-scale chemical recycling
technologies such as solvent-based purification, pyrolysis, and gasification, coupled with the
production of virgin polymer from sugar-based crops, lignocellulosic materials, and biowaste,
is most likely the best decarbonisation strategy for the sector.

The economic costs of bio-based PE and PP are currently higher than their fossil-based
counterparts, and the pyrolysis and gasification of plastic waste are not yet at a commercial
level, but the transition to a greener plastic industry could be facilitated by governmental
policies such as an increased carbon tax for fossil-based processes, the creation of subsidies
for sustainable technologies, and stricter regulations for the use of plastic products and the
design of easy-to-recycle packaging. If all the decarbonisation options described in this
report were to become economically feasible on a large-scale, this would be one of the ways
for the realisation of its national and European carbon emissions reduction goals.

                                                                    A MIDDEN report – PBL – TNO | 5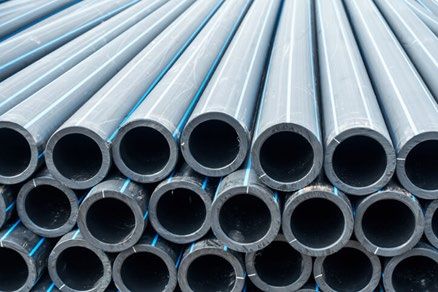
FULL RESULTS

Introduction
This report describes the current situation of the polyethylene (PE) and polypropylene (PP)
production in the Netherlands and the options and preconditions for its decarbonisation. The
study is part of the MIDDEN project -Manufacturing Industry Decarbonisation Data Exchange
Network-, which aims to support industry, policymakers, analysts, and the energy sector in
their common efforts to achieve deep decarbonisation of the Dutch economy (PBL, 2020).
The MIDDEN project will update and elaborate further on options in the future, in close
connection with the industry.

Problem definition
In the last decades, planet Earth and human society have experienced tremendous changes,
with the world population growing by 42% (World Bank, 2020), the final consumption of
energy increasing by 51%, and CO2 emissions rising by 58% (IEA, 2020), in the period from
1990 to 2017. This immense growth of human activity has unequivocal impacts on the
climate system, and the observed environmental changes have reached unprecedented
magnitudes. Anthropogenic greenhouse gases (GHG) emissions led to increasing
temperature of atmosphere and oceans, and the last 30 years have been the warmest of the
last 14 centuries, with most projections forecasting an increase of 2-4°C in 2100 (IPCC,
2014). The negative effects of climate change are widespread over all continents and include
the rapid increase of heat waves, floods, droughts, hurricanes, ocean acidification,
desertification, the melting of the polar ice caps, and the consequent rise of the sea level
(NASA, 2020), which is forecasted to grow between 0.3 and 1.0 meters before the end of the
century (IPCC, 2014).

The worry for the future of mankind has led to the development of environmental policies
and the creation of worldwide treaties like the Kyoto Protocol in 1997 and the Paris
Agreement in 2016, when 196 state parties ratified their common determination to reduce
GHG emissions and keep the global temperature rise below 2°C (UNFCCC, 2020). According
to the EU Climate & Energy framework, in the European Union this effort has been quantified
with the target of cutting 40% of GHG emissions by 2030 (European Commission, 2020a),
and the new European Green Deal has the goal to make the EU climate neutral by 2050,
making energy, buildings, industry and transport sustainable and boosting circular economy
(EU Green Deal, 2020). Like many other European countries, The Netherlands has developed
a national plan to achieve the targets agreed on in the Paris Agreement, and its
“Klimaatakkoord” has the ambition of reducing GHG by 49% in 2030 compared to 1990
levels, with the industrial sector alone reducing its emissions by 59% (Klimaatakkoord,
2019). Among the other subsectors, manufacturers of plastic monomers and polymers are
thus in the need of improving the energy and material efficiency of their production
processes and reduce the associated GHG emissions.

PBL – TNO | 6 – A MIDDEN report
Scope
The aim of the MIDDEN project is to compile a database of material and energy uses of
industrial processes at a plant level for the Dutch manufacturing industry. The scope of this
specific project is the polymerisation of PE and PP in the Netherlands, starting from
respectively ethylene and propylene as feedstocks. When looking at the decarbonisation
options, however, the research boundaries will be expanded to cover the end-of-use (i.e.
recycling) and feedstock production (e.g. bio-based ethylene) options.

The research question to be answered is: “What is the environmental impact of polyethylene
(PE) and polypropylene (PP) production in the Netherlands in terms of energy use and GHG
emissions, and what is the potential of the available decarbonisation options to reduce the
effect on climate change?”

Producers involved in this project are:
    •  Dow (Terneuzen, Zeeland)
    •  SABIC (Geleen, Limburg)
    •  Ducor (Rozenburg, Zuid-Holland).

Production processes include:
    •   High-density polymerisation with tubular reactor
    •   Solution polymerisation with double reactor
    •   Slurry polymerisation with loop reactor
    •   Gas phase polymerisation.

Products include:
    •  Low-density Polyethylene (LDPE)
    •  Linear Low-density Polyethylene (LLDPE)
    •  High-density Polyethylene (HDPE)
    •  Polypropylene (PP).

The main options for decarbonisation are:
   •   Bio-based polyolefins from the fermentation of sugar-based crops
   •   Bio-based polyolefins from the gasification of lignocellulosic and biowaste streams
   •   Mechanical recycling of the polyolefins
   •   Chemical recycling of the polyolefins with solvent-based purification
   •   Chemical recycling of the olefin monomers with pyrolysis
   •   Chemical recycling of the olefin monomers with gasification.

Reading guide
    •   Chapter 1 gives a general introduction to the PE and PP manufacturing industry in
        the Netherlands, presenting plastics companies, production sites, and registered CO2
        emission.
    •   Chapter 2 describes the PE and PP production process schemes adopted by plastics
        producers in the Netherlands, including the specific energy consumption and specific
        CO2 emissions.
    •   Chapter 3 gives an overview on the relevant products and applications of PE and PP,
        presenting production volumes, prices, and market shares.
    •   Chapter 4 systematically quantifies and evaluates the options for decarbonisation,
        providing economic and environmental indicators.
    •   Chapter 5 is dedicated to the discussion, including a simplified decarbonisation
        scenario to 2050, and final conclusion.

                                                                    A MIDDEN report – PBL – TNO | 7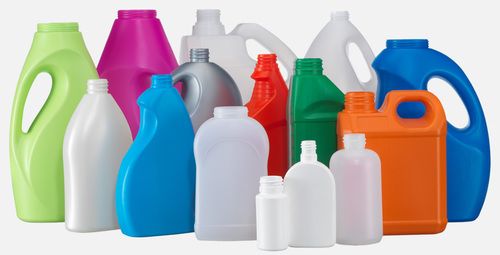
1 Polyolefin production
in the Netherlands
1.1        Introduction to the Dutch chemical industry
In the past decades the Dutch chemical industry has evolved, making the Netherlands the
fourth largest chemical producer in Europe and tenth worldwide, with a sector turnover of 50
billion euros that constitutes 6% of the national GDP (World Bank, 2020) and 13% of the
industrial added value, providing employment to more than 43,000 people distributed among
more than 800 chemical companies (VNCI, 2018). Compared to other countries, the Dutch
industry is characterised by the presence of highly integrated clusters which result in cost-
efficient exchange of energy and materials, and other competitive benefits (VNCI, 2018). The
industry is home to a wide variety of sectors, such as the petrochemical, fertilizers, chlor-
alkali, and polyolefins. Crude oil is processed in petroleum refineries to produce platform
chemicals (e.g. propane, gasoil and naphtha) which are then converted into plastic
monomers (e.g. ethylene and propylene) and used to manufacture polyolefins such as LDPE,
HDPE and PP, but also rubbers, resins, and other chemical products.

The geographical position of the Netherlands in the centre of Europe, coupled with the highly
developed seaports and pipelines, helped the country to become a central hub for the other
European countries, with yearly imports of oil products exceeding 84,000 ktoe in 2019 and
exports over 106,000 ktoe (IEA, 2020). While this industrial activity is beneficial for the
Dutch employment and national economy, it is also responsible for a massive amount of GHG
emissions. In 2018, the manufacture of refined petroleum products resulted in the emissions
of 10 Mton of CO2 (CBS, 2020), and the chemical industry (including the production of
plastics) emitted another 20 Mton, while consuming 295 PJ (IEA, 2020). To put this into
perspective, the chemical and oil subsectors used 12% of the Dutch primary energy demand
(IEA, 2020) and emitted 18% of the total emissions (CBS, 2020).

1.1.1      Production locations of polyolefins in the Netherlands

In the Netherlands PE and PP are mainly produced by three companies: Dow, SABIC and
Ducor. While Dow and SABIC are registered under the EU ETS and their emissions are
reported by the Dutch Emissions Authority (NEa), Ducor is below the threshold (25 ktCO2-
eq) for direct emissions and is thus not part of the program (EU ETS, 2015). Ducor, however,
declares its emissions to the emission registration department of Dutch government
(Emissieregistratie, 2020). The PE and PP production locations of the three companies are
shown in Figure 1, while more information about the history, infrastructure, carbon
emissions and energy demand of the production sites will be given in the following sections
of this chapter.

PBL – TNO | 8 – A MIDDEN report
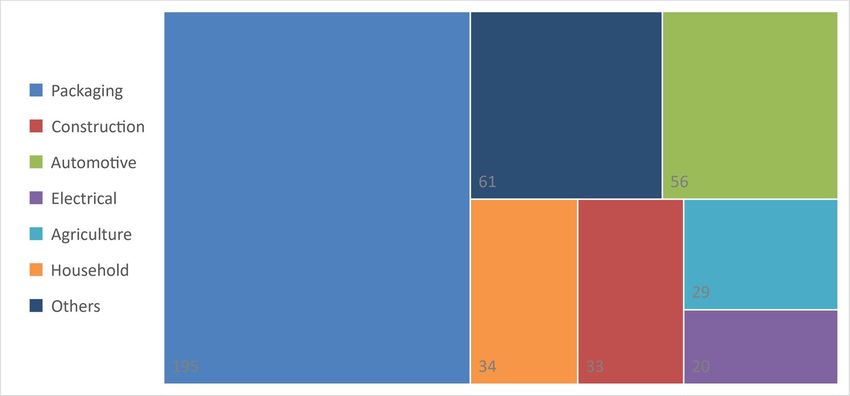
Figure 1 locations of Dow (Terneuzen, in green), SABIC (Geleen, in blue), and
Ducor (Rozenburg, in red) in the Netherlands. (Simplemaps, 2020)

An overview of the producers, including their production capacity and registered CO2
emissions, is presented in Table 1. The value declared to the NEa by Dow and SABIC is the
sum of the emissions caused by all the activities carried out in the production sites and are
thus not limited to the production of polyethylene and polypropylene. The other activities of
Dow and Sabic (including their decarbonisation options) are described in other MIDDEN
reports (Rodriguez, Van Dril, & Gamboa Palacios, 2021); (Oliveira C. & Schure, 2020). More
information about the existing infrastructures, the energy demand, and the carbon emissions
of these production sites will be given in the specific sections regarding the three companies
involved in the project.

Table 1 Overview of PE and PP producers in the Netherlands, made with information
from different sources (Dow, 2017, 2020b; Ducor, 2020b; Emissieregistratie, 2020;
NEa, 2020; SABIC Limburg, 2020).

 Producer    Location        Polyolefins     Production      Number of        Declared CO2
             (city,          produced         capacity       employees         emissions
             province)                         [kt/yr]                           [t/yr]
 Dow         Terneuzen,      LDPE, LLDPE         1,100          3,600             124,283
             Zeeland

 SABIC       Geleen,         LDPE, HDPE,         1,290          1,600             96,191
             Limburg         PP

 Ducor       Rozenburg,      PP                   200             80              12,940
             Zuid-Holland

                                                                   A MIDDEN report – PBL – TNO | 9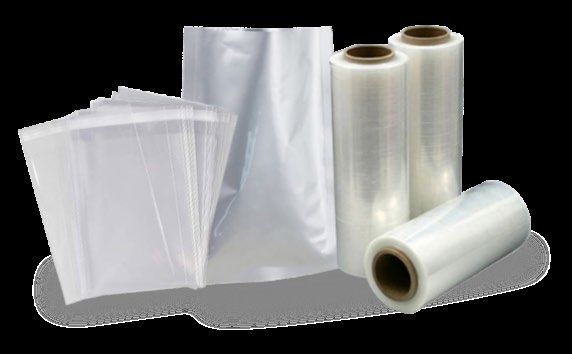
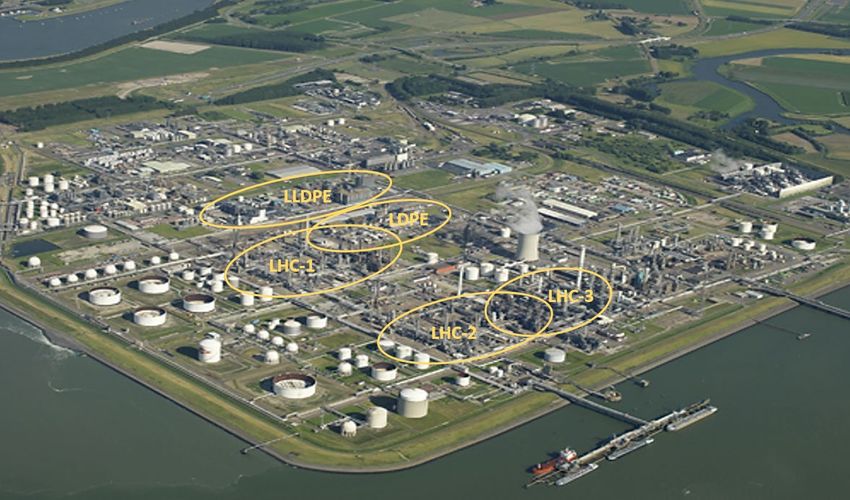
1.2       DOW
1.2.1     History of the company

The Dow Chemical Company (from now on, Dow) is the third largest chemical producer in
the world (C&EN, 2019), with headquarters in the United States of America. Dow was
founded in 1897 by chemist Herbert Henry Dow and always had the tradition of diversifying
its product line, ranging from agricultural chemicals and plastics resins, to plutonium during
World War II and napalm during the Vietnam War. In 2011, Dow divested its global
polypropylene business to Braskem, the largest petrochemical company in Latin America, in
order to better focus on improving the performance of its polyethylene production (Business
Wire, 2011). In 2017, Dow merged with DuPont, becoming the largest chemical producer in
the world, but two years later the company was reorganised and split into three separate
publicly traded companies focusing on materials science (Dow Inc.), agriculture (Corteva),
and specialty products (DuPont) (C&EN, 2019).

Dow is present in Europe since 1955 and in The Netherlands since 1964, when it opened its
first factory in Terneuzen. The industrial cluster in the province of Zeeland also houses other
chemical companies, like Yara and Arkema, and good transport connections via land and
water (VNCI, 2018). The company expanded in the last decades, and Terneuzen is currently
the second largest Dow production site in the world (Dow, 2020b), with a yearly turnover of
more than 2 billion euros (Dow, 2017). For what concerns polyethylene production, the site
hosts a production line for LDPE, built between 1968 and 1975, and three production lines
for LLDPE, built in 1980, 1986 and 2000, as seen in Figure 2 (Internal communication with
Dow Terneuzen, 2020).

Figure 2 Aerial view of Dow chemical plants in the Terneuzen site with the
locations of the LLDPE and LDPE production and the crackers where the Low Hydro
Carbons (LHC) are produced (Dow, 2020b).

PBL – TNO | 10 – A MIDDEN report
1.2.2    Registered emissions and energy consumption

Dow Terneuzen has ten permit numbers registered with the Dutch Emissions Authority (NEa)
and the EU ETS. The production sites relative to PE production are shown in Table 2. The
large difference between 2017 and 2018 for the production site Dow BKG 07 is the result of a
maintenance stop in 2017.

Table 2 Registered direct carbon emissions for Dow Terneuzen (NEa, 2020).

 Permit             Production      Activity               CO2 emissions       CO2 emissions
 number             site                                   [t/yr] in 2017      [t/yr] in 2018
 NL-200400084d      Dow BKG 05      PE production               6,827                 6,112

 NL-200400084f      Dow BKG 07      Energy for PE               36,199              54,314

 NL-200400084g      Dow BKG 08      Energy for PE               61,675              63,857

The nominal capacity and energy demand of each product is shown in Table 3. A production
line for HDPE was being planned, but the project has been recently cancelled (Internal
communication with Dow Terneuzen, 2020).

Table 3 Nominal capacity and estimated energy consumption for the production of
LDPE and LLDPE in Dow Terneuzen (Internal communication with Dow Terneuzen,
2020).

 Product         Nominal         Electricity           Steam         Total primary energy
                 capacity       consumption         consumption          consumption
                  [kt/y]          [GWh/y]              [TJ/y]               [TJ/y]

 LDPE               300              288               -200                     497

 LLDPE              800              282                552                    1,319

Electricity and steam are supplied to Dow by the “Electricity and Steam Association” (ELSTA)
near Terneuzen, which has been owned by Dow since 2018. The cogeneration facility is
equipped with one steam turbine and three gas-fired turbines with a connected heat
recovery boiler, and is able to generate a total of 460 MW of electricity and 850 tonnes/hour
of steam at a pressure of 90 bar, supplying to Dow and, for electricity, also to the public grid
(ELSTA, 2020).

1.3      SABIC
1.3.1    History of the company

SABIC is the fourth largest chemical producer in the world (C&EN, 2019), and the second
largest public company in the Middle East and in Saudi Arabia, where its headquarters are
based. SABIC was founded in 1976 under the will of the Saudi government to covert the oil
into polymers and other chemicals, and later expanded in the fertilizers and metals
subsectors. In 2019, 70% of SABIC’s shares were acquired by Saudi Aramco, the state-
owned energy company of Saudi Arabia (SUSTG, 2019). In 2002, SABIC acquired several

                                                                    A MIDDEN report – PBL – TNO | 11
factories from the Dutch petrochemical company DSM, officially starting operations in Europe (Kapner, 2002). The company is present in The Netherlands through its subsidiaries SABIC Europe, SABIC Limburg B.V., SABIC Petrochemicals B.V., and SABIC Innovative Plastics B.V. (SABIC Limburg, 2020). 1.3.2 Registered emissions and energy consumption SABIC is part of the Chemelot cluster in Geleen, an industrial area characterized by strong integration of utilities and services, grouping together more than 50 factories and R&D facilities (VNCI, 2018). SABIC infrastructures constitute about half of the space at Chemelot, including two naphtha crackers (NAK3 and NAK4) for the production of plastic monomers, three LDPE production lines (ld-PE), two HDPE production lines (hd-PE), and two PP reactors (Internal communication with SABIC, 2020), as shown in Figure 3. Figure 3 Aerial view of SABIC chemical plants at Chemelot industrial park, showing the naphta crackers NAK3 and NAK4, and the production lines of PP, HDPE and LDPE (SABIC Limburg, 2020). The companies within the Chemelot industrial cluster are grouped together and registered to the Dutch Emissions Authority (NEa) under the name of “Chemelot BKG”, for a total of 14 permits. However, starting from the next year the companies will be treated as a single entity and their emissions will be merged together in one NEa permit number (Internal communication with SABIC, 2020). At the moment, the emissions caused by SABIC production of PE and PP fall under the “Chemelot BKG 012” permit, which also include other production activities, as shown in Table 4. PBL – TNO | 12 – A MIDDEN report
Table 4 Registered carbon emissions in 2018 and 2019 for PE and PP production by
SABIC Limburg (NEa, 2020) and (Internal communication with SABIC, 2020).

    Permit number          Production       Activity              CO2 emissions          CO2 emissions
                           site                                   [t/yr] in 2018         [t/yr] in 2019
    NL-200400161k 1        Chemelot         PE, PP, others             78,068                 96,191
                           BKG 012
    NL-200400161k 1        Chemelot         Only PE and PP             34,823 2              34,497 2
                           BKG 012
1   Including emission of some Utility Support Group (USG) Industrial Utilities units.
2   Only direct emissions and heat-related emissions, no power emissions.

Table 5 shows the nominal capacity of the PE and PP production lines and the correspondent
electricity and steam demand for 2019.

Table 5 Nominal capacity and energy consumption for the production of LDPE,
HDPE, and PP in SABIC Geleen for 2019 (Internal communication with SABIC,
2020).

Product         Nominal       Electricity   Steam        Gas     Total primary energy
                capacity     consumption consumption consumption     consumption
                 [kt/y]        [GWh/y]      [TJ/y]      [TJ/y]          [TJ/y]

LDPE               430             383               -428                0                    950

HDPE               310             112               468                11                    882

PP                 550             178               168                 0                    810

Electricity, steam and technical gases are supplied by Utility Support Group (USG), a joint
venture between SABIC and Sitech Utility Holding CV with approximately 200 employees
(USG, 2020a). USG supplies many companies within the Chemelot industrial park thanks to
its 150 MW cogeneration plant, plus other 90 MW purchased externally. USG also collects
around 620 tonnes/hour of waste steam produced by the factories and produces itself an
additional 330 tonnes/hour to satisfy the steam demand of the companies (USG, 2020b).

1.4         DUCOR
1.4.1       History of the company

The polypropylene manufacturing facilities in Rozenburg were built in 1979 by Basell, but in
2007 the company merged with Lyondell and the agreement involved some capacity
divestment requirement (ChemEurope, 2001). The Rozenburg plant was acquired by DOMO,
a joint venture between the Belgian Domo Group and Carmel Olefins, a subsidiary of BAZAN
Group, the biggest petrochemical company of Israel. The joint venture changed name in
2011, becoming Ducor Petrochemicals (PlastEurope, 2011).

The manufacturing site in Rozenburg operates within the boundaries of Rotterdam-Rijnmond,
the largest chemical and petrochemical cluster in the Netherlands, which is characterised by
excellent infrastructures and connections, i.e. roads, pipelines and railways (VNCI, 2018).
Ducor is also part of “CIRCLE”, a consortium of international plastic companies and academia
aiming to reduce industrial waste and increase the amount of recycled material in plastic
products (Ducor, 2020b).

                                                                              A MIDDEN report – PBL – TNO | 13
1.4.2 Registered emissions and energy consumption
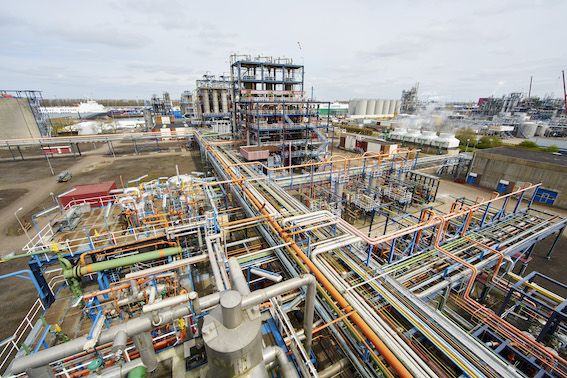
Ducor Rozenburg has 80 employees (Port of Rotterdam, 2016) and three production lines
that can produce different PP resins at the same time or be combined together to bear big
production loads in a short time. The strategic location into the logistic hub of the Rotterdam
port also means that Ducor is connected with an efficient system of pipelines for the supply
of utilities and feedstock (Ducor, 2018). Part of the infrastructures of Ducor Rozenburg can
be seen in Figure 4.
Figure 4 View of Ducor chemical plants in the Rozenburg site (Ducor, 2020b).
As previously mentioned, Ducor is not registered with the NEa, but in its environmental
report to the Dutch government, it declares 12,940 tonnes of CO2-eq for 2017
(Emissieregistratie, 2020). The nominal capacity and energy demand for the production of PP
in 2019 is shown in Table 6.
Table 6 Nominal capacity and energy consumption for the production of PP in Ducor
Rezenburg (Internal communication with Ducor).
Nominal capacity Electricity Steam Total primary energy
of the product consumption consumption consumption
[kt/y] [GWh/y] [TJ/y] [TJ/y]
200 (PP) 68 131 725
Utilities such as electricity, steam and industrial gases are supplied to Ducor by Air Liquide,
which is also part of the Rotterdam Port industrial cluster and adopts gas-fired cogeneration
turbines.
PBL – TNO | 14 – A MIDDEN report2 Polyolefins
production processes
2.1 General overview
This chapter is dedicated to the description of the current processes applied in The
Netherlands and utilities with all relevant physical inputs, outputs, and efficiencies.
Polyolefins are based on crude oil or, more specifically, on raw materials like ethene and
propene. During the chain polymerisation process, the chemical bonds of thousands of
monomers are forced to open and link to each other, creating a saturated chain
macromolecule whose properties can vary depending on the polymerisation process and
technique (European Commission, 2007). The first section will provide a quick overview of
the production of ethylene and propylene, the precursors required as feedstock to produce
polyolefins, while the following sections will be dedicated to LDPE, HDPE, LLDPE, and PP. For
each product, the flow scheme will be shown, including chemical structures, temperature and
pressure levels, the usable catalysts, initiators, co-monomers, and solvents. The CO2
emissions and energy demand of each process will also be compared to available
benchmarks from international literature and verified by the company involved in the study
or by other appointed sector representatives.
Table 7 Most common processes applied in polyethylene and polypropylene
production. Made with information from (European Commission, 2007;
PlasticsEurope, 2014a, 2014b).
POLYMERISATION LDPE LLDPE HDPE PP Explained in
PROCESS
High-pressure X Section 2.3
Solution X X Section 2.4
Suspension/slurry X X Section 2.5
Gas phase X X X Section 2.6
As seen in Table 7, four main polymerisation process technologies are applied in the
production of polyolefins, and all of them will be described and analysed in the following
sections. At Dow, LLDPE is produced under the brand name of Dowlex with a double reactor
solution process (Townsend Solutions, 2017), while HDPE is produced under the brand name
of Continuum with UNIPOL II process technology, which corresponds to a double reactor gas
phase process (Dow, 2020a). At SABIC, LDPE is produced by a high-pressure, 240 MPa,
tubular reactor, HDPE is produced using a slurry process with loop reactor, while PP is
produced using a gas phase polymerisation process (Internal communication with SABIC,
2020). At Ducor, PP is produced under the brand names DuPure and DuClear using Novolen
technology (Ducor, 2020a), which employs a stirred gas phase polymerisation reactor and a
nitrogen degassing vessel (McDermott, 2020).
A MIDDEN report – PBL – TNO | 152.2 Ethylene and propylene The monomers necessary for polyolefin production, namely ethylene (also called ethene, chemical formula: C2H4) and propylene (also called propene, chemical formula: C3H6), are produced by steam crackers. In the European Union, around 63% of the cracker feedstock is made up by naphtha coming from petroleum refineries, with the remaining share being liquified petroleum gas (LPG) and other natural gas liquids (Petrochemicals Europe, 2020). In The Netherlands, between 5,000 and 6,000 ktoe of naphtha are produced every year (IEA, 2020), accounting for around 10% of the cracker feedstock in the European Union (Petrochemicals Europe, 2020). Steam cracking units have a generic universal design, with only little modifications implemented to adapt to local conditions and optimize the plant performance. The energy and environmental performance of the steam crackers is assessed in (Oliveira C. & Schure, 2020; Wong & Van Dril, 2020), and this section only provides a summarized overview of the production steps, shown in Figure 5. Figure 5 Schematic diagram showing ethylene and propylene production in a naphtha-based steam cracking plant. Made with information from (PlasticsEurope, 2012). PBL – TNO | 16 – A MIDDEN report
The hydrocarbon feedstock is vaporised with superheated steam and sent to the furnace to
be cracked into smaller molecules. The temperature inside the furnace ranges from 750 to
875°C, and the steam is injected with a pressure of 1 MPa and a temperature of 180-200°C,
so the process only takes the fraction of a second. After exiting the furnace, the cracked
gases enter the transfer line exchanger, which cools them down to block further reactions
and recovers heat for internal use. In the quench tower the gases are de-superheated by a
water/oil stream and then condensed by a multi-stage gas compression. Carbon dioxide and
acid gases are removed, then the cracked gases are cooled down and dried. The product
fractionation consists of four progressive stages of chilling, extracting hydrogen, methane,
ethylene, propylene, and pyrolysis gasoline. Selective catalytic hydrogenation or extractive
distillation is used to remove the undesired acetylene, while the remaining ethane and
propane are recycled back into the steam cracker (PlasticsEurope, 2012).

Table 8 Energy demand and Greenhouse gasses emissions (GHG) relative to the
production of 1 kg ethylene and propylene. Made with information from the Eco-
profiles report (PlasticsEurope, 2012).

       Product           Electricity demand       Steam demand            GHG [kg CO2-eq]
                                 [MJ]                 [MJ]
    Ethylene (1kg)               0.76                   12.60                     1.44

   Propylene (1kg)               0.76                   12.60                     1.44

The values shown in Table 8 refer to the useful energy consumed by foreground processes
(i.e. steam cracking) for 1 kg of product (PlasticsEurope, 2012). When considering also the
extraction of resources, production processes and transportation, the total primary energy
demand for 1 kg of product is equal to 22.4 MJ for ethylene and 23.8 MJ for propylene
(PlasticsEurope, 2012). As it will be showed in the next sections, the production of ethylene
and propylene from steam cracking is significantly more energy-intense and carbon-intense
than the polymerization process. More information can be found in the MIDDEN reports
about steam cracking processes and the relative decarbonisation options (Wong & Van Dril,
2020).

2.3      Low-Density Polyethylene
Low-Density Polyethylene (LDPE) is a low crystalline and high amorphous polymer with an
average density of 0.91-0.94 g/cm3 and a melting point of 105-115°C. It is composed by
4,000-40,000 carbon atoms with a high degree of short and long side-chain branching
(Omnexus, 2020a), as shown in Figure 6.

Figure 6 LDPE structure with the main carbon chain in black and the side branches
in blue and red (Graziano, Jaffer, & Sain, 2019).

                                                                   A MIDDEN report – PBL – TNO | 17
2.3.1 High-pressure polymerisation process LDPE is produced through high-pressure polymerisation, which is a very standardized process following the steps shown in Figure 7. Figure 7 LDPE high-pressure polymerisation process scheme. Made with information from (European Commission, 2007; PlasticsEurope, 2014a; SABIC Limburg, 2020). After compressing the gaseous ethylene to 20-30 MPa together with the unreacted gas of previous cycles, the polymerisation take place in an autoclave reactor, operating with a temperature of 180-300°C and pressure of 100-250 MPa, or in a tubular reactor as is used by SABIC Limburg, operating with a temperature of 140-340°C and a pressure of 200-350 MPa (European Commission, 2007). The specific figures for Sabic are 250 ºC and 240 MPa. LDPE polymerisation usually requires the use of initiators, namely oxygen or organic peroxides with a mass fraction concentration of 0.1-0.5%, and sometimes the use of polar modifiers (e.g. ketones) or aliphatic hydrocarbons to influence the molecular weight distribution (PlasticsEurope, 2014a). The resulting polymer and unreacted gases are then separated in a high-pressure separator (15-30 MPa) and low-pressure separator (0.15 MPa), where the unreacted gases are recycled back into the process and part of the residual heat is recovered and used to produce steam (European Commission, 2007). As the polymerisation of ethylene is a highly exothermic process (3,300-3,600 J/g), the manufacture of LDPE is a net steam producer (Burdett & Eisinger, 2016). If required by the application of the product, specific additives (e.g. stabilizers or fire retardants) are added to the polymer melt to obtain the desired properties, and the polyethylene is then extruded into granules. Finally, the LDPE is dried, blended, and degassed to remove the residual ethylene before being transported to storage silos or packed and sent to the costumers (European Commission, 2007). 2.3.2 Energy and material demand In 1999, the European average energy demand for LDPE production was equal to 3.9 MJ/kg of direct energy, or 9.4 MJ/kg of primary energy (assuming an efficiency of 40% for electricity and 90% for steam), while the average of the top 50% companies was equal to 2.6 MJ/kg of direct energy, or 7.5 MJ/kg of primary energy (European Commission, 2007). More than one decade later, the values are not so different, as in 2014 the production of LDPE still required an average of 7.9 MJ/kg of primary energy (assuming an efficiency of 40% for electricity and 90% for steam). As shown in Table 9, the polymerisation of 1 kg of PBL – TNO | 18 – A MIDDEN report
LDPE causes the emission of 0.32 kg of CO2-eq, considering the Global Warming Potential
(GWP) for 100 years.

Table 9 Energy demand and global warming potential (GWP) for the polymerisation
of 1 kg of LDPE. Average values from literature (PlasticsEurope, 2014a) and
internal communication with the companies involved.

        Product         Electricity demand       Steam demand                 GWP
         [1 kg]                 [MJ]                 [MJ]                  [kg CO2-eq]
         LDPE                   3.43                   -0.29                    0.32

As explained in the previous section, the value for steam demand is negative because LDPE
polymerisation is a net producer of heat, which is recovered and used for other processes
(European Commission, 2007). If the boundaries of the life-cycle analysis are extended to
the extraction of fossil and mineral resources, the production of raw materials (e.g.
monomers and solvent), and the production of electricity, the primary energy demand for
the production of 1 kg LDPE is equal to 82.9 MJ and the emissions are equal to 1.87 kg of
CO2-eq (PlasticsEurope, 2014a). Regarding the input materials, 1 kg of LDPE required 1.02
kg of monomer in 1999 (European Commission, 2007), and the value was unchanged in
2014 (PlasticsEurope, 2014a), showing no improvement in the efficiency of the process.

2.4      Linear Low-Density Polyethylene
Low-Density Polyethylene (LDPE) is a semi-crystalline polymer with an average density of
0.91-0.94 g/cm3 and a melting point of 105-115°C. It has a linear structure with short and
uniform side-chain branches (Omnexus, 2020a), as shown in Figure 8:

Figure 8 LLDPE structure with the main carbon chain in black and the side branches
in blue (Graziano et al., 2019).

2.4.1    Solution polymerisation process

LLDP can be produced through a solution process (which is also used to produce HDPE) or a
gas phase process (which is also used to produce HDPE and PP). In the solution process, the
ethylene is diluted with the co-monomer (such as hexene-1 and octene-1) and a
hydrocarbon solvent in the range of C6 to C9, which are all purified by passing throughout
beds of absorbent material (European Commission, 2007). As catalyst, both Zieglar-Natta
and Metallocene-types can be applied (PlasticsEurope, 2014a). The solution is then sent to
the polymerisation reactor, which operates at a temperature higher than 100°C and with
pressure up to 20 MPa (European Commission, 2007). The unreacted ethylene and the
residual solvent are separated by the evaporator, then the polymer passes through the
standard steps of extrusion (including the addition of additives), drying, blending,
degasification, and storage (European Commission, 2007), as shown in Figure 9.

                                                                 A MIDDEN report – PBL – TNO | 19
Figure 9 LLDPE solution polymerisation process scheme. Made with information
from (European Commission, 2007; PlasticsEurope, 2014a; SABIC Limburg, 2020).
2.4.2 Energy and material demand
In 1999, the European average energy demand for LLDPE production was equal to 2.4 MJ/kg
of direct energy, or 4.1 MJ/kg of primary energy (assuming an efficiency of 40% for
electricity and 90% for steam), while the average of the top 50% companies was equal to
2.1 MJ/kg of direct energy, or 2.9 MJ/kg of primary energy (European Commission, 2007).
More than one decade later, the values are not so different, as in 2014 the production of
LLDPE still required an average of 3.9 MJ/kg of primary energy (assuming an efficiency of
40% for electricity and 90% for steam). As shown in Table 10, the polymerisation of 1 kg of
LLDPE causes the emission of 0.27 kg of CO2-eq, considering the Global Warming Potential
(GWP) for 100 years.
Table 10 Energy demand and global warming potential for the polymerisation of 1
kg of LLDPE. Average values from literature (PlasticsEurope, 2014a) and internal
communication with the companies involved.
Product Electricity demand Heat demand GWP
[MJ] [MJ] [kg CO2-eq]
LLDPE (1 kg) 1.27 0.69 0.23
If the boundaries of the life-cycle analysis are extended to the extraction of fossil and
mineral resources, the production of raw materials (e.g. monomers and solvent), and the
production of electricity, the primary energy demand for the production of 1 kg LLDPE is
equal to 79.2 MJ and the emissions are equal to 1.87 kg of CO2-eq (PlasticsEurope, 2014a).
Regarding the input materials, 1 kg of LLDPE required 1.03 kg of monomer in 1999
(European Commission, 2007) and 1.02 kg of monomer in 2014 (PlasticsEurope, 2014a),
showing a small improvement in the efficiency of the process.
2.5 High-Density Polyethylene
High-Density Polyethylene (HDPE) is a high crystalline and low amorphous polymer with an
average density of 0.94-0.97 g/cm3 and a melting point of 120-140°C. It has a linear
structure with a low degree of short side-chain branches (Omnexus, 2020a), as shown in
Figure 10.
PBL – TNO | 20 – A MIDDEN reportFigure 10 HDPE structure with the main carbon chain in black and the side
branches in blue (Graziano et al., 2019)
2.5.1 Suspension/slurry polymerisation process
HDPE is mainly produced through a suspension/slurry process (which is also used to produce
PP), but also through a solution process (which is also used to produce LLDPE) or a gas
phase process (which is also used to produce LLDPE and PP). Moreover, two different
reactors can be applied in the suspension/slurry process: a stirred tank reactor (STR) or a
loop reactor (PlasticsEurope, 2014a). The flow diagram for HDPE production using a
suspension process and a STR is shown in Figure 11.
Figure 11 HDPE suspension/slurry polymerisation process scheme. Made with
information from (European Commission, 2007; PlasticsEurope, 2014a; SABIC
Limburg, 2020).
The process starts with the purification and the mixing of the reagents: beside the ethylene
as main feedstock, HDPE also requires a co-monomer (such as butene-1 or hexene-1), a
catalyst (usually Ziegler-Natta organo-metallic compounds), and a solvent in the C5-C8
hydrocarbon group (PlasticsEurope, 2014a). If the loop reactor is used, Philips and
Metallocene catalysts can also be applied, coupled with isobutane as solvent (European
Commission, 2007). The mixture is fed to the reactor, which operates under 80-90°C and
0.5-1 MPa conditions. The resulting polymer is insoluble and precipitates in a fine suspension
that can be separated from the solvent by centrifugation (PlasticsEurope, 2014a). The
concentration of HDPE in the slurry is dependent on many process parameters, but generally
it ranges between 30 and 45% by weight (European Commission, 2007). After the
centrifuge, the polymer faces the standard steps of extrusion in granules (including the
addition of additives to obtain the desired properties), drying, blending, degasification of
residual monomer, and storage in silos (PlasticsEurope, 2014a; SABIC Limburg, 2020).
A MIDDEN report – PBL – TNO | 212.5.2 Energy and material demand
In 1999, the European average energy demand for HDPE production was equal to 2.5 MJ/kg
of direct energy, or 5.1 MJ/kg of primary energy (assuming an efficiency of 40% for
electricity and 90% for steam), while the average of the top 50% companies was equal to
2.1 MJ/kg of direct energy, or 4.2 MJ/kg of primary energy (European Commission, 2007).
More than one decade later, the values are not so different, as in 2014 the production of
HDPE still required an average of 5.4 MJ/kg of primary energy (assuming an efficiency of
40% for electricity and 90% for steam). As shown in Table 11, the polymerisation of 1 kg of
HDPE causes the emission of 0.27 kg of CO2-eq, considering the Global Warming Potential
(GWP) for 100 years.
Table 11 Energy demand and global warming potential for the polymerisation of 1
kg of HDPE. Average values from literature (PlasticsEurope, 2014a) and internal
communication with the companies involved.
Product Electricity demand Heat demand GWP
[MJ] [MJ] [kg CO2-eq]
HDPE (1 kg) 1.55 1.34 0.27
If the boundaries of the life-cycle analysis are extended to the extraction of fossil and
mineral resources, the production of raw materials (e.g. monomers and solvent), and the
production of electricity, the primary energy demand for the production of 1 kg HDPE is
equal to 80.2 MJ and the emissions are equal to 1.80 kg of CO2-eq (PlasticsEurope, 2014a).
Regarding the input materials, 1 kg of HDPE required 1.03 kg of monomer in 1999
(European Commission, 2007) and 1.02 kg of monomer in 2014 (PlasticsEurope, 2014a),
showing a small improvement in the efficiency of the process.
2.6 Polypropylene
Polypropylene (PP) is a semi-crystalline and low amorphous polymer with an average density
of 0.90-0.91 g/cm3 and a melting point of 210-290°C (BPF, 2020). It has a linear structure
with a low degree of unsaturation, and thus of short side-chain branches, as shown in Figure
12.
Figure 12 PP structure with the main hydrocarbon chain in white and the methyl
groups in black (BPF, 2020).
2.6.1 Gas phase polymerisation process
PP can be produced with a gas phase process (which is also used to produce LLDPE and
HDPE) or with a suspension/slurry process (which is also used to produce HDPE). In the gas
phase process, the first step is to mix and compress the gaseous propylene, co-monomer,
hydrogen and catalyst together before sending them in a steady flow to the polymerisation
reactor under 2-4 MPa and 70-90°C conditions (European Commission, 2007). For many
PBL – TNO | 22 – A MIDDEN reportcompanies adopting the Borstar loop-reactor or Unipol II fluidised bed reactor technologies,
it has become common to have a setup of two or more reactor in sequence. This so-called
multistage configuration increases the capital cost of the production line, but adds flexibility
and widens the portfolio of produced polyolefins (Kanellopoulos & Kiparissides, 2019). For PP
production, catalysts based on titanium and aluminium are usually chosen, including Ziegler-
Natta, Phillips-types, and Metallocene-types (PlasticsEurope, 2014b). The resulting polymer
powder is extracted at the bottom of the reactor and moved to a degassing vessel to
deactivate the catalyst and remove the residual feedstock, which is cooled and recycled back
into the cycle (PlasticsEurope, 2014b), as seen in Figure 13.
Figure 13 PP gas phase polymerisation process scheme. Made with information
from (European Commission, 2007; PlasticsEurope, 2014b; SABIC Limburg, 2020).
The resulting PP is sent to the granule extruder, where the necessary additives are also
added to the polymer mix. Finally, the product faces the standard steps of drying, blending,
degasification of the residual monomer and storage in silos (European Commission, 2007).
2.6.2 Energy and material demand
The European average energy demand for PP production was not reported in 1999, but it
could be considered equivalent to comparable HDPE processes, which had an average
consumption of 5.1 MJ/kg of primary energy (European Commission, 2007). More than one
decade later, the value seems to have improved, as in 2014 the production of PP required an
average of 3.8 MJ/kg of primary energy (assuming an efficiency of 40% for electricity and
90% for steam). As shown in Table 12, the polymerisation of 1 kg of PP causes the emission
of 0.20 kg of CO2-eq, considering the Global Warming Potential (GWP) for 100 years, making
PP more environmentally friendly than LDPE, LLDPE, and HDPE.
Table 12 Energy demand and global warming potential for the polymerisation of
PP. Average values from literature (PlasticsEurope, 2014b) and internal
communication with the companies involved.
Product Electricity demand Heat demand GWP
[MJ] [MJ] [kg CO2-eq]
PP (1 kg) 1.29 0.59 0.20
A MIDDEN report – PBL – TNO | 23If the boundaries of the life-cycle analysis are extended to the extraction of fossil and
mineral resources, the production of raw materials (e.g. monomers and solvent), and the
production of electricity, the primary energy demand for the production of 1 kg PP is equal to
77.9 MJ and the emissions are equal to 1.63 of CO2-eq (PlasticsEurope, 2014b). Regarding
the input materials, 1 kg of PP required 1.03 kg of monomer in 1999 (European Commission,
2007) and 1.02 kg of monomer in 2014 (PlasticsEurope, 2014b), showing a small
improvement in the efficiency of the process.
2.7 Recap of energy demand and carbon emissions
Considering only the energy demand relative to the polymerisation of the polyolefins (LDPE,
LLDPE, HDPE, and PP), the primary energy demand and greenhouse gases emissions are
shown in Table 13. The energy and the emissions of CO2-eq relative to the production of the
input monomers and other raw materials are thus excluded from the analysis, as explained
in the previous sections of this chapter.
Table 13 Energy demand and GHG emissions for the polymerisation of 1 kg of LDPE,
LLDPE, HDPE, and PP. Average from PlasticsEurope EcoProfiles (PlasticsEurope,
2014a, 2014b) and internal communication with SABIC, Dow and Ducor.
GHG
Polymerisation Electricity Heat demand
Product emissions
process demand [MJ] [MJ]
[kg CO2-eq]
LDPE (1 kg) High pressure 3.43 -0.29 0.32
LLDPE (1 kg) Solution 1.27 0.69 0.23
HDPE (1 kg) Suspension/slurry 1.55 1.34 0.27
PP (1kg) Gas phase 1.29 0.59 0.20
As seen in the table, LDPE has the highest energy requirements and GHG emissions, while PP
is the product with the smallest environmental impact.
PBL – TNO | 24 – A MIDDEN report3 Polyolefins products
and application
3.1 General overview
In 2018, plastic production reached 360 million tonnes globally and 60 million tonnes in
Europe, of which almost 80% was consumed by the six largest European countries
(Germany, Italy, France, Spain, United Kingdom, and Poland) and the Benelux countries
(Belgium, Netherlands, and Luxembourg) (PlasticsEurope, 2019). Despite the existence of
dozens of plastic types, Figure 14 shows how almost half of the European consumptions
consists just of PE and PP, which are used especially for packaging, building and
construction, and the automotive industry.
Others PP
25% 19%
PET
8%
PE
30%
PUR
8%
PVC
10%
Figure 14 Distribution of European plastic demand in 2018, based on data from
(PlasticsEurope, 2019).
In The Netherlands, the annual demand for plastics is equal to 2.2 million tonnes, and
around 32% of the post-consumer plastic waste is recycled, while the remaining part is
burned in energy recovery plants (PlasticsEurope, 2019).
Packaging is the biggest sector overall, and although plastics account for only 18% of all
packaging materials (by weight) in The Netherlands, it makes up 43% of the total revenue,
which was over 6 billion euros in 2016 (ABN AMRO, 2017).
In the following sections the properties and applications of the different polyolefins will be
discussed. The main physical properties that determine the field of application of these
plastics are:
A MIDDEN report – PBL – TNO | 25• Density: the ratio between the mass and the volume of the material, it is measured
in g/cm3 or in kg/m3.
• Tensile yield strength: the stress a material can withstand without permanent
deformation, it is measured in MPa or in N/mm2.
• Shore hardness (D scale): it measures the resistance of a material to be
penetrated by an indenter, it goes from 0 (softest) to 100 (hardest).
• Continuous service temperature: the maximum temperature (measured in
Celsius) above which the mechanical properties of the material degrade significantly.
3.2 Low-Density Polyethylene
3.2.1 Product characteristics
Low-Density Polyethylene (LDPE) is a flexible and translucent plastic with good resistance to
electricity and chemicals like alcohols, acids, and dilute alkalis (Omnexus, 2020a). Table 14
shows an overview of the physical properties of LDPE.
Table 14 Density, tensile yield strength, shore hardness and maximum continuous
service temperature (CST) of low-density polyethylene (Omnexus, 2020b).
Density Tensile yield Shore hardness Max CST
(g/cm3) strength (MPa) (D scale) (°C)
0.92-0.94 10-20 40-50 80-100
Although it is susceptible to stress cracking and it cannot sustain high temperatures, its low
cost, light weight and transparency make LDPE a very good material to manufacture
containers and bags by using extrusion or injection moulding (Omnexus, 2020a). A practical
application of LDPE is shown in Figure 15:
Figure 15 Blown film extruded low-density polyethylene bags (LDPE Bags, 2020).
3.2.2 Main applications
LDPE and LLDPE together make 17.5% of the plastics demand in Europe, for a total of 8.96
million tonnes (PlasticsEurope, 2019). Assuming the ratio is the same in The Netherlands,
the volume of LDPE and LLDPE would be equal to 385,000 tonnes. Considering a price
between 0.98 and 1.08 €/kg for LDPE (PlasticPortal, 2020), the Dutch market would be
worth 375-515 million euros per year.
PBL – TNO | 26 – A MIDDEN reportLDPE is used especially in the packaging sector (single use food film, reusable bags and
containers), agriculture sector (single use agricultural film), building and construction sector,
and it is marginally used in the electrical and automotive sectors (PlasticsEurope, 2019). The
shares of low-density polyethylene in each sector in The Netherlands are shown in Figure 16.
Figure 16 Thousands of LDPE/LLDPE tons used by the main economic sectors in
The Netherlands. Made with estimates from European data extracted from
(PlasticsEurope, 2019).
3.3 Linear Low-Density Polyethylene
3.3.1 Product characteristics
Linear low-Density Polyethylene (LLDPE) is a flexible and translucent plastic with high impact
strength resistance and good resistance to water and chemicals such as alcohols (Omnexus,
2020a). Table 15 shows the main physical properties of LLDPE.
Table 15 Density, tensile yield strength, shore hardness and maximum continuous
service temperature (CST) of linear low-density polyethylene (Omnexus, 2020b).
Density Tensile yield Shore hardness Max CST
(g/cm3) strength (MPa) (D scale) (°C)
0.92-0.95 10-30 55-65 90-110
Just like LDPE, LLDPE has light weight and low production cost. The most common
manufacturing process in extrusion (e.g. for blow and cast films), but injection and roto-
moulding can also be used (Omnexus, 2020a). Moreover, LLDPE sheets are physiologically
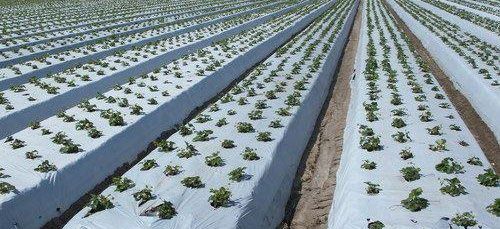
harmless, making it the perfect material for food packaging and agricultural film, as shown in
Figure 17.
A MIDDEN report – PBL – TNO | 27Figure 17 Linear low-density polyethylene agricultural film (Mulch Film, 2020). 3.3.2 Main applications LDPE and LLDPE together make 17.5% of the plastics demand in Europe, for a total of 8.96 million tonnes (PlasticsEurope, 2019). Assuming the ratio is the same in The Netherlands, the volume of LDPE and LLDPE would be equal to 385,000 tonnes. Considering a price of 1.01 €/kg for LLDPE (PlasticPortal, 2020), the Dutch market would be worth around 390 million euros per year. LLDPE is used especially in the packaging sector (single use food film, reusable bags and containers) and agriculture sector (single use agricultural film), with marginal use in the building and construction sector (PlasticsEurope, 2019). The shares of LLDPE in each sector are shown in Figure 18. Figure 18 Thousands of LDPE/LLDPE tons used by the main economic sectors in The Netherlands. Made with estimates from European data extracted from (PlasticsEurope, 2019). PBL – TNO | 28 – A MIDDEN report
3.4       High-Density Polyethylene
3.4.1     Product characteristics

High-density polyethylene (HDPE) is a flexible and translucent plastic with excellent
resistance to electricity and solvents, and good resistance to heat, alcohols, dilute acids and
alkalis (Omnexus, 2020a). Table 16 shows an overview the main physical properties.

Table 16 Density, tensile yield strength, shore hardness and maximum continuous
service temperature (CST) of high-density polyethylene (Omnexus, 2020b).

        Density             Tensile yield          Shore hardness               Max CST
        (g/cm3)            strength (MPa)             (D scale)                  (°C)
        0.94-0.97                25-30                   60-70                   100-120

HDPE is usually processed by injection moulding, extrusion, roto-moulding, and blow
moulding. This grade of PE is heavier, sturdier, harder and can resist to higher temperatures
than both LDPE and LLDPE, making it suitable for rigid packaging, household and consumer
goods, fibres, textiles, pipes and fittings (Omnexus, 2020a). Practical applications of HDPE
are shown in Figure 19 and Figure 20.

Figure 19 Example of blow moulded high-density polyethylene bottles (Indiamart,
2020).

Figure 20 Example of high-density polyethylene corrosion resistant pipes (Acme
Plastics, 2020).

                                                                    A MIDDEN report – PBL – TNO | 29
You can also read