DON'T STOP BELIEVIN' THE SCOTTMADDEN ENERGY INDUSTRY UPDATE - Volume 18 - Issue 2

Page created by Kevin Watkins
 
CONTINUE READING
DON'T STOP BELIEVIN' THE SCOTTMADDEN ENERGY INDUSTRY UPDATE - Volume 18 - Issue 2
DON’T STOP BELIEVIN’
THE SCOTTMADDEN ENERGY INDUSTRY UPDATE

                            Volume 18 - Issue 2
DON'T STOP BELIEVIN' THE SCOTTMADDEN ENERGY INDUSTRY UPDATE - Volume 18 - Issue 2
2   SCOTTMADDEN, INC. | TABLE OF CONTENTS

TABLE OF
CONTENTS

04      View from the Executive Suite                               57   Clean Tech and Environment
        05 Executive Summary: Don’t Stop Believin’                       58 Solar Plus Storage: System Configuration Impacts
                                                                            Operational Flexibility and Economic Value
        06 Mergers and Acquisitions: The Deals Keep Coming

13      Energy Supply, Demand, and Markets                          63   The Industry in Charts
                                                                         64 The Energy Industry: By the Numbers
         14 Efficient Electrification: The Electric Industry Sees
            a Growth Opportunity

        22 Liquefied Natural Gas: Exports Begin Reshaping           66   Recent Insights: Available at scottmadden.com
           Both Domestic and International Markets

                                                                    67   Energy Practice: ScottMadden Knows Energy
29      Infrastructure and Technology
        30 Electric Vehicles: Time for Utility Engagement and
           Planning

        36 Power Transmission: Much Planned, but Tailwinds
           Are Abating

        42 Gas Pipelines: Projects Proceed, but Resistance
           Remains

49      Rate and Regulatory Issues
        50 Grid Modernization: States and Utilities Test the
           Waters
DON'T STOP BELIEVIN' THE SCOTTMADDEN ENERGY INDUSTRY UPDATE - Volume 18 - Issue 2
View from the
Executive Suite
DON'T STOP BELIEVIN' THE SCOTTMADDEN ENERGY INDUSTRY UPDATE - Volume 18 - Issue 2
EXECUTIVE SUMMARY DON’T STOP BELIEVIN’ | SCOTTMADDEN, INC.     5

  EXECUTIVE SUMMARY
  DON’T STOP BELIEVIN’
Belief (noun): “the feeling that something is real and true; trust; confidence”
Believe in (phrasal verb): “to have faith in the existence of; to feel sure of the value or worth of”

A strong domestic economy, evolving regulations and policies, continued technology development, and ongoing interest in developing new energy
resources are shaping the energy landscape. Energy and utility companies are pursuing growth and are developing and modernizing needed infrastructure
while being responsive to stakeholders with disparate interests and concerns.

The theme, “Don’t Stop Believin’,” characterizes customer and regulator interest in reliable and reasonably priced energy, environmental objectives for
fewer emissions from energy resources, and utilities’ goals of growth and bolstering the energy ecosystem. However, with so many “believers”—energy
companies and other stakeholders—there are bound to be frictions, which are showing up across the energy ecosystem.

In this issue of The ScottMadden Energy Industry Update, we look at some of the emerging and continuing trends in the industry, helping energy and
utility industry leaders move from “believin’” to realization.

                                             Some Highlights of This ScottMadden Energy Industry Update

                 ∙∙ Companies across the gas and power value chains continue to entertain growth through both company and asset acquisitions, while recent
                   merger activity has been mostly characterized by a few large transactions
Believin’ in     ∙∙ With growing interest by some in decarbonizing the energy sector, both the electric sector and environmental communities are promoting
Growth             increasing electrification of activities historically fueled by carbon-based fuels, but the limits of electrification are still unclear
                 ∙∙ Electric vehicle sales forecasts get rosier each year, and while some electricity sales growth is expected along with those sales, where and when
                   charging occurs could create localized impacts where electric vehicle sales are concentrated

                 ∙∙ Utilities around the United States have been proposing and implementing grid modernization initiatives. Drivers of those efforts are varied:
                   replacing aging equipment, improving resilience, and preparing for increasing levels of distributed energy resources, potentially “Smart Grid 2.0”
Believin’ in       for the distribution system
the Grid
                 ∙∙ Federal policy toward infrastructure development is in flux. In power transmission, as FERC’s Order 1000 continues to play out, competitive
                   transmission continues to face hurdles, and FERC is re-examining financial incentives that have been in place for years

                 ∙∙ Driven by increasing supply, gas pipeline development has been continuing, although there has been active opposition to some projects.
                   Divergent opinions at a divided FERC on gas pipeline approval criteria could mean a more difficult path for investment
Believin’ in
Energy
                 ∙∙ U.S. and Canadian liquefied natural gas export capacity is growing and, along with North American production, appears poised to serve
                   increasingly more global gas demand
Resources
                 ∙∙ Solar photovoltaic (PV) power linked with battery energy storage is garnering attention as a way to manage temporal variations in solar output,
                   but how storage is configured and linked to the grid and to the PV system affects both value to the system owner and to the grid
DON'T STOP BELIEVIN' THE SCOTTMADDEN ENERGY INDUSTRY UPDATE - Volume 18 - Issue 2
6     SCOTTMADDEN, INC. | MERGERS AND ACQUISITIONS THE DEALS KEEP COMING

  MERGERS AND ACQUISITIONS
  THE DEALS KEEP COMING
Energy and utility companies place some measured bets to grow their business.

Merger Activity Continues, But No Boom
 ∙∙ North American energy and utility industry merger activity continues at a measured pace,
     reflecting both strategic ambitions and relatively high valuations
 ∙∙ A few large mega-deals accounted for significant aggregate deal value both in the utilities
     sector as well as gas midstream and upstream sectors
 ∙∙ Despite still relatively low interest rates, increasing clarity on federal tax policy, particularly
     additional capital needs to offset write-downs of deferred tax assets, may also be a factor in
     slower transactional activity
 ∙∙ Corporate deal activity overall has been roughly on par with the same period in 2017, but
     aggregate announced deal value for larger (>$100M) deals year-to-date is $32B compared
     with Q1–Q3 2017 of more than $64B
 ∙∙ Larger asset deal activity has been greater in YTD 2018 compared with Q1–Q3 2017, totaling
     $17B versus $9B, largely for acquisition of both renewable and thermal generation
DON'T STOP BELIEVIN' THE SCOTTMADDEN ENERGY INDUSTRY UPDATE - Volume 18 - Issue 2
MERGERS AND ACQUISITIONS THE DEALS KEEP COMING | SCOTTMADDEN, INC.                     7

                                                        Utility, IPP, and Renewable Asset Transactions ($100M+)
                                                                            (Q3 2015–Q3 2018)                                                                 KEY TAKEAWAYS
                                           14                                                                                $12,500
                                                                                                                                                               Merger and acquisition
                                           12                                                                                                                  activity continues, but
                                                                                                                             $10,000
                                                                                                                                                               it has been dominated
                  Number of Transactions

                                                                                                                                       Aggregate Value ($M)
                                           10                                                                                                                  recently by a few mega-
                                                                                                                             $7,500
                                                                                                                                                               deals
                                            8

                                            6
                                                                                                                             $5,000

                                            4
                                                                                                                             $2,500
                                            2                                                                                                                  Further oil and gas
                                                                                                                                                               consolidation, especially
                                            0                                                                                $0                                in the upstream sector,
                                                Q3   Q4     Q1    Q2    Q3   Q4    Q1    Q2      Q3   Q4    Q1    Q2    Q3
                                                                                                                                                               is expected as smaller
                                                 2015               2016                  2017                   2018                                          players in high-cost basins
  Number of
Transactions                                                                                                                                                   seek to exit
  Aggregate
 Transaction
  Value ($M)
                                                 Utility, IPP, and Renewable Whole Company Transactions ($100M+)
                                                                         (Q3 2015–Q3 2018)
                                           6                                                                                 $80,000
                                                                                                                                                               Utilities face near-term
                                                                                                                                                               balance sheet challenges,
                                           5
                                                                                                                                                               rising interest rates, and
                Number of Transactions

                                                                                                                             $60,000                           an evolving regulatory

                                                                                                                                       Aggregate Value ($M)
                                           4                                                                                                                   environment, which
                                                                                                                                                               may keep mergers and
                                           3                                                                                 $40,000                           acquisitions to a measured
                                                                                                                                                               pace

                                           2
                                                                                                                             $20,000
Note: Q3 2018                              1
through early
August
                                           0                                                                                 $0
Source: S&P                                     Q3   Q4     Q1    Q2    Q3   Q4    Q1    Q2      Q3   Q4    Q1    Q2    Q3
Global Market
Intelligence                                     2015               2016                  2017                   2018
DON'T STOP BELIEVIN' THE SCOTTMADDEN ENERGY INDUSTRY UPDATE - Volume 18 - Issue 2
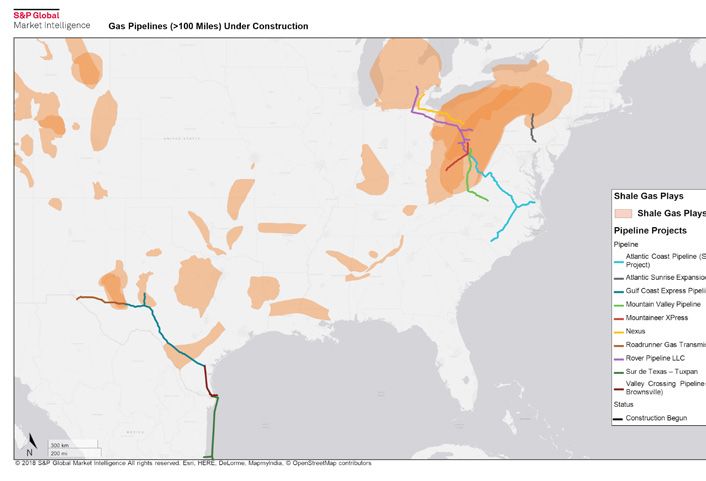
8     SCOTTMADDEN, INC. | MERGERS AND ACQUISITIONS THE DEALS KEEP COMING

                      Selected Significant Proposed Energy and Utility Merger and Acquisition Transactions Since January 2017
                                                                                                                                                    Announced/       Transaction
               Acquiror                    Seller                     Target                         Target Sector           Target Region
                                                                                                                                                      Closed            Value*
                                                                                                                                                    May 21, 2018/
NextEra Energy                         Southern Co.               Gulf Power Co.           Electric utility                    Southeast                                $5.66B
                                                                                                                                                       Pending
                                                                   Pivotal Utility                                                                  May 21, 2018/
NextEra Energy                         Southern Co.                                        Gas utility                   Southeast, Mid-Atlantic                        $0.53B
                                                                   Holdings, Inc.                                                                    July 29, 2018
                                       Pivotal Utility       Elkton Gas, Elizabethtown                                                              Oct. 16, 2017/
South Jersey Industries, Inc.                                                              Gas utility                        Mid-Atlantic                              $1.7B
                                       Holdings, Inc.             Gas companies                                                                      July 1, 2018
                                                                 Energy Transfer           Oil & gas                                                 Aug. 1, 2018/
Energy Transfer Equity, L.P.                                                                                                    National                               $66.14B
                                                                  Partners, L.P.           midstream                                                   Pending
                                    Discovery Midstream            TPG Capital             Oil & gas                     Denver-Julesberg Basin     July 30, 2018/
Investor group                                                                                                                                                          $1.17B
                                        Partners, LLC            Management, L.P.          midstream                          (Colorado)               Pending
                                                          Trans Mountain pipeline system   Oil & gas                                                May 29, 2018/
Government of Canada                Kinder Morgan, Inc.                                                                     Western Canada                              $3.46B
                                                                & expansion project        midstream                                                   Pending
                                                                 Enbridge Energy           Oil & gas                                                May 17, 2018/
Enbridge Inc.                                                                                                           Midwest, Upper Midwest                         $13.92B
                                                                  Partners, L.P.           midstream                                                   Pending
                                                                  South Central                                              South-central           Feb. 7, 2018/
Cleco Corporate Holdings, LLC        NRG Energy, Inc.                                      Electric utility                                                             $1.0B
                                                                 Generating, LLC                                            Mississippi Valley         Pending
Global Infrastructure Management,                                NRG’s renewable           Independent                                               Feb. 7, 2018/
                                     NRG Energy, Inc.                                                                           National                                $8.08B
LLC                                                              energy business           power producers                                             Pending
                                                                                           Independent                                              Oct. 30, 2017/
Vistra Energy Corp.                                                Dynegy Inc.                                                  National                               $10.39B
                                                                                           power producers                                           Apr. 9, 2018
                                                                                           Oil & gas                         Permian Basin          Aug. 14, 2018/
Diamondback Energy, Inc.                                          Energen Corp.                                                                                         $9.25B
                                                                                           production                     (Texas, New Mexico)          Pending
                                                                                           Combination                                              Apr. 23, 2018/
CenterPoint Energy, Inc.                                       Vectren Corporation                                              Midwest                                 $8.13B
                                                                                           utility                                                     Pending
                                                                                           Combination                                               Jan. 3, 2018/
Dominion Energy, Inc.                                          SCANA Corporation                                               Southeast                               $14.35B
                                                                                           utility                                                     Pending
                                                                   Oncor Electric                                                                   Aug. 21, 2017/
Sempra Energy                                                                              Electric utility                      Texas                                 $16.48B
                                                              Delivery Company, LLC                                                                  Mar. 9, 2018
                                                                Connecticut Water                                                                    Apr. 5, 2018/
Eversource Energy                                                                          Water utility                       Northeast                                $0.77B
                                                                   Service, Inc.                                                                       Pending
                                                                                           Independent                                              Aug. 18, 2017/
Investor group                                                 Calpine Corporation                                              National                               $16.49B
                                                                                           power producers                                           Mar. 8, 2018
                                                                                                                                                    July 19, 2017/
Hydro One Limited                                               Avista Corporation         Electric utility                Pacific Northwest                            $5.3B
                                                                                                                                                       Pending
                                                                                           Gas utility; oil &                                        Feb. 1, 2017/
ONEOK, Inc.                                                    ONEOK Partners, L.P.                                       Central United States                        $16.84B
                                                                                           gas midstream                                            Jun. 30, 2017
                                                                                                                                                    Jan. 25, 2017/
AltaGas Ltd.                                                    WGL Holdings, Inc.         Gas utility                        Mid-Atlantic                              $6.9B
                                                                                                                                                     July 6, 2018

Notes: *Information as of late August 2018; **Purchase price plus assumed debt                                       Sources: S&P Global Market Intelligence; ScottMadden research
DON'T STOP BELIEVIN' THE SCOTTMADDEN ENERGY INDUSTRY UPDATE - Volume 18 - Issue 2
MERGERS AND ACQUISITIONS THE DEALS KEEP COMING | SCOTTMADDEN, INC.                      9

Different Sectors, Different Drivers
 ∙∙ Merger activity is being pursued in different sectors for varying                                               Price Change of Selected Stock Indexes
   reasons                                                                                                               (Dec. 30, 2016–Sept. 21, 2018)
 ∙∙ For electric investor-owned utilities, rationales include:                             40

     -- Rebalancing the business portfolio
                                                                                           30
     -- Broadening the territorial footprint
     -- Strengthening the balance sheet by monetizing assets                               20
     -- Expanding into the renewables sector

                                                                        Price Change (%)
     -- Making measured bets in areas such as technology                                    10

 ∙∙ Some large midstream acquisitions have been driven by an
   interest in simplifying and restructuring existing master limited                         0
   partnership (MLP) arrangements, which had been seen as
   undervalued                                                                             -10
    -- Simplification permits sponsors to return cash to MLP unit
      holders                                                                              -20
    -- In addition, cash payouts formerly payable to general
      partners can now be used for business reinvestment                                   -30
                                                                                             Jan ‘17      Apr ‘17      Jul ‘17   Oct ‘17   Jan ‘18       Apr ‘18     Jul ‘18   Sept ‘18
    -- Importantly, tax law changes reduced the attractiveness
      of MLPs as did FERC’s March 2018 decision not to permit                                          Dow Jones Utility         S&P 500             Pipelines and Midstream
      pipeline MLPs to recover income tax allowance in pipeline
                                                                                                                                              Source: S&P Global Market Intelligence
      cost-of-service rates, a decision that has since been eased
 ∙∙ Growth through regulated gas distribution utility exposure
   continues to be of interest (e.g., Alta Gas/WGL, CenterPoint/
   Vectren)
 ∙∙ In upstream gas (and oil), an emerging trend is for players in
   higher cost-per-acre plays like the Permian to seek opportunities
   for consolidation and cost reduction (e.g., Diamondhawk/
   Energen)
DON'T STOP BELIEVIN' THE SCOTTMADDEN ENERGY INDUSTRY UPDATE - Volume 18 - Issue 2
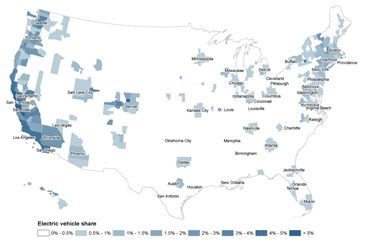
10    SCOTTMADDEN, INC. | MERGERS AND ACQUISITIONS THE DEALS KEEP COMING

Valuations
  ∙∙ For recent large, strategic transactions in                                            Electric and Gas Utility Price-Earnings Multiples
    the utility sector, announced deal values                                                      (Deals $50M+) (Q2 2015–Q2 2018)
    range from 1.3 to nearly 3.2 times book value,              45x
    implying idiosyncratic value opportunities for
                                                               40x
    some acquirors                                                                                                                                                                Electric
                                                                 35x                                                                                                              Utility
  ∙∙ Transaction multiples for electric utilities have
                                                               30x                                                                                                                Gas
    ticked down in 2018, while roughly holding
                                                                                                                                                                                  Utility
    steady for gas utility deals (see chart at right)            25x

  ∙∙ Overall, market valuations are not getting                20x
    cheaper with the Dow Jones Industrials trading                  15x
    recently near 19 times earnings, but large,
                                                                   10x                                                                                                      Source:
    diversified utilities’ trailing year price-earnings
                                                                                                                                                                            Pricewaterhouse
    ratios have fallen back below their five-year                        5x
                                                                                                                                                                            Coopers (citing
    average of 21.4, and price-to-book values hover                     0x                                                                                                  S&P Capital IQ)
    around their long-term average of 1.9 times                                     Q2    Q3    Q4        Q1   Q2   Q3    Q4   Q1        Q2   Q3      Q4     Q1   Q2

  ∙∙ A key question is whether financial overhang                                        2015                   2016                      2017                2018
    from tax law adjustments, pending Federal
    Reserve-driven interest rate increases, and an
    evolving regulatory environment will temper                                          SNL Energy Large Diversified Utility Index Price-to-Latest
    future deal activity                                                                   Twelve Months Earnings Ratio (Aug. 2013–Aug. 2018)

                                                                                  26x
  IMPLICATIONS
  While utility valuations are not exorbitant by
  historical standards, a better play for some                                    24x
  acquisitive utilities may be to look out for modest-
                                                               Price/TM EPS (X)

  sized deals—assets or companies—that round out
  the resource portfolio (e.g., renewables) or some                               22x
  regulatory or geographic diversification in the
  core business.
                                                                                  20x

Sources: The Wall Street Journal; S&P Global Market
Intelligence; industry news; company presentations;
PricewaterhouseCoopers; S&P Capital IQ; ScottMadden analysis                      18x
                                                                                                                                                                            Source:
                                                                                                                                                                            S&P Global
                                                                                                                                                                            Market
                                                                                  16x                                                                                       Intelligence
                                                                                                Jul ‘14         Jul ‘15        Jul ‘16             Jul ‘17        Jul ‘18
MERGERS AND ACQUISITIONS THE DEALS KEEP COMING | SCOTTMADDEN, INC.   11

   For more ScottMadden energy
insights visit our Insights Library:
       scottmadden.com/insights
Energy Supply,
     Demand,
  and Markets
14     SCOTTMADDEN, INC. | EFFICIENT ELECTRIFICATION THE ELECTRIC INDUSTRY SEES A GROWTH OPPORTUNITY

  EFFICIENT ELECTRIFICATION
  THE ELECTRIC INDUSTRY SEES A GROWTH OPPORTUNITY
Electrification could grow energy sales, but by how much?

A Working Definition                                                                                             Utility Electrification:
 ∙∙ Electrification is the process of switching from the combustion of non-electricity fuel            Examples for Selected Customer Segments
     (e.g., natural gas or propane) to using electricity to provide a comparable service
                                                                                                                        California’s regulated utilities were
 ∙∙ Electrification can affect most energy usage sectors (buildings, industrial, and                                    recently authorized to spend a
                                                                                                                        collective $738M to support the
     transportation), albeit to differing degrees                                                      Transportation
                                                                                                                        electrification of the transportation
 ∙∙ The Electric Power Research Institute (EPRI) recently prepared a national                                           sector through the installation of
                                                                                                                        electric vehicle supply equipment
     electrification estimate, selected results of which are outlined later
      -- The electrification of the transportation sector is widely seen as having the largest                          Dakota Electric Association and
        potential increase in electricity usage                                                                         Great Rivers Energy partnered
                                                                                                        Residential
                                                                                                                        with a homebuilder to install grid-
      -- Space and water heating are also seen as having a high electrification potential                               interactive electric water heaters
        but face potentially slower electric adoption, at least for retrofits, due to initial
        fixed costs (to purchase and install new equipment) and generally long useful lives                             Tennessee Valley Authority
                                                                                                         Industrial     incentivizes the switch from ICE
        of existing stock                                                                                               forklifts to electric forklifts
EFFICIENT ELECTRIFICATION THE ELECTRIC INDUSTRY SEES A GROWTH OPPORTUNITY | SCOTTMADDEN, INC.                15

Different Players, Different Interests in                      Some Hurdles to
Electrification                                                Electrification                                                               KEY TAKEAWAYS
 ∙∙ In the face of declining loads due to                        ∙∙ Environmental benefits of electrification depend upon
   efficiency gains and a less energy-intensive                     some key premises or assumptions: increasing energy                       EPRI believes that
   economy, electricity providers see                               efficiency (offsetting consumption growth) and a relatively               electrification of non-
   electrification as a source of increased load                    less carbon-intensive power production resource mix                       electric end uses is
 ∙∙ Environmental and climate change                             ∙∙ In addition to high fixed costs for space and water heating,              expected to increase
                                                                                                                                              electricity’s share of final
   advocates see environmental benefits                             low natural gas costs may impede adoption of electric
                                                                                                                                              energy from 21% today to
   from electrification, along with the                             technology applications, although relatively higher fuel
                                                                                                                                              32% to 47% of final energy
   decarbonization of electric generation, as a                     oil and propane prices (depending upon efficiencies) may
                                                                                                                                              in 2050
   key component for cost-effective reduction                       make some applications better candidates for conversion
   in global emissions                                           ∙∙ Location matters for some “electrified” applications, such
 ∙∙ Local governments are interested in                             as heat pumps, which have historically not performed as                   The transportation sector
   electrification (electric public transportation                  well in very cold climates (although there have been some                 has the highest and most
   and limits on non-electric vehicles) to                          efficiency improvements) and often require a supplemental                 immediate potential of
   reduce local air pollution                                       heat source                                                               electrification, while
                                                                                                                                              electricity could continue
                                                                                                                                              to displace natural gas in
                                       Residential Electrification Theory (AGA’s View)
                                                                                                                                              the buildings sector
       Theory – Using clean electricity to replace                                                              CO2 Emission Rates
  1    gas-fired technologies eliminates CO2 emissions                                                               by Fuel
                                                                                     CO2 Emissions
                                                                                                             Renewables/
                                                                                                               Nuclear
                                                                                                                                Coal          Grid planning and
                     Gas Furnace
  Natural Gas                                                    Electric                                                                     modernization will be
                     CO2 Emissions                              Heat Pump
  Distribution                            Residential                                                                                         especially critical for grid
    System                                  Load                                  Fossil Fuel Generation                    209 lb/MMBtu
                                                                                                              0 lb/MMBtu                      operators as electrification
                                                                                     No Emissions                                             is expected to change
                                                                                                               Natural
                                                                                                                                Oil
                                                                                                                Gas                           load profiles in addition to
                                                                Up to +350%
                      Up to 97%                                                                                                               increasing peak loads and
                                                                  efficient
                       efficient                                                                                                              load factors
                                                                                   Renewables/Nuclear                       160 lb/MMBtu
                                                                                       Generation            117 lb/MMBtu

        Fuel Use & Losses
                                                                       Transmission Losses         Generation Losses                          High upfront costs,
                                                                                                                                              low natural gas prices,
      Practice – Net benefit is a function of heat
                                                                                                                                              incumbency technology
  2   pump efficiency and associated emissions           3   The Equation                                                                     advantages, and
      profile of regional power grid                                                                                                          technological challenges
                                                              Heat pump            Required electricity     Generation requirements (MWh)     may prevent the
                                                              efficiency            input determines        and projected generation stack
                                                         determines required     associated generation         and dispatch determine         widespread electrification
                                                           electricity input      (MWh) requirements          resulting emissions output      of some applications

                                                                                                               Source: Adapted from AGA
16   SCOTTMADDEN, INC. | EFFICIENT ELECTRIFICATION THE ELECTRIC INDUSTRY SEES A GROWTH OPPORTUNITY

       Any electrification scenario depends upon assumptions about technology, prices, and behavioral responses.

                                      EPRI’s U.S. National Electrification Assessment: Key Points and Issues

            Findings and Scenario Results                    Assumptions                                            Issues to Consider

            ∙∙ Electricity growth: 32%           ∙∙ Natural gas price: $4/MMBtu                  ∙∙ Predicting fluctuations and trajectory of natural gas
              electricity growth between           natural gas price over next 30+                 prices is notoriously difficult
              2015 and 2050 (0.8%/                 years; higher ($6/MMBtu cost by
              year); compare 1.2% for              2050 in Transformation scenario
                                                                                                 ∙∙ Cost of electricity is a key variable and differs by
              Transformation scenario              yields more electrification)
                                                                                                   region, affecting electric adoption

            ∙∙ Energy: Overall energy            ∙∙ Carbon price: No carbon price                ∙∙ Space heating is highly dependent upon heat pump
              consumption (all fuels)              in base case; starts at $50/ton in
                                                                                                   performance improvements and availability of
              decreases by 22% by 2050             2020 in Transformation scenario
                                                                                                   relatively inexpensive power

            ∙∙ Transportation: Electric share    ∙∙ ICE vehicles efficiency: 50 miles            ∙∙ Upfront capital costs can be significant and may
              of transportation (rail, truck,      per gallon by 2050 for internal
                                                                                                   pose a barrier to retrofitting, although new stock
              bus) grows from 1% today to          combustion engines
                                                                                                   might be amenable to increased electric applications
              40% by 2050
                                                 ∙∙ VMTs: Electric vehicles comprise             ∙∙ Consumer behavior is uncertain and multi-faceted:
            ∙∙ Electric vehicles: Electric and     25% of vehicle miles traveled by
                                                                                                   price, incentives, inertia, income all play a role
              hybrid vehicles reach 40% of         2030, rising to 70% by 2050
              new vehicle sales by 2030
              and 75% by 2050                                                                    ∙∙ Role of mandates and incentives must be defined,
                                                 ∙∙ EV battery: Li-ion battery costs for           including any cost of greenhouse gas emissions, as
                                                   electric vehicles assumed to decline
                                                                                                   well as implications for utility rates and rate design
            ∙∙ Buildings: Heat pump space          to about $50/kWh by 2050
              heating grows from 15% of
              square footage today to 50%                                                        ∙∙ Interaction of increased power demand (time,
                                                 ∙∙ Generation fuel mix: Increasing                amount, location) and related gas demand may yield
              by 2050; increases driven by
                                                   shift from coal-fired to gas-fired
              growth in warmer climates                                                            unforeseen market outcomes
                                                   power generation (including carbon
              and availability of gas backup
                                                   capture and sequestration) and
              in colder climates
                                                   increased solar and wind                      ∙∙ Transition time is uncertain and may depend upon a
                                                                                                   technology adoption “tipping point”

                                                                                           Sources: EPRI Electrification Reference scenario; ScottMadden analysis

       A key question: How much work is performed using how much primary energy and producing how much in emissions?
EFFICIENT ELECTRIFICATION THE ELECTRIC INDUSTRY SEES A GROWTH OPPORTUNITY | SCOTTMADDEN, INC.                17

Gas Utilities May Have a Different View of Electrification, Especially for Residential Customers
 ∙∙ The American Gas Association (AGA) recently studied potential impacts of “policy-driven” electrification of the residential sector
 ∙∙ Their key conclusions are summarized below:
     -- Magnitude of emissions savings: With residential natural               -- Customer costs: Total energy costs for customers, including
                                  gas sector CO2 emissions less than 4% of total, payoff from                       incremental amortized appliance and grid costs, would increase
                                  electrification may be limited                                                    by 38% to 46%
                               -- Shifting emissions: Electrification will lead to higher power sector           -- Expensive GHG reduction: AGA’s analysis pegs GHG emissions
                                  emissions                                                                         reduction costs of $572 to $806 per metric ton, higher than other
                               -- Grid use changes: Changes in power use will lead to winter                        emissions reduction options
                                  peaks and higher grid utilization, which AGA says would require                -- Not addressed – gas distribution stranded costs: AGA’s analysis
                                  incremental grid and energy resource investment                                   did not look into cost implications of lower residential direct use
                                                                                                                    of gas (e.g., fixed-cost allocation to gas customers)

                                                          Comparison of Cost Ranges for GHG Emissions by Reduction Mechanism (AGA Estimates)
                               $900
                                                                                                                                                    U.S. Average – Renewables-Only Case ($806)
                               $800

                               $700
 $2016 per Metric Ton of CO2

                               $600                                                                                                          U.S. Average – Market-Based Generation Case ($572)

                               $500

                               $400

                               $300                                                                                                                               $94 to
                                                                                                                                               Costs up to         $232
                                                                                                                                                  $188
                               $200                                                                                         Costs up to
                                                                                                            Costs up to
                                                                                                                               $123
                                                                                                              $100
                                $100                                      Less than           $47 to $72
                                                           $4 to $16        $26
                                         $-345 to $5
                                 $0

                               -$300
                                       Transportation -   Power Sector   Policy-Driven Coal   Social Cost   Renewable     Transportation -    Natural Gas -    Atmospheric       Residential
                                        Fuel Efficiency    GHG Credits        Generation        of Carbon    Natural Gas   Low Carbon Fuel     Demand Side      CO2 Removal      Electrification
                                          Measures           (2018)          Retirement       (New York)                     Standard         Management

                                                                                                                                                                                  Source: AGA
18     SCOTTMADDEN, INC. | EFFICIENT ELECTRIFICATION THE ELECTRIC INDUSTRY SEES A GROWTH OPPORTUNITY

Policymakers to Contemplate Their Role
 ∙∙ Regulators will view electrification through a cost-benefit                                                               Primary U.S. Energy Consumption Shares in 2015:
     lens and are reluctant to intervene absent a market failure                                                          Where Opportunities (or Limits) Might Lie for Electrification
     or impediment                                                                                                              Transportation            Industrial            Residential           Commercial
                                                                                                                                28 Quads Total         31 Quads Total         21 Quads Total         18 Quads Total
 ∙∙ Regulatory-driven electrification would modify policy                                                                     0 Quads Electricity   10 Quads Electricity   14 Quads Electricity   14 Quads Electricity

     focus from energy efficiency to GHG emissions reduction,                                                      100%

                                                                                                                                                                                                                         Non-Electricity
                                                                                                                                                                                 Other
     requiring broader, end-to-end emissions analysis                                                                               Other                                                               Other
                                                                                                                                                                            Water Heating
 ∙∙ Broad free-rider problems may appear if utilities “electrify”                                                                                         Other                                    Water Heating
                                                                                                                          Commercial Light Trucks
     at a local or state level while the rest of the world does not                                                                                                                                Space Heating
 ∙∙ There appears to be some consensus that transportation
                                                                                                                                     Air

                                                                      % of Total 2015 Primary Energy Consumption
                                                                                                                                                                            Space Heating

     electrification, especially electric vehicles, is where market                                                75%

                                                                                                                                                                                                                         Electricity
                                                                                                                                                          Paper
     adoption is more imminent
                                                                                                                               Freight Trucks             Mining
 ∙∙ For other technologies, a key question: should public policy
     “push” electrification, or should markets drive technology
     evolution and adoption?                                                                                                                             Refining
                                                                                                                                                                                                        Other
                                                                                                                                                                                 Other
                                                                                                                   50%
Transportation Sector Transformed by Light-Duty
Vehicles in EPRI Electrification Scenarios                                                                                                           Bulk Chemicals

 ∙∙ EPRI sees transportation electrification as the leading
     driver of efficient electrification                                                                                    Light-Duty Vehicles
                                                                                                                                                                             Refrigeration

 ∙∙ EPRI’s Reference scenario sees electricity’s share of                                                          25%
                                                                                                                                                                                Lighting               Lighting
     transportation energy increasing from a meager 0.1% in                                                                                               Other
     2016 to 25% in 2050                                                                                                                                                    Space Cooling          Space Cooling

 ∙∙ Lower operating costs (fuel and maintenance) of light-                                                                                                Paper
                                                                                                                                                                            Water Heating
     duty PEVs outweigh the higher upfront costs, incentivizing                                                                                          Mining                                     Refrigeration
                                                                                                                                                        Refining
     customers to choose PEVs over traditional ICEs, but this                                                                                        Bulk Chemicals         Space Heating
                                                                                                                                                                                                   Space Heating
                                                                                                                    0%
     growth segment assumes those buyers drive at least
                                                                                                                                                                                                   Source: NREL
     18,000 miles per year (50% greater than average)
 ∙∙ Electric heavy-duty vehicles have an opportunity for higher
     savings compared to ICEs, as utilization factors of heavy-
     duty vehicles are much higher than light-duty vehicles
EFFICIENT ELECTRIFICATION THE ELECTRIC INDUSTRY SEES A GROWTH OPPORTUNITY | SCOTTMADDEN, INC.                       19

Building Efficiency Outweighs Electrification                                                   Load Duration Estimates for NREL Electrification Scenarios
                                                                                                                  (Current and in 2050)
 ∙∙ By 2050, EPRI expects that efficiency gains will offset any increase in
                                                                                                           1,200
   electricity end use (in different building applications), decreasing electricity
   consumption for building end uses by 20% by 2050
 ∙∙ EPRI’s electrification analysis projects additional heating applications                               1,000

     -- Electric heat pumps are expected to heat 50% of residential space
                                                                                                            800
      heating by 2050, increasing from approximately 15%
                                                                                                                                                             High 2050
    -- Heat pump water heaters are expected to serve more than half of

                                                                                             GWs
                                                                                                            600                                              Medium 2050
      households by 2050, but this growth is dependent on the continuation
      of declining heat pump costs and an increasing displacement of electric                                                                                Reference 2050
      resistance heating and non-electric fuels                                                             400                                              2015

Electrification Increases Productivity of Industrial Sector
                                                                                                            200
 ∙∙ EPRI contends that the electrification of industrial processes (induction
   melting and infrared drying) can improve product quality, productivity, and
                                                                                                              0
   working conditions                                                                                              0   2,000     4,000     6,000   8,000
 ∙∙ Industrial vehicles are also opportunities: for example, there has been                                                    Hours per Year                  Source: NREL
   widespread electrification of forklifts (currently two-thirds of U.S. forklifts                     Load Factor Estimates for NREL Electrification Scenarios
   are electric)                                                                                                           (2017 to 2050)
                                                                                                            0.74
NREL’s View: Increased Peak Demand and Other Potential Grid Impacts
                                                                                                            0.73
 ∙∙ National Renewable Energy Laboratory (NREL) performed analysis similar
                                                                                                            0.72
   to EPRI’s, studying three electrification scenarios
 ∙∙ NREL projects that winter demand will increase faster than summer demand                                0.71

   due to the increased use of electric space heaters and heat pumps for space

                                                                                             Load Factor
                                                                                                           0.70
   heating                                                                                                                                                   Reference
                                                                                                           0.69
 ∙∙ By 2050, due to the electrification of electric space heating, a greater                                                                                 Medium
   fraction of the top 100 load hours during the year for southeastern states                               0.68
                                                                                                                                                             High
   occurs during winter months; however, the absolute peak still occurs in the                              0.67
   summer
                                                                                                           0.66
 ∙∙ Load factor, the ratio of average-to-peak demand, is expected to increase
   due to electrification, possibly impacting the current generation mix                                    0.65

 ∙∙ Electrification, along with electric vehicle charging flexibility, could result                        0.64
                                                                                                              2017                 2030               2050
   in more uniform load (higher load factor) and possibly result in more
                                                                                                                                    Year
   consistent use of generation sources
                                                                                               Note: Moderate technology advancement projections shown. Source: NREL
                                                                                      Profiles shown include estimated impacts of flexible load as modeled.
20     SCOTTMADDEN, INC. | EFFICIENT ELECTRIFICATION THE ELECTRIC INDUSTRY SEES A GROWTH OPPORTUNITY

Economics, Technology, and Regional Issues, Among Other Things, Could                                                         EPRI’s Reference Scenario Projections for U.S. Total Final
Restrain Widespread Electrification                                                                                                    Energy by Fuel and Electricity Demand
  ∙∙ There is a significant amount of necessary investment in electric vehicle supply                                                         Total Energy by Fuel (Quadrillion Btus) and Drivers
    equipment (e.g., charging stations) to enable the adoption of the forecasted                                                                                                      GDP GROWTH (AEO)
    PEVs                                                                                                                                     120

  ∙∙ Additionally, challenges with electrifying large vehicles (vehicle range, battery
    size, added weight, and charging duration) and the continued low price of diesel                                                         100                                              STRUCTURAL
                                                                                                                                                                                             CHANGE (AEO)

                                                                                                                   Quad Btus Final Energy
    fuel could limit the market for heavy-duty PEVs, compared to light-duty vehicles
  ∙∙ In some regions, increased electric load (particularly when supplied by gas-fired                                                        80
                                                                                                                                                                                              EFFICIENCY
    resources) could complicate fuel availability issues, especially in winter                                                                                                              IMPROVEMENTS
  ∙∙ Adoption of electric technologies may be slowed by increased efficiencies in                                                            60
                                                                                                                                                                                          ELECTRIFICATION
    current technologies (e.g., ICEs) and by gas efficiency programs
  ∙∙ Non-electric technologies (mainly natural gas-fired) in the building sector have                                                        40                        OTHER NON-ELECTRIC

    an installed base and some economic advantages depending upon technology.
    Widespread adoption of electric heat pumps is limited by upfront costs and                                                                20                          NATURAL GAS
                                                                                                                                                                                                              INCREASED
    lower efficiency than conventional cold-climate fuel-oil furnaces                                                                                                                                         ELECTRICITY

  ∙∙ Electrification of industrial boilers offers little benefit to industrial facilities, many                                                0
                                                                                                                                                   21%                    ELECTRICITY                      36%

    of which rely on fuel-fired boilers or cogeneration for a substantial amount of                                                            2015      2020    2025     2030     2035    2040    2045    2050
    industrial energy end use; electric boilers provide only a marginal increase in                                                                 ELECTRIC                                                         Source:
                                                                                                                                                     SHARE                                                             EPRI
    productivity compared to the electrification of other industrial end uses
                                                                                                                                                         Electricity Demand (TWh) by Sector
   IMPLICATIONS                                                                                                                             6,000

   Efficient electrification may prove to be a growth strategy for electric utilities. Utilities
   and policymakers considering efficient electrification initiatives will need to look
                                                                                                                                            5,000               +32%
                                                                                                                                                                2015     2050
   carefully at technology applications, potential adoption rates, customers’ economic

                                                                                                              TWh Electricity Demand
                                                                                                                                                                                                                 VEHICLES
   trade-offs, and grid and resource implications to assess costs and benefits, both                                                        4,000                                 ELECTRIFICATION
                                                                                                                                                                                                                 BUILDINGS
   financial and environmental.                                                                                                                                                                                  INDUSTRY

                                                                                                                                            3,000
Notes: GHG means greenhouse gas; ICE means internal combustion engine; VMT means vehicle miles
traveled; PEV means plug-in electric vehicle. For additional discussion of electric vehicles, see relevant                                                                  BUILDINGS
                                                                                                                                                                       (before electrification)
section at page 31 of this Energy Industry Update.                                                                                          2,000
Sources: Electric Power Research Institute, U.S. National Electrification Assessment (April 2018); National
Renewable Energy Laboratory (NREL), Electrification Futures Study: Scenarios of Electric Technology
Adoption and Power Consumption for the United States (July 2018); American Gas Association,                                                 1,000
Implications of Policy-Driven Residential Electrification (July 2018); National Regulatory Research                                                                          INDUSTRY
Institute, Electrification: The Link between Markets, Consumer Behavior, and Public Policy, Report No. 18-                                                             (before electrification)
02 (January 2018); S&P Global Market Intelligence; industry news; ScottMadden analysis
                                                                                                                                               0                                                                     Source:
                                                                                                                                               2015      2020     2025     2030    2035     2040    2045    2050       EPRI
EFFICIENT ELECTRIFICATION THE ELECTRIC INDUSTRY SEES A GROWTH OPPORTUNITY | SCOTTMADDEN, INC.   21

       For more ScottMadden energy
    insights visit our Insights Library:
           scottmadden.com/insights
22    SCOTTMADDEN, INC. | LIQUEFIED NATURAL GAS EXPORTS BEGIN RESHAPING BOTH DOMESTIC AND INTERNATIONAL MARKETS

  LIQUEFIED NATURAL GAS
  EXPORTS BEGIN RESHAPING BOTH DOMESTIC AND
  INTERNATIONAL MARKETS
The United States is on the cusp of being a major global LNG player.

2017 Begins Wave of Increased U.S. Exports
 ∙∙ In 2017, U.S. liquefied natural gas (LNG) operational export capacity       ∙∙ Due to delays in the construction of pipelines connecting it to the
   reached 1.94 BCF/day and operated at 91% utilization                          United States, Mexico increased its reliance on U.S. LNG to satisfy
 ∙∙ As of early September 2018, there were five operational trains in the        gas demand from its power generation sector
   United States, operating at 3 BCF/day (>23 MTPA)                             ∙∙ About 60% of exported U.S. LNG was transacted on the spot
     -- Cheniere Energy’s Sabine Pass: Four trains in Louisiana                  market, and the price of exported LNG averaged $4.65/MCF in
                                                                                 June 2018 and had a range of $3.65/MCF to $6.44/MCF from June
     -- Dominion’s Cove Point: One train in Maryland                             2016 through June 2018
 ∙∙ In 2017, three countries received more than half of U.S. LNG exports:
   Mexico (20%), South Korea (18%), and China (15%)
 ∙∙ Exports from the United States to Asia were partially driven by a decline
   in Henry Hub gas prices—to which certain LNG prices are indexed—
   versus crude oil prices, which serve as a benchmark for Asia LNG
LIQUEFIED NATURAL GAS EXPORTS BEGIN RESHAPING BOTH DOMESTIC AND INTERNATIONAL MARKETS | SCOTTMADDEN, INC.                           23

                                                      Average Annual Global Gas and Oil Prices (2009–2017) ($/MMBtu and $/Bbl)
KEY TAKEAWAYS                            $18                                                                                $120                         Oil

                                         $16                                                                                                        Brent (right axis)
 Increased global demand                                                                                                    $100                    West Texas
 for LNG, especially in                  $14                                                                                                        Intermediate
 Asia, is responsible for                                                                                                                           (right axis)
 the majority of last year’s             $12                                                                                $80                         LNG
 increase in global LNG

                               $/MMBtu
                                         $10                                                                                                        Japan CIF
 trade, with this trend

                                                                                                                                   $/Bbl
                                                                                                                            $60                     Japan-Korea
 expected to continue over
                                          $8                                                                                                        Marker
 the next 20 years
                                                                                                                                                        Gas
                                          $6                                                                                $40
                                                                                                                                                    German Import
                                          $4                                                                                                        Price
 The United States and                                                                                                      $20                     U.K. Heren NBP
 Australia are both poised                $2                                                                                                        Index
 to meet growing demand                                                                                                                             Netherlands TTF
 for LNG                                  $0                                                                                $0
                                               2009   2010    2011    2012    2013    2014        2015     2016     2017                            U.S. Henry Hub
                                                                                                                                                           Source: BP

                                                                                                            2017 U.S. LNG Exports by Destination
 Completion of LNG export
                                                                                                             Country/Region (Incl. Re-Exports)
 terminals currently under
                                                                                                                  (in Billion Cubic Meters)
 construction will more                         Monthly Average Price of U.S. LNG Exports
 than triple U.S. export                            (Feb. 2016–June 2018) ($/MCF)
 capacity in the next two
                                         $7
 years to 10 BCF/day,
 volumetric equivalent                   $6                                                                       Mexico
 to 13% of average daily                                                                                           3.8
 natural gas consumption                 $5
                                                                                                                                                Rest of World
 in 2017                                                                                                                                             5.6
                                         $4
                               $/MCF

                                         $3

                                         $2
 Due to the overwhelming                                                                                   South Korea
 number of export terminal               $1                                                                    2.7
 applications, FERC
 has made operational                    $0                                                                                                           Japan
                                         M -16

                                         N -16

                                         M -17

                                         N -17

                                         M -18
                                         A -16
                                         M r-16
                                          Ju -16
                                           Ju 16
                                         A -16
                                         Se -16
                                          O -16

                                          Fe -17

                                         A -17
                                         M r-17
                                          Ju -17
                                           Ju 17
                                         A -17
                                         Se -17
                                          O -17

                                          Fe -18

                                         A -18
                                         M r-18
                                          Ju -18
                                                 18
                                         D -16
                                          Ja -16

                                         D -17
                                          Ja -17

 changes in an attempt to                                                                                                                              1.3
                                              n-

                                             n-
                                             n-

                                              b

                                             ct

                                              b
                                              b

                                             ct

                                              n

                                            ar

                                            ay

                                               l
                                           ug
                                             p

                                             n

                                            ar

                                            ay
                                            ar

                                           ay

                                              l
                                           ug
                                             p

                                           ov
                                           ec
                                           ov
                                           ec

                                            p

                                            p
                                            p
                                          Fe

 review applications in a                                                                                                                  Middle
                                                                                             Source: EIA                 China              East
 reasonable timeframe                                                                                                     2.1                1.9

                                                                                                                                                           Source: BP
24    SCOTTMADDEN, INC. | LIQUEFIED NATURAL GAS EXPORTS BEGIN RESHAPING BOTH DOMESTIC AND INTERNATIONAL MARKETS

                                                         U.S. LNG Export Projects (Under Construction)

      Facility and Train                               Owners                   Location (State)   Capacity (MTPA)        Latest Announced Start Year

                                                                                                                        2018         2019         2020

 Elba Island LNG T1-6           Kinder Morgan, EIG Global Energy Partners               GA         1.5                   check
 Cameron LNG T1                 Sempra, Mitsubishi/NYK JV, Mitsui, ENGIE                LA         4.0                                check
 Corpus Christi LNG T1          Cheniere                                                TX         4.5                                check
                                                                                        GA

 Freeport LNG T1                Freeport LNG, JERA, Osaka Gas                           TX         5.1                                check
 Sabine Pass LNG T5             Cheniere, Blackstone                                         TX    4.5                                check
                                                                                   LA

 Cameron LNG T2                 Sempra, Mitsubishi/NYK JV, Mitsui, ENGIE                LA         4.0                                check
 Elba Island LNG T7-10          Kinder Morgan, EIG Global Energy Partners               GA         1.0                                check
 Corpus Christi LNG T2          Cheniere                                                TX         4.5                                check
 Freeport LNG T2                Freeport LNG, IFM Investors                             TX         5.1                                check
 Cameron LNG T3                 Sempra, Mitsubishi/NYK JV, Mitsui, ENGIE                LA         4.0                                check
 Freeport LNG T3                Freeport LNG                                            TX         5.1                                             check
                                                                                                                                                 Source: IGU

U.S. Export Terminal Construction: The Trains Keep Rollin’
 ∙∙ In the next two years, the following projects are expected to become          ∙∙ For reference, U.S. dry gas production totaled 27.3 TCF, or about 74.8
   commercially operational: Elba Island LNG (Georgia) and Cameron                  BCF/day; 11 BCF/day would be the equivalent of nearly 15% of U.S.
   LNG (Louisiana) in 2018, Freeport LNG (Texas) and Corpus Christi                 dry gas production
   LNG (Texas) in 2019, and Sabine Pass (border of Louisiana and                  ∙∙ Of the 92 MTPA liquefaction capacity under construction worldwide
   Texas), with more than 7.1 BCF/day peak LNG terminal capacity                    in March 2018, more than half (49 MTPA) was in the United States,
   expected in service by the end of 2019                                           which should propel the United States to be the largest source of
 ∙∙ A total of 11 liquefaction trains on the U.S. Gulf Coast are projected          incremental liquefaction capacity through 2023
   to come online in the next five years, increasing domestic export              ∙∙ Alaska Gasline Development Corporation, a state-sponsored
   capacity to almost 10 BCF/day (76 MTPA) by 2020, and more than 11                developer, recently signed a deal with Exxon Mobil to help supply
   BCF/day (85 MTPA) by 2023, which could result in U.S. LNG exports                its three-train (20 MTPA) LNG terminal, which could come online in
   comprising about 20% of global LNG exports by 2023 and potentially               2024
   making the United States the world’s swing LNG supplier
LIQUEFIED NATURAL GAS EXPORTS BEGIN RESHAPING BOTH DOMESTIC AND INTERNATIONAL MARKETS | SCOTTMADDEN, INC.                                         25

Global LNG Market Demand Is Growing                                                          Actual and Forecast LNG Imports by Region (BCF/Day)
 ∙∙ LNG is the fastest growing gas supply source globally                                    80
                                                                                                                           Actual Forecast
                                                                                                                                                                74.6
 ∙∙ Led by Asian countries, which represented 74% of the increase, global                                                                                71.2
                                                                                             70                                                   64.9
   LNG trade increased 10% (3.5 BCF/day) in 2017, reaching 38.2 BCF/day
 ∙∙ Driven by record-high demand due to environmental regulations focused                    60
                                                                                                                                           58.3                        Other Emerging
                                                                                                                                                                       Asia
   on reducing air pollution, China’s imports of LNG increased 1.6 BCF/day                                                          48.7
   (46%) in 2017 to an average of 5 BCF/day, surpassing South Korea to                       50                                                                        China

                                                                                   BCF/Day
   make China the world’s second largest importer of LNG, behind Japan’s
                                                                                             40                              32.6                                      Europe
   imports of 11 BCF/day
 ∙∙ Japan and South Korea continue to import LNG for power generation to                     30
                                                                                                                          29.6
                                                                                                                                                                       India
   offset low nuclear power production
                                                                                                                   18.2
                                                                                             20                                                                        OECD Asia
United States Poised to Supply Much of That Growth                                                          13.3
                                                                                             10 6.9 9                                                                  Others
 ∙∙ Australia, Russia, and the United States added a combined 3.4 BCF/
   day of export capacity in 2017, with Australia and the United States
                                                                                              0
   comprising the two largest increases in exports (adding 2.7 BCF/day of

                                                                                                90

                                                                                                 95

                                                                                                00

                                                                                                 05

                                                                                                 10

                                                                                                  15

                                                                                                 20

                                                                                                 25

                                                                                                 30

                                                                                                 35

                                                                                                40
   capacity in 2017)

                                                                                              20
                                                                                              20

                                                                                             20

                                                                                             20
                                                                                              19

                                                                                             20
                                                                                             20

                                                                                             20
                                                                                              19

                                                                                             20
                                                                                             20
 ∙∙ In the next three years, U.S. export capacity is expected to surpass 10                                                                                                     Source: BP

   BCF/day, which would be about 10% of U.S. gas demand
                                                                                             Actual and Forecast LNG Exports by Region (BCF/Day)
Monitoring Domestic Price Impacts                                                            80
                                                                                                                            Actual Forecast
                                                                                                                                                                74.5
 ∙∙ Increasing LNG exports have led some U.S. agencies to re-examine the                                                                                 71.2
                                                                                             70                                                   64.9
   potential for impacts on domestic natural gas prices
 ∙∙ The DOE and the CFTC did independent, scenario-based studies of this                     60
                                                                                                                                           58.1
                                                                                                                                                                       North America
                                                                                                                                    48.8
   issue and came to divergent conclusions
                                                                                             50                                                                        Africa
    -- The CFTC study found that increasing exports could increase
      domestic gas prices anywhere from negligibly to up to 20% (for               BCF/Day                                   32.7
                                                                                             40                                                                        Russia
      reference: in 2017, the average natural gas price at Henry Hub was
      $2.99/MMBtu)                                                                                                        29.6
                                                                                             30                                                                        Australia

    -- The DOE study found that increasing LNG exports leads to only small                                         18.2
                                                                                             20                                                                        Middle East
      increases in gas prices by 2040
                                                                                                            13.1
    -- DOE’s reference case estimated domestic gas prices in a range of $5                   10 6.9
                                                                                                      8.8                                                              Others
      to $6.50 per MMBtu (in 2016$), even with increased exports
    -- Both reports noted that price impacts were highly dependent upon                       0
                                                                                                90

                                                                                                 95

                                                                                                00

                                                                                                 05

                                                                                                 10

                                                                                                  15

                                                                                                 20

                                                                                                 25

                                                                                                 30

                                                                                                 35

                                                                                                40
      domestic production response
                                                                                              20
                                                                                              20

                                                                                             20

                                                                                             20
                                                                                              19

                                                                                             20
                                                                                             20

                                                                                             20
                                                                                              19

                                                                                             20
                                                                                             20

                                                                                                                                                                                Source: BP
26     SCOTTMADDEN, INC. | LIQUEFIED NATURAL GAS EXPORTS BEGIN RESHAPING BOTH DOMESTIC AND INTERNATIONAL MARKETS

FERC Streamlines LNG Applications to Reduce Lag
 ∙∙ In response to long review times for LNG terminal applications and      ∙∙ Also on August 31, FERC released information on steps it had taken
  the issuance of revised notices of schedule for two projects, FERC          to improve the LNG application process
  recently addressed its review process in an attempt to streamline            -- FERC and PHMSA agreed to coordinate the siting and safety
  LNG project applications                                                          reviews of LNG facilities, requiring the approval of safety
 ∙∙ On August 31, FERC issued environmental schedules for 12 LNG                    standards from PHMSA prior to FERC’s review if the project is in
  terminal applications, which, according to Chairman Kevin McIntyre,               the public’s interest
  are nine to 12 months shorter due to FERC’s improvements in their            -- Addition of FERC staff focused on LNG
  regulatory process
                                                                               -- An outside contractor will assist in construction inspections
                                                                               -- Third-party contractors may review non-proprietary application
                                                                                    information

                                                 Proposed U.S. LNG Export Plants (as of June 2018)

                                                                                             PENDING FERC APPLICATIONS
                                                                                             Location          Size (BCF/d)            Company
                                                                                         1   Brownsville, TX          3.60    Rio Grande LNG — NextDecade
  10                                                                                    2    Port Arthur, TX          1.86    Port Arthur LNG
                                                                                        3    Pascagoula, MS           1.50    Gulf LNG Liquefaction
                                                                                        4    Cameron Parish, LA       1.41    Venture Global Calcasieu Pass
                                                                                        5    Brownsville, TX          0.90    Annova LNG Brownsville
                                                                                        6    Brownsville, TX          0.55    Texas LNG Brownsville
                                                                                        7    Calcasieu Parish, LA     4.00    Driftwood LNG
                                                                                        8    Plaquemines Parish, LA   3.40    Venture Global LNG
                                                                                        9    Nikiski, AK              2.63    Alaska Gasline
                                                                                        10 Coos Bay, OR               1.08    Jordan Cove
                                                                                        11 Freeport, TX               0.72    Freeport LNG Dev
                                                                                        12 Jacksonville, FL           0.13    Eagle LNG Partners
                                                                                             PROJECTS IN PRE-FILING
                                                                                        13 Corpus Christi, TX         1.86    Cheniere — Corpus Christi LNG
                                                                       3       12       14 Cameron Parish, LA         1.18    Commonwealth, LNG
                                                          14       8
                                                11             4                        15 LaFourche Parish, LA       0.65    Port Fourchon LNG
                                                          7 15                               PROPOSED TO U.S.-MARAD/COAST GUARD
                                              13 2
           9                                         16                                 16 Gulf of Mexico             1.80    Delfin LNG
                                             1   5
                                                 6                                                                               Source: Platts (citing FERC)
LIQUEFIED NATURAL GAS EXPORTS BEGIN RESHAPING BOTH DOMESTIC AND INTERNATIONAL MARKETS | SCOTTMADDEN, INC.   27

  IMPLICATIONS
  The race to build export terminals is in stark contrast to 2005 when import facilities
  were being constructed and the EIA estimated that the United States would import
  18 BCF/day by 2025. A high level of North American LNG export facility construction
  activity is focused in a few select regions: Gulf Coast, U.S./Canada West Coast (British
  Columbia and Alaska), and Nova Scotia. There is a diversity in U.S. export markets with
  24 countries already having received U.S. exports in 2018, but it is highly concentrated
  with three countries (Mexico, South Korea, and China) comprising half of total U.S.
  exports; thus, any change to one of these markets could have a significant impact.

Notes: LNG means liquefied natural gas; DOE means U.S. Dept. of Energy; CFTC means U.S. Commodity
Futures Trading Commission; PHMSA means U.S. Pipeline and Hazardous Materials Safety Administration;
MTPA means million metric tons per annum; BCF means billion cubic feet; MCF means thousand cubic feet;
TCF means trillion cubic feet; Bbl means barrel. One BCF/day roughly equals 7.6 MTPA. An LNG “train” is a
natural gas liquefaction and purification unit.
Sources: U.S. Energy Information Administration; U.S. Dept. of Energy; U.S. Federal Energy Regulatory
Commission; U.S. Commodity Futures Trading Commission; S&P Global Market Intelligence; Platts;
Bloomberg New Energy Finance; RBN Energy; Natural Gas Week; International Gas Union (IGU), 2018
World LNG Report (July 2018); BP, 2018 Energy Outlook (Feb. 2018); BP, Statistical Review of World
Energy (June 2018); R. Hickman, Royal Dutch Shell, “The Growing Importance of U.S. Petroleum and LNG
Exports,” presented at 2018 EIA Energy Conference (June 2018)

                                                                      For more ScottMadden energy
                                                                   insights visit our Insights Library:
                                                                          scottmadden.com/insights
Infrastructure
and Technology
30    SCOTTMADDEN, INC. | ELECTRIC VEHICLES TIME FOR UTILITY ENGAGEMENT AND PLANNING

  ELECTRIC VEHICLES
  TIME FOR UTILITY ENGAGEMENT AND PLANNING
As electric vehicles gain traction, utilities should consider possible infrastructure needs.

Plug-In Electric Vehicle Sales Are Growing Steadily in Distinct Markets                                          Improving News: Light-Duty BEV Annual Sales
                                                                                                                Forecasts (EIA Annual Energy Outlooks 2015–18)
 ∙∙ The term “plug-in electric vehicles” (PEVs) includes plug-in hybrid electric vehicles (PHEV)
   and battery electric vehicles (BEVs)                                                                                            1,800
                                                                                                                                                    The U.S. Energy Information         2018 AEO
 ∙∙ PEV sales are concentrated among urban, higher income, and more educated car buyers                                            1,600          Administration has been steadily

                                                                                                       Unit Sales (in thousands)
                                                                                                                                   1,400           increasing its forecast of BEV
   along the East and West Coasts                                                                                                                 sales over the past several years
                                                                                                                                   1,200
 ∙∙ September 2018 marked the 36th month of consecutive year-over-year gains in monthly PEV                                                                                             2017 AEO
                                                                                                                                   1,000
   sales, with more than 40 different vehicle models sold in 2018
                                                                                                                                    800
 ∙∙ Cumulatively, nearly 1 million PEVs have been sold in the United States as of September 2018;                                   600
   California accounts for roughly half of all U.S. PEV sales                                                                                                                           2016 AEO
                                                                                                                                    400
 ∙∙ In 2017, the Edison Electric Institute forecasted that by 2025:                                                                 200
                                                                                                                                                                                        2015 AEO
      -- Annual PEV sales will exceed 1.2 million vehicles and account for 7% of annual                                               0
       vehicle sales                                                                                                                       2015

                                                                                                                                                         2020

                                                                                                                                                                   2025

                                                                                                                                                                              2030

                                                                                                                                                                                      2035

                                                                                                                                                                                               2040
     -- The stock of PEVs on the road will be 7 million, accounting for roughly 3% of all registered
       cars and light-duty trucks, and will need to be supported by 5 million charge ports                                                                                             Source: EIA
ELECTRIC VEHICLES TIME FOR UTILITY ENGAGEMENT AND PLANNING | SCOTTMADDEN, INC.                31

                           Growing Number of Vehicles—Not Named Tesla—Being Purchased by Consumers
KEY TAKEAWAYS               ∙∙ Tesla dominates electric vehicle headlines and                     thereby allowing owners many of the advantages
                              accounted for 35% of PEV sales in the first half of 2018            of electric vehicles without the downside of range
 Light-duty PEV sales       ∙∙ However, despite that accomplishment, the cheapest                 anxiety
 are growing and              Model 3 currently available (with a long-range                    ∙∙ Longer term, many auto manufacturers have
 are forecasted to            battery) starts at $49,000, far from the highly touted              announced ambitious plans. This includes the
 continue growing at          Model 3 base price of $35,000                                       following targets:
 an accelerated pace
 in certain markets; an     ∙∙ Consequently, consumers shopping for new PEVs are                    -- 2020: 12 PEV models from Hyundai-Kia and 10
 increasing number            finding—and purchasing—a growing number of makes                           PEV models from Toyota
 of models are                and models available for less than $40,000                            -- 2022: 40 PEV models from Ford
 becoming available to
                            ∙∙ Just 10 PEVs, all starting below $40,000, accounted                  -- 2023: 20 PEV models from GM
 consumers
                              for 45% of electric vehicles sales in the first half of
                              2018 (see below)                                                      -- 2025: 80 PEV models from Volkswagen and 25
 While most attention
                                                                                                         PEV models from BMW
 is focused on light-       ∙∙ As possible harbinger of the future PEV market, more
 duty vehicles,               than 70% of vehicles in this subset were PHEVs;
 medium- and heavy-
 duty vehicles will have
 a larger grid impact       1H 2018 PEV Sales by Type                           Top 10 (in 1H 2018 Sales) PEVs Available under $40,000
 per vehicle and tend              (% of Total)                                          PEV     Vehicle Sales     PEV Market         Starting      Total Range
                                                                  Brand       Model
 to concentrate load       100%                                                          Type     (1H 2018)      Share (1H 2018)       MSRP           (Miles)
 by charging at depots                                                        Prius
                                                                 Toyota                  PHEV   14,255           11.5%             $27,300         640
                                                                              Prime
 The number and                                                 Chevrolet      Bolt      BEV    7,858            6.3%              $37,495         238
                            80%
 scope of utility
 engagement                                                     Chevrolet      Volt      PHEV   7,814            6.3%              $34,095         420
 opportunities is
                           60%                                                Clarity
 expanding and is                                                Honda                   PHEV   6,669            5.4%              $33,400         340
                                                                              PHEV
 larger than just
                                                                 Nissan        LEAF      BEV    6,659            5.4%              $29,990               151
 public charging
 infrastructure            40%                                                Fusion
                                                                  Ford                   PHEV       4,302                3.5%      $33,400         610
                                                                               Energi
 With sufficient                                                              Pacifica
                                                                Chrysler                 PHEV      3,090            2.5%           $39,995         570
 penetration of light-                                                        Hybrid
                            20%
 duty and heavy-duty
                                           Tesla                Mitsubishi
                                                                             Outlander
                                                                                         PHEV     1,956            1.6%            $34,595         310
                                                                               PHEV
 PEVs, grid operators
 will need to study and                                            Fiat        500e      BEV     1,420            1.1%             $32,995          84
                            0%
 anticipate potential                                                          Niro
 changes to system                 Other                           Kia                   PHEV    1,247            1.0%             $27,900         560
                                                                              PHEV
 demand, as illustrated
                                   Top 10 under $40K                                                              Sources: insideevs.com; EPA; ScottMadden analysis
 by the “dragon curve”
                                   Tesla (Models S, X, and 3)
32    SCOTTMADDEN, INC. | ELECTRIC VEHICLES TIME FOR UTILITY ENGAGEMENT AND PLANNING

Rising PEV Sales Means More KWhs...                                    PEV Share of New 2017 Vehicle Registrations by Metropolitan Area
with Limits
 ∙∙ With increasing PEV sales, electricity
   consumption for charging is expected to
   grow as well
 ∙∙ The EIA’s most recent Annual Energy
   Outlook forecasts electricity demand
   from light-duty vehicles growing to more
   than 48,000 GWh by 2030
 ∙∙ A key question for utilities: Will this
   constitute meaningful load growth?
     -- Efficient electrification is increasingly
       of interest to the electricity industry
       as well as environmental advocates
     -- Some recent studies show that
       widespread transportation
       electrification, including medium-                                                                                                     Source: ICCT
       and heavy-duty vehicles, will spur
       electricity growth, but perhaps
       limited to around 1% annual load                   PEV Consumption (GWh)
       growth or less depending upon the            (2017 Actual and 2020–30 Projected)
       study and scenario                                 60,000

 ∙∙ Location and timing of usage will matter                                                53,756

     -- Similar to early adoption (see map),                                                                PEV KWh Consumption in Context:
                                                          50,000
       the advance of PEVs will likely be                                                                 How PEV Consumption (2017 Actual and
       uneven across the United States,                                                                 2020–30 Projected) Compares to Household
                                                                                                            Consumption and Total Retail Sales
       impacting individual utilities with                40,000
       different penetrations along varying                                                                                      2017    2020     2025    2030
       timelines                                                                   29,871
                                                    GWh

                                                                                                       Equivalent to                                         5M
                                                          30,000
     -- Even if load growth is minimal,                                                                Number                                     2.8 M
                                                                                                       of U.S.                           0.9 M
       it will be important to consider                                                                Households               0.2 M
       PEVs contribution to peak load                     20,000
       as unmanaged charging may                                                                       Percentage                                            1.3%
                                                                                                       of Electricity                             0.8%
       be concentrated in evening and                     10,000
                                                                           9,285                       Sales                     0.1%     0.2%
       overnight hours
                                                                   1,900

                                                              0
                                                                   2017    2020    2025     2030             Sources: EIA; Argonne Nat’l Lab; ScottMadden analysis
ELECTRIC VEHICLES TIME FOR UTILITY ENGAGEMENT AND PLANNING | SCOTTMADDEN, INC.                                        33

  Anticipating Grid Impacts: PEVs Will Require Public Charging, but 80% to 90% of Charging Will Occur at Home
                                  ∙∙ California has been aggressively promoting EV expansion, where                                               900 MWs of residential charging demand occurring at 8 PM on
                                   officials have approved nearly $1 billion in ratepayer-backed EV-                                              weekdays (see chart below)
                                   charging investments, and Gov. Brown has proposed an additional                                               ∙∙ While public infrastructure has received considerable attention, the
                                   $2.5 billion program to further a goal of 5 million zero-emissions                                             findings from California reveal how electric utilities must consider and
                                   vehicles by 2030                                                                                               plan for the behaviors and impact of large-scale residential charging,
                                  ∙∙ Anticipating increasing uptake of PEVs, the California Energy                                                which is largely not visible to electric utilities
                                   Commission and the National Renewable Energy Laboratory recently                                              ∙∙ Managed charging, which enables utilities to control the charging of
                                   estimated the number of chargers required for California to support                                            PEVs, will be a “must-do” rather than “can-do” activity for electric
                                   1.3 million PEVs by 2025                                                                                       utilities
                                  ∙∙ The analysis found 229,000 to 279,000 chargers would be required                                            ∙∙ Some utilities, such as DTE Energy and Duke Energy, have proposed
                                   at work places, public destinations, and multi-unit dwellings; these                                           customer incentives for Level 2 chargers with certain communication
                                   figures do not account for chargers at single-family homes                                                     protocols (e.g., OPCC and OpenADR) to allow visibility and control of
                                  ∙∙ The analysis also forecasts the timing of PEV charging, finding nearly                                       residential charging

                                                         Enter the Dragon (Curve): Late Afternoon Power System Ramping Could Be Exacerbated by PEV Charging

                                               California Statewide Aggregated PEV Electricity Load                                                           California Statewide Aggregated PEV Electricity Load
                                                               for a Typical Weekday                                                                                          for a Typical Weekend
                                   1,000                                                                                                          1,000
                                               Residential L1                                                                                                 Residential L1
                                    900                                                                                                            900
                                               Residential L2                                                                                                 Residential L2

                                                                                                               Weekend PEV Charging Load (MWs)
Weekday PEV Charging Load (MWs)

                                    800        Work L2                                                                                             800        Work L2
                                               Public L2                                                                                                      Public L2
                                    700                                                                                                            700
                                               Fast Charging                                                                                                  Fast Charging
                                    600                                                                                                            600

                                    500                                                                                                            500

                                    400                                                                                                            400

                                    300                                                                                                            300

                                    200                                                                                                            200

                                    100                                                                                                            100

                                      0                                                                                                              0
                                           0         4          8         12        16        20          24                                              0         4          8       12           16          20          24
                                                                      Time of Day                                                                                                  Time of Day
                                                                                                                                                                                            Source: California Energy Commission
34   SCOTTMADDEN, INC. | ELECTRIC VEHICLES TIME FOR UTILITY ENGAGEMENT AND PLANNING

A Broad Array of Actions to Maximize Value from PEVs                                                        Drivers of Growth
 ∙∙ In order to realize the benefits of transportation                                            Infrastructure                 Value-Add Products
   electrification, electric utilities need to determine their                                                                      and Services
                                                                                        ∙∙Personal chargers – Level 2
   role (or roles) in the PEV ecosystem                                                                                      ∙∙Charger sales/leases
                                                                                        ∙∙Public chargers – Level 2, DC
 ∙∙ Maximizing long-term value may require developing                                     fast charging, high power          ∙∙Infrastructure consulting
   strategic engagements across multiple engagement
   channels (see graphic at right)                                        Vehicles and                                                                Grid Services
                                                                      Transport Equipment
 ∙∙ A broad assessment of all engagement channels ensures                                                                                        ∙∙Demand management/
   a holistic strategic approach that considers the utilities’      ∙∙Vehicle rebates                                                              response
   capabilities, market dynamics, and long-term desired role        ∙∙Procurement group                                                          ∙∙Aggregate storage

More than Kilowatt-hours: Utilities Should Consider                                                        Value Generation
Multiple Value Opportunities                                                                                through Electric
 ∙∙ Energy sales: PEVs can mitigate declining load growth by                                            Transportation Strategy
   providing additional electricity sales
 ∙∙ Grid management: Managed charging with current
   technology allows load shifting and demand response;
   vehicle-to-grid technology not ready for mass adoption
 ∙∙ Return on assets: A number of utilities have been able to
   rate base PEV charging infrastructure and earn a return
                                                                                                                   Energy Sales
   on those assets
                                                                                                              Grid Management
 ∙∙ Additional revenue streams: Additional products and
                                                                                                                Return on Assets
   services (e.g., retail charger sales/leases) represent
   opportunities for utility revenue growth                                                             Additional Revenue Streams

 ∙∙ Brand value: Enhanced customer offerings can also                                                              Brand Value
   increase brand value with customers and regulators
                                                                              Policy
                                                                                                                                                      Collaboration
Don’t Forget Heavy-Duty Vehicles                                    ∙∙Influence legislation and
                                                                      regulations                                                                ∙∙OEMs
 ∙∙ Most incentives and targets are for light-duty vehicles         ∙∙Influence state and local                                                  ∙∙EV supply equipment
                                                                      incentives                                                                   providers
 ∙∙ However, light-duty vehicles only account for a portion of
   vehicle emissions
                                                                                                    Rates                    Education/Awareness
 ∙∙ Discussions of transportation electrification should include
                                                                                        ∙∙Residential/commercial          ∙∙Events and educational
   medium and heavy-duty vehicles, which will have a larger                               time of use                       materials
   per-vehicle emissions impact                                                         ∙∙Depot charge tariff             ∙∙PEV showrooms

                                                                                                            Enablers of Growth
ELECTRIC VEHICLES TIME FOR UTILITY ENGAGEMENT AND PLANNING | SCOTTMADDEN, INC.   35

  IMPLICATIONS
  There is significant opportunity for utilities to identify strategic
  engagements and proactively plan for PEVs.

Note: OEMs are original equipment manufacturers
Sources: California Energy Commission; International Energy Agency;
International Council on Clean Transportation; U.S. Environmental Protection
Agency; Edison Electric Institute; Argonne National Laboratory; U.S. Energy
Information Administration; InsideEVs.com; National Renewable Energy
Laboratory; S&P Global Market Intelligence; auto manufacturer websites;
industry news; ScottMadden analysis

                                                                      For more ScottMadden energy
                                                                   insights visit our Insights Library:
                                                                          scottmadden.com/insights
36   SCOTTMADDEN, INC. | POWER TRANSMISSION MUCH PLANNED, BUT TAILWINDS ARE ABATING

  POWER TRANSMISSION
  MUCH PLANNED, BUT TAILWINDS ARE ABATING
Industry and regulators are trying to find the right incentives.

Planned Transmission Continues Apace                        But Project Completion Has Been Slowing
                                                                                                               NERC Assessment Areas with
 ∙∙ Despite low or flat load growth, about 6,200 circuit     ∙∙ Completed miles of transmission lines have      High Levels of Prospective
   miles of new transmission is planned throughout the        declined year over year from 2013 to 2017          Transmission Additions
   2018–2022 assessment period with more than 1,100          ∙∙ NERC says that lead times can be up to
   circuit miles currently under construction                 15 years to permit, site, and construct
 ∙∙ Increasing levels of intermittent resources are           expansion projects
   requiring new transmission facilities and devices,        ∙∙ Together, electric transmission and
   such as static VAR compensators or synchronous             distribution expenditures are expected to
   condensers                                                 account for about 46% of electric utility
 ∙∙ And while nearly 80% of the 6,200 miles of planned        spending from 2018 to 2020
   additions are for reliability, about 13% are for          ∙∙ From 2017 to 2018, transmission rate base
   renewable resource integration, and many of the miles      growth* slowed to 9.3%, a significant
   are planned for the Midwest, as well as the Rocky          decrease compared to the previous three                      Over 500 Circuit Miles
   Mountain West and Mid-Atlantic, and other areas with       years: 13.1% from 2016 to 2017, 15.8% from     250–500 Circuit Miles      Under 250 Circuit Miles
   high amounts of wind penetration (see figure at right)     2015 to 2016, and 19.0% from 2014 to 2015                                             Source: NERC
You can also read