A Chain Reaction: Disruptive Innovation in the Electricity Sector - OECD.org
←
→
Page content transcription
If your browser does not render page correctly, please read the page content below
A Chain Reaction: Disruptive
 Innovation in the Electricity
           Sector
A Chain Reaction: Disruptive
Innovation in the Electricity
SectorPlease cite this publication as: OECD (2018), A Chain Reaction: Disruptive Innovation in the Electricity Sector, www.oecd.org/competition/A-chain-reaction-disruptive-innovation-in-the-electricity-sector.htm This work is published on the responsibility of the Secretary-General of the OECD. The opinions expressed and arguments employed herein do not necessarily reflect the official views of the OECD or of the governments of its member countries or those of the European Union. This document and any map included herein are without prejudice to the status of or sovereignty over any territory, to the delimitation of international frontiers and boundaries and to the name of any territory, city or area. © OECD 2018
│3

                                                           Foreword

          Innovative technologies and business models can help countries to use renewable
          distributed energy resources efficiently and hence facilitate the transition to a low-carbon
          economy. The growing number of small producers that both consume and produce
          (“prosumers”) increases connectivity between participants in the electricity market. With
          a two-way connection to the grid, prosumers can buy from the grid when renewables go
          off-line (or when the price is low); and can sell to it when they have a surplus (or when
          prices are high). These resources add to the share of renewable generation on which the
          grid increasingly relies. However, intermittency problems arise because these energy
          sources, although often free, are also variable. This intermittency appears set to trigger a
          further round of disruptive innovation since it creates incentives for new technologies and
          business models that may disrupt traditional models and cut costs by balancing the grid
          more efficiently.
          This report explores the impact that these innovations are likely to have on the electricity
          sector and examines priorities for regulatory policies that governments will need to put in
          place to negotiate the energy transition to a zero-carbon economy.
          The report was prepared by Chris Pike of the OECD Competition Division with the help
          of Dirk Röttgers of the OECD Investment Division following the OECD Competition
          Committee Roundtable on Radical Innovation in the Electricity Sector (1). This report
          contributes to the OECD Going Digital project that provides policy makers with tools to
          help economies and societies prosper in an increasingly digital and data-driven world. For
          more information, visit www.oecd.org/going-digital.

A Chain Reaction: Disruptive Innovation in the Electricity Sector © OECD 2018
│5
Table of contents
Foreword ................................................................................................................................................ 3
1. Introduction ....................................................................................................................................... 7
2. The disruptive appearance of renewable distributed energy resources ....................................... 8
What is a distributed energy resource? ................................................................................................ 8
Why is distributed energy resource capacity growing? ....................................................................... 9
3. The impact on retailers: intermittency and innovation ............................................................... 11
The intermittency problem................................................................................................................. 11
The State Directed Approach ............................................................................................................. 13
The Market Driven Approach ............................................................................................................ 14
Model 1: Demand response ............................................................................................................... 14
Model 2: Battery storage.................................................................................................................... 18
Model 3: Trading ............................................................................................................................... 18
4. The impact on the grid .................................................................................................................... 24
The grid as a platform ........................................................................................................................ 24
The impact of DER on the grid .......................................................................................................... 25
5. The impact on consumers – the pros(umers) and cons(umers) ................................................... 27
The impact of Prosumerism ............................................................................................................... 28
The impact of different innovations ................................................................................................... 28
6. Regulation will have a key influence on the direction that is taken ............................................ 29
Regulatory neutrality to maintain a level playing field...................................................................... 30
Pro-active regulatory steps to drive the energy transition.................................................................. 31
Competition agencies will need to be alert and pro-active ................................................................ 32
Notes ..................................................................................................................................................... 34
References ............................................................................................................................................ 39
Figures
Figure 1. Actual 2012 and Predicted Net load (California) – 11 January ............................................. 11
Figure 2. Actual Net load, 2012-2018 (California) – 25 April .............................................................. 12
Figure 3. Hourly average breakdown of total production by resource type
(California) – 25 April 2018 .......................................................................................................... 13
A Chain Reaction: Disruptive Innovation in the Electricity Sector © OECD 20186│
Boxes
Box 1. Distributed energy in emerging and developing countries ........................................................ 10
Box 2. Energy blockchain ..................................................................................................................... 20
Box 3. Examples of platforms that enable P2P trading ......................................................................... 21
Box 4. Micro-grids ................................................................................................................................ 26
Box 5. Capacity markets in the United Kingdom .................................................................................. 30
A Chain Reaction: Disruptive Innovation in the Electricity Sector © OECD 2018│7
1. Introduction
The rise of the digital economy has caused disruptive innovation of business models in
numerous markets. This has shaken incumbent firms and benefited consumers. Electricity
markets have also been disrupted by new types of generation, though this disruption has
not been entirely organic or spontaneous. Instead, government intervention and
entrepreneurialism has played an important role in stirring this disruption. To realise
potential benefits, the sector must adapt to two important features of these new models.
The first feature often involves “distributed energy resources (DERs)” provided by
producers who both produce and consume, which increases connectivity between
participants in the electricity market. The second, by increasing renewable generation
capacity, exacerbates a problem of “intermittent”, or variable, supply.1 The impact of
these changes is pushing both markets and regulators to move to prices that change over
time and by location (real-time location-based pricing) in order to manage local
imbalances between demand and supply.
More efficient pricing will incentivise the introduction of innovations that threaten to
disrupt the existing business models of both retailers and grid operators. This report
explores the impact that growth of renewable DERs is likely to have on the electricity
sector and examines priorities for the regulatory policies that governments will need to
negotiate the energy transition to a zero-carbon economy. Section 2 explains what
renewable DERs are and why they are growing. Sections 3-5 set out the prospective
impacts on retailers, the grid and consumers. It is too early to predict where this upheaval
in the market will lead. The future is uncertain and the direction unclear, but however it
plays out, and whichever innovations gain momentum, the prospect of lower prices will
help governments to negotiate the energy transition.
One possibility is that business models that increase our interconnectedness will thrive. In
the 21st century, these businesses might disintermediate supply chains and connect us
directly, allowing users to sell unused (or cheap) energy through digital trading platforms,
like an Airbnb for electricity. They might also interconnect the great (often state-
sponsored) infrastructural achievements, electricity grids that first connected us in the 20th
century, which would help to facilitate trade with those located in more distant locations.2
Another possibility is that business models that disconnect us and instead bet on the
localisation of electricity markets might prosper. These might allow consumers and local
communities to become self-sufficient by generating and storing their own electricity,
enabling them to cut their costs by going off-grid. Most likely, a combination of models
involving demand response, storage, and trading, will emerge to help governments
negotiate the energy transition in the smoothest possible fashion. However, as with all
transformational changes, the effects are unlikely to fall equally upon all households and
may result in distributional effects (section 5). The report finishes in section 6 by looking
at the role that regulators and competition agencies can play in helping to facilitate an
efficient energy transition. For example, regulation needs to be proactive in facilitating
innovation, while remaining neutral between the different types of innovative business
A Chain Reaction: Disruptive Innovation in the Electricity Sector © OECD 20188│
model that are emerging. This means creating the infrastructure, such as smart meters,
that are required for change, using dynamic pricing tariffs as a default, setting out
proportionate regulation for prosumers, and setting up regulatory sandboxes for emerging
business models. Meanwhile, competition agencies need to watch carefully for signs of
strategic entry deterrence by incumbent retailers and grid operators, and for acquisitions
of start-ups that reduce potential competition.
2. The disruptive appearance of renewable distributed energy resources
The current disruption of the market begins with the appearance of renewable DERs.
What is distributed energy and why is it growing?
What is a distributed energy resource?
Traditionally power stations were few in number, large in size, powered by fossil fuels,
and heavily reliant on a huge grid to send their electricity over long distances.3 In
contrast, DERs are small-scale power generators, typically renewable, that are distributed
or scattered across a region, instead of centralised in one location4 They include:
photovoltaic solar panels (PV) that households may install on their roof or that farms and
businesses might install on their land; as well as small wind turbines; small hydro-kinetic
units; and small biomass, biogas, and geothermal energy generating units. In 2015,
installed global DER capacity was estimated to be 135 Gigawatt (GW),5 or 2.1% of a
total capacity of approximately 6 414 GW in 2015 (IEA, 2017a, p.666).6 However, some
industry estimates suggest that DER capacity will grow to more than 530 GW by 2024,
by which time the deployment of DER capacity will be outstripping the deployment of
centralised generation capacity by more than 5-to-1.7 In some countries, DER is already
playing a bigger role. In Germany, for example, where renewables account for a third of
installed generating capacity, systems below 1 MW accounted for 68% of all solar PV
capacity added to the country’s grid in 2014.8
DER can be provided with one or two-way connections either to the central grid or into a
local micro-grid (which itself might have a one or two-way connection to the central
grid). The two-way connection allows households or businesses to both receive and
deliver the electricity they generate (and do not store) onto the grid. With a two-way
connection, prosumers can trade their unused or unwanted electricity. In 2015, there were
nearly 5 million prosumers in the European Union and some estimates suggest that 83%
of EU households will become prosumers by 2050 (CE DELFT, 2016). There has also
been a steady growth of solar household and business prosumers in the United States,
though this growth was interrupted in 2017 (SEIA, 2017).
One important threat to the growth of installed prosumer capacity is the response to
complaints from domestic solar module and cell producers against producers of imported
products. For instance, in the United States, following a complaint by Suniva and
SolarWorld, the US International Trade Commission in September 2017 found that
modules and cells imported from Mexico, Korea and Canada had injured domestic
producers. Suniva and SolarWorld requested that minimum prices or quotas be imposed
A Chain Reaction: Disruptive Innovation in the Electricity Sector © OECD 2018│9
upon imported products, which, it was argued, could double the cost of solar installation.
In November 2017, the Commission recommended that 30% tariffs and quotas be applied
and these were approved in January 2018. Solar generators expect these tariffs to reduce
US solar installations by 11% by 2022 as well as 23,000 job losses in the first year.9
Why is distributed energy resource capacity growing?
There are a number of drivers behind the growth of distributed energy.
Firstly, industrial and environmental policy provided strong support for increasing the
share of renewable electricity capacity, not only through centralised generation (fixed-
tariff power purchasing agreements, PPAs) but also through consumer level initiatives
such as net metering, and feed-in tariffs that have been important incentives for those
considering becoming prosumers.10 For instance, in the United States, ARPA-E was
launched in the wake of the financial crisis and has enjoyed considerable success in
stimulating innovation and developing clean, affordable, and reliable energy (National
Academy of Sciences, 2017).
There has been some concern about the distortionary effect of these subsidy policies
(OECD, 2010). However, the market is already distorted by failure to account for
negative externalities created by fossil fuels and subsidies and support measures for fossil
fuels.11 Policies that support an expansion in the capacity of renewable generation
counteract that distortion. Policies to support the expansion of renewable DER also help
to counteract the inefficiency caused by sending electricity over long distances. For
instance, around 8% of electricity is lost (up to 20% in India, and even more in
developing countries) as it travels across the grid through the transmission and
distribution system.12 Losses from distributed generation are, in contrast, much lower
since the electricity does not travel as far.13 Moreover, as explained below. Results of this
policy support appear to have had the welcome effect of pushing this highly regulated
market to adopt more efficient pricing arrangements. Therefore, the impact of any
distortions from the policy of expanding renewable DER capacity may be less important
than it appears when considered in isolation.
Secondly, rising electricity prices have made it more attractive for consumers to begin
generating their own electricity, both to reduce the quantity they purchase from the grid
and in order to sell to the grid at a higher price.14 In addition, part of the higher price is
taxes that help finance renewable generation. It is therefore unsurprising that consumers
have invested in subsidised renewable generation capacity since this allows them to
recapture some of the higher price they pay to fund these subsidies.
Thirdly, the cost of photovoltaic technology has fallen substantially. For large generators,
by 80% between 2010 and 2015, and this continues to fall (e.g. USD 1.80 per watt in the
United Kingdom in 2013, down to USD 1 per watt at the start of 2017, and just
US 65 cents per watt in India).15 Moreover, estimates suggest this cost is likely to
continue falling by a further 27% over the next five years.16 Falling costs come at a time
when consumers are becoming increasingly familiar with the idea of selling the capacity
they do not use (or attach little value to) through digital trading platforms, and
increasingly consider this when investing (e.g. to buy a house).
More generally, for developing countries, small scale distributed generation is an
attractive solution where the grid infrastructure is not in place to transport energy from
centralised power stations into people’s homes (see Box 1).
A Chain Reaction: Disruptive Innovation in the Electricity Sector © OECD 201810 │
Box 1. Distributed energy in emerging and developing countries
Distributed generation can be a particularly good opportunity to increase energy access in
emerging and developing countries. In advanced countries, DER is disruptive as it
changes an existing market. However, in emerging and developing countries, it can help
to establish a previously non-existent electricity market. As of 2014, 15% of the world's
population were without access to electricity, of which almost all lived in developing
countries, and the vast majority in rural areas where connection to the grid would be
costly (World Bank, 2017).
DER can help to connect rural areas in emerging and developing countries, overcoming
the challenge of connecting small villages and towns to a country's grid. In many
developing countries that use DER already, distributed solar electricity is the favoured
technology. The geography of many developing countries provides the resource for solar
panels to work efficiently. This helps build micro-grids and off-grid electricity generation
that does not have to rely on a regional or national grid. Falling prices for DER
components are likely to accelerate this development (World Bank, 2017).
In addition to the challenges pointed out in this chapter, DER in emerging and developing
countries suffers from particular drawbacks. The lack of economies of scale, and
especially transportation costs, can hinder the scaling-up of distributed electricity. Rural
areas that are not yet connected to the regional or national electricity grid are also likely
to be poorly connected to roads or railroads. Further, remote micro-grid and off-grid
installations need maintenance, and therefore specialist personnel who may not be readily
available in rural areas, or only at high cost.
Despite challenges for DER in emerging and developing countries, several business
models are helping DER installations to succeed. These include Pay-as-you-go
programmes, leases, and direct cash sales (GOGLA, 2017). Some, more technically
advanced methods, even implement micro-grids using existing decentralised
telecommunications technology. This technology can also allow companies to manage
payments and, more generally, their customer relationships.
To help overcome challenges and provide financing, some emerging and developing
countries have adopted policies to support DER. Net-metering, as explained below, is a
popular policy in emerging and developing countries (REN21, 2017). In other cases,
incentives are provided to encourage small and distributed energy generation to be built
away from residential areas (OECD, 2016). This offsite electricity generation can then be
used to offset electricity use onsite. It therefore effectively allows net-metering for
physically separated units of a company or household.
Micro-grids and off-grid installations in emerging and developing countries allow for a
bottom-up energy development approach. Conventionally the main regional or country
grid would be extended to remote areas. However, with DER, development can be
decentralised and wherever it is needed most, independent of the grid. Provided
technology allows, DER can be integrated into the main grid later, in principal forming an
electricity distribution similar to advanced countries that connect DER into existing grids.
A Chain Reaction: Disruptive Innovation in the Electricity Sector © OECD 2018│ 11
3. The impact on retailers: intermittency and innovation
While disrupting traditional business models for electricity generation, DER also
exacerbates the challenge of intermittent supply in renewable generation. If this triggers a
move to real-time location-based pricing (prices that vary over time and by location on
the grid) this will in turn incentivise the introduction of innovations that disrupt existing
retailer business models.
The intermittency problem
The variability of weather dependent renewable power sources, be they distributed or
otherwise, creates an intermittency problem that poses a challenge for the market. As
renewable generation increases, this challenge gets bigger by the year. Solar panels, for
example, generate electricity for approximately 10-30% of the time, i.e. during daylight
hours on sunny days. Where solar generation adds significant capacity, it can have a big
effect on net demand from the grid. This can be seen by taking the forecast load (demand
for electricity) and subtracting the contribution from electricity produced from
intermittent renewable sources. This gives the famous graph (Figure 1) of “net load”
requirements (known as the “duck curve”).
Figure 1. Actual 2012 and Predicted Net load (California) – 11 January
(Electricity demand net of intermittent renewable supply)
Source: California Independent System Operator, 2016,
https://www.caiso.com/Documents/FlexibleResourcesHelpRenewables_FastFacts.pdf.
A Chain Reaction: Disruptive Innovation in the Electricity Sector © OECD 201812 │
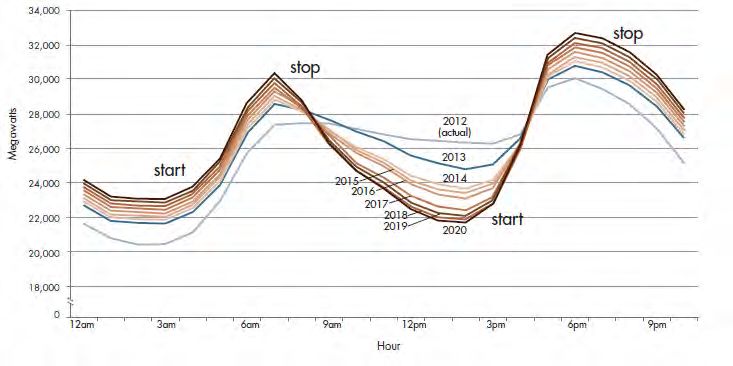
Figure 2. Actual Net load, 2012-2018 (California) – 25 April
(Electricity demand net of intermittent renewable supply)
30,000
28,000
26,000
2012
24,000
2013
22,000
2014
20,000
2015
18,000 2016
16,000 2017
14,000 2018
12,000
10,000
1 2 3 4 5 6 7 8 9 10 11 12 13 14 15 16 17 18 19 20 21 22 23 24
Source: CAISO, 2018 and OECD calculations.17
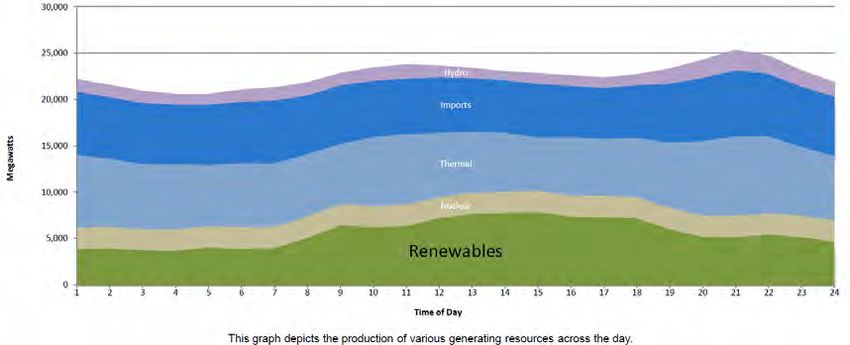
Figure 1 shows that at 4 pm in California – as the sun goes down, solar production falls,
people get home from work and electricity demand increases - a large and growing
shortfall opens up between demand and the supply that must be provided by sources other
than intermittent renewables. In the absence of storage capacity, this needs to be met by
other sources of generation (nuclear, hydro, coal, gas etc.). To meet this shortfall, a
capacity that is 50% larger than that feeding the grid at 1 pm is required. This means that
the grid will need an increasingly large capacity that will not be used during the day (see
the energy mix in Figure 3). This underutilisation has an efficiency cost, since it means
grid operators need to increase the network’s capacity so that peak demand can be
covered and blackouts avoided. This investment inevitably inflates consumer bills.
The steady increase in the variability of the “net load” over time as reliance on
renewables increases is evident from the progressive deepening of the “belly” of the
curve shown in Figure 1. Indeed the predictions made when the curve was first drawn in
2012 have already been exceeded (the belly is deeper than predicted). The same trend is
now also observable in Hawaii and South Australia.18 Moreover, it seems likely to spread
to Arizona, Georgia, Nevada, North Carolina, Texas and beyond in the not-too-distant
future. While it is less evident where solar production per capita is much lower (e.g.
France), India, Germany, Italy and the United Kingdom are all anticipating similar issues
to arise over time.19, 20 Reducing the fixed costs involved in maintaining the capacity to
respond to peak demands requires finding ways to flatten the net load curve. This requires
that either: a) renewable capacity is reduced (thereby reducing the depth of the dip at
1 pm); b) demand is reduced and/or moved (reducing the morning and evening peaks);
c) the shortfall is plugged by trading renewable power generated in regions still
generating with renewables at that time of the day; or d) that production during the day is
stored locally and used in the evening.
A Chain Reaction: Disruptive Innovation in the Electricity Sector © OECD 2018│ 13
Figure 3. Hourly average breakdown of total production by resource type
(California) – 25 April 2018
Source: CAISO, 2018.
While reducing renewable capacity – or curtailing generation from capacity already
installed – would reduce intermittency, it would make it almost impossible to meet the
commitments made under the Paris Agreement on Climate Change to keep the global
temperature rise this century well below 2°C.21 IEA estimates suggest, for example, that
unless additional flexibility measures are developed in Europe, it will not be possible to
increase the generation share of variable renewables beyond 27% (IEA, 2017b), despite
the need for a share of around 60% to meet the 2°C target.22 Instead, generation from
renewable sources would be curtailed (turned off) and replaced by other sources of
generation, including gas-fired generation that would emit additional carbon dioxide
(CO2).
Reliance on renewable sources should therefore be expected to rapidly increase over the
next decade, thereby exacerbating the intermittency problem. For example, California’s
solar capacity is expected to hit 34.5 gigawatts by 2022 against peak springtime demand
of under 30 gigawatts.23 In this context, while each of the other responses might play
some role in resolving or at least mitigating the problem, the question remains as to which
will dominate, and how they might come to do so, for example, will they be directed by
the state, or will they emerge as market solutions.
The State Directed Approach
One way to address the challenge is through a ‘state directed’ approach, in which
government intervenes directly (perhaps via its state controlled entities) to invest in, or to
favour one or more of the three options. However, in the absence of any signals to guide
it, the state’s ability to identify the most efficient of the three solutions, to identify and
effectively support the most efficient business models for achieving that solution, and to
gauge that support in order to ensure the model delivers an efficient share of the burden,
is highly doubtful. This is not to say that state owned (or controlled) enterprises might not
play an important and active role in developing these models, simply that they and other
enterprises will require reliable signals that provide direction on where to focus their
efforts and investments.
A Chain Reaction: Disruptive Innovation in the Electricity Sector © OECD 201814 │
The Market Driven Approach
The alternative way to make the necessary adjustments is to take a market-based
approach that uses price signals that reflect immediate local market conditions. Ideally,
the price that energy consumers face should equal the marginal cost to the network of
additional generation at that time and in that location. For example, at times of mild
demand in regions generating huge supply, the price of generation might be zero or even
negative (as is already happening in California).24 This would reflect the fact that the
marginal cost of generating an additional kilowatt at that time and place is wasteful and
inefficient for the network. In contrast, when demand is high and supply is scarce the
price will surge. The variations in these real-time local prices across the day then creates
an opportunity for profit for those that invest in solutions that better balance supply and
demand.25
Crucially, efficient real-time location-based pricing does not only incentivise investment
in effective balancing solutions. It also rewards those solutions and business models that
address the problem in the way that best reflects the trade-offs that energy consumers
themselves would make. For instance, where energy consumers can choose between
models, they can select those that offer them the most value, not only in terms of cost but
also in terms of usability, reliability and risk. In effect, real-time location-based pricing
therefore creates the business case for investing in the types of technology and business
model that provide the solutions that energy consumers want.26 Furthermore, real-time
location-based pricing offers the most efficient solution to renewable generation’s
intermittency problem. This makes it likely that the shift towards renewable energy
resources has been and will be a key driver of a regulatory move to adopt real-time
location-based pricing (see below).
The remainder of this section identifies some of the business models that, if real-time
local pricing becomes a reality, may compete to shape the future, or at least to carve a
niche within it. It describes these models and how they create value, before considering
where they currently stand and what is required for them to disrupt the market.
Model 1: Demand response
The first set of business models helps demand to respond to real-time location-based
pricing. These models can be broadly categorised into those that help consumers to
respond individually and those that allow consumers to outsource their response to an
intermediary that aggregates those responses across a larger consumer group.
Individual response
The most straightforward of these models is one in which retailers simply pass on the
real-time location-based prices to consumers by offering real-time (or “dynamic”) price
plans. These plans send direct price signals to consumers to shift their consumption to use
more electricity when supply in their location is ample, rather than when demand is high
and supply is scarce.27 To be most effective, these plans will have to ensure that the price
signal is successfully transmitted and is not smothered by other costs that are typically
reflected in retail consumers’ energy bills. In the European Union for example, the price
of energy is just a third of the average consumers’ retail bill. The remainder is the price of
network access and taxes.28
A Chain Reaction: Disruptive Innovation in the Electricity Sector © OECD 2018│ 15
Given the difficulties that consumers have demonstrated in engaging in electricity
markets, significant doubt exists about the extent to which the additional information
from smart meters and the incentives from dynamic prices will change consumer
behaviour. Recent research in the United States suggests that consumers do react to price
cuts, at least initially.29 For instance, it found that consumers reduced their power usage
by approximately 12% when they received text messages notifying them that prices were
higher. However, it found broadly the same response to price hikes of 5 cents per
kilowatt-hour as to increases of 3 dollars per kilowatt-hour. This suggests that consumers
may have just a few simple heuristics/rules-of-thumb that they use to respond to price
signals. While automated devices might make consumers more sensitive to price changes,
all of this additional information seems unlikely to work for everyone. Many customers
may prefer instead to outsource their demand response to a firm and allow the firm to
take a share of the savings that can be made by responding to price signals.
Outsourced response
One option for consumers who want to outsource their response is an “aggregated
demand response programme”. This involves an intermediary, for instance a demand
aggregator, a retailer, or a utility, agreeing a contract to provide cheaper electricity to a
consumer in exchange for the aggregator being able to cut or reduce supply, for example,
when the price increases above a specified value.30 The aggregator then sells this potential
flexibility onto the market where parties that are responsible for balancing the grid
purchase can purchase it. This allows the aggregator to earn a margin that it can divide
between the price reduction that it offers to attract consumers, and a share that it takes as
profit. This framing of the programme has the helpful appearance of paying consumers
for reducing their demand below a baseline that reflects their normal energy use, rather
than charging them more for using energy when it is scarce.
Aggregated demand response programmes have already proved to be successful where
firms sell to industrial customers. However, they have proved less successful with
residential customers. In Europe, the increase in renewable generation and continued
overcapacity of non-renewable generation has meant that for now, there is always
sufficient capacity, and so the value of demand responses from households is small. This
has in some cases led to misguided attempts to subsidise residential demand response
aggregators.31
In US households, the model is more popular, as the gains from responding can be bigger;
however, more fundamental issues have arisen with the model. In particular, firms have
been unable to identify a reliable baseline counterfactual for what “normal” use would
have been in the absence of the demand response. This can lead to aggregators delivering
large reductions in demand on a given day, but failing to obtain a discount from the grid
operator.
For example, on unusually hot days, air conditioner usage will be much higher than
accounted for in the baseline. This is because the baseline for that day is typically set on
the previous year’s usage on that date, which was not as hot. As such even a dramatic
reduction in usage on the day might fail to bring demand down to below the expected
baseline for the day. If that happens, the reduction is not recognised and the aggregator is
not paid for delivering anything, but nevertheless has to pay its consumers for reducing
their demand, and so loses money. This blocks price signals and damages the business
case for aggregating demand response.
A Chain Reaction: Disruptive Innovation in the Electricity Sector © OECD 201816 │
Setting the baseline using the amount of demand prior to the reduction is an alternative
option. However, this allows aggregators to game their baseline by inflating demand to
engineer discounts for their subsequent reductions. See, for example, the case of the
Baltimore baseball stadium that left the lights on all day in order to raise its baseline and
obtain discounts for turning them off. More generally discounts for demand reductions
from any baseline inevitably hand discounts to many consumers that are not actually
changing their behaviour but are simply fortuitously using little energy at the time (e.g.
they are out of the house that night).
Of course defining a baseline for normal consumption at each time of the day is only
necessary because it allows the firm to characterise the programme as a discount or
payment to consumers for reducing their demand. Setting a baseline of zero and charging
for each unit consumed would resolve these issues. Moreover, once again this need not
involve the consumer paying the dynamic price. It is simply the price that the consumer
would have to pay if they were to choose not to fix part, or all, of their payment in
advance. In this sense, it is comparable to the walk-up price of an airplane ticket (or a taxi
ride) which many (few) consumers tend to purchase in advance in order to insure
themselves against the risk of a high real-time price.
As in insurance markets, better value can often be found if the consumer permits the
insurer (in this case the aggregator) to monitor their behaviour (e.g. car-driving monitors)
and use risk avoidance devices. In this case, intermediaries might offer a cheaper fixed
price plan to consumers that want a fixed price in exchange for fitting sensors and
automated devices around the home that enable the firm to increase the energy efficiency
of the home or system and thereby reduce the energy purchased during high price phases.
Large reductions in the cost of such sensors and the so-called Internet of things (IoT)
which enables devices to communicate directly with a service provider, make this
increasingly feasible. However, the profitability of this model will depend on the
variation in the real-time electricity price.
In this model, the firm monitors dynamic wholesale prices and is able to respond using
sensors and automated technology to adjust the household’s energy consumption to fit
into the most cost efficient pattern that can be achieved without compromising the
consumer’s level of comfort. For example, appliances like washing machines can be
defaulted to run during price troughs, while air conditioning, heating and lighting can be
dialled down during price peaks.
These intermediaries might be demand aggregators, or existing retail utility firms, but
could also be the Electricity Service Companies (ESCOs) that already provide these
services to factories, buildings and other large customers. ESCOs might be well placed to
bring this energy efficiency service into a residential setting as the cost of sensors
diminishes and the automation of the home becomes a reality. Indeed, it may be that
Multi-Utility Service Companies might emerge that provide efficient electricity services
alongside efficient water, electric vehicle, and waste services.
Consumers on dynamic price plans who do not want to split the profit made from demand
response with a firm can also purchase and set up these technologies themselves in the
same way that some investors prefer to manage their own investment portfolios. For these
consumers, the more relevant business models will be those that offer (perhaps as a
bundle) dynamic price plans alongside the devices and software they need to manage
their demand themselves, or that offer access to wholesale markets via an online
platform.32 Such consumers may also purchase insurance to effectively fix or partially fix
their retail price, in which case firms that only offer insurance might have a role to play.
A Chain Reaction: Disruptive Innovation in the Electricity Sector © OECD 2018│ 17
How developed is this model?
Demand response requires real-time location-based prices, and these are beginning to
appear in a number of countries. They are becoming increasingly popular in New Zealand
where the fastest growing retailer in the market is offering a tariff based on the real-time
local price (as are two other retailers).33 Nearly half the customers from Arizona’s largest
utility, APS, are on time-of-use rates. In the European Union, dynamic price plans are
becoming popular in some countries. For example, in Finland, approximately 10% of the
population is on a dynamic price plan.34 In Estonia, the figure is nearer to 35%, helped by
the early rollout of smart meters. In Norway, 65% of electricity delivered is purchased on
spot-indexed prices – including 90% of customers of its largest retailer (Hafslund).35 This
will increase since under new European Commission rules it will become mandatory
from 2020 onwards for firms to offer European consumers an option to choose a dynamic
price plan.
Some countries have already gone a step further, and provided a regulatory nudge by
making dynamic price plans a default option. For example, Spain introduced default
dynamic price plans for all small consumers (less than 10 KW) and now has 12.1 million
customers on these plans. Denmark introduced a default spot price plan for all households
in 2017 and California is also preparing to transition customers to default time-of-use rates.36
This reflects insights drawn from behavioural economics that have identified significant
inertia and reluctance to switch energy providers, even where lower prices are available.
Worryingly, studies also suggest that many of those residential consumers who switch do
so to tariffs that result in them paying more than they previously did, suggesting an
inability to process information and predict their future usage (Wilson & Waddams Price,
2010, pp 647-668). However, smart meters that collect data on when and how much
electricity consumers use will allow those consumers that are willing to share that data, to
obtain much more accurate quotes, and hence to make better switching decisions.
In terms of outsourced demand response, estimates suggest that global demand response
accounted for approximately 39 GW in 2016, growing to an expected 144 GW in 2025.37
Much of this remains industrial and public buildings, even if on the west coast of the
United States residential demand response accounted for approximately 20% of
committed capacity.38 Industry bodies in Europe suggest that despite progress, significant
regulatory barriers to demand response remain (SEDC, 2017). Indeed, estimates of the
current value of demand response in Europe are extremely low, partly as result of current
overcapacity.
Smart meters have already been rolled out across many countries and are in the process of
being rolled out across others. The cost of sensors is just 2% of the 2008 level and so IoT
solutions are already viable (IEA, 2017b). Therefore, there are few technical barriers to
this model. Indeed, the ESCO market is already considerable – USD 26.8 billion
worldwide in 2016, half of which is in China and growing quickly (IEA, 2017b).
However, for now, the vast majority is accounted for by the industrial, rather than the
residential, market.
Demand response in its various forms is therefore perhaps the most developed of the
innovations that are looking to tackle the intermittency issue. However, it remains small
relative to its potential. The IEA estimates that globally around 6900 TWh (terawatt
hours) of consumption could be flexed under demand response programmes by 2040,
around 20% of total consumption at that time (IEA, 2017c). Under a scenario assuming a
continuation of existing policies and trends, without ambitious additional action, the IEA
assumes that 15% of this potential flexibility might be included in demand response
A Chain Reaction: Disruptive Innovation in the Electricity Sector © OECD 201818 │
programmes by 2040, providing 185 GW of flexibility.39 Access to this additional
flexibility would avoid approximately USD 270 billion in investment in additional
generation capacity. The majority of this flexibility is hoped to come from residential
sources, and so the IEA envisages that in 2040 a billion consumers will participate in
demand response programmes using 11 billion connected appliances and 150 million
electric vehicles.
Model 2: Battery storage
Perhaps the simplest solution is for innovative firms to improve the ability of generators
(both centralised power plants and decentralised prosumers) to store the energy they
generate and allow them to sell it onto the grid when the price is higher. Storage solutions
might take the form of huge battery farms,40 household appliances the size of a washing
machine,41 or the batteries of electric vehicles via vehicle-to-grid (V2G) systems.42
Centralised power plants and decentralised prosumers would each be increasingly willing
to pay for the capability to store their energy as the variation in price increases. The risk
of power outages and grid failure (for instance resulting from natural disasters) could also
be expected to drive demand for storage solutions. Prosumers might therefore begin to
purchase a battery in the way that they purchase a household appliance, with an upfront
fee and some extended warranty.
How developed is this model?
At this stage, the cost of battery storage has fallen by 85% since 2008 but remains
significant (IEA, 2017d). More importantly, most prosumers do not face dynamic prices
themselves and so have little incentive to invest in battery storage. Therefore, the business
case for purchasing in order to arbitrage and help balance the grid is a weak one.
However, with costs rapidly falling, and the new rights for prosumers in the European
Union to receive a spot price on the energy they sell to the grid, this may change and
trigger investment that benefits consumers around the world. In any event, the growth in
electric vehicles, which has been strengthened by pre-announced plans to ban petrol
fuelled cars, will increase the demand for battery storage (and associated incentives for
development of cost and size reducing technology) that might also strengthen the appeal
of this solution to energy prosumers. Firms such as Tesla are for example already active
in bridging these fields (electric vehicles, battery storage, and solar generation) in order to
exploit synergies.
The IEA reports that in 2016 additional non-hydro energy storage capacity was slightly
over 500 MW, and that nearly 1 GW of new capacity was announced in the second half
of 2016.43 The report envisages 21 GW of energy storage capacity being added by 2025
and suggests that growth in battery storage is on track to meet that goal. Navigant
Research reports that residential energy storage is expected to grow from approximately
95 MW in 2016 to 3 773 MW in 2025.44
Model 3: Trading
A third option is to purchase from alternative sources of supply when local prices are
high. These alternative sources can be connected to the local grid or they can be in more
distant locations where power supply is plentiful and prices lower. In the latter case, an
interconnection between local grids or a “super-grid” is required to facilitate this access.
These are considered in turn.
A Chain Reaction: Disruptive Innovation in the Electricity Sector © OECD 2018│ 19
Peer-to-peer trading
Purchasing from local distributed energy resources requires some form of peer-to-peer
(P2P) trading platform that can offer consumers and prosumers direct access to local
wholesale markets where they can buy and sell electricity.
Normally, where prosumers generate their own electricity they can deduct this from the
energy they purchase from their retailer. When they have a surplus that they are unable or
prefer not to use, they sell it back to the retailer. The price is typically regulated since the
retailer has considerable power to offer an extremely low price. However, with direct
access to market through a P2P platform they would have the opportunity to sell their
energy directly to other users. This cuts out intermediaries and potentially eliminates
costs while creating arbitrage opportunities.
For example, where prosumers have some storage capability, they might engage in small-
scale arbitrage by generating and storing their supply until the spot price hits a certain
threshold. At this point, they could draw on their stock of stored energy. For those
without storage capacity, access to the platform would create an incentive not just to
avoid buying expensive energy during price peaks, but also to avoid consuming their own
energy at such times. Any surplus energy that they can easily avoid using, could then
instead be sold onto the market at a significant premium (recall Figure 5 in which the spot
price varied from –USD 5 to USD 60 per MWh across a single day). As a result, the
Australian Energy Market Commission says a P2P trading platform could help
lower energy prices.45
Furthermore, P2P trading that is blockchain-enabled (Box 2) can remove the need for
electricity retailers and hence eliminate the costs that they incur. For instance, this
disintermediation avoids: the operating costs of the retailer, meter reading, billing,
payment reminders, debt collection process, banking costs and certification of renewable
energy, amongst others. Where P2P trading occurs with those that can only be accessed
via the distribution or transmission grid (rather than neighbours on a micro-grid), it will
not remove the need for the grid and an operator to transport the electricity and to manage
any congestion that arises. These costs would therefore need to be factored into the total
price paid in P2P transactions (again blockchain or more traditional means might be used
to identify the specific costs of a trade between two parties on the basis of their location
and the congestion at that time of the trade). This additional cost might be expected to
drive consumers to trade with more local producers and prosumers (or even those located
on the same micro-grid) when possible since the costs incurred in such trades would be
lower.
P2P trading platforms also create the opportunity for consumers to trade according to
their preferences. For example, consumers might prefer to buy from, and sell to, other
local renewable prosumers (or low-income households). The platform, or a blockchain
mechanism, may certify the identity of the counterparty to the trade and therefore enable
the platform to identify both the grid infrastructure utilised by each trade and any
congestion charge incurred at that time and place. This offers the basis for pricing that
reflects only the costs of grid elements that are used. Indeed, reforms along these lines
have already been proposed to the UK energy regulator by P2P energy platform firms
such as Open Utility.46 Prices would then be comparatively low for more local trades
since less grid infrastructure would be used to transport the electrons - for instance, the
transmission grid might not be involved at all, and less power would be lost during
transportation.47
A Chain Reaction: Disruptive Innovation in the Electricity Sector © OECD 201820 │
Box 2. Energy blockchain
Distributed ledgers for electricity
Smart meters record the electricity generated by one producer, and the electricity used by a consumer.
If the producer and the consumer agree to trade on certain terms then the contract terms, the electricity
feed-in to the grid, and the electricity consumption can all be recorded synchronously on a blockchain
to provide trust between the buyer, the seller and the network operator.
As with a traditional accounting ledger, a distributed ledger, or blockchain, records each deposit,
withdrawal and trade. However, it does not store the ledger on a central set of books or servers.
Instead, it stores the trading data across vast networks of computers that constantly check and verify
information with each other.
How it works
Individual electricity trades are grouped together in a block (e.g. all trades in the last five minutes). To
be added to the blockchain, this block needs to be validated by 51% of all the computers connected to
the blockchain. To validate the block, these computers need to solve complex mathematical equations.
They are incentivised to do so by the reward of earning a payment for being the first to solve an
equation. When a block is validated by 51% of these computers, it receives a timestamp and a ‘hash’
and is added to the blockchain in chronological order. This hash will form the basis of the next block
and ensures that the next block cannot be solved without reference to its place within the blockchain.1
Security
The blockchain is secure because it is distributed (not held in one place), consequential (no block can
be changed without changing the whole blockchain), open (any change can be seen by all), verifiable
(any error is obviously incorrect) and relies on consensus.
Trials
Blockchain-enabled P2P trades have been demonstrated around the world and are now attracting
investment from some of the biggest players in the energy market. The first trial was held in April
2016 in Brooklyn. This was conducted by LO3 Energy who have since partnered with Siemens to
provide micro-grids and have recently received investment from the UK energy giant Centrica. 2
Similar trials followed in Australia in August 2016. These were run by Powerledger who recently
raised AUD 34 million through an initial coin offering. It is currently working with local utility giants
(Origin in Australia, and Vector in New Zealand). 3
In Europe, Enerchain executed the first P2P electricity trade via blockchain at a conference in
Amsterdam in November 20164 Meanwhile Electron, in a consortium that included University College
London and EDF, and was supported by Siemens, has become one of the first entrants into Ofgem’s
regulatory sandbox with a P2P local energy-trading platform.5 Finally, Conjoule, a start-up backed by
Innogy Innovation Hub, that is running pilots in Germany recently received USD 5.3 million in
funding from Tokyo Electric Power Company and others. 6
1
This is in the case of public non-permissioned blockchains. However to speed-up transactions and reduce the very considerable
energy cost of transactions, firms are increasingly expected to instead use private permissioned blockchains that require solving
by a computer that has already been certified as trusted (and hence permissioned).
2
https://www.siemens.com/innovation/en/home/pictures-of-the-future/energy-and-efficiency/smart-grids-and-energy-storage-
microgrid-in-brooklyn.html ; and https://www.businesswire.com/news/home/20171024005282/en/LO3-Energy%E2%80%99s-
Innovation-Secures-Investments-Braemar-Energy
3
https://www.smartcompany.com.au/startupsmart/news-analysis/power-ledger-raises-34-million-one-australias-first-successful-
initial-coin-offerings/
4
https://enerchain.ponton.de/index.php/11-first-european-energy-trade-over-the-blockchain
5
www.trustnodes.com/2017/07/07/ofgem-starts-blockchain-sandbox-edf-energy-others
6
https://www4.tepco.co.jp/en/press/corp-com/release/2017/1443967_10469.html
A Chain Reaction: Disruptive Innovation in the Electricity Sector © OECD 2018│ 21
A P2P platform might be set up and/or operated by government (Box 3), by the grid, by a
not-for-profit consumer association, or by another firm (for example, a technology firm).
There might be just one or a number of competing platforms (as there are hotel-booking
platforms). Where a firm runs a platform it needs to find the optimal balance of charges
for each side of the market in order to increase volumes traded on the platform and
maximise its profit. It might therefore charge for membership, for use, or for both; it
might set the price of the transaction in the way that Uber sets the price that users pay to
drivers; or it might charge a commission in the way that Airbnb or Booking.com do. It
might even be that the platform is able to introduce a third side to the market and charge
advertisers in the way that YouTube does, allowing it to set zero, or close to zero prices
for both prosumers and consumers in exchange for them tolerating advertising messages
(e.g. delivered via their IoT-enabled appliances and vehicles).
Box 3. Examples of platforms that enable P2P trading
New York REV (Reforming the Energy Vision)
The New York REV project is “A new distribution level market for energy and related electric
products from distributed energy resources (DER) and a state-wide digital platform to facilitate
financial transactions in that market.”
The white paper for the project specifies that the platform will be responsible for three major
functions at the distribution level: integrated system planning, grid operations, and market
operations. […] DER would sell three core electric products in that market: real energy, reactive
power, and reserves. […] These core products can be bundled or unbundled, sold days ahead or in
real time, or aggregated individually in time and space.
It goes on to explain that the design of the new market draws upon extensive experience with
electric market design at the wholesale level. It suggests that a key lesson from that experience is
the importance of getting the price right. Prices in the new market should therefore reflect the
value of core electric products from DER as a function of the time at which DER produces those
products and the location at which DER produces them. 1
Piclo
In the United Kingdom, a firm, Open Utility, has piloted a P2P platform called Piclo, and is
extending the trial to the Netherlands (in partnership with the Dutch utility firm Essent) and Italy
(with the renewable generator ERG). It is also receiving funding from the UK government to pilot
a platform for the trading of flexibility.2 The platform collaborates with retailers rather than
bypassing them and so does not use blockchain technology. It explains that due to regulatory
restrictions the platform is not yet available to residential customers.
1 White Paper on Developing Competitive Electricity Markets and Pricing Structures (NYSERDA 2016)
https://sites.hks.harvard.edu/hepg/Papers/2016/TCR.%20White%20Paper%20on%20Developing%20Competi
tive%20Electricity%20Markets%20and%20Pricing%20Structures..pdf.
2 https://www.cleanenergynews.co.uk/news/efficiency/open-utility-scoops-beis-funding-for-groundbreaking-
flexibility-marketplace https://www.cleanenergynews.co.uk/news/solar/renewable-energy-trading-platform-
piclo-increases-global-reach-with-dutch-t.
The role of the platform may differ from that which has proved so profitable in other
markets. In particular, if the blockchain removes the need for a platform to provide trust
in the trading that takes place upon it, through its brand and/or review system, then a
competitive process might lead consumers towards a platform that involves just a simple,
A Chain Reaction: Disruptive Innovation in the Electricity Sector © OECD 2018You can also read