A Review of Solar Energy - Markets, Economics and Policies
←
→
Page content transcription
If your browser does not render page correctly, please read the page content below
Public Disclosure Authorized
                                                                                     WPS5845

                               Policy Research Working Paper                        5845
Public Disclosure Authorized

                                                 A Review of Solar Energy
                                                 Markets, Economics and Policies

                                                             Govinda R. Timilsina
                                                              Lado Kurdgelashvili
Public Disclosure Authorized

                                                               Patrick A. Narbel
Public Disclosure Authorized

                               The World Bank
                               Development Research Group
                               Environment and Energy Team
                               October 2011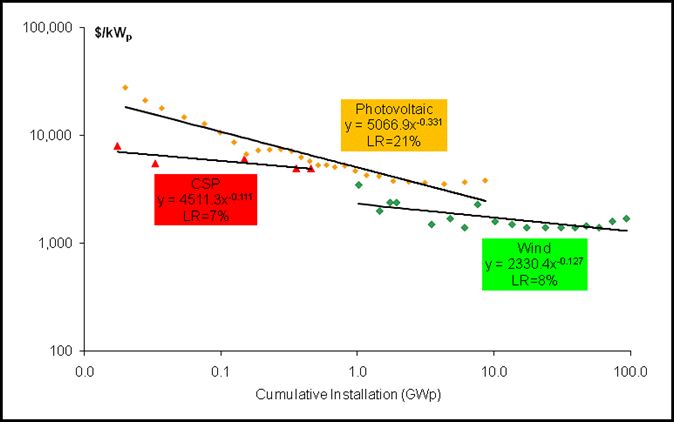
Policy Research Working Paper 5845

  Abstract
  Solar energy has experienced phenomenal growth in                                  standards and voluntary green power programs in
  recent years due to both technological improvements                                many countries. Potential expansion of carbon credit
  resulting in cost reductions and government policies                               markets also would provide additional incentives to solar
  supportive of renewable energy development and                                     energy deployment; however, the scale of incentives
  utilization. This study analyzes the technical, economic                           provided by the existing carbon market instruments,
  and policy aspects of solar energy development and                                 such as the Clean Development Mechanism of the
  deployment. While the cost of solar energy has declined                            Kyoto Protocol, is limited. Despite the huge technical
  rapidly in the recent past, it still remains much higher                           potential, development and large-scale, market-driven
  than the cost of conventional energy technologies.                                 deployment of solar energy technologies world-wide still
  Like other renewable energy technologies, solar energy                             has to overcome a number of technical and financial
  benefits from fiscal and regulatory incentives and                                 barriers. Unless these barriers are overcome, maintaining
  mandates, including tax credits and exemptions, feed-                              and increasing electricity supplies from solar energy will
  in-tariff, preferential interest rates, renewable portfolio                        require continuation of potentially costly policy supports.

  This paper is a product of the Environment and Energy Team, Development Research Group. It is part of a larger effort by
  the World Bank to provide open access to its research and make a contribution to development policy discussions around
  the world. Policy Research Working Papers are also posted on the Web at http://econ.worldbank.org. The author may be
  contacted at gtimilsina@worldbank.org.

          The Policy Research Working Paper Series disseminates the findings of work in progress to encourage the exchange of ideas about development
          issues. An objective of the series is to get the findings out quickly, even if the presentations are less than fully polished. The papers carry the
          names of the authors and should be cited accordingly. The findings, interpretations, and conclusions expressed in this paper are entirely those
          of the authors. They do not necessarily represent the views of the International Bank for Reconstruction and Development/World Bank and
          its affiliated organizations, or those of the Executive Directors of the World Bank or the governments they represent.

                                                        Produced by the Research Support Team
A Review of Solar Energy: Markets, Economics and Policies
Govinda R. Timilsinaa, Lado Kurdgelashvilib and Patrick A. Narbelc
Key Words: solar energy; renewable energy economics and policies; climate change
JEL Classification: Q42
We sincerely thank Manu V. Mathai, Ashok Kumar, Jung-Min Yu, Xilin Zhang, Jun Tian, Wilson Rickerson, and
Ashish Shrestha for research assistant and Ionnis Kessides, Mike Toman, Chandrasekar Govindarajalu, Mudit
Narain and Katherine Steel for their comments. We acknowledge the Knowledge for Change Program (KCP) Trust
Fund for the financial support. The views expressed in this paper are those of the authors and do not necessarily
represent the World Bank and its affiliated organizations.
a
Corresponding author and Senior Economist, Environmental and Energy Unit, Development Research Group, The
World Bank, 1818 H Street NW, Washington, DC, USA; b Center for Energy and Environmental Policy, University
of Delaware, 278 Graham Hall, Newark, DE 19716, USA; c Department of Finance and Management Science,
Norwegian School of Economics and Business Administration, NHH, Helleveien 30, NO-5045 Bergen, Norway1. Introduction
Solar energy has experienced an impressive technological shift. While early solar
technologies consisted of small-scale photovoltaic (PV) cells, recent technologies are represented
by solar concentrated power (CSP) and also by large-scale PV systems that feed into electricity
grids. The costs of solar energy technologies have dropped substantially over the last 30 years.
For example, the cost of high power band solar modules has decreased from about $27,000/kW
in 1982 to about $4,000/kW in 2006; the installed cost of a PV system declined from
$16,000/kW in 1992 to around $6,000/kW in 2008 (IEA-PVPS, 2007; Solarbuzz, 2006, Lazard
2009). The rapid expansion of the solar energy market can be attributed to a number of
supportive policy instruments, the increased volatility of fossil fuel prices and the environmental
externalities of fossil fuels, particularly greenhouse gas (GHG) emissions.
Theoretically, solar energy has resource potential that far exceeds the entire global
energy demand (Kurokawa et al. 2007; EPIA, 2007). Despite this technical potential and the
recent growth of the market, the contribution of solar energy to the global energy supply mix is
still negligible (IEA, 2009). This study attempts to address why the role of solar energy in
meeting the global energy supply mix continues to be so a small. What are the key barriers that
prevented large-scale deployment of solar energy in the national energy systems? What types of
policy instruments have been introduced to boost the solar energy markets? Have these policies
produced desired results? If not, what type of new policy instruments would be needed?
A number of studies, including Arvizu et al. (2011), have addressed various issues related
to solar energy. This study presents a synthesis review of existing literature as well as presents
economic analysis to examine competitiveness solar energy with fossil energy counterparts. Our
study shows that despite a large drop in capital costs and an increase in fossil fuel prices, solar
energy technologies are not yet competitive with conventional technologies for electricity
production. The economic competitiveness of these technologies does not improve much even
when the environmental externalities of fossil fuels are taken into consideration. Besides the
economic disadvantage, solar energy technologies face a number of technological, financial and
institutional barriers that further constrain their large-scale deployment. Policy instruments
introduced to address these barriers include feed in tariffs (FIT), tax credits, capital subsidies and
grants, renewable energy portfolio standards (RPS) with specified standards for solar energy,
public investments and other financial incentives. While FIT played an instrumental role in
2Germany and Spain, a mix of policy portfolios that includes federal tax credits, subsidies and
rebates, RPS, net metering and renewable energy certificates (REC) facilitated solar energy
market growth in the United States. Although the clean development mechanism (CDM) of the
Kyoto Protocol has helped the implementation of some solar energy projects, its role in
promoting solar energy is very small as compared to that for other renewable energy
technologies because of cost competitiveness. Existing studies we reviewed indicate that the
share of solar energy in global energy supply mix could exceed 10% by 2050. This would still
be a small share of total energy supply and a small share of renewable supply if the carbon
intensity of the global energy system were reduced by something on the order of 75%, as many
have argued is necessary to stem the threat of global warming.
The paper is organized as follows. Section 2 presents the current status of solar energy
technologies, resource potential and market development. This is followed by economic analysis
of solar energy technologies, including sensitivities on capital cost reductions and environmental
benefits in Section 3. Section 4 identifies the technical, economic, and institutional barriers to the
development and utilization of solar energy technologies, followed by a review of existing fiscal
and regulatory policy approaches to increase solar energy development in Sections 5 and 6,
including potential impacts of greenhouse gas mitigation policies on the deployment of solar
energy technologies. Finally, key conclusions are drawn in Section 7.
2. Current status of solar energy technologies and markets
2.1. Technologies and resources
Solar energy refers to sources of energy that can be directly attributed to the light of the
sun or the heat that sunlight generates (Bradford, 2006). Solar energy technologies can be
classified along the following continuum: 1) passive and active; 2) thermal and photovoltaic; and
3) concentrating and non-concentrating. Passive solar energy technology merely collects the
energy without converting the heat or light into other forms. It includes, for example,
maximizing the use of day light or heat through building design (Bradford, 2006; Chiras, 2002).
In contrast, active solar energy technology refers to the harnessing of solar energy to
store it or convert it for other applications and can be broadly classified into two groups: (i)
3photovoltaic (PV) and (ii) solar thermal. The PV technology converts radiant energy contained in
light quanta into electrical energy when light falls upon a semiconductor material, causing
electron excitation and strongly enhancing conductivity (Sorensen, 2000). Two types of PV
technology are currently available in the market: (a) crystalline silicon-based PV cells and (b)
thin film technologies made out of a range of different semi-conductor materials, including
amorphous silicon, cadmium-telluride and copper indium gallium diselenide 1 . Solar thermal
technology uses solar heat, which can be used directly for either thermal or heating application or
electricity generation. Accordingly, it can be divided into two categories: (i) solar thermal non-
electric and (ii) solar thermal electric. The former includes applications as agricultural drying,
solar water heaters, solar air heaters, solar cooling systems and solar cookers2 (e.g. Weiss et al.,
2007); the latter refers to use of solar heat to produce steam for electricity generation, also
known as concentrated solar power (CSP). Four types of CSP technologies are currently
available in the market: Parabolic Trough, Fresnel Mirror, Power Tower and Solar Dish
Collector (Muller-Steinhagen and Trieb, 2004; Taggart 2008a and b; Wolff et al., 2008).
Solar energy technologies have a long history. Between 1860 and the First World War, a
range of technologies were developed to generate steam, by capturing the sun‟s heat, to run
engines and irrigation pumps (Smith, 1995). Solar PV cells were invented at Bell Labs in the
United States in 1954, and they have been used in space satellites for electricity generation since
the late 1950s (Hoogwijk, 2004). The years immediately following the oil-shock in the seventies
saw much interest in the development and commercialization of solar energy technologies.
However, this incipient solar energy industry of the 1970s and early 80s collapsed due to the
sharp decline in oil prices and a lack of sustained policy support (Bradford, 2006). Solar energy
markets have regained momentum since early 2000, exhibiting phenomenal growth recently. The
total installed capacity of solar based electricity generation capacity has increased to more than
40 GW by the end of 2010 from almost negligible capacity in the early nineties (REN21, 2011).
1
While thin film technologies are less efficient than silicon based cells, they are cheaper and more versatile
than crystalline silicon based counterparts.
2
Suitable sites for installing solar thermal collectors should receive at least 2,000 kWh of sunlight radiation per
square meter annually and are located within less than 40 degrees of latitude North or South. The most promising
areas include the South-Western United States, Central and South America, North and Southern Africa, the
Mediterranean countries of Europe, the Near and Middle East, Iran and the desert plains of India, Pakistan, the
former Soviet Union, China and Australia (Aringhoff et al., 2005).
4Solar energy represents our largest source of renewable energy supply. Effective solar
irradiance reaching the earth‟s surface ranges from about 0.06kW/m2 at the highest latitudes to
0.25kW/m2 at low latitudes. Figure 1 compares the technically feasible potential of different
renewable energy options using the present conversion efficiencies of available technologies.
Even when evaluated on a regional basis, the technical potential of solar energy in most regions
of the world is many times greater than current total primary energy consumption in those
regions (de Vries et al. 2007).
Figure 1: Technical potential of renewable energy technologies
Data source: UNDP (2000), Johansson et al. (2004) and de Vries et al (2007)
Table 1 presents regional distribution of annual solar energy potential along with total
primary energy demand and total electricity demand in year 2007. As illustrated in the table,
solar energy supply is significantly greater than demand at the regional as well as global level.
5Table 1: Annual technical potential of solar energy and energy demand (Mtoe)
Region Minimum Maximum Primary Electricity
technical technical energy demand
potential potential demand (2008)
(2008)
North America 4,322 176,951 2,731 390
Latin America & Caribbean 2,675 80,834 575 74
Western Europe 597 21,826 1,822 266
Central and Eastern Europe 96 3,678 114 14
Former Soviet Union 4,752 206,681 1,038 92
Middle East & North Africa 9,839 264,113 744 70
Sub-Saharan Africa 8,860 227,529 505 27
Pacific Asia 979 23,737 702 76
South Asia 907 31,975 750 61
Centrally Planned Asia 2,746 98,744 2,213 255
Pacific OECD 1,719 54,040 870 140
Total 37,492 1,190,108 12,267 1,446
Note: The minimum and maximum reflect different assumptions regarding annual clear sky irradiance, annual
average sky clearance, and available land area.
Source: Johansson et al. (2004); IEA (2010)
Kurokawa et al. (2007) estimate that PV cells installed on 4% of the surface area of the
world‟s deserts would produce enough electricity to meet the world‟s current energy
consumption. Similarly, EPIA (2007) estimates that just 0.71% of the European land mass,
covered with current PV modules, will meet the continent‟s entire electricity consumption. In
many regions of the world 1 km2 of land is enough to generate more than 125 gigawatt hours
(GWh) of electricity per year through CSP technology.3 In China, for example, 1% (26,300 km2)
of its “wasteland” located in the northern and western regions, where solar radiation is among the
highest in the country, can generate electricity equivalent to 1,300 GW – about double the
country‟s total generation capacity projected for year 2020 (Hang et al, 2007). In the United
States, an area of 23,418 km2 in the sunnier southwestern part of the country can match the
present generating capacity of 1,067 GW (Mills and Morgan, 2008).
3
With an assumption of CSP efficiency of 8m2/MWh/year, which is in the middle of the 4-12 m2/MWh/year range
offered by Muller-Steinhagen & Trieb (2004).
62.2. Current market status
The installation of solar energy technologies has grown exponentially at the global level
over the last decade. For example, as illustrated in Figure 2(a), global installed capacity PV (both
grid and off-grid) increased from 1.4 GW in 2000 to approximately 40 GW in 2010 with an
average annual growth rate of around 49% (REN21, 2011). Similarly, the installed capacity of
CSP more than doubled over the last decade to reach 1,095MW by the end of 2010. Non-electric
solar thermal technology increased almost 5 times from 40 GWth in 2000 to 185 GWth in 2010
(see Figure 3). The impetus behind the recent growth of solar technologies is attributed to
sustained policy support in countries such as Germany, Italy United States, Japan and China.
2.2.1 Solar PV
By December 2010, global installed capacity for PV had reached around 40 GW 4 of
which 85% grid connected and remaining 15% off-grid (REN21, 2010). This market is currently
dominated by crystalline silicon-based PV cells, which accounted for more than 80% of the
market in 2010. The remainder of the market almost entirely consists of thin film technologies
that use cells made by directly depositing a photovoltaic layer on a supporting substrate.
Figure 2: Total Installed Capacity of PV at the Global Level
Rest of the
World; 8 %
Total Installed Capacity |GW|
40
China; 2 %
30 Japan; 9 %
United States;
20
6% Germany;
44 %
10 Other EU;
7%
0 Czech Republic;
5%
2004
2010
2000
2002
2006
2008
Italy; 9 %
Year Spain ; 10 %
(a) Trend of global installed capacity (b) Country share in the global installation in 2010
Source: REN21, 2011
4
This, however, represents only about 0.8% of the total global installed power generation capacity of about 4,600
GW in 2008.
7As illustrated in Figure 2b, a handful of countries dominate the market for PV. However,
a number of countries are experiencing a significant market growth. Notably, Czech Republic
had installed nearly 2 GW of solar PV by December 2010 (REN21, 2011), up from almost zero
in 2008. India had a cumulative installed PV capacity of 102 MW (EPIA, 2011) and China had a
cumulative capacity of 893 MW at the end of 2010.
Two types of PV systems exist in the markets: grid connected or centralized systems and
off-grid or decentralized systems. The recent trend is strong growth in centralized PV
development with installations that are over 200 kW, operating as centralized power plants. The
leading markets for these applications include Germany, Italy, Spain and the United States. After
exhibiting poor growth for a number of years, annual installations in the Spanish market have
grown from about 4.8 MW in 2000 to approximately 950 MW at the end of 2007 (PVRES 2007)
before dropping to 17 MW in 2009 and bouncing back to around 370 MW in 2010 (EPIA, 2011).
The off-grid applications (e.g., solar home systems) kicked off an earlier wave of PV
commercialization in the 1970s, but in recent years, this market has been overtaken by grid-
connected systems. While grid-connected systems dominate in the OECD countries, developing
country markets, led by India and China, presently favor off-grid systems. This trend could be a
reflection of their large rural populations, with developing countries adopting an approach to
solar PV that emphasizes PV to fulfill basic demands for electricity that are unmet by the
conventional grid.5
2.2.2 Concentrated Solar Power (CSP)
The CSP market first emerged in the early 1980s but lost pace in the absence of
government support in the United States. However, a recent strong revival of this market is
evident with 14.5 GW in various stages of development across 20 countries and 740 MW of
5
By the early 1990s, off-grid applications accounted for about 20% of the market (based on power volume), while
grid-connected systems accounted for about 11%. The rest of the market was comprised of remote stand-alone
applications such as water pumping, communications, leisure, consumer products and so forth (Trukenburg, 2000).
Between 1995 and 1998, for the first time, the market share of grid-connected systems eclipsed off-grid systems,
when it grew to 23% of the PV installations (Trukenburg, 2000). Since that time, grid-connected PV capacity has
dominated the market through sustained and dramatic growth rates. In both 2006 and 2007, this market attained 50%
annual increases in cumulative installed capacity; in 2008 the growth further increased to 70% (REN21, 2009).
8added CSP capacity between 2007 and 2010 While many regions of the world, for instance,
Southwestern United States, Spain, Algeria, Morocco, South Africa, Israel, India and China,
provide suitable conditions for the deployment of CSP, market activity is mainly concentrated in
Southwestern United States and Spain, both of which are supported with favorable policies,
investment tax credits and feed-in tariffs (Wolff et al. 2008). Currently, several projects around
the world are either under construction, in the planning stages, or undergoing feasibility studies6
and the market is expected to keep growing at a significant pace (REN21, 2011).
2.2.3 Solar thermal for heating and cooling
The total area of installed solar collectors (i.e., non-electric solar thermal) amounted to
185 GWth by early 2010 (REN21, 2011). Of which China, Germany, Turkey and India
accounted for 80.3%, 3.1%, 1.8% and 1.1% respectively. The remaining 13.7% was accounted
for other 40 plus countries including the USA, Mexico, India, Brazil, Thailand, South Korea,
Israel, Cyprus, Ethiopia, Kenya, South Africa, Tunisia, and Zimbabwe. Three types of solar
collectors (i.e., unglazed, glazed flat-plate and evacuated tube) are found in the market. By the
end of 2009, of the total installed capacity of 172.4 GWth, 32% was glazed flat-plate collectors;
56% was evacuated tube collectors; 11% was unglazed collectors; and the remaining 1% was
glazed and unglazed air collectors (Weiss et al., 2011).The market for solar cooling systems
remains small although it is growing fast. An estimated 11 systems were in operation worldwide
by the end of 2009 (REN21, 2011). The use of solar thermal non-electric technologies varies
greatly in scale as well as type of technology preferred. For instance, the market in China;
Taiwan, China; Japan; and Europe is dominated by glazed flat-plate and evacuated tube water
6
Examples of large solar thermal projects currently under construction or in the development stage around the
world include: a 500 MW solar thermal plant in Spain; a 500 MW solar dish park in California; and 30 MW plants,
one each in Egypt, India, Morocco and Mexico (Aringhoff et al., 2005). Solar Millennium AG, a German solar
energy technology company, is working with its Chinese counterpart (Inner Mongolia Ruyi Industry Co. Ltd.) to
build a multi-billion dollar CSP plant in northern China that would generate 1 GW by 2020 (Dou, 2006). The
Mediterranean Solar Plan, announced in July 2008, seeks to pursue the development of 20 GW of renewable energy
in the Mediterranean region (EPIA, 2009). Some private companies have announced plans to develop 100 GW CSP
capacity in the Sahara desert to supply electricity to Europe (EESI, 2009).
9collectors. On the other hand, the North American market is dominated by unglazed water
collectors employed for applications such as heating swimming pools.
Figure 3: Installed Capacity of Solar Thermal Systems
180,0 172,4
160,0 151,9
146,8
140,0 127,8
120,0 111,0
98,4
100,0
GWth
80,0
60,0
40,0
20,0
0,0
2004 2005 2006 2007 2008 2009
Glazed AC Unglazed AC Unglazed WC Glazed WC Evacuated tube WC
Source: Weiss et al. (2005 to 2011 Issues). WC is water collector and AC is air collector.
3. The economics of solar energy
There is a wide variety of solar energy technologies and they compete in different energy
markets, notably centralized power supply, grid-connected distributed power generation and off-
grid or stand-alone applications. For instance, large-scale PV and CSP technologies compete
with technologies seeking to serve the centralized grid. On the other hand, small-scale solar
energy systems, which are part of distributed energy resource (DER)7 systems, compete with a
number of other technologies (e.g., diesel generation sets, off-grid wind power etc.). The
traditional approach for comparing the cost of generating electricity from different technologies
7
DERs are essentially „small power generation and storage applications, usually located at or very near customer
loads‟ (Denny and Dismukes, 2002). Broadly, DERs include technologies and applications, which can be
categorized into grid-connected applications, known as „distributed generation‟ (DG) and a separate category known
as stand-alone systems, which includes electric as well as non-electric applications (IEA 2002, Byrne et al., 2005b).
10relies on the “levelized cost” method8. The levelized cost (LCOE) of a power plant is calculated
as follows:
OC r (1 r )T
LCOE CRF OMC FC with CRF
CF 8760 (1 r )T 1
where OC is the overnight construction cost (or investment without accounting for interest
payments during construction); OMC is the series of annualized operation and maintenance
(O&M) costs; FC is the series of annualized fuel costs; CRF is the capital recovery factor; CF is
the capacity factor; r is the discount rate and T is the economic life of the plant.
In this section, we discuss the economics of grid connected PV and CSP under various
scenarios. One of the main challenges to the economic analysis of power generation technologies
is the variation in cost data across technology type, size of plant, country and time. Since fuel
costs are highly volatile and capital costs of solar technologies are changing every year, an
economic analysis carried out in one year might be outdated the next year. Nevertheless, the
analysis presented here could help illustrate the cost competitiveness of solar energy
technologies with other technologies at present.
We have taken data from various sources including Lazard (2009), NEA/IEA (2005,
2010), EIA (2007, 2009) and CPUC (2009). The data were available for different years, so we
adjusted them using the GDP deflator and expressed them in 2008 prices for our analysis.
Moreover, the existing calculations of LCOE for a technology vary across studies as they use
different economic lives, capacity factors and discount rates. Some studies account for financial
costs (e.g., taxes and subsidies) (Lazard, 2009; CPUC, 2009), while others include only
economic costs (NEA/IEA, 2005, 2010). Therefore, we have taken the maximum and minimum
values of overnight construction costs for each technology considered here from the existing
studies to reflect the variations in overnight construction costs, along with the corresponding
O&M and fuel costs, and applied a uniform 10% discount rate and 2.5% fuel price and O&M
costs escalation rate to cost data from all the studies. Since our focus is on economic analysis,
taxes, subsidies or any types of capacity credits are excluded. Please see Table 2 for key data
used in the economic analysis.
8
The levelized cost of electricity of a power plant represents the per unit value of total costs (i.e., capital, operation
and maintenance, fuel) over the economic life of the power plant (Falk et al., 2008; NEA/IEA, 2010).
11Table 2: Key Data Used in Economic Analysis
Technology Overnight Plant Capacity Source
Construction Cost Economic Life Factor (%)
(US$/kW) (years)
Solar PV Min 2878 25 21 NEA/IEA
Max 7381 25 20 NEA/IEA
Solar CSP Min 4347 25 34 NEA/IEA
Max 5800 20 26 Lazard
Wind Min 1223 25 27 NEA/IEA
Max 3716 25 23 NEA/IEA
Gas CC Min 538 30 85 NEA/IEA
Max 2611 30 85 NEA/IEA
Gas CT Min 483 25 85 NEA/IEA
(2005)
Max 1575 20 10 Lazard
Hydro Min 757 80 34 NEA/IEA
Max 3452 20 50 CPUC
IGCC w CSS* Min 3569 40 85 NEA/IEA
Max 6268 40 85 NEA/IEA
Supercritical^ Min 1958 40 85 NEA/IEA
Max 2539 40 85 NEA/IEA
Nuclear Min 3389 60 20 EIA
Max 8375 20 90 Lazard
Note: * IGCC with carbon capture and storage. ^Supercritical coal.
Figure 4 presents the results of the levelized cost analysis. Although the costs of solar
energy have come down considerably and continue to fall, the levelized costs of solar energy are
still much higher compared to conventional technologies for electricity generation, with the
exception of gas turbine 9 . For example, the minimum values of levelized cost for solar
technologies (US$192/MWh for PV and US$194/MWh for CSP) are more than four times as
high as the minimum values of the levelized cost of supercritical coal without carbon capture and
storage (US$43/MWh). Among renewable energy technologies, wind and hydropower
technologies are far more competitive with fossil fuel and nuclear power plants.10
9
In electricity systems, which face high natural gas price, the levelized cost of simple cycle gas turbine technologies
is much higher as compared to that of other conventional technologies because the utilities dispatch this technology
only when other technologies are not available, thereby resulting in a small capacity utilization factor. However, in
some system where natural gas is the major source for electricity generation, a gas fired power plant could be also
used to serve base load. In such cases, the capacity factor could be as high as 85% and its levelized cost would be
lower.
10
The costs estimated here are close to that compiled in Arvizu et.al (2011).
12The difference between the minimum and maximum values for the levelized costs of
solar energy technologies (and also other energy technologies) are wide due mainly to large
variations in overnight construction costs and to different capacity factors. For example, the
overnight construction costs of grid connected solar PV system vary from US$2,878/kW to
US$7,381/kW (NEA/IEA, 2010). Similarly, the overnight construction costs of CSP vary from
US$4,347/kW (NEA/IEA, 2010) to US$5,800/kW (Lazard, 2009). The capacity utilization factor
of simple cycle gas turbine varies from 10% (Lazard, 2009) to 85% (NEA/IEA, 2010).
Furthermore, very different economic lives are assumed for hydro, coal and nuclear plants.
Figure 4: Levelized Cost of Electricity Generation by Technology (2008US$/MWh)
Capital Cost O&M Cost Fuel Cost
$719
7%
$362
$336
98 %
11 % 22 %
$241
$194 20 %
$192 16 %
10 % 17 % $138 $148 $146
89 % $101 4%
31 % $88 10 %
$76 84 % $62 $65 58 % $77 $76
90 % 67 % 8% 11 %
83 % 17 % $43 16
25 % 82 % $29
92 % 19 % 58 % 23 %
47 % 19 %
% 85 %
75 % 6% 85 % 14 % 13 %
6% 27 % 4 %% 12 % 64 % 63 % 40 % 65 %
12 % 11 88 %
Min Max Min Max Min Max Min Max Min Max Min Max Min Max Min Max Min Max
Solar PV CSP Wind Gas CC Gas CT Hydro IGCC* Coal^ Nuclear
Note: * IGCC with carbon capture and storage. ^Supercritical coal.
It is also interesting to observe the contributions of various cost components (e.g., capital,
O&M and fuel costs) to levelized cost. While capital cost accounts for more than 80% of the
levelized cost for renewable energy technologies, it accounts for less than 60% in conventional
fossil fuel technologies (e.g., coal, gas combined cycle). Fuel costs are the major components in
most fossil fuel technologies.
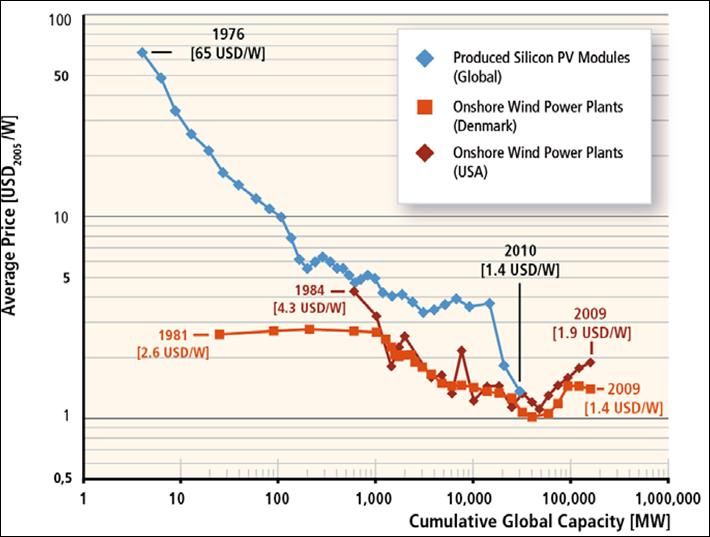
13Using the concept of experience or learning curves which plot cost as a function of
cumulative production on a double-logarithmic scale, implying a constant relationship between
percentage changes in cost and cumulative output11, existing studies (e.g., Kannan et al., 2006;
Hertlein et al., 1991; EWEA, 2008; Ackerman and Erik, 2005; Dorn, 2007, 2008; Neij, 2008),
expect significant reductions in the capital costs of solar energy technologies (see Figure 5a).
The cost of solar PV has been declining rapidly in the past, compared not only to conventional
technologies such as coal and nuclear, but also to renewable technology such as wind. The 2011
Special Report on Renewable Energy Carried out by Intergovernmental Panel on Climate
Change (Arvizu et. al (2011) has also demonstrates reduction in costs of solar and wind power
along with their cumulative installed capacity (see Figure 5b). The “learning rate”12 of solar PV,
CSP and wind are 21%, 7%, and 8%, respectively (Nemet, 2007; Beinhocker et al., 2008).13
Considering the declining trend of capital costs as discussed above, we analyzed the
levelized costs of solar energy technologies when their capital costs drop by 5% to 25% from the
present level. Figure 6 shows how the levelized cost of solar thermal trough, solar thermal tower,
photovoltaic thin-film and photovoltaic crystalline would decline if their capital cost
requirements were to fall by up to 25% and how those costs would compare to the maximum
levelized costs of traditional electricity generation plants. As illustrated in the figure, the
minimum values of levelized cost of any solar technologies, including tower type CSP, which is
currently the least costly solar technology, would be higher than the maximum values of
levelized costs of conventional technologies for power generation (e.g., nuclear, coal IGCC, coal
supercritical, hydro, gas CC) even if capital costs of solar energy technologies were reduced by
25%.
11
The concept of experience or learning curves was first used in the aircraft industry by T. P. Wright in 1936 with
the idea that improvements in labor-hours needed to manufacture an airplane could be described mathematically
(Wright, 1936). Since then, the analytical technique has been frequently used to assess trends in the cost
competitiveness of technologies given the cumulative output, investment, or other measures of the application of the
technology (Reis, 1991; IEA, 2000; Colpier and Deborh, 2002; Neij, 2008).
12
There are two important metrics devised to reflect the information contained in an experience curve and apply it
for evaluative purposes, viz. “progress ratio” and “learning rate.” The progress ratio is that proportion of original
price, which results from a doubling of the cumulative volume. Thus, if the cost per unit reduces to 0.75 of the
original price by doubling the cumulative output, then the progress ratio of such a technology is 75%. The learning
rate for a particular technology is derived from the progress ratio by subtracting it from 1. Thus, if the progress ratio
is 0.75, the corresponding learning rate for the technology is 0.25 or 25%.
13
Note, however, that the application of this method to project actual experience with cost in established
commercial-scale facilities is different than its application to cost changes as a technology moves from research
phase to pilot investment to commercial use.
14Figure 5: Experience Curves of Renewable Electric Technologies
(a)
Sources: Earth Policy Institute (2009); DOE (2008b); Stoddard et al. (2007); Charls et al. (2005); Winter (1991)
(b)
Sources: Arvizu et. al (2011)
15Figure 6: Sensitivity of levelized costs of solar technologies to their capital cost reduction
CSP Trough PV Thin-Film PV Crystalline CSP Tower
350
300
250
200
US$/MWh
150 Nuclear (Max)
IGCC* (Max)
Hydro (Max)
100 Gas CC (Max)
Coal^ (Max)
50
0
Reference -5% -10% -15% -20% -25%
Note: * IGCC with carbon capture and storage; ^Supercritical coal
Since fossil fuels such as coal and gas produce negative externalities at the local level
(e.g., local air pollution) as well at the global level (e.g., GHG emissions), whereas solar energy
technologies do not, it would be unfair to compare solar energy technologies with fossil fuel
technologies without accounting for those externalities. Hence, we further analyze the levelized
costs of electricity generation technologies, developing a framework to capture some of those
external costs. The framework accounts for the environmental damage costs of fossil fuels,
particularly climate change damage costs. Damage costs of local air pollution are not included
due to a lack of data. Since obtaining actual values of damage costs of emissions from different
fossil fuel technologies is highly complex, we employed a sensitivity analysis by considering
various values of damage costs ranging from US$0/tCO2 to US$100/tCO2. Figure 7 plots the
levelized costs of various technologies against the climate change damage costs. The figure
demonstrates that the minimum values of levelized costs of solar energy technologies would be
higher than the maximum values of the levelized costs of fossil fuel technologies even if the
climate change damage costs of 100/tCO2 are imputed to fossil fuel technologies. In other words,
16even if we assign a climate change damage cost of US$100/tCO2 to fossil fuel technologies, solar
energy technologies would still presently be economically unattractive as compared to fossil fuel
technologies.
The analysis above shows that climate change mitigation benefits would not be sufficient
to make solar energy technologies economically attractive. However, solar energy technologies
also provide additional benefits, which are not normally excluded from traditional economic
analysis of projects. For example, as a distributed energy resource available nearby load centers,
solar energy could reduce transmission and distribution (T&D) costs and also line losses. Solar
technologies like PV carry very short gestation periods of development and, in this respect, can
reduce the risk valuation of their investment (Byrne et al., 2005b). They could enhance the
reliability of electricity service when T&D congestion occurs at specific locations and during
specific times. By optimizing the location of generating systems and their operation, distributed
generation resources such as solar can ease constraints on local transmission and distribution
systems (Weinberg et al., 1991; Byrne et al., 2005b). They can also protect consumers from
power outages. For example, voltage surges of a mere millisecond can cause „brownouts,‟
causing potentially large losses to consumers whose operations require high quality power
supply. They carry the potential to significantly reduce market uncertainty accompanying bulk
power generation. Because of their modular nature and smaller scale (as opposed to bulk power
generation), they could reduce the risk of over shooting demand, longer construction periods, and
technological obsolescence (Dunn, 2000 quoted in Byrne et al., 2005b: 14). Moreover, the peak
generation time of PV systems often closely matches peak loads for a typical day so that
investment in power generation, transmission, and distribution may be delayed or eliminated
(Byrne et al., 2005b). However, developing a framework to quantify all these benefits is beyond
the scope of this study.
17Figure 7: Economic attractiveness of solar technologies when environmental damages of
fossil fuel technologies are accounted
$350
Solar CSP (Max)
$300
$250
Solar CSP (Min)
US$/MWh
$200
Solar PV (Min)
Gas CC (Max)
$150 Coal^ (Max)
Coal^ (Min)
Gas CC (Min)
$100
$50
$-
0 10 20 30 40 50 60 70 80 90 100
US$/tCO2
Note: ^Supercritical coal.
4. Estimated future growth of solar energy and barriers to realizing growth
Advocates of solar energy claim that it will play a crucial role in meeting future energy
demand through clean energy resources. Existing projections of long-term growth (e.g., until
2050) of solar energy vary widely based on a large number of assumptions. For example, Arvizu
et al. (2011) argue that expansion of solar energy depends on global climate change mitigation
scenarios. In the baseline scenario (i.e., in the absence of climate change mitigation policies), the
deployment of solar energy in 2050 would vary from 1 to 12 EJ/yr. In the most ambitious
scenario for climate change mitigation, where CO2 concentrations remain below 440 ppm by
2100, the contribution of solar energy to primary energy supply could reach 39 EJ/yr by 2050.
EPIA/Greenpeace (2011) produces the most ambitious projections of future PV
installation. The study argues that if existing market supports are continued and additional
market support mechanisms are provided, a dramatic growth of solar PV would be possible,
which will lead to worldwide PV installed capacity rising from around 40 GW in 2010 to 1,845
18GW by 2030. The capacity would reach over 1000 GW in 2030 even with a lower level of
political commitment.
A study jointly prepared by Greenpeace International and the European Renewable
Energy Council (Teske et al., 2007) projects that installed global PV capacity would expand to
1,330 GW by 2040 and 2,033 GW by 2050. A study by the International Energy Agency (IEA,
2008) estimates solar power development potential under two scenarios that are differentiated on
the basis of global CO2 emission reduction targets. In the first scenario, where global CO2
emissions in 2050 are restricted at 2005 level, global solar PV capacity is estimated to increase
from 11 GW in 2009 to 600 GW by 2050. In the second scenario, where global CO2 emissions
are reduced by 50% from 2005 levels by 2050, installed capacity of solar PV would exceed
1,100 GW in 2050.
Like solar PV, projections are available for CSP technology. A joint study by
Greenpeace, the European Solar Thermal Power Industry (ESTIA) and the International Energy
Agency projects that global CSP capacity would expand by one hundred-fold to 37 GW by 2025
and then skyrocket to 600 GW by 2040 (Greenpeace et al., 2005). Teske et al. (2007) project
that global CSP capacity could reach 29 GW, 137 GW and 405 GW in 2020, 2030 and 2050,
respectively. IEA (2008) projects that CSP capacity could reach 380 GW to 630 GW, depending
on global targets for GHG mitigation14.In the case of solar thermal energy, the global market
could expand by tenfold to approximately 60 million tons of oil equivalent (Mtoe) by 2030 (IEA
World Energy Outlook 2006). A more optimistic scenario from the European Renewable Energy
Council (2004) projects that solar thermal will grow to over 60 Mtoe by 2020, and that the
market will continue to expand to 244 Mtoe by 2030 and to 480 Mtoe, or approximately 4% of
total global energy demand, by 2040.It would be also relevant to envisage the contribution of
solar energy to the global energy supply mix. According to EREC (2004), renewable energy is
expected to supply nearly 50% of total global energy demand by 2040. Solar energy alone is
projected to meet approximately 11% of total final energy consumption, with PV supplying 6%,
solar heating and cooling supplying 4% and CSP supplying 1% of the total. Shell (2008) shows
that if actions begin to address the challenges posed by energy security and environmental
14
The lower range represents to the scenario of limiting global CO2 emissions in 2050 at 2005 level, whereas the
upper range refers to the scenario to reduce global CO2 emissions in 2050 by 50% from 2005 levels.
19pollution, sources of energy other than fossil fuels account for over 60% of global electricity
consumption, of which one third comes from solar energy. In terms of global primary energy
mix, solar energy could occupy up to 11% by 2050.
Notwithstanding these optimistic projections, the existing literature identifies a range of
barriers that constrains the deployment of solar energy technologies for electricity generation and
thermal purposes. These barriers can be classified as technical, economic, and institutional and
are presented in Table 3. Technical barriers vary across the type of technology. For example, in
the case of PV, the main technical barriers include low conversion efficiencies of PV modules15;
performance limitations of system components such as batteries and inverters; and inadequate
supply of raw materials such as silicon. In the case of stand-alone PV systems, storage is an
important concern, as is the shorter battery life compared to that of the module. Furthermore,
safe disposal of batteries becomes difficult in the absence of a structured disposal/recycling
process. With regard to solar thermal applications, there are two main technical barriers. They
are limits to the heat carrying capacity of the heat transfer fluids and thermal losses from storage
systems (Herrmann et al. 2004; IEA 2006a). In addition, as seen in Table 3, there are constraints
with regard to system design and integration as well as operating experience for system
optimization. For example, lack of integration with typical building materials, designs, codes and
standards make widespread application of solar space and water heating applications difficult. In
the case of CSP, technologies such as the molten salt-in-tube receiver technology and the
volumetric air receiver technology, both with energy storage systems, need more experience to
be put forward for large-scale application (Becker et al., 2000). Moreover, solar energy still has
to operate and compete on the terms of an energy infrastructure designed around conventional
energy technologies.
15
Presently the highest efficiency for commercially available modules is 18% (Rose et al., 2006; SunPower, 2008).
However, there is considerable scope for further efficiency improvements (Barnett et al., 2007).
20Table 3: Barriers to the Development and Deployment of Solar Energy Technologies
PV Solar Thermal
Technical Barriers The efficiency constraint: 4% to 12% (for thin film) Heat carrying capacity of heat transfer fluids.
and under 22% (for crystalline) in the current market Thermal losses and energy storage system issues with CSPs
(EPIA/Greenpeace, 2011). (Herrmann et al., 2004; IEA, 2006a).
Performance limitations of balance of system (BOS) Supply orientation in the design of solar water heaters when
components such as batteries, inverters and other product diversity is needed to match diverse consumer
power conditioning equipments (Rickerson et al., demand profiles.
2007, Beck and Martinot, 2004; O‟Rourke et al., For solar water heating, lack of integration with typical
2009). building materials, existing appliances and infrastructure,
Silicon supply: strong demand for PV in 2004 and designs, codes, and standards has hampered widespread
2005 outpaced the supply and partly stalled the growth application.
of solar sector (Wenzel, 2008; PI, 2006). In case of central receiver systems the promising
Cadmium and tellurium supply for certain thin film technologies such as the molten salt-in-tube receiver
cells: these two components are by-products from technology and the volumetric air receiver technology, both
respectively the zinc mining and copper processing and with energy storage system needs more experience to be put
their availability depends on the evolution of these for large-scale application (Becker et al., 2000).
industries (EPIA/Greenpeace, 2011).
Economic Barriers High initial capital cost and the related lack of easy and High upfront cost coupled with lengthy payback periods and
consistent financing options forms one of the biggest small revenue streams raises creditworthiness risks.
barriers primarily in developing countries (Beck and The financial viability of domestic water heating system is
Martinot, 2004). low.
Investment risks seen as unusually high risks by some Backup heater required in water heating systems to provide
financial institutions because of lack of experience with reliable heat adds to the cost.
such projects (Goldman et al., 2005; Chaki, 2008 Increasing cost of essential materials like copper make water
Cost of BOS is not declining proportional to the decline heating and distribution costly.
in module price (Rickerson et al., 2007). Limited rooftop area and lack of building integrated systems
The fragility of solar development partnerships: many PV limit widespread application.
projects are based on development partnerships and with
the early departure of a partner the revenue to complete,
operate and maintain the system may falter (Ahiataku-
Togobo, 2003).Institutional/Regulatory The limited capability to train adequate number of technicians to effectively work in a new solar energy infrastructure
Barriers (Banerjee, 2005; Dayton, 2002).
Limited understanding among key national and local institutions of basic system and finance.
Procedural problems such as the need to work with several public sector agencies (e.g., in India, MNRE, IREDA, the Planning
Commisson, and the Ministry of Agriculture and Rural Development) (Radulovic, 2005).
Barriers limiting entry of distributed technology platforms into the grid, including potential for access restrictions by
conventional utilities (Margolis and Zuboy, 2006); potential burdens include over-complicated procedures for interconnection,
metering and billing (Florida Solar Energy Center, 2000).
22The economic barriers mainly pertain to initial system costs. Cost comparisons for solar
energy technologies by suppliers and users are made against established conventional
technologies with accumulated industry experience, economies of scale and uncounted
externality costs. Solar energy technologies thus face an “uneven playing field,” even as its
energy security, social, environmental and health benefits are not internalized in cost calculations
(Jacobson & Johnson, 2000). Financing is another critical barrier. Financial institutions consider
solar energy technologies to have unusually high risks while assessing their creditworthiness.
This is because solar energy projects have a shorter history, lengthy payback periods and small
revenue stream (Goldman et al., 2005; Chaki, 2008). This implies higher financial charges (e.g.,
interest rates) to solar energy projects.
Aside from economic and technical constraints, PV and solar thermal technologies face
institutional barriers that reflect considerably the novelty of the technologies. They range from
limited capacities for workforce training, to mechanisms for planning and coordinating financial
incentives and policies. Inadequate numbers of sufficiently trained people to prepare, install and
maintain solar energy systems is another common barrier. In India, for example, the country
invested in the training of nuclear physicists and engineers since its independence, while similar
requirements for renewable technologies were ignored (Banerjee, 2005).
In some instances, existing laws and regulations could constrain the deployment of solar
energy. For example, some applications of small-scale PV systems have had to overcome
„cumbersome and inappropriate‟ interconnection requirements, such as insurance, metering and
billing issues, in order to sell excess power generation back into the grid (Florida Solar Energy
Center, 2000). However, these potential constraints can become binding only when other
policies in place induce or require use of solar energy in order to overcome its higher cost. Even
if interconnection were to be simplified, grid based electricity suppliers would still have to
address challenges of integrating significant quantities of episodic, non-dispatchable solar power
into the grid (or the high cost of current storage options).
5. Potential policy instruments to increase solar energy development
As illustrated earlier, by and large solar energy technologies are not yet cost-competitive
with conventional energy commodities at either the wholesale or retail levels. Therefore, any
significant deployment of solar energy under current technological and energy price conditionswill not occur without major policy incentives. A large number of governments have decided to
increase solar energy development, using a range of fiscal, regulatory, market and other
instruments 16 . In fact, the strong growth in solar energy markets, notably those for grid-
connected solar PV and solar thermal water heating, has been driven by the sustained
implementation of policy instruments in Europe, the United States and some developing
countries to induce or require increased use of solar power.
This section briefly presents key characteristics of policy instruments that support solar
energy for both electric and direct heating applications. A large number of policy instruments
have been implemented to increase power supplies from solar PV and CSP. The key instruments
we highlight here include feed-in-tariffs, investment tax credits, direct subsidies, favorable
financing, mandatory access and purchase, renewable energy portfolio standards and public
investment. Three rationales are commonly offered for utilizing these policies. One is to
encourage the use of low-carbon technology in the absence of a more comprehensive policy for
greenhouse gas mitigation, like a carbon tax. The disadvantage of this approach for greenhouse
gas mitigation is that it does not create incentives for cost-effective mitigation choices. The
second rationale is that expanded investments will ultimately help drive down the costs of those
technologies through economies of scale and learning-by-doing. There is clear evidence that
scaling-up has driven down unit costs for PV, though not yet to the point that it is cost-effective
with conventional alternatives in most cases. CSP is still relatively a pioneer technology with
only a few medium-scale investments and no larger-scale investments, though some are planned.
It remains to be seen how scale economies and learning-by-doing will lower its costs. The third
and most unambiguous rationale is that subsidization of small-scale, off-grid PV (and other
renewable energy sources) to bring electricity to remote and poor areas lacking access is a
powerful force for stimulating economic development.
16
A number of recent studies, such as ESMAP 2011a, 2011b and EPIA 2011 present in-depth analysis of various
policy instruments designed to promote renewable energy, including solar, at the global level as well as for a
particular country, such as India.
245.1. Feed-in-tariff
Feed-in-tariff (FiT) refers to a premium payment to new and renewable energy
technologies which are relatively expensive or thus not competitive with conventional
technologies for electricity generation17. The tariff is based on the cost of electricity produced,
including a reasonable return on investment for the producer. It thus reduces the risk to potential
investors for long-term investments in new and innovative technologies. This policy has been
implemented in more than 75 jurisdictions around the world as of early 2010, including in
Australia, EU countries, Brazil, Canada, China, Iran, Israel, the Republic of Korea, Singapore,
South Africa, Switzerland, the Canadian Province of Ontario and some states in the United States
(REN21, 2010). FIT has played a major role in boosting solar energy in countries like Germany
and Italy, which are currently leading the world in solar energy market growth. Mendonça and
Jacobs (2009) argue that FIT promotes the fastest expansion of renewable electric power at the
lowest cost by spreading the costs among all electric utility customers. A study evaluating
renewable energy policies in EU countries found that the FIT is the most effective policy
instrument to promote solar, wind and biogas technologies (CEC, 2008).
FiTs cover all types of solar energy technologies (e.g., small residential rooftop PV to
large scale CSP plants). The tariffs, however, differ across countries or geographical locations,
type and size of technology.
For example, German feed-in payments are technology- and scale- specific. It is
subdivided by project size, with larger projects receiving a lower feed-in tariff rate in order to
account for economies of scale, and by project type, with freestanding systems receiving a low
FiT (Sösemann, 2007). The current FITs for solar PV in Germany are 0.43€/kWh for rooftop
capacity less than 30 kW; 0.41€/kWh for rooftop capacity between 30 kW and 100 kW;
0.39€/kWh for rooftop capacity between 100 kW and 1MW; 0.33€/kWh for rooftop capacity
greater than 1 MW; and 0.32€/kWh for free-standing units (IEA, 2011). Each tariff is eligible for
a 20-year fixed-price payment for every kilowatt-hour of electricity generated. Germany‟s FIT
assessment technique is currently based on a “corridor mechanism” (EPIA/Greenpeace, 2011).
17
In different countries, feed-in-tariffs could also be referred to as Standard Offer Contracts, Renewable Tariffs,
Advanced Renewable Tariffs, Renewable Energy Payments, etc. Irrespective of the term used to refer to it, the basic
principle is to facilitate production of electricity through new and renewable energy technologies and „feed‟ it into
national energy systems, particularly to electricity grids.This mechanism sets a PV capacity installation growth path which is dependent on the PV
capacity installed the year before, and results in a decrease or an increase of the FIT rates
according respectively to the percentage that the corridor path was exceeded or unmet. As PV
capacity installations were superior than planned by government in 2010, the FIT rates were
decreased by 13% on January 1st, 2011 to reflect the decrease in PV costs.
The FiT is regarded as the key driver for recent growth of grid connected solar power,
both CSP and grid connected PV. However, some existing studies, such as Couture and Cory
(2009), identify several concerns with the FiT. FITs put upward pressure on electricity rates, at
least in the near to medium term in order to significantly scale up the deployment of such
technologies. FiT policies guaranteeing grid interconnection, regardless of location on the grid,
increase transmission costs if projects are sited far from load centers or existing transmission or
distribution lines18. Similarly, FiT policies designed to periodically adjust to account for changes
in technology costs and market prices over time pose a challenge with respect to balancing the
purpose of the tariff – increasing utilization of the beneficiary technologies – and fiscal cost,
especially as the authorities can only guess at the appropriate tariff adjustments. Changing
payment levels increase uncertainties to investors, and political pressures to hold down payments
increase overall market risk. In Germany, for example, there was political pressure to cap the
policy or speed its rate of decline (Frondel et al., 2008; Podewils, 2007).
5.2. Investment tax credits
Different types of investment tax credits have been implemented in several jurisdictions
around the world to support solar energy. In the United States, for example, the federal
government provides an energy investment tax credit for solar energy investments by businesses
equal to 30% of expenditures on equipment to generate electricity, to heat or cool and on hybrid
solar lighting systems. Besides the investment tax credit, the US federal government provides an
18
Couture and Cory also note that while the FIT provides incentives to investors by guaranteeing reasonable rates of
return on investment, it does not directly subsidize high up-front costs. This could limit increased solar power
financing in situations in which capital generally is scarce, as is the case in a number of developing countries. On
the other hand, as discussed later , subsidies of initial investment costs provide greater relative benefits to less
efficient and less well-capitalized firms, which is inconsistent with the interest in bringing down the cost of the
technologies over time. In addition, domestic capital scarcities in the power sector can stem in part from stringent
limits on foreign investment in the sector, cutting off the country from a global pool of capital for increased
generation capacity generally.
26You can also read