Advanced Biofuels - Potential for Cost Reduction - IEA ...
←
→
Page content transcription
If your browser does not render page correctly, please read the page content below

Advanced Biofuels –
                                  Potential for Cost
                                  Reduction

IEA Bioenergy: Task 41: 2020:01
Advanced Biofuels – Potential for Cost Reduction

Authors

Adam Brown, Energy Insights Ltd, UK

Lars Waldheim, Waldheim Consulting, Sweden

Ingvar Landälv, Fuel & Energy Consulting, Sweden

Jack Saddler, University of British Columbia, Canada, IEA Bioenergy Task 39

Mahmood Ebadian, University of British Columbia, Canada, IEA Bioenergy Task 39

James D. McMillan, National Renewable Energy Laboratory, USA, IEA Bioenergy Task 39

Antonio Bonomi, CNPEM, Brazil

Bruno Klein, CNPEM, Brazil

Acknowledgements.

The work was carried out under Task 41 of the IEA Bioenergy Technology Cooperation Programme, and was made possible through
funding provided by the European Commission, DG ENER, and through in kind contributions from Germany, Netherlands and Sweden.

The Authors would like to thank Dr Kyriakos Maniatis, (European Commission, DG ENER) for providing help and guidance throughout the
study. They also benefitted for advice and guidance from an Advisory Group made up of members of the IEA Bioenergy Executive
Committee including Jim Spaeth (Chairman), Birger Kerckow, Kees Kwant, Åsa Forsum, Jonas Lindmark, Luc Pelkmans. They also
received comments and help from a number of other experts including Franziska Műller -Langer (DBFZ Deutsches
Biomasseforschungszentrum gemeinnützige GmbH, Germany), Patrick Lamers (NREL), Thomas Kolb and Nicolaus Dahmen (Karlsruhe
Institute of Technology (KIT), Germany). The Authors would al like to thank Stamatis Kalligeros (Hellenic Naval Academy) for assistance
with the final layout and editing.

They would also like to thank industry players who provided information and opinions for the study. They are acknowledged in the text.

Copyright © 2020 IEA Bioenergy. All rights Reserved

Published by IEA Bioenergy

The IEA Bioenergy TCP is organised under the auspices of the International Energy Agency (IEA) but is functionally and legally autonomous. Views, findings and publications of the IEA
Bioenergy TCP do not necessarily represent the views or policies of the IEA Secretariat or its individual member countries.

Contents

CONTENTS .................................................................................................................... 3

Figures ............................................................................................................................................................... 7

Tables ................................................................................................................................................................ 7

EXECUTIVE SUMMARY ................................................................................................. 9

1.          INTRODUCTION ................................................................................................ 12

1.1 Background ............................................................................................................................................. 12

1.2 The Sub-Group for Advanced Biofuels (SGAB) Cost Study ......................................................... 13

1.3 Project objectives .................................................................................................................................. 13

2.          METHODOLOGY ................................................................................................ 14

2.1 Data Collection ....................................................................................................................................... 14

2.2 Scope ......................................................................................................................................................... 14

2.3 Data Analysis and Modelling .............................................................................................................. 15

2.4 Benchmarking Costs ............................................................................................................................. 16

3.          INFORMATION ON CURRENT COSTS OF PRODUCTION ..................................... 16

3.1 HVO............................................................................................................................................................ 17

3.2 Bio-methane via anaerobic digestion .............................................................................................. 18

3.3 Ethanol from lignocellulosic sugar via fermentation .................................................................. 19
  Background.................................................................................................................................................................. 19
  SGAB cost data ............................................................................................................................................................ 20
  New Information........................................................................................................................................................ 21
  Corn fibre to cellulosic ethanol ............................................................................................................................. 21

3.4 Synthetic fuels via gasification........................................................................................................... 23
  Background.................................................................................................................................................................. 23
  SGAB - Cost data for thermal processes ............................................................................................................. 24
     Production of alcohols and hydrocarbons from biomass and waste................................................... 24
     FT Products ............................................................................................................................................................. 25
     New Information ................................................................................................................................................... 25
     Project and data analysis .................................................................................................................................... 27
     Review of production costs ............................................................................................................................... 27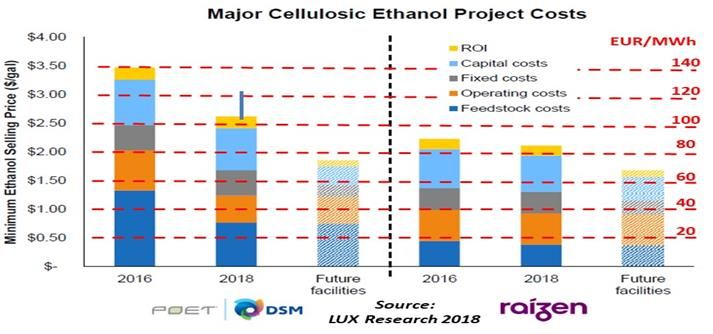
3.5 Pyrolysis oil and upgrading ................................................................................................................ 30
  Background.................................................................................................................................................................. 30

3.6 Summary - current cost estimates .................................................................................................... 32

4.          COST REDUCTION POTENTIAL ........................................................................... 35

4.1 Medium term cost reductions ............................................................................................................ 35
  Lignocellulosic ethanol ............................................................................................................................................ 35
    Reducing feedstock costs ................................................................................................................................... 36
    Reducing capital costs ......................................................................................................................................... 36
    Reducing operating and maintenance costs ................................................................................................ 36
    Overall medium-term cost reduction potential .......................................................................................... 36
  Thermal routes to advanced biofuels ................................................................................................................. 39
  Impact of feedstock cost and conversion efficiency....................................................................................... 40
  Improving financing rates ...................................................................................................................................... 41
  Summary of medium-term cost reduction potential ..................................................................................... 43

4.3 Potential for long term cost reduction ............................................................................................ 43
  Impact of learning-based cost curves for large-scale deployment ........................................................... 43

4.4 Cost reduction - overall summary and conclusions ..................................................................... 46

5.          FEEDSTOCK – COSTS AND AVAILABILITY ........................................................... 47

5.1 Costs and Prices ..................................................................................................................................... 47
  Municipal Wastes....................................................................................................................................................... 47
  Processing residues .................................................................................................................................................. 48
  Collectable residues .................................................................................................................................................. 48
  Internationally traded fuels ................................................................................................................................... 49
  Prices and costs .......................................................................................................................................................... 49

5.2 Feedstock availability .......................................................................................................................... 49
  Information at national and regional levels ..................................................................................................... 51
     Biomass availability and costs in USA ............................................................................................................ 51
     EU – S2Biom Study ............................................................................................................................................... 51
     Brazil ......................................................................................................................................................................... 52

5.3 Conclusions ............................................................................................................................................. 53

6.          BENCHMARKING COSTS.................................................................................... 54

6.1 Conventional biofuels Prices .............................................................................................................. 54

6.2 Comparison with fossil fuel prices.................................................................................................... 55

6.3 Benchmarking advanced biofuels costs .......................................................................................... 57

6.4 Carbon price scenarios ........................................................................................................................ 58

6.5 Benchmarking – Summary .................................................................................................................. 59

                                                                                          4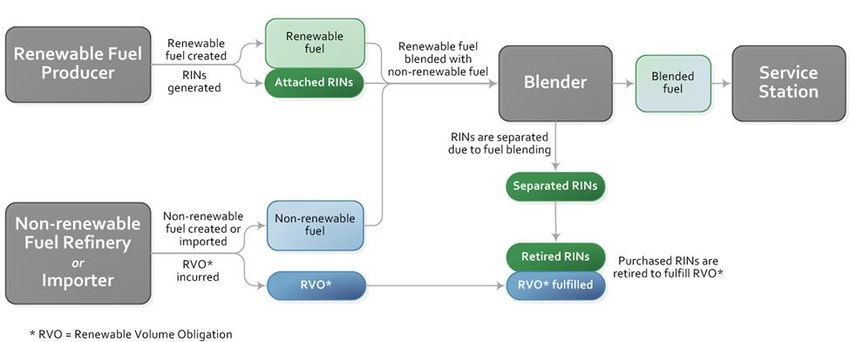
6.6 NON-FUEL cost issues ........................................................................................................................... 60

7.           POLICY SUPPORT .............................................................................................. 61

7.1 Current policy support......................................................................................................................... 61

7.2 Policy support mechanisms for advanced biofuels in US ........................................................... 61

7.3 European Union - The Renewable Energy Directive (RED) ....................................................... 63
  RED ................................................................................................................................................................................. 63
  Member State Measures .......................................................................................................................................... 63
     Denmark................................................................................................................................................................... 64
     Germany ................................................................................................................................................................... 64
     Italy ............................................................................................................................................................................ 64
     The Netherlands .................................................................................................................................................... 64
     Sweden ..................................................................................................................................................................... 65
     United Kingdom..................................................................................................................................................... 65

7.4 Brazil - The RenovaBio Program ....................................................................................................... 66

7.5 conclusion................................................................................................................................................ 66

8.           CONCLUSIONS AND RECOMMENDATIONS ....................................................... 66

REFERENCES ............................................................................................................... 69

APPENDICES ............................................................................................................... 73

APPENDIX 1 – LIST OF ABBREVIATIONS ...................................................................... 73

APPENDIX 2 - QUESTIONNAIRE TO ESTABLISH TECHNOLOGY STATUS AND COST AND
COST REDUCTION POTENTIAL INFORMATION ............................................................ 75

A2.1 Information to establish technology status ................................................................................. 75

A2.2 Biofuel Process Cost Template ........................................................................................................ 76
    1. Scope for cost reduction ............................................................................................................................ 76

APPENDIX 3 - EXAMPLES OF POLICY INITIATIVES ....................................................... 78

A3.1 US RFS and California LCFS............................................................................................................... 78
  A3.1.1 US Renewable Fuel Standard ................................................................................................................... 78
  A3.1.2 California’s Low Carbon Fuel Standard (LCFS) .................................................................................. 79

A3.2 European Union - The Renewable Energy Directive (RED)..................................................... 82
  A3.2.1 The Renewable Energy Directive of 2009 (RED) .............................................................................. 82
  A3.2.2 The recast of the Renewable Energy Directive – RED-II (2018/2001 EU Directive, 2018) 83
  A3.2.3 Appendix 2 - ANNEX IX of RED II ............................................................................................................ 84

                                                                                           5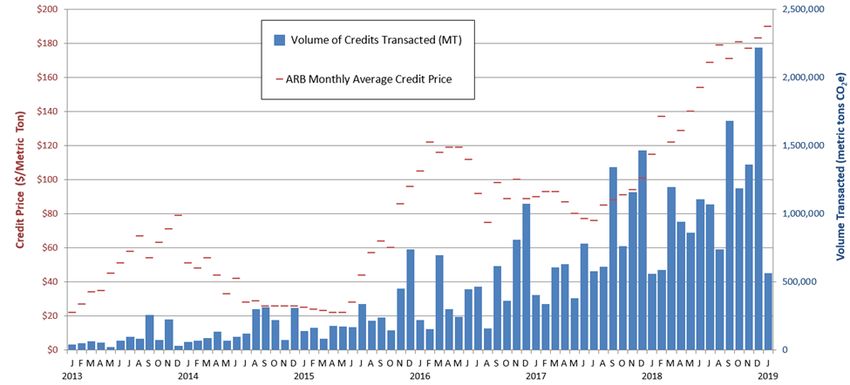
APPENDIX 4 - UNITS OF MEASURE AND CONVERSION FACTORS ............................... 86

A4.1 Units of Measure ................................................................................................................................. 86

A4.2 Conversion factors.............................................................................................................................. 86
  Energy units................................................................................................................................................................. 86
  Energy costs units ..................................................................................................................................................... 86
  Volume .......................................................................................................................................................................... 86
  Production capacity .................................................................................................................................................. 86
  Feedstock costs .......................................................................................................................................................... 87

                                                                                         6
FIGURES
Figure 1. Summary of cost estimates for methanol and methane, FT products and gasoline
hydrocarbons from thermal process chains. ........................................................................ 30
Figure 2. Summary of current cost ranges. ......................................................................... 34
Figure 3. Current cost ranges including cost breakdown. ...................................................... 34
Figure 4. Cellulosic ethanol - recent estimates and potential for cost reduction - LUX Report. ..... 37
Figure 5. Cellulosic ethanol costs after potential medium - term reductions. ............................ 39
Figure 6. Impact of medium-term cost reductions on production costs. ................................... 40
Figure 7. Cost of feedstock in the overall cost of production. ................................................. 41
Figure 8. Effect of changing finance rate and term on annual capital charge. ........................... 42
Figure 9. Impact of changing finance regime on costs. ......................................................... 42
Figure 10. Illustration of the "learning effect" from innovation to industrialisation..................... 44
Figure 11. Impact of cumulative capacity increases on costs for different learning rates. ........... 45
Figure 12. Impact of learning on costs with increasing learning rates. .................................... 46
Figure 13. Global crude oil prices 2000-2019. (USD/barrel) .................................................. 55
Figure 14. Variation in crude oil, gasoline, diesel and jet fuel prices on energy basis. ................ 56
Figure 15. Oil cost assumptions in IEA WEO 2018. ............................................................... 56
Figure 16. Comparison of advanced biofuels costs with current fossil and biofuels costs. ........... 57
Figure 17. Fossil fuel and carbon prices in IEA Scenarios - 2040. ........................................... 59
Figure 18. Impact of learning on costs of advanced biofuels, and projections for fossil fuel and
carbon prices. ................................................................................................................ 60
Figure 19. The market value of cellulosic ethanol in California in 2016 and 2018 (USD/gallon). .. 62
Figure 20. Increase in alternative fuels in California 2011 - 2017. .......................................... 62
Figure 21. Lifecycle of a Renewable Identification Number (RIN) under RFS program. ............... 79
Figure 22. RIN prices for renewable fuels under RFS program, 2015-2018. ............................. 79
Figure 23. Volumes of alternative fuels under Californian LCFS 2011 to 2017. ......................... 80
Figure 24. Monthly LCFS credit price and transaction volumes, 2013-2018. ............................. 80
TABLES
Table 1. Number of contacts by pathway ............................................................................ 15
Table 2. Technologies considered and status of information. ................................................. 16
Table 3. Indicative HVO production costs. .......................................................................... 18
Table 4. Biomethane from AD - Production cost summary. .................................................... 19
Table 5. Lignocellulosic ethanol plants – status. .................................................................. 20
Table 6. SGAB Cost Report: Costs of lignocellulosic ethanol production. .................................. 21
Table 7. D3Max - Costs summary. .................................................................................... 22
Table 8. Overview of thermal projects contributing new cost information. ............................... 26
Table 9. Production cost of methanol and biomethane. ......................................................... 29
Table 10. Production cost of FT and gasoline hydrocarbons. .................................................. 29
Table 11. Pyrolysis oil costs - co-processing and standalone upgrading. .................................. 31
Table 12. Summary of current production cost ranges. ......................................................... 33
Table 13. Cost reduction assumptions for pessimistic and optimistic cases. ............................. 38
Table 14. Potential costs of cellulosic ethanol production after reductions. ............................... 38
Table 15. Corn-fibre to ethanol production costs. ................................................................ 39
Table 16. Potential costs of thermal biofuels production after reductions ................................. 40
Table 17. Potential costs of biofuels production after reductions. ........................................... 43
Table 18. Summary of sustainable biomass resources. ......................................................... 50
Table 19. Biomass availability and cost estimations for near term and long-term scenarios in the
USA. ............................................................................................................................. 52
7Table 20. Biomass selling prices in Brazil (Eur/tonne). ......................................................... 53
Table 21. Range of carbon prices EUR/tonne CO 2eq in IEA WEO Scenarios. ............................. 58
Table 22. Renewable fuels categories under the RFS program. .............................................. 78
Table 23. Alternative low carbon fuel premiums at sample LCFS credit prices. ......................... 81
Table 24. Greenhouse gas savings thresholds in RED II. ....................................................... 84
8Executive Summary
• Bioenergy already plays an important role in the global energy economy, and it’s expanded
use is a critical element in future low carbon scenarios, where it can especially play an
important role in reducing greenhouse gas (GHG) emissions from the transport sector.
Decarbonising transport will require a range of bio-based transport fuels, and especially
advanced low carbon fuels which are suitable for long-haul transport applications including
aviation. A number of appropriate technologies to produce such fuels are being developed
and commercialised. However so far, their production has only reached a limited scale.
• The costs of these advanced biofuels are currently higher than those of the fossil fuels which
they can displace and of more conventional biofuels such as ethanol from sugar or corn, or
biodiesel. It is therefore important to consider what scope there is to reduce the production
costs of a range of advanced biofuels, and to identify under what conditions they could
become affordable.
• This project uses as its starting point a study on the costs of advanced biofuels carried out
within the programme of work of the Sub-Group on Advanced Biofuels (SGAB) (under the
European Commission’s Sustainable Transport Forum (STF)) and published in 2017. The
report on this study reviewed data available on the current costs of producing a range of
advanced biofuels, based on extensive contact with industry and other players active in the
field. The aims of this project are to:
o Update and extend the SGAB study to provide estimates of the current costs of
producing a selection of relevant advanced biofuels;
o Identify the scope for cost reduction for these advanced biofuels;
o Develop a model for likely cost reduction progress as deployment grows;
o Compare these costs and cost trajectories with likely trends in fossil fuel prices,
and those of conventional biofuels.
o Examine the impact of policy measures, including carbon pricing, on the economic
competitiveness of advanced biofuels.
• Information gathered from industry and other sources for this study has largely confirmed
the estimates of the current costs of producing advanced biofuels contained in the earlier
SGAB cost analysis report. Costs lie in the range of 65 to 158 EUR/MWh (17-44 EUR/GJ)
for production based on biomass feedstocks and 48 to 104 EUR/MWh (13-29 EUR/GJ) for
waste-based production, illustrating the cost advantages of using waste feedstocks. 1 This
compares with a recent range of fossil fuel prices of 30-50 EUR/MWh (8–14 EUR/GJ).
• Early market opportunities exist for producing lower cost advanced biofuels from wastes,
and through integration of advanced biofuel production with existing biofuels processing
plants. However, such opportunities are relatively limited and will not in themselves enable
1
Many different units are used to describe energy and energy costs. In this report the costs are principally presented in terms of EUR/MWh and in
EUR/GJ in summary information. A range of energy and energy cost conversion factors are provided in Appendix 4.
9production at levels likely to be needed to meet low carbon scenario expectations.
• There is significant potential for cost reduction through R&D and through experience being
gained in the current generation of demonstration and early commercial plants. If a number
of additional commercial plants are built, it is anticipated that capital and operating costs
could be significantly reduced, while scope for feedstock cost reduction is judged to be more
limited. Overall production costs could be reduced by between 5-27% compared to the
current cost estimates. In addition, if increased experience makes it possible to finance
plants on more favourable terms which would reduce costs further. For example, reducing
the financing rate from 10% to 8% and extending the financing term from 15 to 20 years
would further reduce costs by some 5-16%. Taken together these measures can reduce the
production costs range for biofuels produced from biomass feedstocks to between 42 and
119 EUR/MWh (12-33 EUR/GJ) and 29-79 EUR/MWh (8-22 EUR/GJ) for waste-based fuels.
• Large scale deployment of the technologies, in line with the patterns needed to meet the
ambitions for advanced biofuels within a number of low carbon scenarios, could lead to
additional significant cost reductions through technology learning, if plant capital and
operating costs fall in line with a learning curve. Such reduction could be significant given
large scale roll-out of the technologies (potentially up to 50% further reductions in the most
optimistic cases studied), although given the range of complicating factors it is difficult to
estimate the scope for such reductions precisely.
• As capital and operating costs fall, the feedstock costs assume a greater importance in the
overall cost structure. It is difficult to predict feedstock cost and price trends particularly in
situations where demand is significantly scaled up. While global and regional studies
indicate that significant quantities of wastes residues and energy crops could be available
at roadside costs below 20 EUR/MWh (5.6 EUR/GJ), more detailed studies are needed to
confirm that feedstocks could practically be delivered at these costs taking all the logistical
and market factors into account.
• Comparison of the estimates of the current costs of production of the range of advanced
biofuels with the prices of the fossil fuels that they aim to replace indicates a significant
cost gap of between 12 and 128 EUR/MWh (3-36 EUR/GJ). If the medium-term cost
reductions discussed above can be achieved this gap could be narrowed but it will still be
significant for many of the pathways.
• Policy support will be therefore be needed to enable these technologies to mature either in
terms of added value for low carbon fuels or a substantial carbon costs applied to fossil
fuels. For biomass based fuels a carbon price in the range of 49-525 EUR/tonne CO2eq would
be needed to bridge the current gap. This would be reduced to 0-365 EUR/tonne CO2eq if
the medium term cost reductions discussed above are achieved, and could be reduced
further by cost reductions linked to learning effects stimulated by large-scale deployment.
• In the longer term, the effective cost of using fossil fuels may rise through a combination
of higher prices and more extensive carbon pricing, or other incentives may be available for
low carbon transport fuels. If there is an extensive increase in the production capacity of
advanced biofuels at the scale envisaged within low carbon scenarios, then there is the
prospect of the technologies being cost effective in the context of anticipated fossil and
carbon prices such as those in the IEA’s World Energy Outlook scenarios.
• While the costs of advanced biofuels and other fuels discussed above are an important
factor, a broader range of issues also need to be considered when comparing these and
10other low-carbon options. These issues include the extent to which they can directly replace
fossil fuels, the costs of any modifications or of distribution costs associated with the fuels,
the likely availability of feedstocks and the life-cycle GHG emissions and other sustainability
criteria associated with particular routes. The overall consideration of the future for
advanced biofuels need to be seen in the context of all these other factors as well as the
energy costs.
• Large scale deployment will depend on continuing policy support. First, industry will need
support during the risky and costly demonstration and early commercialisation of the
technologies, so as to bridge the “valley of death”. Continuing strong support will also be
needed to offset the differences between biofuels and fossil fuel prices, either by
internalising external costs associated with GHG emissions associated with fossil fuel use or
by incentivising low-carbon transport fuels.
• There are some examples of policy and regulatory portfolios which have been introduced
and are successfully leading to some early deployment and use of advanced biofuels. For
example, in the US state of California the federal level Renewable Fuel Standard (RFS) and
state-level Low Carbon Fuel Standard together provide effective market support at levels
which are sufficient to stimulate the growth of advanced biofuels in the California market.
Similar policy support measures are being introduced in other regions and the impact and
costs of such policies should be monitored so that policy best practice can be identified and
applied more widely.
111. Introduction
1.1 BACKGROUND
A number of recent studies highlight the important role that bioenergy already plays in the global
energy economy and the critical role it can have in a future low carbon economy. The International
Energy Agency (IEA) has noted that bioenergy is the most important renewable energy technology
today in terms of its contribution to global final energy consumption, providing 13% of global energy
needs (IEA, 2018). Some two-thirds of this is provided by the traditional use of biomass for cooking
and heating in emerging and developing countries, which in many cases is not considered as a
sustainable practice. More modern uses of bioenergy for heating, electricity production and for
transport make up 5% of final global energy consumption. Sustainable bioenergy at present provides
a contribution to final energy consumption which is around five times higher than those from wind
and solar combined. Biofuels provide the only sizeable source of renewable liquid and gaseous fuels,
providing some 3% of global transport energy.
The role of bioenergy in future low-carbon energy futures has also been emphasised.
• In the IEA’s 2DS Scenario, the contribution of bioenergy increases 4-fold by 2060 (IEA,
2017). In this scenario, the contribution of biofuels in transport rises 10-fold by 2060,
approaching 30 EJ and providing around 30% of the transport sector’s total energy needs,
with particularly important roles in aviation, shipping and other long-haul transport.
• In the International Renewable Energy Agency’s (IRENA) REMap scenario, an increase in
renewables and improvements in energy efficiency provide over 90% of the necessary
energy-related CO2 emission reductions to 2050 (IRENA, 2018). In this scenario, bioenergy
provides 22% of total global energy needs for transport.
To succeed in playing these important future roles in transport, there will be a need for new
technologies that can produce biofuels that can be used in sectors that are difficult to decarbonize
in other ways, such as aviation, shipping and other long-haul transport. The new biofuels will need
to be suitable for these end-uses, be produced from sustainable feedstocks, and have very low
associated greenhouse gas (GHG) emissions, complementing more established conventional biofuels
such as ethanol from feedstocks such as grain and sugars, Fatty Acid Methyl Ester (FAME) and
Hydrotreated Vegetable Oils (HVO).
A range of interesting technologies and routes to renewable fuels which promise to meet these
needs are under development. However, they are not yet fully commercialised or operating at scale.
The status of the technologies has recently been reviewed by the Alternative Renewable Transport
Fuels Forum (ART Fuels Forum) (Landalv, et al., 2018). So far production of these fuels is at a low
level. The scenario assumptions imply a massive scale up in capacity and production – with of the
order of over 4,000 large scale production plants needed to produce the necessary fuel. 2
The production costs of advanced biofuel options are currently higher than both those of their fossil
fuel counterparts and of conventional biofuels, on an energy basis. It is therefore important to
understand the potential for cost reduction. This could come about through Research & Development
2
Assuming a production capacity for each plant equivalent to 200MW – see Section 4.3.
12(R&D) and through increased experience, which can lead to cost reductions through:
• Reductions in feedstock production and logistics costs, and delivery of feedstock with
consistent quality (although this may be offset by increasing feedstock prices driven by
increased demand and the need to move to higher costs feedstocks).
• Technical process performance improvements and cost reductions.
• Realising benefits of scale through increases in plant capacity.
• Experience of building and operating large-scale production plants.
• Capital and financing for plants becoming available on more favourable terms, as risks are
reduced and confidence in the technologies grow.
• Co-location and integration of advanced technologies in existing fuel or industrial production
infrastructures (bio-based and fossil-based) and potentially to carbon capture and use or
storage.
From a policy perspective, it is important to understand if and under what conditions these novel
advanced biofuels and low-carbon fuels could be affordable compared to other fuels used in the
respective sectors. This can help to understand how much financial support will be required to
support the new technologies during the demonstration and initial commercialisation phases.
Understanding the potential for cost reduction also allows assessments of the need for and likely
cost of policies that promote the development of such fuels, and of the likely total public and private
investment needed to achieve the targets.
1.2 THE SUB-GROUP FOR ADVANCED BIOFUELS (SGAB) COST STUDY
This project uses as its starting point a study on the costs of advanced biofuels carried out within
the programme of work of the Sub-Group on Advanced Biofuels (SGAB) (under the European
Commission’s Sustainable Transport Forum) and published in 2017 (Landalv, et al., 2017). The
report on this study reviewed data available on the current costs of producing a range of advanced
biofuels, through extensive contact with industry and other players active in the field. A parallel
study carried out under the SGAB looked at the extent to which the various technologies had been
commercialised at scale. This status study has recently been updated under the aegis of the ART
Fuels Forum (Landalv, et al., 2018).
For the SGAB cost study, a questionnaire was developed to establish the status of particular technical
developments and to assess the current costs of production. This approach was successfully used
to create a dialogue with project developers who were willing to provide detailed information. The
technology performance and cost data provided were reviewed for consistency with other known
sources (to avoid over optimistic cost figures) and then estimated cost ranges were “played back”
to the participants to get their acceptance of the collated cost data and resulting figures.
1.3 PROJECT OBJECTIVES
This project extends the SGAB cost study by updating information on the current costs of advanced
biofuels, and by establishing the scope for cost reduction through dialogue with industry. The aims
of this project are to:
• Identify the current costs of producing a selection of relevant novel advanced biofuels;
13• Identify the scope for cost reduction for these advanced biofuels;
• Develop a model for likely cost reduction progress as deployment grows;
• Compare these costs and cost trajectories with likely trends in fossil fuel prices, and those
of conventional biofuels;
• Examine the impact of policy measures, including carbon pricing, on the economic
competitiveness of novel biofuels.
2. Methodology
The project was carried out in three main phases:
• Data collection.
• Data analysis and modelling.
• Benchmarking.
2.1 DATA COLLECTION
This phase of the project aimed to gain updated information from project developers and experts in
the EU, North America, Brazil and other regions to update and extend the prior work carried out
under SGAB Cost Study. The project also aimed to identify the potential for further cost reduction,
based on industry expert views.
The study built on the approach used in the SGAB’s Technology Status Report and Cost of Biofuels
Reports. The questionnaire used in that work was expanded with some additional questions added
to collect technical status information for pathways not included in the previous SGAB work, and
also to identify the scope for further cost reduction.
In order to protect commercial security, the report has aggregated the information from a number
of sources to provide a composite analysis for each conversion route. When in some places specific
data (other than information already in the public domain) has been included in this report, the
agreement of the company has been obtained. A copy of the questionnaire is provided in Appendix
2.
2.2 SCOPE
The project has focussed on technologies that have been developed at least as far as the
construction and operation of a pilot plant, given the difficulties of establishing reliable costs and
conversion efficiencies for earlier-stage technologies.
The project team contacted 89 companies active in developing projects and associated with a wide
range of technologies and fuels and located in Europe, North and South America and Asia.
Table 1 shows the spread of these contacts between the relevant technologies.
14Table 1. Number of contacts by pathway
Pathway No of Contacts
Synthetic fuels via gasification 18
Pyrolysis and upgrading 9
HTL 3
Lignin to fuels 3
HVO and UCOME 7
Lignocellulosic ethanol via fermentation 14
Lignocellulosic ethanol by co-fermentation of starch 3
Fermentation and sugars to hydrocarbons 5
Alcohols to hydrocarbons 6
Biogas and biomethane 8
Other aviation fuels 2
Power to X 5
Other processes and contacts 6
Total 89
While some 38 companies provided responded to the requests for information, many companies
were only able to confirm that the cost estimates of current production costs contained in the SGAB
Cost Report were still relevant. Some data provided by companies was based on preliminary costs
estimates which did not meet the minimum criteria of being based on pilot plant operation. This
information was not taken into account in the study.
Relatively few companies were able to offer detailed insights into the future potential for cost
reduction. The inputs from direct contact with companies were complemented by a number of
recently published techno-economic studies for projects where relevant.
2.3 DATA ANALYSIS AND MODELLING
The data collected through the questionnaire described above has been supplemented with recently
published data to update estimates of current costs of production of the fuels to be studied. For
some less mature pathways there was insufficient detailed information available to allow a detailed
analysis either from industry sources or from the literature.
Information from companies has also been used as the basis for estimating the medium-term cost
reduction potential (i.e. within 10-15 years) from various routes to advanced biofuels. In many
cases the information obtained was generic and not very detailed.
The longer-term potential for cost reduction (i.e. > 15 years) has been modelled by assuming that
15there is a significant expansion in production capacity, as required to meet low carbon scenario
aspirations. The analysis considers the effects on cost of a range of learning rates, which have been
experienced in other similar sectors, including conventional biofuels production.
2.4 BENCHMARKING COSTS
The projected costs of the fuels studied has been compared against the recent ranges of fossil fuel
prices, along with those of some conventional biofuels such as bioethanol and biodiesel.
The projected future costs of the biofuels studied have also been compared with possible future
fossil fuel price scenarios, using the fuel price assumptions incorporated within the IEA’s World
Energy Outlook (WEO) (IEA, 2018) scenarios, including the New Policy Scenario and the Sustainable
Development Scenario (IEA, 2018). The analysis has also examined how some current biofuels
support schemes are supporting the production and use of advanced biofuels, and how future carbon
pricing regimes might impact the cost effectiveness of the studied fuels, using carbon costs cited in
the IEA WEO scenarios.
3. Information on current costs of production
This section provides a summary of the estimated current costs of production of a range of advanced
biofuels. This is either based on updated cost information provided by the companies we contacted,
or on the information in the earlier SGAB Cost Report. Where new data has become available this is
compared with the SGAB information to provide an update. Table 2 indicates the technologies
covered, and whether updated information is provided.
Table 2. Technologies considered and status of information.
Update
Technology Route
Information
Hydrotreated vegetable oil (HVO) No
Biomethane from Anaerobic Digestion No
Ethanol from lignocellulosic sugar via fermentation Yes
Synthetic fuels via gasification (including biomethane, Yes
oxygenates such as methanol, ethanol and DME and
synthetic long chain hydrocarbons such as FT diesel,
gasoline or kerosene)
Pyrolysis oil and upgrading Yes
There are many units that could be used to report cost data and production capacities. In order to
deal with a wide range of fuels with different energy contents and bulk densities on a common basis,
this report uses the same units as the earlier SGAB Cost report – i.e. production cost data is shown
as EUR/MWh of product, and investment costs in EUR/kW of biofuels production output capacity. To
facilitate comparisons with other studies, costs are also reported as EUR/GJ in the Executive
Summary and Conclusions sections. An extended set of conversion factors is provided in Appendix
4.
For each production route, costs are broken down into three main categories:
• the contribution of capital costs to production costs;
• the feedstock costs per unit of production;
16• other operating costs per unit of production
As a default, the capital charges are calculated using a finance cost of 10% and a project lifetime of
15 years (the sensitivity to the financing regime is discussed in Section 4). As a default, the cost
calculations assume that plants can operate for 8,000 hours/year.
The costs of producing biofuels at a specific plant will be dependent on many local factors including
the site costs and whether there is any appropriate infrastructure already in place. Feedstock costs
will also depend on the availability and cost of local resources. Even when the technologies are
mature there will therefore be a range of different production costs.
It should be emphasised that the resources available to this project only allowed a top-down
approach, using numbers readily available from respondents or public sources. The analysis is
therefore not based on a stringent and consistent techno-economic analysis based on detailed
flowsheets and equipment lists to build-up estimates (although hopefully this has been done by the
information sources). The respondents have not always given a break-down and even if such data
was available for a sanity check, the data in this report has been amalgamated into one figure. Thus,
it has not been possible to apply consistent costs for power, water, staffing costs, etc. There are
also variations in the way individual organisations have provided the data. For example, in some
cases the supply of hydrogen or oxygen has been treated as an operating cost, and in others specific
process units have been included in the investment cost and utility and energy operating costs.
Given the aim of this project, the resources available and the availability of information, we have
not attempted to derive plant specific costs, but to develop some broader cost estimates that allow
us to judge in what range current and future costs lie and then how these compare with the costs
of alternatives.
3.1 HVO
The Hydrotreated Vegetable Oil process (HVO) and Hydrotreated Esters and Fatty Acid (HEFA)
processes converts raw materials such as such as free fatty acids or triglycerides (found, for
example, in vegetable oils and animal fats) with hydrogen using catalysts under high pressure at
temperatures between 300-400°C, followed by some degree of isomerisation and product separation
by distillation. The main product is in the diesel fuel range, but kerosene and gasoline are also
obtained in the process to a varying degree, depending on the process severity and degree of
isomerisation. By-products are propane from the hydrogenation of the glycerol and light gases, as
well as water and CO2. The hydrogen can either be derived from the propane or be produced from
natural gas or could come from electrolysis using electricity from fossil or renewable sources. The
hydrogen production route would affect both the costs and overall GHG reductions achieved.
The scale of HVO units range from 0.05 to 1 million (metric) tonnes output. In 2017, some 5 million
tonnes of HVO were produced globally. This figure is expected to increase to 6-7 million tonnes/year
by 2020 and continue to increase thereafter. Some plants have been built specifically to produce
HVO. In addition, some existing oil refineries have been converted to produce HVO or to allow co-
processing of HVO with fossil streams in existing refineries. This leads to a wide range of specific
investment costs.
The technology is mature. The main issue is the availability of sustainable feedstock, since the use
of virgin vegetable oil feedstocks (notably palm oil) is increasingly unacceptable in many markets.
Lipid wastes, including Used Cooking Oils (UCOs) and industrial wastes, are increasingly being
17collected and used as feedstocks. Oil crops which can be produced in ways with reduced risks of
direct and indirect land-use change are being developed for large scale use in HVO production. These
include brassica carinata, camelina etc. In the long-term, algae lipids could contribute additional
feedstock. Production costs are shown in Table 3. They are dominated by the feedstock costs, which
can make up 65-80% of the production costs. The cases reflect a range of situations from a refinery
upgrade to allow co-processing, refinery revamps to HVO, and stand-alone self-supporting facilities.
The demand for HVO and industrial production capacity is expanding very rapidly and finding
sufficient sustainable feedstock is likely to lead to cost increases and volatility, which will influence
production costs.
Table 3. Indicative HVO production costs.
Low Medium High
Investment costs (EUR/kW) 200 600 1,000
Feedstock cost (EUR/MWh) 40 60 60
Contribution to product costs - EUR/MWh product
Capital 3 6 15
Feedstock 40 60 60
Other Operation & Maintenance 8 12 16
(O&M)
Total 51 78 91
3.2 BIO-METHANE VIA ANAEROBIC DIGESTION
Anaerobic digestion (AD) technologies usually use a wet feedstock, although solid feedstocks
(containing 30-35% dry matter content) are also increasingly used in so-called solid-state
fermentation, especially for waste fractions. The feedstock is processed in a digester under anaerobic
conditions at atmospheric pressure and temperatures slightly above ambient, in the range between
35°C and 60°C, and with a residence time of one to fifty days, depending on the substrate and
temperature used. The product, biogas, contains methane (up to 50-70% by volume), CO 2 and
some minor constituents/contaminants. To use the biogas as a transport fuel it is upgraded by
removal of the CO2 and the contaminants to reach 97% methane by volume. There is a variety of
proven technologies for this purpose.
AD is a widely used process. In Europe alone there are 18,000 biogas plants. Over 95% are
decentralised Combined Heat and Power plants (CHP) at small scale (average 0.5 MW el). There were
just over 500 plants where the biogas was upgraded to bio-methane in Europe in 2017. 200 of these
were in Germany, almost 100 in the UK, and 65 plants in Sweden (Calderón, et al., 2019).
Processing via anaerobic digestion is done in smaller capacity plants (typically between 1-20 MW)
compared to other biofuel technologies. Plants which upgrade biogas to biomethane are usually at
the upper end of the capacity scale with 5-20 MW product output. Biomethane production amounted
to 17 TWh in Europe 2017, but the total nameplate capacity is three times larger, i.e. an average
of 12 MW per unit, with many plants operating below full capacity. The investment cost is of the
order of 1,500-3,000 EUR/kW.
The annual operating cost is around 10-15% of the investment cost, with the main elements relating
18to the heat required for the process and the electricity used both in the biogas plant and in upgrading
and compression. The Operational Expenditure cost (OPEX) depends heavily on the scale, since the
staffing requirements are more or less independent of the capacity and can then become the
dominant cost at smaller capacities. The choice of feedstock affects the value, or cost of disposal,
of the digestate and has a strong influence on the overall economics.
There is a large variety of substrates available for biogas plants, including organic waste fractions,
farm-yard manure, sludge from sewage treatment, food and meat processing industrial wastes. In
addition, energy crops and straw can be used alone or in combination with other feedstocks. The
feedstock cost can range widely from a negative cost up to 100 EUR/tonne for feedstocks such as
straw. The biogas yield from the variety of substrates may in practice range from 150 Nm3/tonne
to 600 Nm3/tonne of dry substance. The feedstock component of the production cost is a complex
matter beyond the scope of this report, and the reader is referred to more specialised literature on
this subject. For the purpose of this work the contribution of feedstock to the final product cost is
estimated to range between -13 EUR/MWh and 50 EUR/MWh. Table 4 summarises the range of costs
for production of biomethane by AD as cited in the SGAB cost report.
Table 4. Biomethane from AD - Production cost summary.
Low High
Investment costs (EUR/kW) 1,500 2,000
Contribution to product costs - EUR/MWh product
Capital 25 33
Feedstock -13 50
Other O&M 28 38
Total 40 120
3.3 ETHANOL FROM LIGNOCELLULOSIC SUGAR VIA FERMENTATION
Background
The production of ethanol from lignocellulosic materials by pre-treatment, enzymatic hydrolysis and
fermentation is one of the most researched routes for the production of advanced biofuels, with
some handful of commercial scale projects currently in operation, and several new plants currently
being constructed and commissioned. These are summarised in Table 5.
Many different feedstocks are being used, depending on local availability. These include sugar cane
bagasse and straw, cereal straws and corn stover and wood residues. A number of energy crops,
including energy grasses, miscanthus and short rotation forestry crops could in principle also be
used as feedstocks.
19Table 5. Lignocellulosic ethanol plants – status.
Plant / Owner Status* Country Capacity Start-up Comment
m3/year Year
Raizen/ Cosan, Shell O Brazil 40,000 2015 Production not yet at full
capacity
Bioflex 1/ GranBio U Brazil 82,000 2014 Redesigned - to be restarted
2019
Liberty/ Poet & DSM O USA 76,000 2015 Operational
Crescentino/ENI O Italy 50,000 2013 Sold by M&G to ENI in 2018
Kajaani/St1 O Finland 10,000 2017 Cellunolix technology
Bargarh/ C India 40,000 2021 Praj technology
Bharat Petroleum
Podari/Clariant C Romania 60,000 2020 Under construction
ABRPL refinery C India 60,000 2021 Formicobio technology
Bhatinda Plant/ HPCL C India 40,000 2020 DBT-ICT technology
Enviral P Slovakia 62,000 2022 Clariant technology.
Investment not yet taken
Bina/ Bharat Petroleum P India 40,000 2023 DBT-ICT technology.
Investment decision not yet
taken
Raizen/ Cosan, Shell O Brazil 40,000 2015 Production not yet at full
capacity
* Key: O = In operation; U = Upgrade in progress; C = Under construction;
P = Planning in progress
SGAB cost data
The SGAB cost report included an extensive analysis of the costs of fermentative ethanol production
from cellulosic materials, based on information gained from a number of projects being operated in
different world regions and using different feedstocks.
The capital cost of a production plant makes up a significant part of the overall costs. Considering a
range of different plants, it was concluded that the capital costs lay in a range between 2,570
EUR/kW and 3,650 EUR/kW of ethanol production depending on various aspects e.g. plant size,
technology complexity, evolution of the learning curve, and plant location.
Feedstock costs depend significantly on the type of material being used and whether it has to be
specifically collected or produced, or if it is already on site (such as sugar cane bagasse). In the
SGAB cost report, feedstock costs were considered to lie in a range of 10-20 EUR/MWh (50-100
EUR/dry tonne). With an energy conversion efficiency of 40%, feedstock adds between 25 EUR/MWh
and 50 EUR/MWh to production costs.
The costs of enzymes also play a significant role in overall production costs. These costs have been
significantly reduced - by about a factor of 10 since 2000 - through improving enzyme efficiency
and better matching of enzymes to specific feedstock types. Enzyme costs were estimated at 15–
20You can also read