Potenziale, Kosten und Umweltauswirkungen von Stromproduktionsanlagen - Paul Scherrer ...
←
→
Page content transcription
If your browser does not render page correctly, please read the page content below
Eidgenössisches Departement für Umwelt, Verkehr, Energie und
                    Kommunikation UVEK

                    Bundesamt für Energie BFE
                    Sektion Energieversorgung und Monitoring

Potenziale, Kosten und Umweltauswirkungen
von Stromproduktionsanlagen

Aufdatierung des Hauptberichts (2017),
mit Zusammenfassung auf Deutsch, Franzö-
sisch und Italienisch
Potenziale, Kosten und Umweltauswirkungen von Stromproduktionsanlagen

Datum: September 2019

Ort: Bern

Auftraggeberin: Bundesamt für Energie BFE, 3003 Bern

Auftragnehmerin: PSI – Paul Scherrer Institut

Autoren: Christian Bauer (PSI, Lead)
B. Cox, T. Heck, X. Zhang

Für den Inhalt und die Schlussfolgerungen sind ausschliesslich die Autoren dieses Berichts verant-
wortlich.

Bundesamt für Energie BFE
Mühlestrasse 4, CH-3063 Ittigen; Postadresse: CH-3003 Bern
Tel. +41 58 462 56 11 ꞏ Fax +41 58 463 25 00 ꞏ contact@bfe.admin.ch ꞏ www.bfe.admin.ch

2/3
PSI ‐ PAUL SCHERRER INSTITUT

           Potentials, costs and
       environmental assessment of
          electricity generation
               technologies
  An update of electricity generation costs and
                   potentials

               Christian Bauer (ed.), Brian Cox, Thomas Heck, Xiaojin Zhang

                                       September 16, 2019

                                PSI, Technology Assessment group
                                    SCCER supply of electricity

                                          www.psi.ch/ta
                                     http://www.sccer‐soe.ch

This report has been prepared by PSI on behalf of the Swiss Federal Office of Energy (SFOE).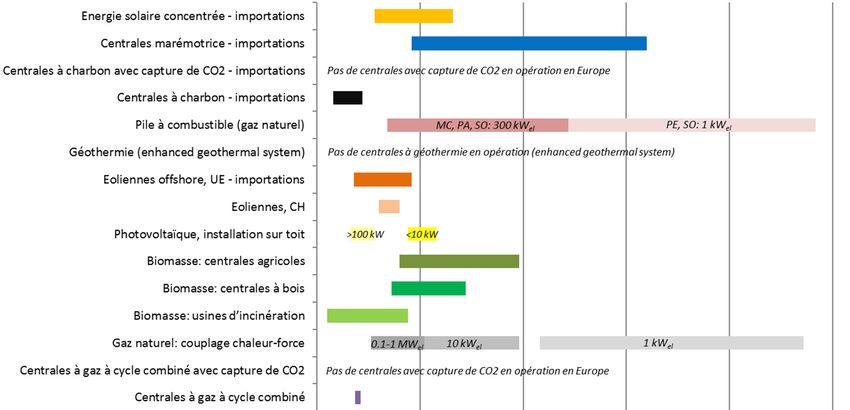
Bauer, C. (ed.) et al. (2019) Potentials, costs and environmental assessment of electricity generation technologies – An
                                       update of electricity generation costs and potentials.

Contents
1      Summary ......................................................................................................................................... 3
2      Zusammenfassung .......................................................................................................................... 6
3      Résumé ........................................................................................................................................... 9
4      Sintesi ............................................................................................................................................ 12
5      Data sheets ................................................................................................................................... 15
6      Datenblätter .................................................................................................................................. 24
7      Preface and introduction .............................................................................................................. 33
    7.1       Goal and scope ...................................................................................................................... 33
    7.2       Acknowledgement ................................................................................................................ 33
8      Methodology ................................................................................................................................. 34
    8.1       General approach for quantification of electricity generation costs .................................... 34
    8.2       Cogeneration – heat credits.................................................................................................. 34
9      Wind power .................................................................................................................................. 35
    9.1       Introduction .......................................................................................................................... 35
    9.2       General development ........................................................................................................... 35
    9.3       Electricity generation costs ................................................................................................... 36
       9.3.1          Onshore – Turbines located in Switzerland and other European countries ................. 36
       9.3.2          Offshore – Electricity imports ....................................................................................... 37
10         Solar photovoltaics (PV) ............................................................................................................ 39
    10.1      Introduction .......................................................................................................................... 39
    10.2      Electricity generation costs ................................................................................................... 39
       10.2.1         Current costs ................................................................................................................. 39
       10.2.2         Future costs ................................................................................................................... 45
    10.3      Annual electricity production potential vs. levelized cost of electricity (LCOE) ................... 47
       10.3.1         Method & Key Assumptions ......................................................................................... 48
       10.3.2         Results ........................................................................................................................... 50
       10.3.3         Limitations and future work.......................................................................................... 53
11         Natural gas power plants and combined heat and power generation ..................................... 54
    11.1      Introduction .......................................................................................................................... 54
    11.2      Natural gas prices in Switzerland .......................................................................................... 54
    11.3      Combined cycle power plants ............................................................................................... 55
       11.3.1         Current and future electricity generation costs............................................................ 56
    11.4      Combined heat and power (CHP) generation units .............................................................. 58
       11.4.1         Current and future electricity generation costs............................................................ 59
    11.5      Fuel cells ................................................................................................................................ 60
       11.5.1         Performance parameters .............................................................................................. 60
       11.5.2         Electricity generation costs ........................................................................................... 62

                                                                             1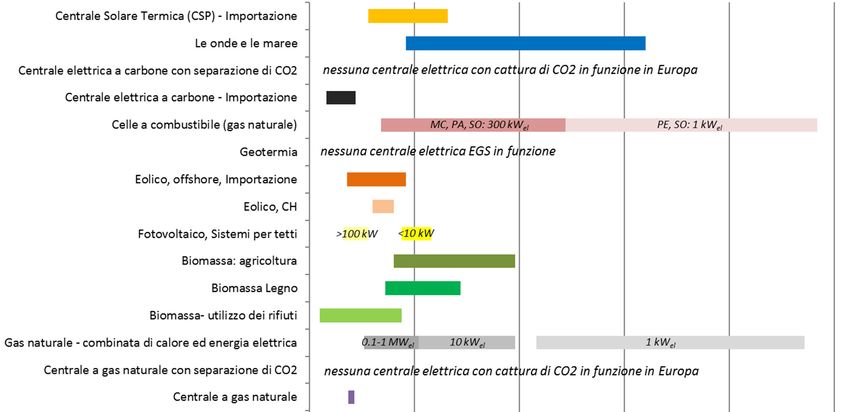
Bauer, C. (ed.) et al. (2019) Potentials, costs and environmental assessment of electricity generation technologies – An
                                     update of electricity generation costs and potentials.

12    Other technologies: electricity from biomass, coal power, wave and tidal power, deep
geothermal power, concentrated solar thermal power, nuclear power .............................................. 63
13      Environmental burdens............................................................................................................. 64
14      References ................................................................................................................................ 66

                                                                        2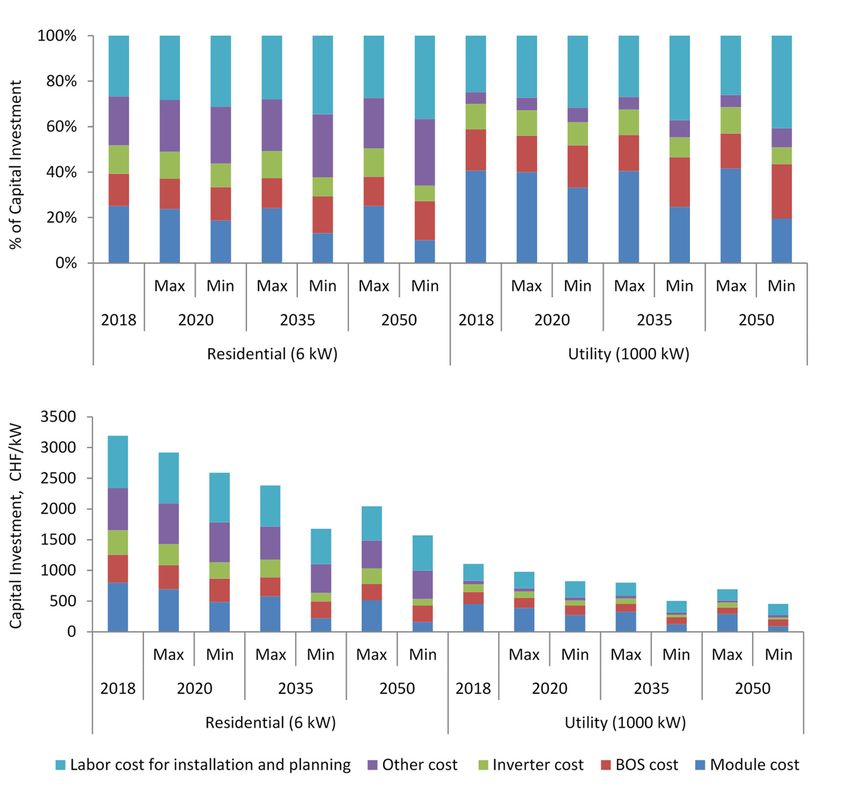
Bauer, C. (ed.) et al. (2019) Potentials, costs and environmental assessment of electricity generation technologies – An
                                       update of electricity generation costs and potentials.

1 Summary
The Swiss Federal Office of Energy (SFOE) regularly surveys the potential, costs and environmental
impacts of electricity production technologies, for the last time in 2017 (Bauer et al. 2017). In the
meantime, the production costs for photovoltaic (PV) modules have fallen further. In addition, there
is a new basis for the estimation of potential of PV systems in Switzerland1 and the potential of
hydropower has also been updated since then. Against this background, the SFOE has commissioned
PSI to update the production costs of those technologies for which significant changes can be assumed
since 2017. These are mainly photovoltaics and European offshore wind power plants. The electricity
production costs of fossil‐thermal power plants (CCGT, CHP and fuel cells) were also adjusted on the
basis of current price data for natural gas. As in the previous study, the current electricity production
costs (“levelized costs of electricity”, LCOE; reference year: 2018) are shown first; on this basis, an
estimate of the development of the costs up to the year 2050 is made. For other technologies not
included in this report (Chapter 10), it is assumed that the costs from the previous study are still valid.
The LCOE of these technologies are shown in the comparative graphs2 to provide a complete overview
– details can be found in the previous study (Bauer et al. 2017). All figures3 are also part of the data
sheets of the individual technologies (Chapter 3).
As a supplement to updating the electricity production costs, cost potential curves were established
in the present study for photovoltaic roof systems, which show how much electricity can be produced
with these systems and at what cost. For this purpose, the new cost data were combined with the
newly available information on available roof areas from the platform “sonnendach.ch”. These cost‐
potential curves represent technical potentials for electricity production with photovoltaic systems on
existing roofs in Switzerland, in each case at certain production costs. According to the available roof
area data4, the technical potential for electricity production from solar energy in Switzerland is up to
63 TWh per year (excluding facades). The economic potential will increase sharply in the future thanks
to falling costs: If the “economic limit” is set at 15 Rp/kWh, then with current investment costs and
specific space requirements of the PV modules, there is a technical‐economic potential on roofs of
around 10 TWh/a; this will increase in the future thanks to decreasing costs and less space
requirements and is put at a good 50 TWh/a for 2035. With a lower “economic limit” of 11 Rp/kWh,
there is a technical‐economic potential of around 21 TWh in 2035. An annual production of 30 TWh
could be realized at costs of at most approx. 13 Rp/kWh.5 How much of this can actually be generated
depends on the respective framework conditions.
The latest figures from SFOE on the expansion of hydropower have also been included (SFOE 2019):
the total expansion potential of hydropower (large and small hydropower) by 2050 is now
540 ‐ 2’160 GWh/a. In the 2017 study, an additional potential of 1’530 ‐ 3’160 GWh/a was estimated,
whereby the production volume expected today is already 640 GWh/a higher than in 2012 (SFOE
2012). The most important difference compared with 2012 is that the potential for small hydropower
has been reduced by around 1000 GWh/a due to the phasing out of subsidies. Based on the average
net production as of 1 January 2019 of 35’990 GWh/a, this results in an expected production of
36’530 ‐ 38’150 GWh/a for the year 2050. As climate change progresses, the glaciers will shrink,
creating glacial lakes that could also be used for hydropower. The SFOE estimates this additional
potential to be around 700 GWh/a.
Figure 1.1 shows an overview of LCOE of current electricity generation technologies, based on the
updates documented in sections 9 to 11 in this report (wind power, photovoltaics, natural gas fueled

1
  www.sonnendach.ch
2
  A mix of technologies will be required for a substantial expansion of renewable power generation.
3
  Updated figures in red.
4
  Source: https://www.uvek‐gis.admin.ch/BFE/sonnendach/
5
  PV generation costs and potentials in this summary all refer to a “roof‐top are utilization factor” of 70%.

                                                                       3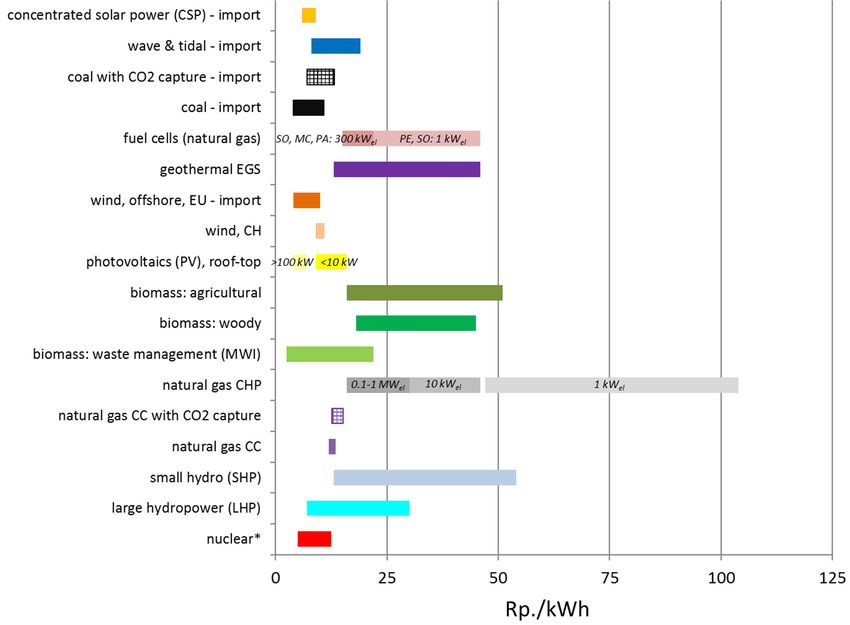
Bauer, C. (ed.) et al. (2019) Potentials, costs and environmental assessment of electricity generation technologies – An
                                      update of electricity generation costs and potentials.

combined cycle plants, CHP and fuel cells) and previously estimated costs according to (Bauer et al.
2017). Figure 1.2 shows cost estimates for year 2050.

Figure 1.1: Current (year 2018) levelized costs of electricity (LCOE).6 Ranges reflect variability in terms of site‐conditions,
technology characterization and biomass feedstock costs. Ranges for fuel cells, PV and NG CHP are mainly due to system
capacities; LCOE for specific capacities are provided in the technology fact sheets (chapter 3) and the individual technology
chapters. Electricity import costs with dedicated HVDC lines are in the order of 0.5‐2 Rp./kWh and would have to be
accounted for in addition. Heat credits for natural gas and biomass CHP as well as fuel cells are considered. NG: natural
gas; CC: combined cycle; CHP: combined heat and power; LHP: large hydropower; SHP: small hydropower; CSP:
concentrated solar power; PV: photovoltaics; EGS: enhanced geothermal systems; MC: molten carbonate; SO: solid oxide;
PE: polymer electrolyte; PA: phosphoric acid; MWI: municipal waste incineration; “coal” includes hard coal and lignite.

The changes in the current electricity production costs compared to the previous study are visible, but
not substantial: The current electricity production costs of wind power plants in Switzerland remain
roughly the same, while the costs of electricity from offshore turbines in Europe (for electricity
imports) decrease quite significantly compared to the previous estimate. The updated costs of
electricity from PV roof systems in Switzerland are somewhat lower than two years ago. The electricity
production costs of natural gas power plants, CHP plants and fuel cells are also somewhat lower, as
the updated natural gas prices are slightly lower than previously assumed and technical advances in
fuel cells are also reflected in the electricity production costs. In terms of expected electricity
production costs in 2050, offshore wind turbines show the most significant reductions compared to
the previous estimate, as the latest available literature sources are much more optimistic in their cost
estimates. For other technologies, expected electricity production costs in 2050 have been slightly
revised downwards or remain at the same level as in the previous estimate.

6
  For large hydropower and nuclear power, current costs of operating power plants, which include partially amortized capital costs, are also
shown for comparison, since these power plants will be part of the Swiss generation mix for many more years. In case of nuclear power,
“hypothetical new plants” correspond to hypothetical reactors of latest technology (Gen III), for which the planning process would start
today. More details can be found in (Bauer et al. 2017).

                                                                     4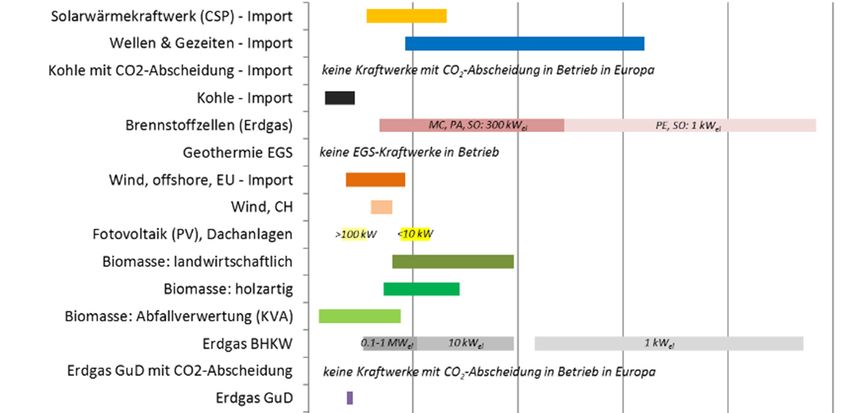
Bauer, C. (ed.) et al. (2019) Potentials, costs and environmental assessment of electricity generation technologies – An
update of electricity generation costs and potentials.
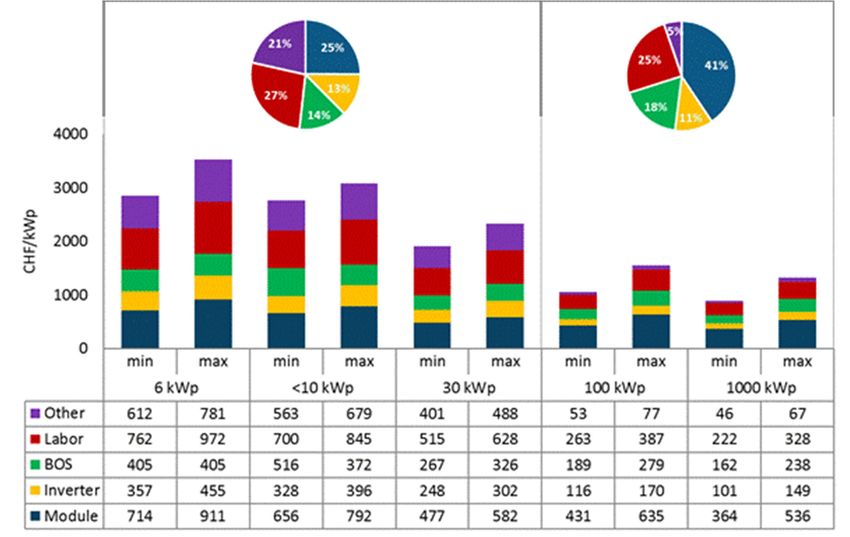
With regard to data quality and robustness of results, a clear improvement can be noted compared to
the previous study, especially in the case of photovoltaic systems. This applies on the one hand to the
total investment costs – the sample of plants for which investment costs were available was small in
2016, while several hundred cost data points from the SwissEnergy Solar Offer Check7 were now
available. On the other hand, in the previous study the allocation of costs to modules, installation, etc.
of large systems was transferred to all output classes, while specific figures are now also available for
small systems. This makes the new calculations much more reliable and meaningful.
Figure 1.2: LCOE estimated for year 2050. Ranges reflect variability in terms of site‐conditions, technology
characterization, biomass feedstock costs and future technology cost developments. Ranges for fuel cells, PV and NG CHP
are mainly due to system capacities; LCOE for specific capacities are provided in the technology fact sheets (chapter 3) and
the individual technology chapters. Electricity import costs with dedicated HVDC lines are in the order of 0.5‐2 Rp./kWh
and would have to be accounted for in addition. Potential heat credits for EGS are not included.8 Heat credits for natural
gas and biomass CHP as well as fuel cells are considered. LCOE: Levelized costs of electricity; NG: natural gas; CC: combined
cycle; CHP: combined heat and power; MWI: municipal waste incineration; LHP: large hydropower; SHP: small
hydropower; CSP: concentrated solar power; PV: photovoltaics; EGS: enhanced geothermal systems; MC: molten
carbonate; SO: solid oxide; PE: polymer electrolyte; PA: phosphoric acid; “coal” includes hard coal and lignite. *The LCOE
range for nuclear represent Generation 3+ and small modular reactor (SMR) designs, since reliable cost estimates for
Generation 4 designs, which might be an option in 2050, are not available.
7
https://www.energieschweiz.ch/page/de‐ch/solar‐offerte‐check
8
The impact of heat credits on the economic viability of EGS will be substantial, since the electric efficiencies of EGS are comparatively low
and large amounts of heat are generated. However, from the current perspective and due to risk‐related social issues, it seems to be difficult
to implement EGS at sites with large heat demand, i.e. in areas with large residential heat demand and district heat networks. Details can
be found in (Bauer et al. 2017).
5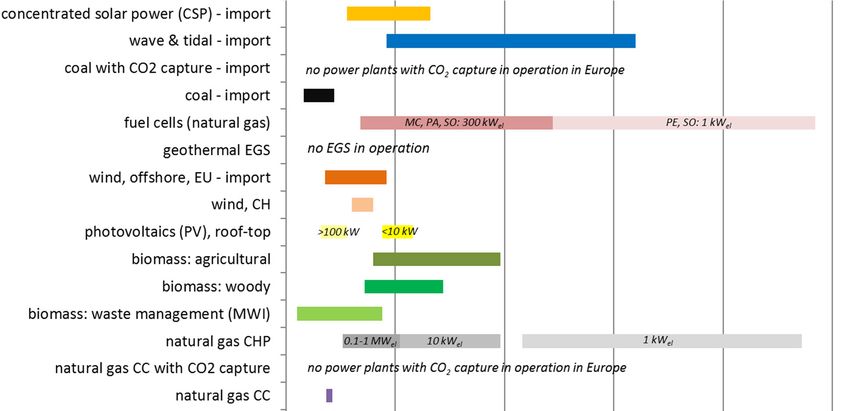
Bauer, C. (ed.) et al. (2019) Potentials, costs and environmental assessment of electricity generation technologies – An
                                        update of electricity generation costs and potentials.

2 Zusammenfassung
Das Bundesamt für Energie (BFE) lässt regelmässig Potenziale, Kosten und Umweltauswirkungen von
Stromproduktionstechnologien erheben, letztmals im Jahr 2017 (Bauer et al. 2017). In der
Zwischenzeit sind die Gestehungskosten für Fotovoltaikmodule (PV) weiter gefallen. Zudem liegen
neue Grundlagen zu den Potenzialen von PV‐Dachanlagen in der Schweiz vor9 und auch die Potenziale
der Wasserkraft wurden seither aufdatiert. Vor diesem Hintergrund hat das BFE das PSI beauftragt,
eine Aktualisierung der Gestehungskosten jener Technologien vorzunehmen, für welche seit 2017
wesentliche Veränderungen vermutet wurden. Es handelt sich dabei im Wesentlichen um die
Fotovoltaik sowie um europäische Offshore‐Windkraftanlagen. Auch die Stromproduktionskosten von
fossil‐thermischen Kraftwerken (GuD, WKK und Brennstoffzellen) wurden anhand aktueller Preisdaten
für Erdgas angepasst. Wie schon in der vorangegangenen Studie werden zunächst die heutigen
Stromproduktionskosten («levelized costs of electricity», LCOE; Referenzjahr: 2018) ausgewiesen;
aufbauend darauf wird eine Abschätzung der Entwicklung der Kosten bis ins Jahr 2050 vorgenommen.
Für weitere Technologien, welche nicht Bestandteil dieses Berichts sind (Kapitel 12), wird
angenommen, dass die Kosten aus der vorangehenden Studie immer noch gültig sind. Die LCOE dieser
Technologien sind in den Vergleichsgrafiken dargestellt, um einen vollständigen Überblick10 zu
ermöglichen – Details dazu sind in der Vorgängerstudie zu finden (Bauer et al. 2017). Sämtliche
Zahlen11 sind zudem in den Datenblättern der einzelnen Technologien enthalten (Kapitel 3).
Als Ergänzung zur Aktualisierung der Stromproduktionskosten wurden in der vorliegenden Studie für
Fotovoltaik‐Dachanlagen Kosten‐Potenzialkurven erstellt, welche zeigen, wie viel Strom mit diesen
Anlagen zu welchen Kosten produziert werden kann. Dafür wurden die neuen Kostendaten mit den
neu verfügbaren Informationen zu verfügbaren Dachflächen aus der Solarplattform «sonnendach.ch»
kombiniert. Diese Kosten‐Potenzialkurven repräsentieren technische Potenziale zur Stromproduktion
mit Fotovoltaikanlagen auf vorhandenen Dächern in der Schweiz, dies jeweils zu bestimmten
Produktionskosten. Den Daten bzgl. verfügbarer Dachfläche zufolge12 beträgt das technische Potenzial
zur Stromproduktion aus Sonnenenergie in der Schweiz bis zu 63 TWh pro Jahr (noch ohne Fassaden).
Das wirtschaftliche Potenzial wird sich dank abnehmender Kosten in Zukunft stark erhöhen: Setzt man
die «Wirtschaftlichkeitsgrenze» bei 15 Rp./kWh an, dann ergibt sich mit heutigen Investitionskosten
und spezifischem Flächenbedarf der Anlagen ein technisch‐wirtschaftliches Potenzial auf Dächern von
rund 10 TWh/a; dies wird zukünftig dank abnehmender Kosten und weniger Flächenbedarf ansteigen
und für 2035 mit gut 50 TWh/a beziffert. Bei einer tiefer angesetzten «Wirtschaftlichkeitsgrenze» von
11 Rp./kWh ergeben sich technisch‐wirtschaftliche Potenziale von rund 21 TWh im Jahr 2035. Eine
Jahresproduktion von 30 TWh könnte dann zu Kosten von höchstens ca. 13 Rp./kWh realisiert
werden.13 Wie viel davon tatsächlich erzeugt werden kann, hängt von den jeweiligen Rahmenbe‐
dingungen ab.
Auch die neusten Zahlen des BFE zum Zubau der Wasserkraft wurden berücksichtigt (SFOE 2019): Das
gesamte Ausbaupotenzial der Wasserkraft (Gross‐ und Kleinwasserkraft) bis 2050 beträgt neu
540 bis 2'160 GWh/a. In der Studie 2017 wurde ein Zubaupotenzial von 1'530 ‐ 3'160 GWh/a ge‐
schätzt (SFOE 2012), wobei die heute erwartete Produktionsmenge bereits 640 GWh/a höher liegt als
noch 2012. Wichtigster Unterschied gegenüber 2012 ist, dass sich das Potenzial bei der Klein‐
wasserkraft wegen der auslaufenden Förderung um rund 1000 GWh/a reduziert hat. Ausgehend von
der mittleren Nettoproduktion per 1.Januar 2019 von 35‘990 GWh/a ergibt dies eine erwartete
Produktion für das Jahr 2050 von 36‘530 ‐ 38‘150 GWh/a. Durch den fortschreitenden Klimawandel

9
  www.sonnendach.ch
10
   Ein Mix von Technologien wird entscheidend sein, um einen Ausbau der Erneuerbaren voranzutreiben.
11
   Aktualisierte Werte in Rot.
12
   Quelle: https://www.uvek‐gis.admin.ch/BFE/sonnendach/
13
   Alle PV‐bezogenen Zahlen hier sind mit einem «Dachausnutzungsfaktor» von 70% berechnet.

                                                                 6
Bauer, C. (ed.) et al. (2019) Potentials, costs and environmental assessment of electricity generation technologies – An
                                        update of electricity generation costs and potentials.

werden Gletscher schrumpfen – dabei werden Gletscherseen entstehen, welche auch für die Wasser‐
kraft genutzt werden könnten. Dieses zusätzliche Potenzial wird auf rund 700 GWh/a geschätzt.
In Abbildung 2.1 sind heutige, technologiespezifische Stromproduktionskosten dargestellt, in
Abbildung 2.2 jene für das Jahr 2050. Die hier enthaltenen Kosten basieren auf den in Kapiteln 9 bis
11 dokumentierten Aktualisierungen und auf den weiterhin gültigen Zahlen aus (Bauer et al. 2017) für
die restlichen Technologien.

Abbildung 2.1: Heutige Stromproduktionskosten (Referenzjahr 2018).14 Die dargestellten Bandbreiten spiegeln
Variabilität aufgrund standortspezifischer Faktoren, Technologiecharakteristika und Biomassekosten wider. Die
Bandbreiten für Brennstoffzellen, PV‐Anlagen und Erdgas‐BHWK resultieren hauptsächlich aus den Anlagenleistungen;
Werte für bestimmte Anlagenleistungen sind in den Technologiedatenblättern und den einzelnen Kapiteln angegeben.
Kosten für Stromimporte mittels Gleichspannungsübertragung im Bereich von 0.5‐2 Rp./kWh müssen addiert werden. Für
Brennstoffzellen, Biomasse und Erdgas‐BHKW sind Wärmegutschriften berücksichtigt. GuD: Gas‐ und Dampfkraftwerk;
BHKW: Blockheizkraftwerk; KVA: Kehrichtverbrennungsanlage; CSP: “concentrated solar power”; EGS: “enhanced
geothermal systems”; MC: “molten carbonate”; SO: “solid oxide”; PE: “polymer electrolyte”; PA: “phosphoric acid”;
“Kohle” beinhaltet Stein‐ und Braunkohle.

Die Änderungen bei den heutigen Stromproduktionskosten im Vergleich zur vorangegangenen Studie
sind sichtbar, jedoch nicht substanziell: Die heutigen Stromproduktionskosten von Windkraftwerken
in der Schweiz bleiben in etwa gleich, während die Kosten von Strom aus Offshore‐Turbinen in Europa
(für Stromimporte) im Vergleich zur vorhergehenden Schätzung recht deutlich abnehmen. Die
aktualisierten Kosten von Strom aus PV‐Dachanlagen in der Schweiz sind etwas tiefer als vor zwei
Jahren. Ebenso etwas tiefer sind die Stromproduktionskosten von Erdgaskraftwerken, ‐BHKW und ‐
Brennstoffzellen, da die aktualisierten Erdgaspreise etwas tiefer sind als zuvor angenommen und sich
auch technische Fortschritte bei Brennstoffzellen in den Stromproduktionskosten niederschlagen. Bei
den erwarteten Stromproduktionskosten im Jahr 2050 weisen im Vergleich zur vorgängigen Schätzung

14
  Für Grosswasserkraftwerke und Kernkraftwerke werden auch die heutigen Stromproduktionskosten der aktuell in Betrieb stehenden
Anlagen dargestellt (Kernkraft: KKW Gösgen und Leibstadt). Im Fall der Kernenergie beziehen sich die Kosten für „hypothetische
Neuanlagen“ auf Reaktoren der dritten Generation, deren Planung heute gestartet würde – Details in (Bauer et al. 2017).

                                                                7
Bauer, C. (ed.) et al. (2019) Potentials, costs and environmental assessment of electricity generation technologies – An
update of electricity generation costs and potentials.
Offshore‐Windturbinen die markantesten Reduktionen auf, da die neuesten verfügbaren
Literaturquellen deutlich optimistischer in ihren Kostenschätzungen sind. Für andere Technologien
wurden die erwarteten Stromproduktionskosten im Jahr 2050 geringfügig nach unten korrigiert oder
bleiben auf dem gleichen Niveau wie in der früheren Schätzung.
Hinsichtlich Datenqualität und Belastbarkeit der Ergebnisse ist gegenüber der vorangegangenen
Studie vor allem bei Fotovoltaikanlagen eine deutliche Verbesserung festzuhalten. Das betrifft
einerseits die Gesamtinvestitionskosten – das Sample an Anlagen, für die Investitionskosten verfügbar
waren, war 2016 klein, während nun mehrere hundert Kostendatenpunkte aus dem Solar‐Offerten‐
Check von EnergieSchweiz15 zur Verfügung standen. Andererseits wurde in der vorgehenden Studie
die Aufteilung der Kosten auf Module, Installation etc. von Grossanlagen auf alle Leistungsklassen
übertragen, während nun auch spezifische Zahlen für Kleinanlagen zur Verfügung stehen. Somit sind
die neuen Berechnungen deutlich verlässlicher und aussagekräftiger.
Abbildung 2.2: Geschätzte Stromproduktionskosten im Jahr 2050. Die dargestellten Bandbreiten spiegeln Variabilität
aufgrund standortspezifischer Faktoren, Technologiecharakteristika, Biomassekosten und der erwarteten zukünftigen
Technologiekosten wider. Die Bandbreiten für Brennstoffzellen, PV‐Anlagen und Erdgas‐BHWK resultieren hauptsächlich
aus unterschiedlichen Anlagenleistungen; Werte für bestimmte Anlagenleistungen sind in den Technologiedatenblättern
und den einzelnen Kapiteln angegeben. Kosten für Stromimporte mittels Gleichspannungsübertragung im Bereich von
0.5‐2 Rp./kWh müssen addiert werden. Für Brennstoffzellen, Biomasse und Erdgas‐BHKW sind Wärmegutschriften
berücksichtigt, nicht aber für Geothermie.16 LCOE: “Levelized costs of electricity”; GuD: Gas‐ und Dampfkraftwerk; BHKW:
Blockheizkraftwerk; CSP: “concentrated solar power”; EGS: “enhanced geothermal systems”; MC: “molten carbonate”;
SO: “solid oxide”; PE: “polymer electrolyte”; PA: “phosphoric acid”; “Kohle” beinhaltet Stein‐ und Braunkohle. *Die Kosten
für Kernenergie gelten für Generation 3+ Reaktoren und so genannte „small modular reactors“, da für Generation 4
Reaktoren, die 2050 eine Option sein könnten, keine belastbaren Zahlen vorliegen.
15
https://www.energieschweiz.ch/page/de‐ch/solar‐offerte‐check
16
Der Einfluss von Profit aus dem Wärmeabsatz auf die wirtschaftliche Machbarkeit von EGS‐Anlagen ist bedeutend, da wegen relativ kleiner
elektrischer Wirkungsgrade grosse Mengen an (Ab‐)Wärme produziert werden. Aus heutiger Sicht erscheint es vor allem aus Perspektive
der Risikowahrnehmung unwahrscheinlich, dass Geothermie‐Kraftwerke meist in der Nähe von grossen Wärmeabnehmern errichtet werden
können. Details dazu siehe (Bauer et al. 2017).
8Bauer, C. (ed.) et al. (2019) Potentials, costs and environmental assessment of electricity generation technologies – An
update of electricity generation costs and potentials.
3 Résumé
Les potentiels, les coûts et l’impact environnemental des technologies de production de l’électricité
font périodiquement l’objet de relevés pour le compte de l’Office fédéral de l’énergie (OFEN) Le
dernier relevé date de 2017 (Bauer et al. 2017, en anglais avec résumé en français). Entretemps, les
coûts des modules photovoltaïques ont continué à baisser ; en outre le potentiel de production
d’électricité au moyen d’installations photovoltaïques sur les toits en Suisse et le potentiel de la force
hydraulique a été actualisé. Vue ceci, l’OFEN a mandaté le PSI pour qu’il procède à l’actualisation du
coût de revient des technologies dont on présume qu’il a fondamentalement changé depuis 2017. Il
s’agit essentiellement du photovoltaïque et des installations éoliennes offshore européennes. Les
coûts de production de l’électricité par des centrales à énergie fossile (centrale à gaz à cycle combiné,
couplage chaleur‐force [CCF] et pile à combustible) ont été adaptés en fonction des composantes de
prix actuelles pour le gaz naturel. Comme c’était le cas dans la précédente étude, les coûts actualisés
de production d’électricité («levelised costs of electricity», LCOE) ont d’abord été établis (année de
référence: 2018), puis une estimation de l’évolution des coûts jusqu’en 2050 a été faite. Pour les
autres technologies (chap. 10), qui n’entrent pas dans le cadre de ce rapport, on part du principe que
les coûts établis dans l’étude antérieure demeurent d’actualité. Les LCOE de ces technologies ne sont
indiqués dans les graphiques comparatifs que dans un souci d’exhaustivité; les données détaillées
figurent dans le rapport précédent (Bauer et al. 2017). Tous les chiffres figurent dans les fiches de
données spécifiques aux technologies (chap. 3).
En plus de l’actualisation des coûts de production d’électricité, des courbes coût‐potentiel ont été
établies pour les installations photovoltaïques placées sur les toits. Ces courbes montrent la quantité
d’électricité pouvant être produite au moyen de cette technologie et les coûts correspondants. Elles
ont été dessinées en combinant les nouvelles composantes de coûts avec les informations récemment
mises à disposition sur les surfaces de toit disponibles dans «toitsolaire.ch». Elles représentent le
potentiel technique pour la production d’électricité par des installations photovoltaïques sur les toits
recensés en Suisse pour un coût de production donné. D’après les données sur les surfaces de toit
disponibles, le potentiel technique pour la production d’électricité solaire en Suisse peut atteindre
63 TWh par an (sans les façades). Les coûts baissant, le potentiel économique va très nettement
augmenter à l’avenir. Si l’on fixe le seuil de rentabilité à 15 ct./kWh et tient compte des coûts
d’investissement actuels et de la surface nécessaire aux installations, le potentiel technico‐
économique sur les toits avoisine les 10 TWh par an; comme les coûts et la surface nécessaire vont se
réduire, ce potentiel est estimé à un peu plus de 50 TWh pour l’année 2035. Si le seuil de rentabilité
est abaissé à 11 ct./kWh, le potentiel technico‐économique devrait atteindre environ 21 TWh en 2035.
Si ce seuil est fixé à 13 ct./kWh, la production pourrait s’élever à 30 TWh. Ce sont les conditions‐cadres
qui détermineront la quantité d’électricité pouvant effectivement être produite.
Aussi les chiffres les plus récents de l’OFEN sur le développement de la force hydraulique ont été
intégrés dans ce rapport. Le potentiel total de développement de la force hydraulique (grandes et
petites installations hydroélectriques) d’ici à 2050 atteint désormais 540 à 2160 GWh par an. Dans
l’étude de 2017, les estimations faisaient état d’un potentiel de développement supplémentaire de
1530 à 3160 GWh par an. Or, la quantité de production attendue aujourd’hui dépasse déjà de
640 GWh par an celle de 2012. La principale différence par rapport à 2012 est le fait que le potentiel
des petites installations hydroélectriques a baissé d’environ 1000 GWh par an en raison des mesures
d’encouragement qui arrivent à leur terme. Si l’on part d’une production nette moyenne de
35 990 GWh par an au 1er janvier 2019, on obtient une production attendue se situant dans une
fourchette de 36 530 à 38 150 GWh en 2050. La fonte des glaciers due au changement climatique en
cours va entraîner la formation de lacs, qui pourraient aussi être exploités dans le domaine de
l’hydraulique. Selon les estimations de l’OFEN, ce potentiel supplémentaire pourrait atteindre
700 GWh par an.
9Bauer, C. (ed.) et al. (2019) Potentials, costs and environmental assessment of electricity generation technologies – An
update of electricity generation costs and potentials.
Dans l’illustration 3.1, les coûts de la production d’électricité actuelle sont exposés pour les différentes
technologies. Les coûts présentés ici reposent sur les données actualisées documentées aux chap. 7 à
9 et, pour les autres technologies, sur les chiffres repris, qui restent d’actualité (Bauer et al. 2017).
Dans l’illustration 3.2, ces mêmes coûts sont représentés pour l’année 2050.
Illustration 3.1 : Coûts de la production d’électricité actuelle (année de référence 2018). Les fourchettes indiquées reflètent
la variabilité due aux facteurs spécifiques aux sites, aux caractéristiques des technologies et aux coûts de la biomasse. Les
fourchettes pour les piles à combustible, les installations photovoltaïques et les CCF fonctionnant au gaz naturel
dépendent essentiellement de la puissance des installations; les valeurs pour certaines puissances des installations
figurent dans les fiches de données et les chapitres spécifiques aux technologies. Les coûts des importations d’électricité
en courant continu, de l’ordre de 0,5 à 2 ct./kWh, doivent être ajoutés. Pour les piles à combustible, la biomasse et les
CCF fonctionnant au gaz naturel, les crédits attribués pour l’exploitation des rejets de chaleur sont pris en compte. GuD:
centrale à gaz à cycle combiné; CCF: couplage chaleur‐force; CSP: énergie solaire concentrée (concentrated solar power);
EGS: géothermie (enhanced geothermal systems); MC: carbonate fondu (molten carbonate); SO: oxyde solide (solid oxide);
PE: électrolyte polymère (polymer electrolyte); PA: acide phosphorique (phosphoric acid); le «charbon» comprend la
houille et le lignite.
Les modifications survenues entre les coûts de la production d’électricité selon l’étude précédente et
les coûts actuels sont visibles, mais ne sont pas substantielles: les coûts de production d’électricité
actuels par les éoliennes en Suisse demeurent à peu près les mêmes. Par contre, le coût de l’électricité
provenant de turbines offshore en Europe (pour les importations d’électricité) diminue fortement par
rapport à l’estimation antérieure. Les coûts actualisés de l’électricité provenant d’installations
photovoltaïques placées sur les toits en Suisse ont légèrement diminué ces deux dernières années.
Les coûts de production d’électricité dans les centrales au gaz naturel, les CCF au gaz naturel et les
piles à combustible fonctionnant au gaz naturel sont également un peu plus faibles: en effet, le prix
du gaz naturel actualisé est légèrement inférieur aux estimations précédentes et les progrès
techniques dans les piles à combustible se sont répercutés sur les prix de production de l’électricité.
En ce qui concerne les coûts de production d’électricité attendus en 2050, par rapport à l’estimation
antérieure, les turbines éoliennes offshore affichent les réductions les plus marquées, car les sources
10Bauer, C. (ed.) et al. (2019) Potentials, costs and environmental assessment of electricity generation technologies – An
update of electricity generation costs and potentials.
documentaires les plus récentes sont nettement plus optimistes dans leurs estimations de coûts.
S’agissant des autres technologies, les coûts de production d’électricité attendus en 2050 ont été
légèrement corrigés à la baisse ou demeurent au niveau de la précédente estimation.
Pour ce qui est de la qualité des données et de la fiabilité des résultats, on note une nette amélioration
par rapport à l’étude antérieure, en particulier pour les installations photovoltaïques. D’une part,
l’échantillon d’installations disponibles pour les coûts d’investissement totaux était limité en 2017
alors que, pour la présente étude, plusieurs centaines de points de données relatifs aux coûts
provenant de l’outil Check‐devis‐solaire de SuisseEnergie étaient disponibles. D’autre part, dans
l’étude précédente, la ventilation des coûts (modules, installation, etc.) concernant les grandes
installations était appliquée à toutes les classes de puissance, tandis que maintenant, des chiffres
spécifiques sont aussi disponibles pour les petites installations. Ainsi, les nouveaux calculs sont
sensiblement plus fiables et plus parlants.
Illustration 3.2 : Estimation des coûts de la production d’électricité en 2050. Les fourchettes indiquées reflètent la
variabilité due aux facteurs spécifiques aux sites, aux caractéristiques de la technique, aux coûts de la biomasse et aux
coûts technologiques escomptés. Les fourchettes pour les piles à combustible, les installations photovoltaïques et les CCF
fonctionnant au gaz naturel résultent principalement des différences de puissance des installations; les valeurs pour
certaines puissances figurent dans les fiches de données et les chapitres spécifiques aux technologies. Les coûts des
importations d’électricité en courant continu, de l’ordre de 0,5 à 2 ct./kWh, doivent être ajoutés. Les crédits attribués
pour l’exploitation des rejets de chaleur sont pris en compte pour les piles à combustible, la biomasse et les CCF au gaz
naturel, mais pas pour la géothermie. LCOE: coûts actualisés de production d’électricité (levelised costs of electricity); GuD:
centrale à gaz à cycle combiné; CCF: couplage chaleur‐force; CSP: énergie solaire concentrée (concentrated solar power);
EGS: géothermie (enhanced geothermal systems); MC: carbonate fondu (molten carbonate); SO: oxyde solide (solid oxide);
PE: électrolyte polymère (polymer electrolyte); PA: acide phosphorique (phosphoric acid); le «charbon» comprend la
houille et le lignite. *Les coûts de l’énergie nucléaire sont valables pour les réacteurs de génération 3+ et les petits
réacteurs modulaires (small modular reactors), car on ne dispose pas de chiffres exploitables pour les réacteurs de
génération 4, qui pourraient être une option en 2050.
11Bauer, C. (ed.) et al. (2019) Potentials, costs and environmental assessment of electricity generation technologies – An
update of electricity generation costs and potentials.
4 Sintesi
L'Ufficio federale dell'energia (UFE) rileva regolarmente il potenziale, i costi e l’impatto ambientale
delle tecnologie per la produzione di energia elettrica. L'ultimo rilevamento risale al 2017 (Bauer et.
al. 2017); nel frattempo, i costi per i moduli fotovoltaici sono ulteriormente diminuiti. Inoltre sono
disponibili nuove basi per il calcolo del potenziale degli impianti fotovoltaici sui tetti in Svizzera17 e
anche il potenziale di energia idroelettrica è cambiato. Alla luce di ciò, l'UFE ha incaricato l'Istituto Paul
Scherrer di adeguare i costi di produzione delle tecnologie per le quali sono stati ipotizzati mutamenti
significativi dal 2017. Si tratta essenzialmente del fotovoltaico e degli impianti eolici offshore europei.
Anche i costi di produzione delle centrali termoelettriche a combustibili fossili (centrali a gas a ciclo
combinato, impianti di cogenerazione di energia elettrica e termica e pile a combustibile) sono stati
adattati sulla base degli attuali dati relativi al prezzo del gas naturale. Come nello studio precedente,
sono riportati i costi di produzione dell’energia elettrica odierni (anno di riferimento: 2018), calcolati
secondo il metodo dei «levelized costs of electricity» (LCOE), e sulla base di ciò, una stima
dell'evoluzione dei costi fino al 2050. Per altre tecnologie che non fanno parte di questo rapporto
(cfr. capitolo 10) si ipotizza che i dati relativi ai costi pubblicati nello studio precedente siano ancora
validi. I costi relativi a queste tecnologie, calcolati secondo il metodo LCOE, sono presentati sotto
forma di grafici comparativi. Questo permette di averne una panoramica completa18; dettagli sono
disponibili nello studio precedente (Bauer et. al. 2017)19. Tutte le cifre sono disponibili nelle schede
tecniche delle singole tecnologie (cfr. capitolo 3).
A complemento dell'adeguamento dei costi di produzione dell’energia elettrica, nel presente studio
sono state create delle curve che indicano il rapporto tra i costi e il potenziale degli impianti
fotovoltaici sui tetti. Tali curve mostrano quanto costa produrre una determinata quantità di energia
con tali impianti. Gli ultimi dati sui costi sono stati combinati con le nuove informazioni a disposizione
riguardanti le superfici dei tetti disponibili (cfr. piattaforma www.tettosolare.ch) e rappresentano il
potenziale tecnico teoricamente sfruttabile per la produzione di energia elettrica con impianti
fotovoltaici sui tetti in Svizzera, per determinati costi di produzione. Secondo i dati relativi alle superfici
dei tetti disponibili20, il potenziale tecnico teoricamente sfruttabile per la produzione di energia solare
in Svizzera è pari a 63 TWh all'anno (escluse le facciate). In futuro il potenziale economico crescerà
molto grazie alla riduzione dei costi: con gli attuali costi di investimento e lo specifico fabbisogno di
superficie degli impianti, impostando il «limite di redditività» a 15 ct./kWh, si ottiene un potenziale
tecnico‐economico dei tetti di circa 10 TWh/a. Questo valore tenderà ad aumentare grazie alla
diminuzione dei costi e al minore fabbisogno di superficie, nel 2035 si attesterà a circa 50 TWh/a.
Impostando un «limite di redditività» inferiore, pari a 11 ct./kWh, si ottiene invece un potenziale
tecnico‐economico di circa 21 TWh per il 2035. Una produzione annuale di 30 TWh può essere
realizzata al costo di circa 13 ct./kWh21. Quanto sarà effettivamente possibile produrre dipende dalle
rispettive condizioni quadro.
Sono stati inseriti anche gli ultimi dati dell'UFE relativi all'incremento dell'energia idroelettrica. Il
potenziale di sviluppo complessivo dell'energia idroelettrica (centrali idroelettriche piccole e grandi)
fino al 2050 si aggira tra i 540 e i 2160 GWh/a. Nello studio del 2017 era ancora stato stimato un
potenziale d'incremento di 1530‐3160 GWh/a22, tuttavia la quantità prodotta attesa supera già di
640 GWh/a il valore del 2012. La differenza principale rispetto al 2012 sta nel fatto che il potenziale
delle piccole centrali idroelettriche è diminuito di circa 1000 GWh/a a causa della promozione che sta
giungendo al termine. Sulla base della produzione netta media del 1° gennaio 2019, pari a
35 990 GWh/a, la produzione prevista per il 2050 è compresa tra i 36 530 e i 38 150 GWh/a. In seguito
17
www.tettosolare.ch
18
Una combinazione di tecnologie è decisiva per promuovere lo sviluppo delle energie rinnovabili.
19
I dati aggiornati sono disponibili in rosso.
20
Fonte: https://www.uvek‐gis.admin.ch/BFE/sonnendach/?lang=it/
21
Tutti i dati concernenti gli impianti fotovoltaici sono calcolati con un fattore di sfruttamento dei tetti del 70 %.
22
Basato su UFE 2012.
12Bauer, C. (ed.) et al. (2019) Potentials, costs and environmental assessment of electricity generation technologies – An
update of electricity generation costs and potentials.
ai progressivi cambiamenti climatici, i ghiacciai si riducono e si creano i laghi glaciali, che possono
anche essere utilizzati per l'energia idroelettrica. L'UFE prevede che questo potenziale supplementare
si aggirerà a attorno ai 700 GWh/a.
Nella figura 4.1 sono illustrati i costi di produzione dell’energia elettrica odierni delle varie tecnologie,
mentre nella figura 4.2 quelli previsti per il 2050. Tali costi si basano su adeguamenti documentati e
su dati ancora validi (Bauer et. al. 2017) per le restanti tecnologie, presentati nei capitoli 7‐9.
Figura 4.1: costi di produzione dell’energia elettrica odierni (anno di riferimento: 2018) . I margini di oscillazione esposti
rispecchiano la variabilità dei costi di produzione a seconda delle condizioni locali specifiche, del tipo di tecnologia e dei
costi della biomassa. I margini di oscillazione per le pile a combustibile, gli impianti fotovoltaici e le CTEB funzionanti a gas
naturale dipendono principalmente dalla potenza degli impianti; valori relativi a determinante potenze degli impianti
sono disponibili nelle schede tecniche delle varie tecnologie e nei singoli capitoli del rapporto. Vanno aggiunti i costi per
le importazioni di energia elettrica mediante la trasmissione a corrente continua, di importo compreso tra 0,5 e 2 ct./kWh.
Per le pile a combustibile e per le CTEB funzionanti a biomassa e a gas naturale si è tenuto conto dei ricavi risultanti dal
calore. Centrali a gas a ciclo combinato; centrali termoelettriche a blocco (CTEB); impianti di incenerimento dei rifiuti
urbani (IIRU); «concentrated solar power» (CSP); «enhanced geothermal systems» (EGS); «molten carbonate» (MC);
«solid oxide» (SO); «polymer electrolyte» (PE); «phosphoric acid» (PA); il termine «carbone» comprende carbone fossile
e lignite.
Le variazioni tra i costi di produzione dell’energia elettrica odierni e quelli del precedente studio sono
evidenti ma non sostanziali: i costi di produzione dell’energia elettrica delle centrali a energia eolica
in Svizzera sono rimasti pressoché invariati, mentre i costi dell'energia elettrica delle turbine offshore
in Europa (per l'importazione di energia elettrica) sono diminuiti notevolmente rispetto alle
precedenti previsioni. Oggi i costi di produzione dell’energia elettrica degli impianti fotovoltaici sui
tetti in Svizzera sono leggermente inferiori rispetto a due anni fa, stessa cosa vale per i costi di
produzione dell’energia elettrica delle centrali a gas, delle centrali termoelettriche a blocco (CTEB) e
delle pile a combustibile, visto il leggero calo del prezzo del gas naturale rispetto a quanto previsto e
grazie ai progressi tecnici concernenti le pile a combustibile. Rispetto alla stima precedente, i costi di
produzione dell’energia elettrica delle turbine eoliche offshore previsti per il 2050 presentano le
13Bauer, C. (ed.) et al. (2019) Potentials, costs and environmental assessment of electricity generation technologies – An
update of electricity generation costs and potentials.
diminuzioni più significative, poiché le nuove fonti di riferimento disponibili sono decisamente più
ottimiste nelle loro stime dei costi. I costi di produzione dell’energia elettrica previsti per il 2050 per
le altre tecnologie hanno subito una leggera riduzione o sono rimaste allo stesso livello rispetto alla
precedente previsione.
Rispetto allo studio precedente, la qualità dei dati e l'affidabilità dei risultati registrano un chiaro
miglioramento in particolare per quanto riguarda gli impianti fotovoltaici. Da una parte, ciò riguarda
il costo totale degli investimenti: nel 2016 il campione di impianti per i quali erano disponibili dati
relativi ai costi di investimento era ridotto, mentre ora sono disponibili centinaia di dati grazie al
Check‐preventivo‐solare di SvizzeraEnergia . D'altra parte, nello studio precedente, la ripartizione dei
costi (moduli, installazione ecc.) per i grandi impianti era stata applicata a tutte le classi di potenza,
mentre ora sono disponibili anche dati specifici riguardanti i piccoli impianti. In questo modo le stime
sono ora più affidabili e significative.
Figura 4.2: costi di produzione dell’energia elettrica stimati per il 2050. I margini di oscillazione esposti rispecchiano la
variabilità dei costi di produzione a seconda delle condizioni locali specifiche, del tipo di tecnologia, dei costi della
biomassa e dei costi della tecnologia previsti per il futuro. I margini di oscillazione per le pile a combustibile, gli impianti
fotovoltaici e le CTEB funzionanti a gas naturale dipendono principalmente dalla potenza degli impianti; i valori relativi
alle determinate potenze degli impianti sono disponibili nelle schede tecniche delle varie tecnologie e nei singoli capitoli
del rapporto. Vanno aggiunti i costi per le importazioni di energia elettrica mediante la trasmissione a corrente continua,
di importo compreso tra 0,5 e 2 ct./kWh. Per le pile a combustibile e le CTEB funzionanti a biomassa e a gas naturale si è
tenuto conto dei ricavi risultanti dal calore. Ciò non è stato fatto per la geotermia . «Levelized costs of electricity» (LCOE:
costi sistemici totali livellati); centrali a gas a ciclo combinato; centrali termoelettriche a blocco (CTEB); «concentrated
solar power» (CSP); «enhanced geothermal systems» (EGS); «molten carbonate» (MC); «solid oxide» (SO); «polymer
electrolyte» (PE); «phosphoric acid» (PA); il termine «carbone» comprende carbone fossile e lignite. *I costi dell'energia
nucleare valgono per i reattori di generazione 3+ e per i cosiddetti «small modular reactors», poiché per i reattori di
generazione 4, che potrebbero essere un'opzione nel 2050, non vi sono dati disponibili.
14Bauer, C. (ed.) et al. (2019) Potentials, costs and environmental assessment of electricity generation technologies – An
update of electricity generation costs and potentials.
5 Data sheets
The following fact sheets summarize the key figures for each technology, for which updates compared
to (Bauer et al. 2017) have been performed: hydropower, wind power, photovoltaics, and natural gas
combined cycle and cogeneration plants as well as fuel cells. Electricity generation potentials have
only been updated for roof‐top photovoltaic modules and hydropower. Updated numbers in the fact
sheet tables are highlighted in red.
15Bauer, C. (ed.) et al. (2019) Potentials, costs and environmental assessment of electricity generation technologies – An
update of electricity generation costs and potentials.
Data sheet – Large hydropower (LHP)
Technology: Hydropower plants generate power by converting kinetic or potential energy of water
into electricity. Power plants with capacities above 10 MW average gross capacity are categorized as
“large” in Switzerland. Depending on the way water is used, hydropower plants can be categorized as:
‐ Storage power plants: Water is dammed up with a dam in a reservoir, fed via a pressure pipe to a
turbine and turbined there.
‐ Run‐of‐river power plants: The water flows directly from the river to a turbine or is dammed with a
dam and then led via a discharge channel/pressure line to a turbine further downstream (discharge
power station).
‐ Pumped storage power plants: supplying peak power by moving water between reservoirs at
different elevations using pumps.
LHP plants represent mature technology. Turbine efficiencies are not expected to increase
substantially in the future.
LHP New power plants: 2020 2035 2050
current1
Potential2 33.6‐34.8 33.6‐34.811
10
(expected average, TWh/a 31.9 ~32.0
32.5‐34.2 32.5‐33.611
renewable production)
Investment costs3 CHF/kW 3’500 (2’000‐10’000) 2’000‐10’000 2’000‐10’000 2’000‐10’000
8
Electricity generation Run‐of‐river
Rp./kWh 7‐30 7‐30 7‐30 7‐30
costs4,5 Storage9
Run‐of‐river 5‐10 ~5‐10 ~5‐10 ~5‐10
GHG emissions6,7 g CO2eq./kWh
Storage 5‐15 ~5‐15 ~5‐15 ~5‐15
1
“current” refers to the most up‐to‐date information and represents modern technology on the market; current
electricity generation costs refer to new power plants to be built today; current potential refers to current annual
average expected renewable electricity production as of 1.1.2019 (expected production minus consumption of
pumps; actual production varies from year to year depending on rainfall, climate, etc.).
2
According to (SFOE 2019). Expansion and its speed beyond 2020 will predominantly depend on the economic
boundary condition and social acceptance of new LHP. Around 700 million CHF in investment contributions will
be available by 2030 for the expansion of Switzerland's large hydroelectric power plants. New constructions and
renovations/extensions of existing power plants are supposed to contribute about equally to increasing
generation. For 2035 and 2050, the upper row represents the technical potential without considering new
legislation (“Gewässerschutzgesetz”); the lower row takes into account reduction of LHP generation of 1’170
GWh/a (overall reduction: 1’300 GWh/a; 90% assigned to LHP, 10% to small hydropower in proportion to current
generation) due to effects of new legislation.
3
Available data do not allow for differentiation between storage and run‐of‐river power plants. 3’500 CHF/kW
represents a generation weighted average of potential additional LHP generation (new constructions and
extensions of existing plants) excluding projects focusing on modification of hydropeaking.
4
Generation costs include investment, operation & maintenance and other costs. Ranges provided represent
variability due to site‐specific aspects. Details concerning data used and sensitivities can be found in the report.
5
Assuming that the economically more attractive power plant sites would be exploited first, electricity
generation costs from new plants would increase from the lower range of the interval provided for today to the
higher range in 2050. In total, additional 1.6 TWh/a (not considering the effect of new legislation
(“Gewässerschutzgesetz”)) can be generated with production costs below 15 Rp./kWh.
6
Greenhouse gas emissions are used as key indicator for the environmental performance of technologies;
further indicators can be found in the report. All indicators are quantified using Life Cycle Assessment (LCA)
methodology and thus represent the complete fuel cycle/energy chain. The ranges provided are supposed to
reflect potential variability of performance due to site‐specific conditions. For comparison: the current Swiss
electricity consumption mix (including imports) has a GHG intensity of about 90 g CO2‐eq./kWh (high voltage).
7
Environmental burdens are assumed to stay constant in the future, since LCA burdens of LHP are comparatively
minor and technology development with substantial impact on LCA results of LHP is unlikely.
16You can also read