2020 Uncertainties in Yield Assessments and PV LCOE - Task 13 Performance, Operation and Reliability of Photovoltaic Systems - IEA-PVPS
←
→
Page content transcription
If your browser does not render page correctly, please read the page content below
Task 13 Performance, Operation and Reliability of Photovoltaic Systems
PVPS

 Uncertainties in Yield
 Assessments and PV
 LCOE
 2020

 Report IEA-PVPS T13-18:2020
Task 13 Performance, Operation and Reliability of Photovoltaic Systems – Uncertainty in Yield Assessments and PV LCOE

What is IEA PVPS TCP?
The International Energy Agency (IEA), founded in 1974, is an autonomous body within the framework of the Organization for Ec onomic
Cooperation and Development (OECD). The Technology Collaboration Programme (TCP) was created with a belief that the future o f energy
security and sustainability starts with global collaboration. The programme is made up of 6.000 experts across government, ac ademia, and
industry dedicated to advancing common research and the application of specific energy technologies.

The IEA Photovoltaic Power Systems Programme (IEA PVPS) is one of the TCP’s within the IEA and was established in 1993. The mission
of the programme is to “enhance the international collaborative efforts which facilitate the role of photovoltaic solar energ y as a cornerstone
in the transition to sustainable energy systems.” In order to achieve this, the Programme’s participants have undertaken a va riety of joint
research projects in PV power systems applications. The overall programme is headed by an Executive Comm ittee, comprised of one dele-
gate from each country or organisation member, which designates distinct ‘Tasks,’ that may be research projects or activity a reas.

The IEA PVPS participating countries are Australia, Austria, Belgium, Canada, Chile, China, Denmark, Finland, France, Germany, Israel,
Italy, Japan, Korea, Malaysia, Mexico, Morocco, the Netherlands, Norway, Portugal, South Africa, Spain, Sweden, Switzerland, Thailand,
Turkey, and the United States of America. The European Commission, Solar Power Europe, the Smart Electric Power Alliance (SEPA), the
Solar Energy Industries Association and the Cop- per Alliance are also members.

Visit us at: www.iea-pvps.org

What is IEA PVPS Task 13?
Within the framework of IEA PVPS, Task 13 aims to provide support to market actors working to improve the operation, the reliability and the
quality of PV components and systems. Operational data from PV systems in different climate zones compiled within the project will help
provide the basis for estimates of the current situation regarding PV reliability and performance.

The general setting of Task 13 provides a common platform to summarize and report on technical aspects affecting the qual ity, performance,
reliability and lifetime of PV systems in a wide variety of environments and applications. By working together across nationa l boundaries we
can all take advantage of research and experience from each member country and combine and integr ate this knowledge into valuable
summaries of best practices and methods for ensuring PV systems perform at their optimum and continue to provide competitive return on
investment.

Task 13 has so far managed to create the right framework for the calculations of various parameters that can give an indication of the quality
of PV components and systems. The framework is now there and can be used by the industry who has expressed appreciation towar ds the
results included in the high-quality reports.

The IEA PVPS countries participating in Task 13 are Australia, Austria, Belgium, Canada, Chile, China, Denmark, Finland, France, Germany ,
Israel, Italy, Japan, the Netherlands, Norway, Spain, Sweden, Switzerland, Thailand, and the United States of America.

 DISCLAIMER

 The IEA PVPS TCP is organised under the auspices of the International Energy Agency (IEA) but is functionally and legally autonomous. Views, findings and publica-
 tions of the IEA PVPS TCP do not necessarily represent the views or policies of the IEA Secretariat or its individual member countries.

 COVER PICTURE

 Reduction in uncertainty of yield assessment depending on the quality of the insolation data. Courtesy of Eurac Research.

 ISBN 978-3-907281-06-2: Task 13 Uncertainty in Yield Assessments and PV LCOE
Task 13 Performance, Operation and Reliability of Photovoltaic Systems – Uncertainty in Yield Assessments and PV LCOE

 INTERNATIONAL ENERGY AGENCY
 PHOTOVOLTAIC POWER SYSTEMS PROGRAMME

 IEA PVPS Task 13
 Performance, Operation and
 Reliability of Photovoltaic Systems

 Uncertainty in Yield Assessments and PV LCOE

 Report IEA-PVPS T13-18:2020
 November 2020

 ISBN 978-3-907281-06-2
Task 13 Performance, Operation and Reliability of Photovoltaic Systems – Uncertainty in Yield Assessments and PV LCOE

AUTHORS

 Main Authors
 David Moser, Institute for Renewable Energy, Eurac Research, Bolzano, Italy
 Sascha Lindig, Institute for Renewable Energy, Eurac Research, Bolzano, Italy
 Mauricio Richter, 3E, Brussels, Belgium
 Julián Ascencio-Vásquez, 3E, Brussels, Belgium
 Imre Horvath, IMEC, Leuven, Belgium
 Björn Müller, Fraunhofer ISE, Freiburg, Germany
 Mike Green, Green Power Engineering, Israel
 Jan Vedde, European Energy, Denmark
 Magnus Herz, TUV Rheinland, Cologne, Germany
 Bert Herteleer, KU Leuven, Gent, Belgium
 Karl-Anders Weiss, Fraunhofer ISE, Freiburg, Germany
 Bengt Stridh, Mälardalen University, Sweden

 Contributing Authors

 A.Schils, S. Ramesh, IMEC, Leuven, Belgium
 D. Barnard, European Energy, Denmark

 Editors
 David Moser, Institute for Renewable Energy, Eurac Research, Bolzano, Italy
 Boris Farnung, VDE Renewables GmbH, Germany

4
Task 13 Performance, Operation and Reliability of Photovoltaic Systems – Uncertainty in Yield Assessments and PV LCOE

TABLE OF CONTENTS

Acknowledgements .................................................................................................. 6
List of abbreviations ................................................................................................. 7
Executive summary .................................................................................................. 8
1 Introduction...................................................................................................... 11
2 How uncertain is the yield assessment in photovoltaic projects? ..................... 13
 2.1 Definitions .............................................................................................. 13
 2.2 Typical uncertainties used in yield assessments ..................................... 13
 2.3 Uncertainty scenarios ............................................................................. 30
 2.4 Service life prediction ............................................................................. 31
3 Uncertainties of initial yield assessment and scenarios in real case studies .... 33
 3.1 Site selection and assumptions .............................................................. 33
 3.2 Results from the independent yield assessments ................................... 34
 3.3 Technical comparison with real operational data .................................... 39
 3.4 The impact of assumptions in the yield assessment ............................... 44
4 Uncertainties in yield assessments: from modelled to real LCOE of PV projects
 ........................................................................................................................ 49
 4.1 Calculation of LCOE for the selected PV projects and cash flow models 51
 4.2 Influence of uncertainties on financial models......................................... 55
 4.3 Comparison of modelled LCOE with real LCOE ..................................... 56
5 Best practice and guidelines ............................................................................ 61
6 Conclusions ..................................................................................................... 62
References ............................................................................................................. 63
ANNEX 1 Basic information in a yield assessment ................................................. 66
ANNEX 2 Financial Model ...................................................................................... 67

 5
Task 13 Performance, Operation and Reliability of Photovoltaic Systems – Uncertainty in Yield Assessments and PV LCOE

ACKNOWLEDGEMENTS

This paper received valuable contributions from several IEA-PVPS Task 13 members and
other international experts. Many thanks to:
Karl Berger, Austrian Institute of Technology, Austria
Erik Stensrud Marstein, IFE, Norway

This report is supported by:
For Eurac Research: The activities are carried out in the framework of the project PV 4.0:
Utilizzo di logiche Industry 4.0 e Internet of Things nel settore fotovoltaico, funded by the Eu-
ropean Regional Development Fund PO FESR EFRE 2014- 2020 Provincia autonoma di Bol-
zano- Alto Adige, under contract No1128.
This report is supported by the German Federal Ministry for Economic Affairs and Energy
(BMWi) under contract no. 0324304A and 0324304B

6
Task 13 Performance, Operation and Reliability of Photovoltaic Systems – Uncertainty in Yield Assessments and PV LCOE

LIST OF ABBREVIATIONS

 AC Alternating Current
 BSRN Baseline Surface Radiation Network
 CAPEX Capital Expenditures
 DC Direct Current
 DKASC Desert Knowledge Australia Solar Centre
 DHI Diffuse Horizontal Irradiance
 DNI Direct Normal Irradiance
 EPC Engineering, Procurement, Construction
 FiT Feed-in Tariff
 GCM Global Climate Models
 GHI Global Horizontal Irradiance
 GTI Global Tilted Irradiance
 IAM Incidence Angle Modifier
 IEA International Energy Agency
 IRR Internal Rate of Return
 KPI Key Performance Indicator
 LCOE Levelised Cost of Electricity
 LTYP Long-Term Yield Prediction
 MCP Measure Correlate Predict
 NMOT Nominal Module Operating Temperature
 NPV Net Present Value
 O&M Operation and Maintenance
 OPEX Operational Expenditures
 PLR Performance Loss Rate/s
 POA Plane of Array (irradiance)
 PPA Power Purchase Agreement
 PR Performance Ratio
 RUL Remaining Useful Lifetime
 SLP Service Life Prediction
 SMHI Swedish Meteorological and Hydrological Institute
 TMY Typical Meteorological Year
 YA Yield Assessment
 WACC Weighted Average Cost of Capital

 7
Task 13 Performance, Operation and Reliability of Photovoltaic Systems – Uncertainty in Yield Assessments and PV LCOE

EXECUTIVE SUMMARY

Yield assessments (YA) and Long-Term Yield Predictions (LTYP) are a prerequisite for busi-
ness decisions on long term investments into photovoltaic (PV) power plants. Together with
cost data (CAPEX, OPEX and discount rate), the output of a YA and LTYP (utilisation rate,
performance loss rate and lifetime) provides to the financial investors the parameters needed
for the calculation of the Levelised Cost of Electricity (LCOE) and to assess the cash flow
model of an investment with relative Internal Rate of Return (IRR) and Net Present Value
(NPV).
YA and LTYP outputs should be provided with a related exceedance probability. This gives the
right tool to stakeholders involved in PV projects to take the best decision in terms of risk-
aversion. A reduction in the uncertainty of the energy yield can lead to higher values for a given
exceedance probability and hence a stronger business case. Various efforts in the literature
show the importance of having a common framework that can assess the impact of technical
risks on the economic performance of a PV project.
The most important parameter influencing the energy yield assessment is the site-specific in-
solation. Several aspects need to be considered: reliability of the database, interannual varia-
bility, long term trends.
Site adaptation techniques combine short-term measured data and long-term satellite esti-
mates. Short periods of measured data but with site-specific seasonal and diurnal character-
istics are combined with satellite-derived data having a long period of record with not neces-
sarily site-specific characteristics. Upon completion of the measurement campaign, which is
typically around one-year, different methodologies can be applied between the measured data
at the target site, spanning a relatively short period, and the satellite data, spanning a much
longer period. The complete record of satellite data is then used in this relationship to predict
the long-term solar resource at the target site. Assuming a strong correlation, the strengths of
both data sets are captured and the uncertainty in the long-term estimate can be reduced.
In Müller et al [1] an analysis on long-term trends for measured in-plane irradiance, Perfor-
mance Ratio and energy yield for 44 rooftop installations in Germany was performed showing
an average increase of in-plane irradiance of 1.1 %/year or about 11 %/decade over the period
2008 to 2018 for these systems. The increase in irradiance was especially higher than the
observed Performance Loss Rate so that the energy yields of the systems analysed increased
over the years with an average trend of 0.3 %/year.
The typical output of Yield Assessments should report the contribution to each derating factor,
starting from the Global Horizontal Irradiation to the energy injected in the grid. The starting
point of PR = 100 is considered after applying the horizon shading as this become the annual
insolation seen by the PV modules. The following table shows a best practice in providing an
overview of gains/losses along each modelling step and the related uncertainty. The uncer-
tainty related to each modelling step can be provided already referred to the irradiation/yield
value or to the parameter that is modelled. The value in the table for the specific yield (including
its uncertainty) is to be understood as an average value over the entire operating period. The
possible deviations between the yields for individual recorded years and the specific yield cal-
culated can be assessed by including interannual variability.

8
Task 13 Performance, Operation and Reliability of Photovoltaic Systems – Uncertainty in Yield Assessments and PV LCOE

 Annual values uncertainty value gains/loss PR
 % kWh/m2 % %
 global irradiation on horizontal plane 4.0 1248
 irradiation on module plane 2.5 1448 16.0
 shading
 horizon shading 0.5 1445 -0.2 100.0
 row shading 2.0 1422 -1.7 98.3
 object shading 3.0 1422 0.0 98.3
 soiling 0.5 1414 -0.5 97.9
 deviations from STC
 reflection losses 0.5 1376 -2.7 95.2
 % kWh/kWp % %
 spectral losses 0.5 1363 -1.0 94.3
 irradiation-dependent losses 0.8 1342 -1.5 92.9
 temperature-dependent losses 1.0 1309 -2.5 90.5
 mismatch losses 0.5 1298 -0.8 89.8
 DC cable losses 0.5 1287 -0.8 89.1
 inverter losses 1.5 1272 -1.2 88.0
 inverter power limitation 0.5 1272 -0.1 88.0
 additional consumption 0.5 1270 -0.1 87.9
 AC cable losses low voltage 0.5 1265 -0.4 87.5
 Transformer medium voltage 0.5 1253 -0.9 86.7
 AC cable losses medium voltage 0.5 1252 -0.1 86.6
 Transformer high voltage 0.0 1252 0.0 86.6

 total 6.5 1252 86.6

For example, for temperature-dependent losses, the value of uncertainty could be referred to
the temperature variability of the profile used in the assessment or to the temperature model
used in the assessment. The ambient temperature variability and the various temperature
models will lead to a different contribution in terms of yield loss and in terms of uncertainty.
An emerging challenge in YAs is also due to the deployment of novel technologies (e.g. bifacial
PV modules) with a contribution in terms of uncertainty that needs to be properly assessed.
Building upon the knowledge available in the literature and the previous IEA PVPS Task 13
report [2], in this report we have moved forward from the uncertainty framework in yield as-
sessment to two real implementations of it and the impact that uncertainties can have on life-
time yield predictions, on the LCOE and on the cash-flow.
One of the most relevant question that we have tried to answer is also the following:
How reliable are YA’s?
This is an apparently simple question; however, the answer is not equally simple. Typically,
investors require one YA. In some cases, more YAs might be requested if results are unclear.
The various YAs can be averaged to assign a purchase value to a given project. In any case
the question remains unanswered: why different assessors obtain different answers? Is one
YA more reliable than others?

 9
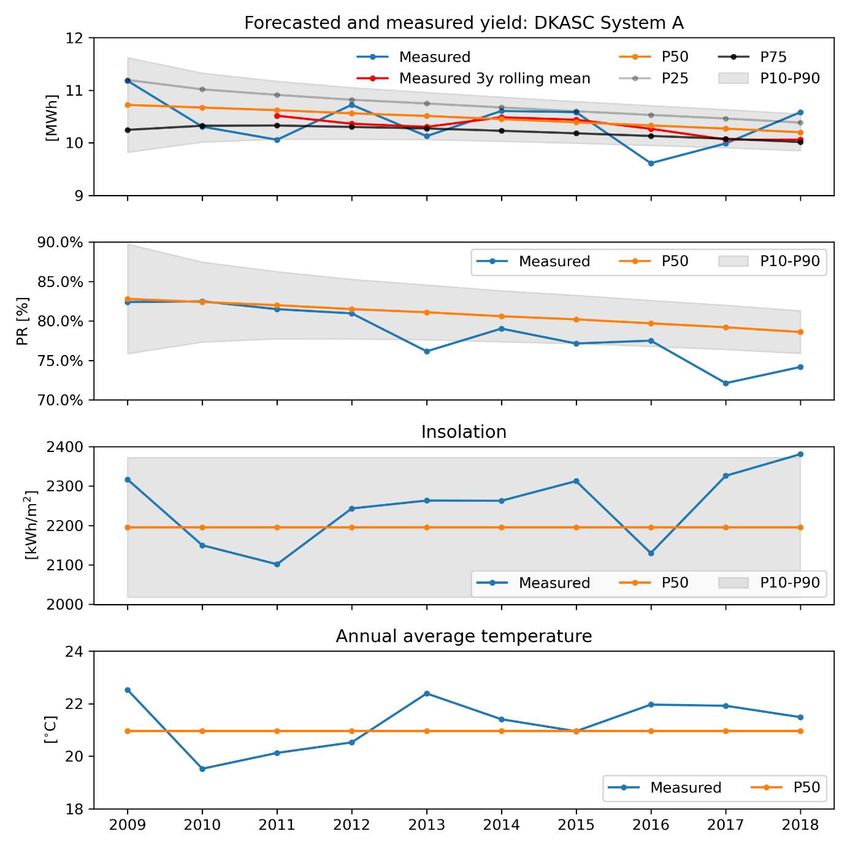
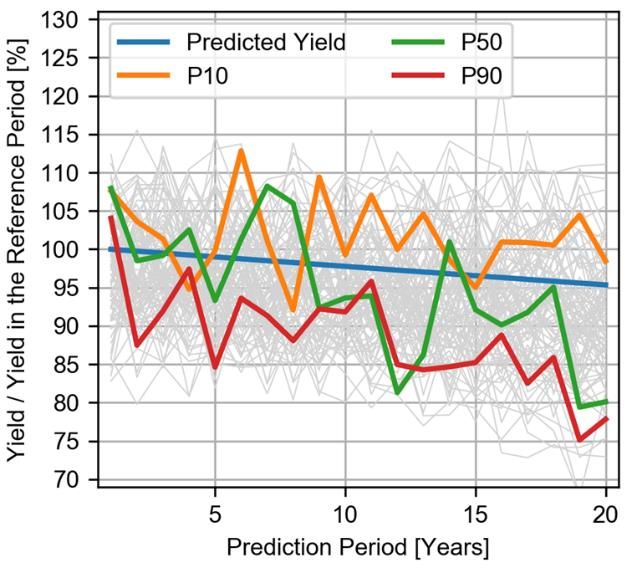
Task 13 Performance, Operation and Reliability of Photovoltaic Systems – Uncertainty in Yield Assessments and PV LCOE

Investors know that past performance is no guarantee for future results. This maxim also ap-
plies to long-term yield assessments and the LCOE that can be determined from these, also
within the context of a changing climate. Yield Assessment is an essential step in a PV project,
as it helps to determine whether a system will be funded or not. However, the YA is not only
about the software used, it is mainly about the user. YAs may not be as reliable as expected,
and in this report, we demonstrate how seven highly skilled specialists did not arrive at the
same result, having been provided the same detailed inputs.
Independent yield assessors were in fact asked to provide YAs and LTYPs for two sites,
namely, Bolzano in Italy and Alice Springs in Australia.
For the Bolzano site, the P50 ranged between 1095 and 1406 kWh/kWp, P90 ranged between
997 and 1274 kWh/kWp. The average value for the initial YAs is 1278 kWh/kWp with a STD
(σ) of 9.7 %. Taking into account the estimated Performance Loss Rates of the LTYPs, the
average annual energy yield over the time period the system is in operation (2010 to 2019)
would be 1253 kWh/kWp. The measured average yield in the period is 1275 kWh/kWp.
For the Alice Springs site, the P50 ranged between 1757 and 1985 kWh/kWp and the P90
between 1631 and 1819 kWh/kWp. The average value for the initial YAs is 1878 kWh/kWp
with a STD (σ) of 3.9 %. The system has been in operation since 2009 with an initial yield of
2075 kWh/kWp and 1926 kWh/kWp as 10-year average.
As seen from the YA exercises for Bolzano and Alice Springs, differences in these stem pri-
marily from personal experience and assumptions by the modeler, of which
 (i) the irradiance database selection and site adaptation (especially for mountainous
 terrain),
 (ii) degradation/PLR assumption,
 (iii) total modelling uncertainty values (as seen in the P50 and P90 ranges) and
 (iv) soiling and far/near shading had the largest impact on the determined result.
The direct flow-on consequence from this is that LCOE values will also exhibit a variance, on
top of the additional modelling assumptions that can be employed for LCOE calculations. De-
termining P50 and P90 values for LCOE results and highlighting the assumptions/modelling
chain will be important. From an industry perspective, it would be beneficial if more “live” post-
mortem analyses (i.e. comparison of the LTYP and measured data, at e.g. every 5 years of
system life) would be made and published. These can then be used as crucial feedback and
inputs for YA modelers, financiers, and insurers.
To conclude, we believe that together with the previous report [2], we have provided all the
needed information to understand if one YA is more reliable than other and which input and
output data must be provided by the assessor to reach this conclusion.

10
Task 13 Performance, Operation and Reliability of Photovoltaic Systems – Uncertainty in Yield Assessments and PV LCOE

1 INTRODUCTION

Yield assessments (YA) and Long-Term Yield Predictions (LTYP) are a prerequisite for busi-
ness decisions on long term investments into photovoltaic (PV) power plants. Together with
cost data (CAPEX, OPEX and discount rate), the output of a YA and LTYP (utilisation rate,
performance loss rate and lifetime) provides financial investors with the parameters needed
for the calculation of the Levelised Cost of Electricity (LCOE) and to assess the cash flow
model of an investment with relative Internal Rate of Return (IRR) and Net Present Value
(NPV).
The preparation of a YA and LTYP report typically relies on numerical modelling and prediction
of the expected energy yield, based on experience with previous PV power plants, laboratory
measurements and knowledge gained in the PV community over the past years and decades.
In the previous IEA PVPS TASK 13 report “Uncertainties in PV System Yield Predictions and
Assessments” [2], we presented a comprehensive investigation of the uncertainties related to
this task. The report collected some insights into the field of uncertainties of several technical
aspects of PV system yield prediction and assessment investigating several of the modelling
steps for gains and losses in a PV system: the solar resource — including long term trends,
PV module properties, system output and performance.
The main challenge in YA and LTYP relates to the trustworthiness of site-specific information.
In a global market it is in fact not uncommon to assess the yield of a PV plant to be located in
areas which are not familiar for the yield assessor and local knowledge is thus of extreme
importance.
Irradiation data derived from satellite images are increasingly used as input for long-term yield
estimations and as the basis for reference yield calculations for monitoring and business re-
porting. Several authors have evaluated the quality of satellite-based irradiance data in the
past, typical normalized root mean square errors for satellite-based irradiation reported in lit-
erature are situated between 4 % to 8 % for monthly and 2 % to 6 % for annual irradiation
values.
Solar irradiation at the Earth’s surface is not stable over time for all locations on earth but may
undergo significant long-term variations for particular regions, which is referred to as “global
dimming and brightening”. Consequently, related uncertainties may not be considered to be
negligible. In the presence of long-term trends, the question for solar resource assessments is
no longer “what is the ‘true’ climatological value?”, but “what is the best predictor for the project
lifetime?”. A suitable estimator should be a recent time period, that is long enough to filter the
influence of single years with high anomalies, but which is short enough, to minimize the influ-
ence of past trends. For more insights about high quality solar resource assessments and in
particular on the development of enhanced analysis of long-term inter-annual variability and
trends in the solar resource, we invite the reader to look at the output of the IEA PVPS Task
16 “Solar resource for high penetration and large scale application” [3].
The direct current (DC) energy yield of a PV module depends on module characteristics as
well as operating conditions. With respect to uncertainties, the different influencing effects (ir-
radiance level, angle of incidence, operating temperature, etc.) are typically represented by
one individual factor per effect. The influences are assumed to be independent. Furthermore,
these factors are often used in integrated form, e.g. over one year.
In the previous report, a framework for the calculation of uncertainty for a complete long-term
yield prediction was presented. As the simplified error propagation approach may not be suit-
able for a complex LTYP, a Monte-Carlo simulation was used instead as a methodology to
improve the quality of the output.
 11
Task 13 Performance, Operation and Reliability of Photovoltaic Systems – Uncertainty in Yield Assessments and PV LCOE

The proposed approach was given as an effort to standardise the procedure for uncertainty
calculation of predicted energy yields of PV systems in order to properly estimate financial
investment risk.
In this report we will build upon the previous work by running benchmarking exercises in order
to be able to quantify the differences between existing approaches. In Section 2, we will give
an overall update about uncertainties in YA coming from the various modelling steps and de-
rating factors.
In Section 3, several sites were selected in different climates and partners were asked to pro-
vide independent yield assessments and long-term yield predictions based on their best prac-
tices and/or their own developed simulation tools. The results were analysed, and uncertainty
reduction scenarios were studied. The final aim is to link the uncertainty framework and the
scenarios with cash flow models and LCOE calculations compared to real case studies.
The benchmarking yield assessment exercise was conducted by selecting sites with prominent
features (e.g. soiling, shading, etc.). The first site we have selected is a PV plant in Bolzano,
Italy, monitored by Eurac Research, leaving a high degree of freedom to the various yield
assessors where only the following information were shared: details (including technical spec-
ifications) on the installed PV module technology and inverter type, coordinates, azimuth, tilt
angle and shading diagram. The second selected site is located in Alice Springs, Australia, at
the premises of the Desert Knowledge Australia Solar Centre (DKASC). The yield assessors
were asked to send YAs for up to 3 PV technologies. From the Bolzano and Alice Springs
exercises we gained insights on typical deviation from real performance data due to the pecu-
liarities of the two sites (e.g. shading and snow loss, soiling).
In Section 4 we move from Yield Assessment to the calculation of LCOE using the data from
Section 3 as input. The aim of the Section is to present a comparison between modelled LCOE
and real LCOE using data coming from the field.
Finally, in Section 5 we define some take home messages in terms of best practices and guide-
lines.

12
Task 13 Performance, Operation and Reliability of Photovoltaic Systems – Uncertainty in Yield Assessments and PV LCOE

2 HOW UNCERTAIN IS THE YIELD ASSESSMENT IN
 PHOTOVOLTAIC PROJECTS?

Exceedance probability is defined as the probability that a certain value will be exceeded. The
exceedance probability of the energy yield and how this is influenced by the overall uncertainty
is one of the key parameters to benchmark investments. A reduction in the uncertainties can
lead to higher values of energy yield for a given exceedance probability and hence a stronger
business case. Moser et al [4], Richter et al [5] and Reich et al. [6] estimated the combined
overall uncertainty of the energy yield to fall in a range between 5 and 11 %; in another study,
Müller et al [7] have calculated the variation of the overall uncertainty of the energy yield over
the lifetime of a PV plant and compared the findings with data from a portfolio of 26 systems
located in Germany and Spain. These efforts show the importance of having a common frame-
work that can assess the impact of technical risks on the economic performance of a PV pro-
ject.

2.1 Definitions
Yield Assessment: Assessment of the expected energy yield (in kWh/kWp) of a defined PV
system at a specified location. It can be calculated for the 1 st year of operation (initial yield
assessment), for a specific year or as an average over the lifetime of a PV project.
Irradiance: Irradiance is an instantaneous measurement of solar power over some area. The
units of irradiance are watts per square meter.
Insolation: Insolation is a measurement of the cumulative energy measured over some area
for a defined period of time (e.g. annual, monthly, daily, etc.). The common unit of insolation is
kilowatt hours per square meter.
Uncertainty: defined as the contribution of each modelling step towards the overall uncertainty
of a yield assessment. The overall uncertainty is typically calculated as the root mean square
of the sum of the errors. Considering the standard deviation (σ), the lower threshold for the
interval (E ± σ) is in correspondence of P84.1.
Long-term Yield Prediction: Yield Assessment calculated over the lifetime of a PV project
including considerations about degradation of performance and the evolution of the uncertainty
due to the reduction of site dependent variability (irradiation, temperature, etc.).

PX: Exceedance probability defined as the X % probability that a certain value will be exceeded.
A P90 value corresponds to a number that has 90 % probability of being exceeded.
LCOE: The Levelised Cost of Electricity is the cost of generating 1 kWh considering the initial
investment (Capital Expenditures), the discounted Operational Expenditures and the dis-
counted utilisation rate over the lifetime of the power plant.
NPV: The Net Present Value is the discounted difference between the present value of cash
inflows and the present value of cash outflows over a period of time and it is used to analyse
the profitability of an investment or project over its financial lifetime.

2.2 Typical uncertainties used in yield assessments
The topic of derating factors along the modelling chain of an yield assessment and related
uncertainties has already been covered in the literature by several authors [4], [5], [8], [9] and

 13
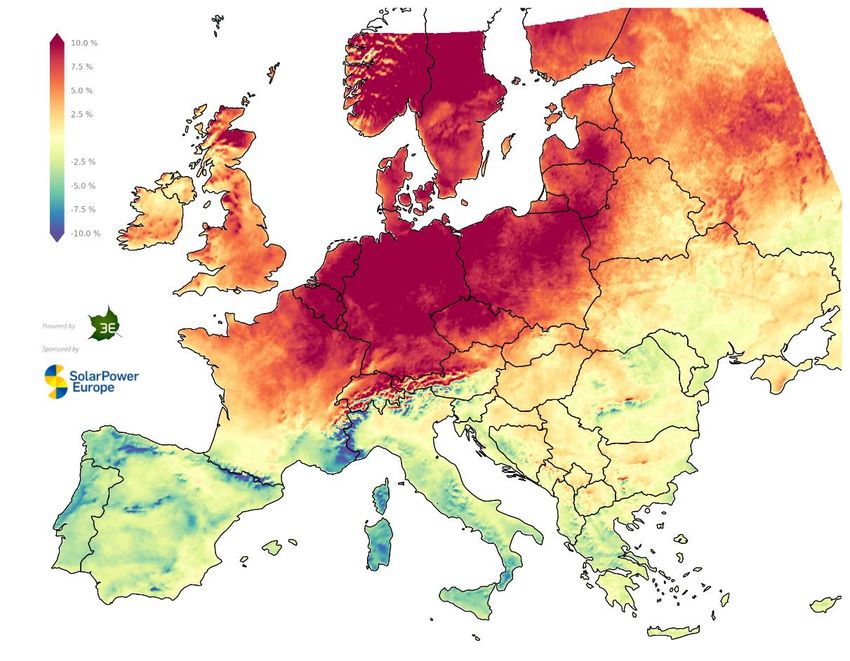
Task 13 Performance, Operation and Reliability of Photovoltaic Systems – Uncertainty in Yield Assessments and PV LCOE

organisations [2], [10]. The IEA PVPS Task 13 Report “Uncertainties in PV System Yield Pre-
dictions and Assessments” [2] already provides a detailed framework for the calculation of
uncertainties in yield assessments. The aim of this section in the present report is to provide a
short summary of and new insights in recent analysis and technologies.

2.2.1 Uncertainty in the long-term insolation estimation
The main source of uncertainty is certainly related to the insolation estimation. Various aspects
need to be considered when assessing the insolation in a particular site. We will see in section
3 how previous experience of the assessor can play an important role during this step.
In Yield Assessment, the choice of the sources for long term insolation data is key with a direct
impact on the P50 (median) value of the chosen distribution.
Any other PX value (e.g. P90, P95) is affected by the variability of the annual insolation if it
refers to the estimated annual yield for a specific year (e.g. year 0). For Yield Assessment
values provided based on long-term predictions (i.e. as an average over a 20+ years’
timeframe), the interannual variability is essentially cancelled out.
Other aspects that need to be considered are related to the presence and extrapolation of
long-term trends (also known as global dimming or global brightening) which become important
when assessing the yield over a 20+ year period.

 A. Annual insolation variability
The solar resource variability or “year-to-year variability” is defined as the ratio of the standard
deviation (σ) to the average global horizontal irradiation (GHI) over a long-term period of typi-
cally 10 to 20 years. As reported in literature, the solar resource variability in Europe, for ex-
ample, can range from ca. ± 4 % up to ca. ± 7 % for more complex conditions like e.g. near
coastal areas [11]. A month or a year with less solar irradiation than the long-term average
also corresponds to a decrease of the solar park’s production for the considered period with
respect to the expected business model. Such variations over time are a well-known phenom-
enon and must be correctly accounted for in long-term yield assessment studies. Correctly
calculated uncertainty scenarios (P90 figures calculated in the business model) should there-
fore sufficiently cover for these lower solar periods.
Recent developments like the Solar Index Maps1 analyse the variability of the solar resource
across continents and allows for improved assessments of how the solar resource varies com-
pared with the expected long-term average values. The Solar Index Maps use 3E’s satellite-
based irradiation data (solardata.3e.eu) and generate detailed maps showing the percentage
difference between the solar resource during the period of interest (e.g. last year or even last
month), compared with the long-term average solar resource calculated over more than 10
years (data available from 2004 to date). The figure below (Figure 1), for example, shows the
Solar Index Map of Europe for the year 2018 compared with the long-term average, where
orange/red means higher irradiation than the P50 and green/blue means lower irradiation than
the P50 (business model). This difference indicates natural fluctuations that directly impacted
the generation of thousands of PV systems during 2018 across the region having direct effect
in both the cash flow of the individual PV parks but also on the electricity grids at aggregated
level.

1
 https://www.3e.eu/solarpower-europe-3e-launch-solar-index-maps/.

14
Task 13 Performance, Operation and Reliability of Photovoltaic Systems – Uncertainty in Yield Assessments and PV LCOE

Figure 1: Yearly Solar Index Map of Europe for 2018 (source: https://so-
lardata.3e.eu/maps/solarindex)
A closer look at multiple consecutive years is shown in Figure 2, where one can see that, for
example, while 2016 was overall a very average year in terms of solar resource for most Eu-
ropean countries, 2017 was a very good year for most of southern Europe with approx. 5 %
more irradiation than the expected values (P50). However, 2017 was not a good year e.g. for
western UK and Ireland, and particularly for some northern European areas with approx. 3 %
to 5 % less than expected P50 values (e.g. Poland and northern Germany). Interestingly, 2018
had the opposite behaviour in terms of solar irradiation having very high irradiation values for
most of northern European countries, UK and Ireland with over 8 % more irradiation than ex-
pected long-term average (P50) values in many countries while southern European countries
such as e.g. Portugal, Spain and Italy experienced approx. 5% less yearly irradiation than their
expected P50 values.
 2016 2017 2018

Figure 2: Yearly Solar Index Maps for Europe for 2016 (left), 2017 (middle) and 2018
(right) (source: https://solardata.3e.eu/maps/solarindex)
 15
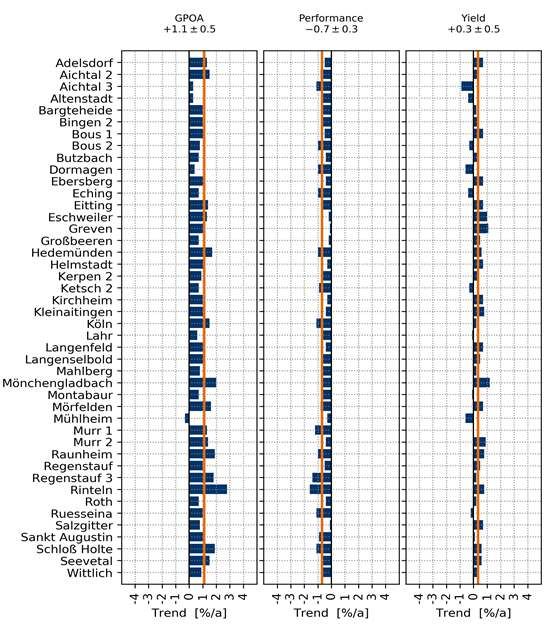
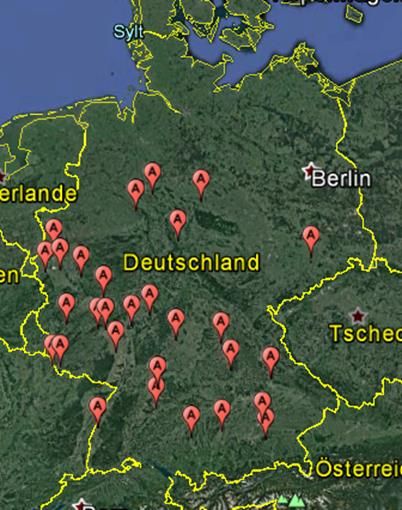
Task 13 Performance, Operation and Reliability of Photovoltaic Systems – Uncertainty in Yield Assessments and PV LCOE

In the case of Africa (Figure 3), the Solar Index Maps show that while the variability of the solar
resource over Africa is much lower than in Europe, still some important variations can occur
like, for example, 2017 was not a very good year for some countries in the sub-Saharan region
like Zambia and Mozambique where the irradiation over 2017 was approx. 6 % lower than the
P50. On the contrary, 2016 was a much better year in terms of solar resource for all sub-
Saharan countries.
 2016 2017 2018

Figure 3: Yearly Solar Index Maps for Africa for 2016 (left), 2017 (middle), and 2018 (right)
(source: https://solardata.3e.eu/maps/solarindex)

 B. Long-term trends
Long-term trends of solar irradiance may have a significant influence on uncertainties of yield
assessments [12]. While this influence may be close to zero or even negative for some regions
of the world, there are regions where a strong brightening can be observed.

Figure 4: Analysis for 44 rooftop systems. Left: locations of the systems, Right: example sys-
tem

16
Task 13 Performance, Operation and Reliability of Photovoltaic Systems – Uncertainty in Yield Assessments and PV LCOE

Figure 5: Trends for in-plane-irradiance (GPOA = GTI, left), Performance Loss Rate (Per-
formance, middle) and annual energy yield (Yield, right)
In Müller et al [1] an analysis on long-term trends for measured in-plane irradiance, Perfor-
mance Ratio and energy yield for 44 rooftop installations in Germany was performed (see
Figure 4 for location of the PV plants). Figure 5 shows an average increase of in-plane irradi-
ance (GTI) of 1.1 %/year or about 11 %/decade over the period 2008 to 2018 for these sys-
tems. While this strong positive trend is statistically influenced by the year 2018 which showed
very high levels of irradiance in Germany (see Figure 2), still a continuing strong brightening
effect can be assumed. The increase in irradiance is especially higher than the observed Per-
formance Loss Rate (negative values means losses over time, see Section 2.2.2 for more
information about the definition of Performance Loss Rate) so that the energy yields of the
analysed systems increase over the years with an average trend of 0.3 %/year.
 C. Long-term trends in Nordic countries
In Sweden, the Swedish Meteorological and Hydrological Institute (SMHI), is an expert agency
under the Ministry of the Environment. SMHI uses the World Meteorological Organization
WMO defined normal period 1961-1990 to define the “normal” weather. However, the temper-
ature in Sweden and the solar irradiance in at least most of the southern part of Sweden have
increased during the three last decades. At the SMHI stations near the coast of Sweden in
Visby (southern Sweden), Stockholm, and Luleå (northern Sweden) the global horizontal irra-
diance showed an increase with 1.7 - 2.8 % from the period 1961-1990 to the average for the

 17
Task 13 Performance, Operation and Reliability of Photovoltaic Systems – Uncertainty in Yield Assessments and PV LCOE period 1991-2019, see Table 1. In contrast, the inland stations Karlstad, Östersund and Kiruna in the west, of which the two latter ones are in the northern half of Sweden close to the moun- tain area, and Umeå near the coast in the north showed a decreased irradiance with 0.9 - 3.1 % during the same period. It can be noticed that there is a trend of increasing global irradiance for all stations in Table 1 during the period 1991-2019, as exemplified for Stockholm in Figure 6, although weak for the northern inland stations. Table 1: Yearly average global horizontal irradiance for the periods 1961-1990 and 1991- 2019 at SMHI weather stations in Sweden with measurements starting before 1961, sorted from south to north Station Latitude / Irradiance 1961- Irradiance 1991- Difference 1991- Longitude () 1990 (kWh/m2) 2019 (kWh/m2) 2019 vs 1961- 1990 Visby 57.7 / 18.3 1067 1097 +2.8% Stockholm 59.4 / 18.1 970 986 +1.7% Karlstad 59.4 / 13.5 1011 1002 -0.9% Östersund 63.2 / 14.5 933 904 -3.1% Umeå 63.8 / 20.2 938 914 -2.5% Luleå 65.5 / 22.1 876 894 +2.1% Kiruna 67.8 / 20.4 817 802 -1.8% Figure 6: Yearly global horizontal irradiance measured in Stockholm for the period 1991- 2019 [SMHI]. The yellow line shows the average for the period and the dotted blue line is linear trend line for the period 18
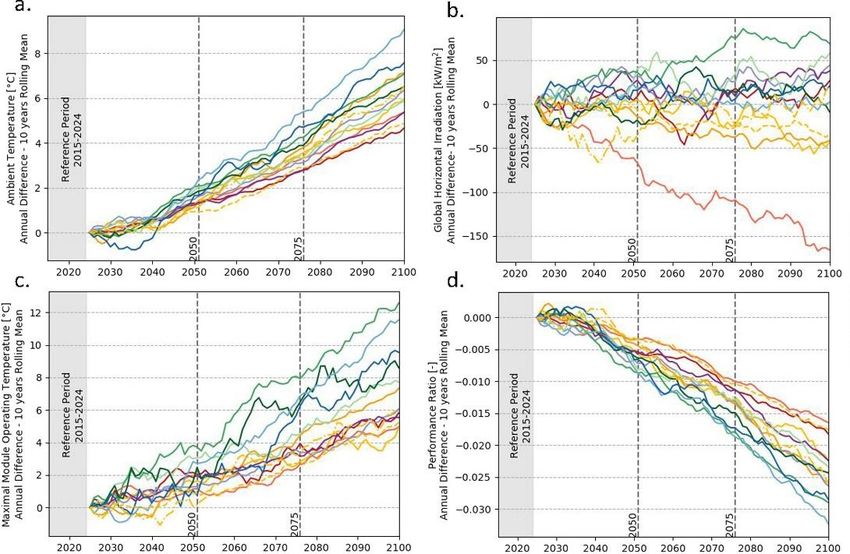
Task 13 Performance, Operation and Reliability of Photovoltaic Systems – Uncertainty in Yield Assessments and PV LCOE

 D. Long-term solar resource uncertainties
Sites where high-quality long-term ground-based measurements have been taken are rare,
except for i) meteorological stations that belong to the BSRN [13] or national equivalents or ii)
operational (utility-scale) PV systems. Having such long-term high-quality ground-based meas-
urement data for new PV sites is extremely rare. Consequently, the use of satellite-derived
irradiance data for long-term yield assessments is inescapable, yet as the satellite geograph-
ical resolution is often in the range of kilometres, the long-term dataset is best subjected to site
adaptation methods [14].
Site adaptation techniques combine short-term measured data and long-term satellite esti-
mates. Short periods of measured data but with site-specific seasonal and diurnal character-
istics are combined with satellite-derived data having a long period of record with not neces-
sarily site-specific characteristics. Upon completion of the measurement campaign, which is
typically around one-year, different methodologies can be applied to the measured data at the
target site, spanning a relatively short period, and the satellite data, spanning a much longer
period. The complete record of satellite data is then used in this relationship to predict the long-
term solar resource at the target site. Assuming a strong correlation, the strengths of both data
sets are captured and the uncertainty in the long-term estimate can be reduced.
Two main approaches for site adaptation of satellite-derived data are identified in literature: an
adaptation to the input data of the model to better fit the local irradiation measurements and,
empirical adjustments of the model output estimates by comparison with the on-site measure-
ments. The study conducted by [14] concluded that each site would likely require a specific
initial assessment to design the proper method for data adaptation. Moreover, the site-specific
method may be a combination of the different approaches. Furthermore, it is highlighted in the
study that the optimum duration of the overlapping period between ground observations and
model estimates has not been widely studied.
In [15], the authors validated the application of a Measure Correlate Predict (MCP) methodol-
ogy, a rather simple site adaptation technique, on 32 meteorological stations in the Nether-
lands. The study concluded that the MCP methodology can yield high accuracies with uncer-
tainties below 2 % (bias) if the common reference period used is at least one year. However,
if the bias of the satellite is not constant over the year, the application of the MCP methodology
based on periods shorter that one year can have considerably lower accuracy. This can be
improved by using more advanced site adaptation methods as proposed e.g. in [14].
Historically, solar resource assessments have been judged to have lower uncertainty as the
timespan included in the dataset increases [16], although this assumption ignores i) that long-
term insolation trends may be subject to brightening or dimming, in which case using the most
recent ten years of data is recommended [17], ii) that significant changes to satellite instru-
mentation can result in older data being of much lower quality, to the extent that many com-
mercial meteorological data providers only provide insolation data from 2006 onwards for the
Pacific region covering Japan and Australia [18] as the newer satellites came online [19].

 E. Projections of future trends
A growing number of publications is using data from global climate models (GCM’s) to assess
the influence of climate change and dimming and brightening effects on PV system perfor-
mance [20]–[23]. In [24], the ambient temperature and irradiance towards 2100 for the SSP5-
8.5 scenario are processed [25]–[27] for several locations worldwide. Using a simplified PV

 19
Task 13 Performance, Operation and Reliability of Photovoltaic Systems – Uncertainty in Yield Assessments and PV LCOE

yield model for crystalline silicon technology, the authors present the trends of maximal PV
module temperature and Performance Ratio (see Figure 7). Under the SSP5-8.5 projected
scenario, Ljubljana-Slovenia will increase both ambient temperature and irradiance, and for
this reason, the rise of PV module temperature will lead to decrease in the PR. Minnesota-
USA is showing the fastest PR reduction due to the fast rising temperature. In Jos-Nigeria,
GHI drops significantly, limiting the decrease of PR only to 1.8% in 2100.

Figure 7: Evolution of relevant PV performance indicators for c-Si PV modules under
the SSP5-8.5 climate change scenario. Annual differences of 10 years rolling mean for:
(a) Ambient Temperature, (b) Global Horizontal Irradiation, (c) Maximal Module Operat-
ing Temperature and (d) Performance Ratio. (source: [24])

Even though some results are already published, further research is needed to establish meth-
ods to include more information from GCM’s into yield assessments. While the direct usage of
time series data derived from GCM’s for yield assessments is proved to be possible, the re-
gional analysis and more realistic PV performance modelling including uncertainties need fur-
ther exploration.

2.2.2 Uncertainties in degradation and performance loss models available
In the IEA PVPS Task 13 report “Assessment of Performance Loss Rate of PV Power Sys-
tems” [28], the authors focused their efforts on the determination of reliable Performance Loss
Rate (PLR) calculation approaches. PLR is defined as the sum of losses on system and mod-
ule level and include both reversible and irreversible effects. The term degradation instead is
often used to verify an irreversible loss on module level stemming from appearing degradation
modes. In general, PLR calculations follow a strict order of steps, which includes input data
acquisition, data filtering, performance metric selection and the application of statistical meth-
ods to obtain the final PLR, which is given in %/year. In order to understand which approaches
and calculation step combinations yield reliable results, and which should be discarded, 31
different filter/metric/method combinations have been applied to 19 different real PV systems
and several more digital systems (data for digital systems are generated based on a physical
20
Task 13 Performance, Operation and Reliability of Photovoltaic Systems – Uncertainty in Yield Assessments and PV LCOE

model of a PV plant and the PLR is introduced as a known parameter). The outcome is that
there is no outperforming combination, rather the authors suggest that one should apply sev-
eral combinations to the same dataset to find an average value for PLR which might approxi-
mate best the “true” value (which remains unknown). However, certain filter/metric/statistical
method combinations should be avoided as they produce PLR values with high deviations from
the “true” value.
An uncertainty evaluation across different approaches turned out to be impossible as related
uncertainties depend on the methodology used for the calculation of PLR and the chosen ap-
proach selected by the analyst. Most statistical methods for PLR determination are based on
regression. For regression-based PLR uncertainty, it is recommended to evaluate the variance
of the linear model to the selected performance metric trend over time. If time series decom-
position approaches have been used the residuals component should be added back to the
trend to ensure comparable conditions. Another tested, and widely used, statistical method for
PLR determination is the Year-on-Year approach, where the differences between one data-
point in a calendar year with the data-point at the same position in the subsequent year are
accumulated. The method is available in the RdTools Python package [29]. Here, the uncer-
tainty determination is standardised by using the probability distribution of the individual PLR
results to represent the uncertainty. It thereby inevitably deviates from the regression-based
uncertainty determination.

2.2.3 Uncertainties in parameters used in power calculation
The power calculation in PV modelling software not only depends on the software’s algorithms,
it also requires that components (modules, inverters) have been correctly parametrised and is
available as input into the software [30]. While the modeller can input or translate datasheet
values for use in, for e.g., PVsyst, typically module (PAN files) or inverter (OND files) data sets
are provided by the manufacturer, yet no reliance is given by most manufacturers as to the
accuracy of these key inputs. The uncertainties on (sub)components in the PV power model-
ling chain [31] are often relatively low through the implementation of peer-reviewed methods.
However, modelling risks can occur through errors in module or inverter files, which can neg-
atively affect the yield, and with it, the financial viability of PV plants. Therefore, it becomes
more and more the common industry standard that PV modules or inverters are subjected to
additional characterisation by independent laboratories upon instruction by investors to ensure
that the power plant model is bankable. Special care must be taken during this phase in terms
of number of modules to be tested and selection procedure (look at Section 2.2.1 in [2]) in
order to obtain a reliable mean value of electrical parameters to be used in power calculation.

2.2.4 Estimation of Array DC losses

 A. Soiling
In many countries, the impact of soiling (including snow losses) has an important impact in the
yield assessment. There is always a certain degree of uncertainty from a yield assessor per-
spective in evaluating typical soiling losses for different countries/regions and in assigning un-
certainties related to their estimation. The presence of point sources should be verified and
avoided whenever possible.

 21
Task 13 Performance, Operation and Reliability of Photovoltaic Systems – Uncertainty in Yield Assessments and PV LCOE

Li et al recently reported on the global reduction of solar power generation efficiency due to
aerosols and PV module soiling [32]. They reveal that in case of precipitation-only removal and
no cleaning, PV generation in heavily polluted and desert regions is reduced by more than 50
% by particulate matter. A cost-effective cleaning schedule must be considered with a positive
impact in terms of yield and an increase in Operation and Maintenance (O&M) costs.
Another recent study (2019) reports on the techno-economic assessment of soiling [33]. They
determined the optimal trade-off between losses and cleaning events using reported soiling
rates from 20 countries. The soiling rate varies widely: Italy shows a range between 0.02 %
and 0.2 % per day, Spain 0.01 % - 1 %, UAE 0.1 % - 1 %, China 0.06 % - 3 %, just to give
some examples.
Uncertainties related to soiling estimation can arise from various reasons: uncertainty on
measurement, uncertainty on the impact of soiling on various PV technologies [34], spatial
non-uniformity of soiling over PV modules within the same system. Even within a single site,
variations in soiling data can be observed [35]. Typical measurement related uncertainties can
be of the order of 1 % [36].
Report [37] presents in details all the aspects related to soiling losses determination and un-
certainties.

 B. Snow losses
The presence of snow has a double effect with a negative impact in terms of performance
losses and a positive impact in terms of increase in albedo. Yield assessment carried out in
high latitude regions should pay special attention to the overall impact of snow on the yield. As
for soiling, the choice in system layout and in PV module technology can decrease the losses,
e.g. frameless modules.
Pawluk et.al. [38] states that annual losses due to snow coverage are less than 10% in most
climates. This is also confirmed in studies made in Sweden by RISE Energy Technology Cen-
ter [39].
For more information see report [37], [40].

2.2.5 Further uncertainty sources for emerging PV technologies
Emerging PV module and system technologies promise to significantly increase the power
output of PV systems in various ways. Bifacial PV modules enable the collection of reflected
light by the rear surface of the solar cells and sun-tracking PV systems enhance the collection
of direct light by following the sun’s trajectory through dynamically adapting the PV system
geometry (see more in [41]). As such technologies will increasingly contribute to worldwide
renewable energy generation, it is important to identify the associated yield assessment un-
certainty sources. Moreover, the worldwide cost-competitiveness of PV electricity generation
extends the range of financially viable PV projects to sites with increased complexity, where
e.g. variations of terrain topography need to be considered.

 A. Bifacial demonstration setup
The additional uncertainty sources for bifacial PV systems are explained with the help of an
example bifacial PV system depicted by Figure 8. It consists of 24, 60-cell PV modules installed

22
Task 13 Performance, Operation and Reliability of Photovoltaic Systems – Uncertainty in Yield Assessments and PV LCOE

in landscape orientation. Modules are arranged in 4 rows and 6 columns on a single, South-
facing PV stand, which is tilted by 30˚. The mounting structure elements are positioned under
the module frames to minimize rear-side shading.

Figure 8: Illustration of the example bifacial PV system from front and rear views. All
elements are artificially made transparent to expose the details of the geometry.
The PV module geometry model is inspired by an industrial, 60 cell bifacial, glass-glass, framed
PERC module. The module frame cross section and the junction boxes are also modelled, to
best represent rear-side light collection. The cross sections of the long and short edges of the
module are shown in Figure 9, where the junction box location is also shown.

Figure 9: Module cross-sections taken on the long edge (left) and short edge (right)
As shown above, the long edge module frame, which is designed to provide structural rigidity,
protrudes above the solar cells creating rear-side shading, therefore its inclusion in the model
is important. The short edge frame is much further away from the solar cells, although it can
be observed on Figure 9 (right) that the junction boxes will limit light transmission through the
modules, causing a minor reduction of rear irradiance.
The introduced test system is placed in a sunny climate, where the South orientation and 30˚
tilt angle represents an optimal configuration for traditional, monofacial PV systems.
The 24 modules of the demonstration array are all connected in series and they represent one
string.

 B. Bifacial irradiance
During yield assessment, irradiance modelling for monofacial, unshaded PV systems is
achieved by transforming standard irradiance measurements Global Horizontal Irradiance
(GHI), Direct Normal Irradiance (DNI) and Diffuse Horizontal Irradiance (DHI) to the collector
plane using an all-weather sky model. However, when the amount of irradiance received by
the modules is affected by their surroundings through shading or reflections, additional phe-
nomena need to be considered.

 23
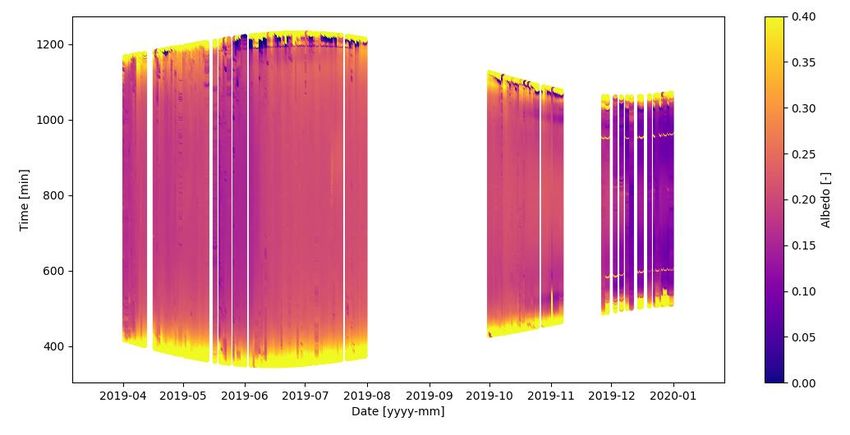
Task 13 Performance, Operation and Reliability of Photovoltaic Systems – Uncertainty in Yield Assessments and PV LCOE

In recent years, a significant amount of scientific contributions has addressed the problem of
calculating bifacial irradiance and two main approaches emerged: ray tracing and view factors
[41]. Published errors compared to in-plane irradiance measurements range from 5 % to 40 %
showing that both methods have high accuracy potential if appropriately implemented. Never-
theless, compared to uniformly illuminated, monofacial PV systems, increased in-plane irradi-
ance uncertainty is expected.
It is well documented in literature that ground albedo affects bifacial PV energy yield, thus
accurate, on-site albedo measurements are needed for reducing bifacial PV yield assessment
uncertainty. It is however a challenging task to obtain such measurements as albedo (as seen
by a horizontally mounted albedometer) shows ground cover-dependent, intra-day and sea-
sonal variations. Intra-day variations may be caused by anisotropic ground reflectivity and for-
ward-scattering effect, while seasonal variations can be caused by changing vegetation,
ground moisture and snow cover.
One such example of on-site albedo measurements is presented by Figure 10 showing both
intra-day and seasonal variations. In morning and evening hours albedo values as high as 0.4
and more are recorded, as opposed to the daily mean value of 0.2. Analysing noon-time values
throughout the year reveals seasonal variations between 0.1 and 0.22, whereas lower albedo
values are measured during winter.

Figure 10: on-site albedo measurements of a bifacial experimental installation
Analysing the sensitivity of bifacial gain (for the presented PV system) to albedo reveals that
an albedo difference of 0.1 results in an approx. 1 % bifacial gain difference, however this
value can be significantly higher in systems optimized for rear-side light collection.

 C. Non-uniformity and mismatch losses
Non-uniform irradiance patterns lead to different shading scenarios, causing varying amounts
of losses, which strongly depend on the electrical layout of the system. While shading losses
can be minimized by an appropriate system design, non-uniform irradiance is inevitable in
bifacial PV systems. In such systems typically 5 – 15 % of the energy output originates from
indirect illumination falling on the rear-side of the modules. Typical sources of indirect irradi-
ance are diffuse sky, ground reflection and reflections off mounting structure and other nearby

24
Task 13 Performance, Operation and Reliability of Photovoltaic Systems – Uncertainty in Yield Assessments and PV LCOE

objects. Figure 11 illustrates the magnitude of rear-irradiance variations throughout a bifacial
PV array. The graph shows results of a ray tracing simulation, where front- and rear irradiance
of each individual solar cell has been calculated for a clear-sky and cloudy day.

Figure 11 - Cell-by-cell front (black trace) and rear (red trace) irradiance of a bifacial PV
array in clear sky (left figure) and cloudy (right figure) conditions. Using semi-transpar-
ent traces allows to visualize the aggregation of the irradiance curves, indicating pos-
sible representatives.
According to Figure 11, superposing front and rear irradiance results in 10 – 15 % irradiance
variability throughout the PV array. Consequently, non-uniformity needs to be taken into ac-
count either by correctly choosing a representative location or by spatially resolving the entire
PV array.
The presence of mounting structure and module frame is commonly omitted by bifacial PV
system simulation approaches, in order to simplify computations. Simulating three different
scenarios can give an indication about the significance of this simplification. The three chosen
scenarios are: model including mounting structure, module frame and solar cells; model in-
cluding only module frames and solar cells and a model including only solar cells. All simula-
tions are performed by assuming a ground reflectivity of 0.5.
The results are presented by Figure 12, where the energy yield estimation corresponding to
the above three cases is compared. It is found that excluding the mounting structure causes
4.6 % erroneous increase of energy yield prediction and excluding module frames will add a
further 1.6 % error. Simplified geometries thus can result in overestimating the energy yield of
bifacial PV systems; however, the magnitude of this effect strongly depends on the specific PV
system design.

 25
You can also read