EThekwini's Residential Property Market - Size, Activity, Performance Funded by A deliverable of Contract 7174693 - Centre for Affordable ...
←
→
Page content transcription
If your browser does not render page correctly, please read the page content below
eThekwini’s Residential
   Property Market
   Size, Activity, Performance

                     Funded by

                  A deliverable of
                 Contract 7174693

              Submitted to the World Bank
  By the Centre for Affordable Housing Finance in Africa
                      February 2018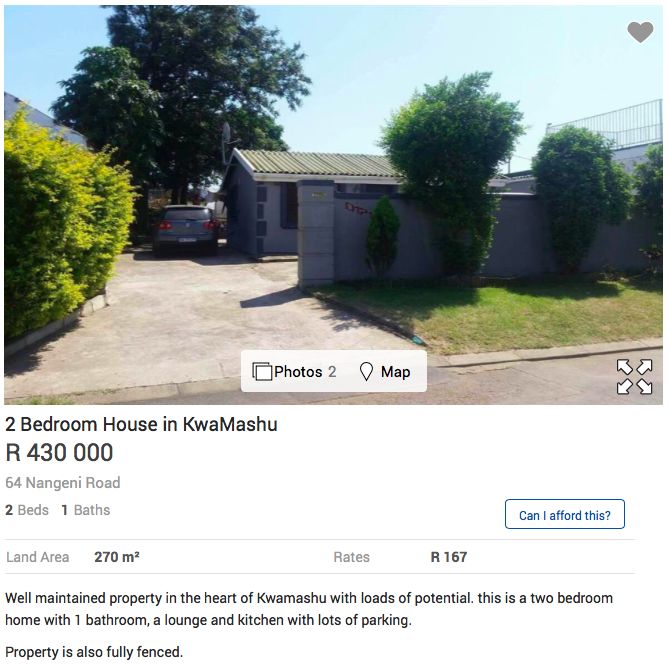
Acknowledgements

This report was prepared by the Centre for Affordable Housing in Africa, for the World Bank
as part of its technical assistance programme to the Cities Support Programme of the South
African National Treasury.

The project team wishes to acknowledge the assistance of eThekwini officials who
contributed generously of their time and knowledge to enable this work. Specifically, we
appreciate the support and vision of Beryl Mphakathi, head of Human Settlements and Ismail
Vawda, professional planner, human settlements.

We also wish to acknowledge Yasmin Coovadia, Seth Maqetuka, and David Savage of National
Treasury; and Yan Zhang, Simon Walley and Qingyun Shen of the World Bank; and
independent consultants, Marja Hoek-Smit and Claude Taffin, who all provided valuable
comments.

Project Team:
Kecia Rust
Alfred Namponya
Adelaide Steedley
Kgomotso Tolamo
Aqua Suliali
Illana Melzer

eThekwini’s Residential Property Market: February 2018                                   2
eThekwini’s Residential Property Market
Size, Activity, Performance
ACKNOWLEDGEMENTS ..................................................................................................................... 2
FOREWORD ...................................................................................................................................... 6
EXECUTIVE SUMMARY ...................................................................................................................... 7
1 INTRODUCTION ...................................................................................................................... 11
2 THE HOUSING MARKET – AN ANALYTICAL FRAMEWORK ....................................................... 12
2.1 THE HOUSING ASSET ........................................................................................................... 13
2.2 PROPERTY MARKET FILTERING ............................................................................................... 17
2.3 SEGMENTING THE HOUSING MARKET ...................................................................................... 20
3 ETHEKWINI’S RESIDENTIAL PROPERTY MARKET ..................................................................... 22
3.1 MARKET SIZE AND VALUE ..................................................................................................... 23
3.2 MARKET ACTIVITY ............................................................................................................... 30
3.2.1 Supply of new housing as seen on the deeds registry .................................................. 30
3.2.2 Resale market activity ................................................................................................ 32
3.2.3 Lending activity .......................................................................................................... 37
3.2.4 Housing prices ............................................................................................................ 38
4 PROPERTY MARKET PERFORMANCE IN ETHEKWINI ............................................................... 40
4.1 HOUSING AFFORDABILITY AND ACCESS .................................................................................... 43
4.2 ECONOMIC AND SPATIAL TRANSFORMATION ............................................................................. 47
4.2.1 Economic Transformation ........................................................................................... 48
4.2.2 Spatial Transformation ............................................................................................... 53
4.3 SUSTAINABLE HUMAN SETTLEMENTS ...................................................................................... 55
4.4 MARKET RESPONSIVENESS .................................................................................................... 57
4.5 TARGETED MARKET PERFORMANCE ......................................................................................... 59
4.5.1 Umlazi ........................................................................................................................ 61
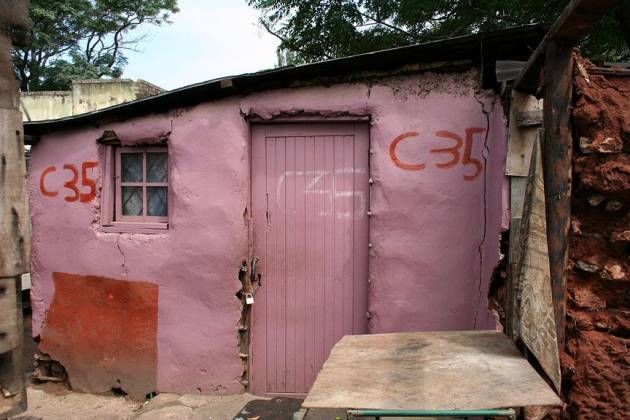
4.5.2 KwaMashu ................................................................................................................. 62
4.5.3 Inner City .................................................................................................................... 64
5 ETHEKWINI BY COMPARISON: HIGH LEVEL VIEW ................................................................... 65
6 BUILDING AN INCLUSIVE RESIDENTIAL PROPERTY MARKET IN ETHEKWINI ........................... 69
6.1 GROWING ETHEKWINI’S RATES BASE ....................................................................................... 70
6.2 STIMULATING AND SUPPORTING HOUSING CONSTRUCTION IN THE AFFORDABLE MARKET .................... 72
6.3 UNDERSTANDING AND WORKING WITH INFORMALITY ................................................................. 73
6.4 CONSIDERING THE DYNAMICS AND POTENTIAL OF THE RENTAL MARKET ........................................... 74
6.5 REALISING PRIORITIES WITH DATA-SUPPORTED DEVELOPMENT DECISIONS ........................................ 75
7 METHODOLOGY ..................................................................................................................... 77
7.1 MARKET SIZE AND VALUE ...................................................................................................... 78
7.2 MARKET ACTIVITY ............................................................................................................... 79
7.3 MARKET PERFORMANCE ....................................................................................................... 81
eThekwini’s Residential Property Market: February 2018 3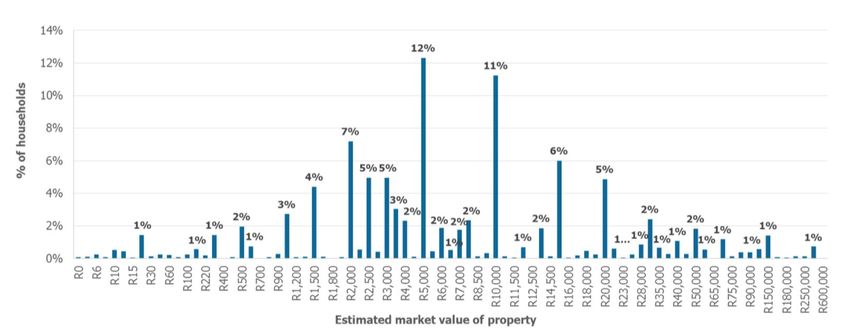
Tables
Table 1 Total Residential Properties by property type, eThekwini, 2015 ........................................................................... 27
Table 2 Total repeat transactions in eThekwini: all and government sponsored, 2010-2015.............................................. 33
Table 3 Churn by property type, eThekwini 2010-2015 .................................................................................................... 36
Table 4 eThekwini population income distribution............................................................................................................ 43
Table 5 Household income distribution vs. housing stock distribution by market segment, eThekwini .............................. 44
Table 6 Churn rates by market segment, eThekwini 2010-2015......................................................................................... 46
Table 7 Change in average property value, 2007-2015, of suburbs where 50% of properties are government-sponsored .. 49
Table 8 Churn rates in high performing suburbs, eThekwini, 2015.................................................................................... 54
Table 9 Suburbs with mortgage financed transactions under R300 000, eThekwini 2015 .................................................. 55
Table 10 eThekwini's valuations roll by segments, 2012 and 2015 .................................................................................... 57
Table 11 eThekwini's strategic zones: key data, 2007-2015 .............................................................................................. 60
Table 12 Key residential market indicators: properties, transactions and bonds, all metros, 2015 ..................................... 67
Table 13 Indicators used to consider Market Size & Value................................................................................................ 79
Table 14 Indicators used to consider market activity........................................................................................................ 80
Table 15 Indicators used to consider market performance ............................................................................................... 82
Figures
Figure 1 The Housing Asset ............................................................................................................................................. 14
Figure 2 Pools and flows to enable property market filtering ........................................................................................... 17
Figure 3 Blocked pools and flows undermine property market filtering ............................................................................ 18
Figure 4 A Property Ladder in eThekwini ......................................................................................................................... 19
Figure 5 Residential property for each market segment in eThekwini, by number and value, 2015.................................... 23
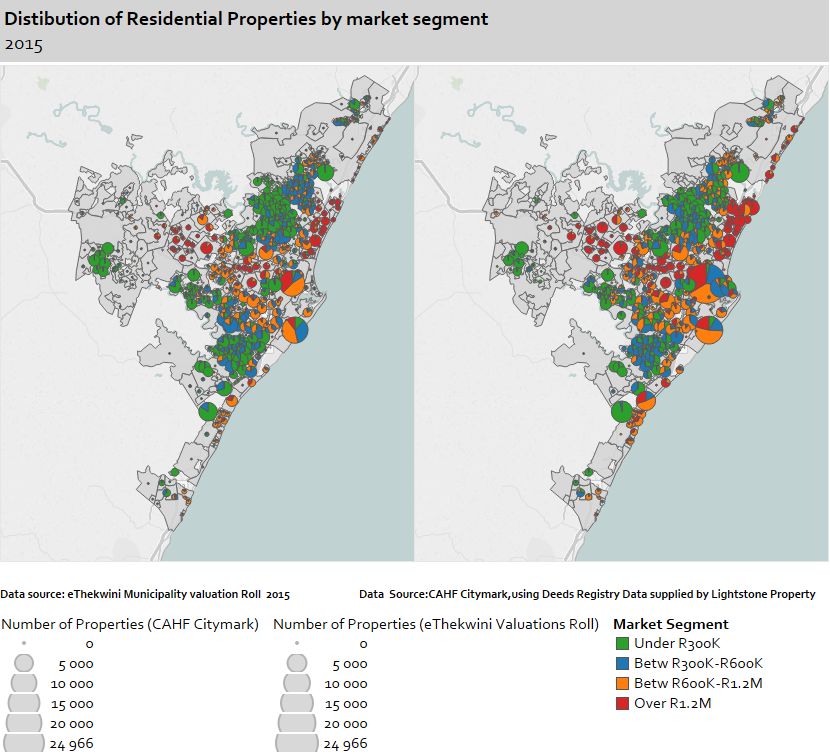
Figure 6 Distribution of residential properties by market segment, eThekwini 2015 (City Valuations data on the left vs.
National Deeds Registry data on the right) ............................................................................................................. 25
Figure 7 Neighbourhoods in eThekwini with a high property value diversity, 2015 ........................................................... 26
Figure 8 Location of government-sponsored properties and informal settlements in eThekwini, 2015 .............................. 28
Figure 9 Estimated market values for shacks not in backyards, NIDS, Wave 4 data ............................................................ 29
Figure 10 Percent change in total number of residential properties by market segment, in eThekwini since 2010 ............. 30
Figure 11 Total number of residential properties, eThekwini, by market segment by year 2007-2015 ............................... 30
Figure 12 Percent change in total residential properties in eThekwini since 2010, by property type: Freehold, estate &
sectional title......................................................................................................................................................... 31
Figure 13 New registrations of government-sponsored properties, eThekwini 2010-2015 ................................................ 32
Figure 14 Total repeat transactions and repeat bonded transactions, eThekwini, 2010-2015 by market segment.............. 34
Figure 15 Government sponsored resale transactions, eThekwini, by market segment, 2010-2015 ................................... 35
Figure 16 Government sponsored properties resale transactions, financed with a mortgage, eThekwini 2010-2015.......... 35
Figure 17 Transactions financed with a mortgage: number and value of bonds by lender, eThekwini, 2010-2015.............. 37
Figure 18 Total primary mortgage loans originated in eThekwini: number by lender, 2007-2015....................................... 37
Figure 19 Percent bonded transactions, eThekwini 2015.................................................................................................. 38
Figure 20 Resale transaction prices for bottom 100 suburbs in eThekwini, 2007-2015 ...................................................... 39
Figure 21 Key performance indicators, all residential properties: eThekwini, 2010-2015 ................................................... 41
Figure 22 Key performance indicators, properties under R600 000, eThekwini 2010-2015 ................................................ 42
Figure 23 Household income distribution vs. housing stock distribution by affordability for market segments, eThekwini . 44
Figure 24 New and repeat transactions by market segment, eThekwini 2010-2015 .......................................................... 45
Figure 25 Number of transactions (new and resale) financed with a mortgage bond, eThekwini, 2007-2015 ..................... 47
Figure 26 Government-sponsored properties by market segment: value, eThekwini 2015 ................................................ 48
Figure 27 Number of bonded transactions to government-sponsored properties. eThekwini 2007-2015, by lender, by
market segment .................................................................................................................................................... 50
Figure 28 Value of bonded transactions to government-sponsored properties. eThekwini 2007-2015, by lender, by market
segment ................................................................................................................................................................ 50
Figure 29 Average price of resale transactions for government sponsored properties, eThekwini 2007-2015, by market
segment, with and without a mortgage.................................................................................................................. 51
Figure 30 Estimated monthly rentals for shacks not in backyards, NIDS, Wave 4 data (entire country) ............................. 52
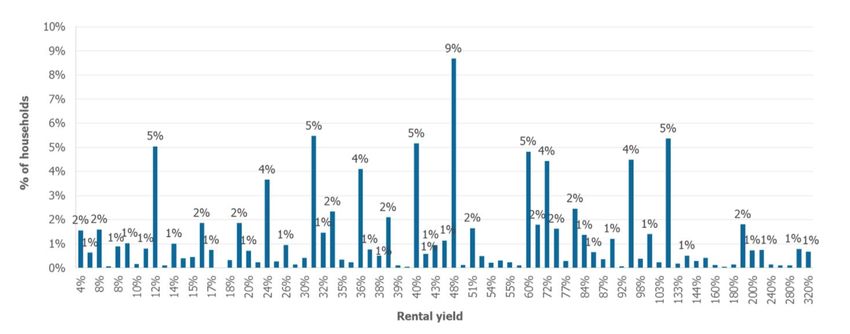
Figure 31 Rental yields on shacks not in backyards, NIDS, Wave 4 data (entire country).................................................... 52
Figure 32 Total residential properties by market segment, eThekwini valuations data 2015.............................................. 56
Figure 33 Recorded building plans passed and buildings completed in KwaZulu Natal, 2007-2017 .................................... 58
eThekwini’s Residential Property Market: February 2018 4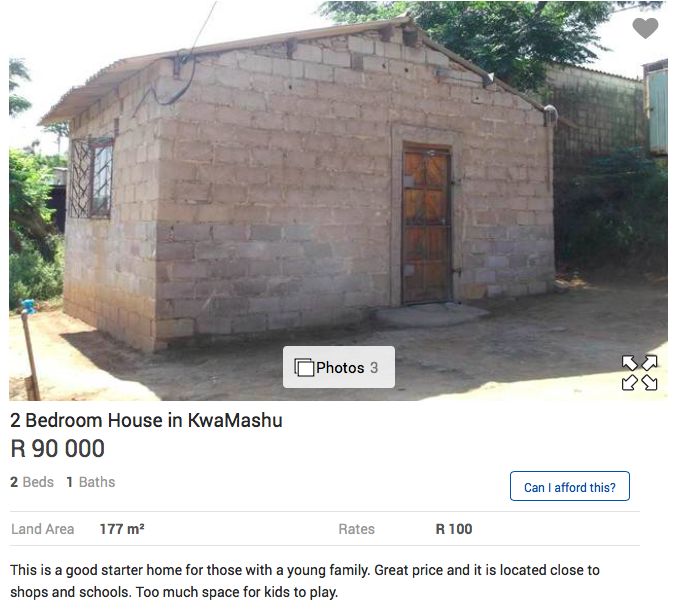
Figure 34 Comparing StatsSA and Deeds Registry data to understand new delivery in eThekwini, 2015 ............................ 59
Figure 35 Location of the Strategic Zones in eThekwini .................................................................................................... 59
Figure 36 Umlazi: key property market data .................................................................................................................... 61
Figure 37 Average price of resale transactions per year, Umlazi, by market segment, with and without a mortgage, 2007-
       2015...................................................................................................................................................................... 62
Figure 38 KwaMashu: key property market data.............................................................................................................. 63
Figure 39 Average price of resale transactions by year, KwaMashu, with and without a mortgage, 2007-2015 .................. 63
Figure 40 Inner City: key property market data ................................................................................................................ 64
Figure 41 Average price of resale transactions per year, Inner City, by market segment, with and without a mortgage,
       2007-2015 ............................................................................................................................................................. 65
Figure 42 Market size: households and properties, all metros, 2015................................................................................. 66
Figure 43 Total new & repeat transactions, all properties, all metros 2015 ....................................................................... 67
Figure 44 Total new & repeat transactions, properties under R600 000, all metros 2015 .................................................. 68
Figure 45 Total number of mortgaged financed transactions by lender, all metros, 2007-2015 ......................................... 68
Figure 46 Total value of mortgage financed transactions by lender, all metros, 2007-2015 ............................................... 69

eThekwini’s Residential Property Market: February 2018                                                                                                                           5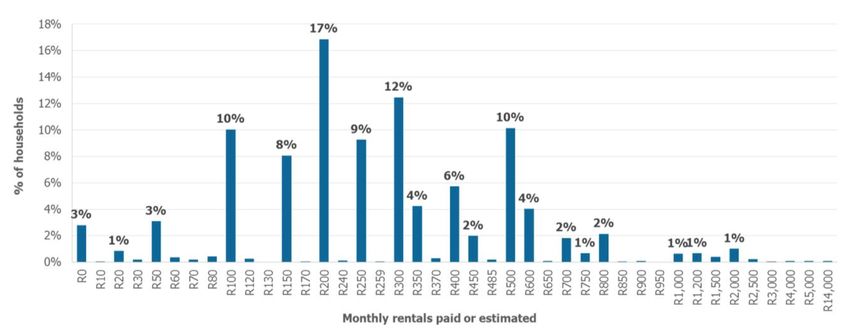
Foreword

eThekwini’s residential property market is a major and growing asset for both the city and its property-
owning residents. At the end of 2015, eThekwini’s 447 3181 residential properties were worth
R337 billion. Among this stock are the 105 678 government sponsored properties that have been
transferred to qualifying beneficiaries of the government’s housing subsidy scheme since 1994.
Comprising a quarter of our city’s property market, this sub-segment of our property market is
estimated to be worth R16,5 billion – a substantial asset for our city’s most poor.

The potential of our residential property market to serve the needs and aspirations of our residents is
substantial. At its most basic, housing provides shelter from the elements – and it is towards this
objective that we work to meet our constitutional obligation to ensure access to adequate housing on
a progressive basis for all our city’s residents. As anticipated by the national policy for sustainable
human settlements, Breaking New Ground, housing also functions importantly as a financial and an
economic asset. And for the state, the housing sector can contribute substantially to economic
growth, job creation and the sustainability of our human settlements. Good housing makes good
government possible.

It is therefore our job to work at all levels to ensure the productive performance of the housing asset
– for both individual households and the city as a whole. eThekwini has a serious challenge of under-
supply of new, affordable housing, especially for the most poor. This is something we must address if
we are to afford the benefits of our property market to all of our residents.

This report sets out our current analysis of housing market dynamics in eThekwini and draws on data
and analysis provided by the Centre for Affordable Housing Finance in Africa, as well as our own data
from the eThekwini Metro Municipality. The report explores the size, activity and performance of
eThekwini’s residential property market, on a segmented basis, highlighting areas of opportunity,
points of challenge, and options for maximizing the performance of housing for the benefit of all
residents, wherever they live in our city.

The breadth of analysis possible is extensive – this report is a first step, an introduction, to eThekwini’s
residential property market. Over time, we will continue to track the metrics set out in this report –
and develop new ones – to monitor and guide the interventions that we make towards creating a city
that is sustainable and inclusive, with a well-performing property market that meets the needs of all
of its residents.

As we move forward, our ability to track and monitor property market performance across all of our
properties, from the highest to the lowest value, including both formal and informal market activity,
ownership and rental, will enhance our ability as a city to provide support. This is a fundamental role
of municipal government: to support the productive performance of the housing asset for both
individual households and the society at large, so that the homes we live in contribute substantially
to the breadth of our goals for our democracy and growth as a city and its residents. Understanding
what is going on, and for whom different aspects of the market are working or are under performing,
is the first step.

1
  These figures are derived from municipal valuations property records, and thus by definition do not include unregistered
informal settlements or unregistered backyard dwelling units.

eThekwini’s Residential Property Market: February 2018                                                                   6

Executive Summary

eThekwini’s residential property market comprises 447 3182 properties, spread across 506
neighbourhoods (also known as sub-places), with prices ranging from as much as R8 million to as little
as R90 000 in 2015. In 2015, the total value of the entire residential property market was estimated
to be R337,4 billion. Owned primarily by individual households, this represents a significant
component of household wealth in the city.

Just over half (58%) of eThekwini’s property market is affordable. This includes the 258 039 properties
valued at less than R600 000 and serving many first-time homeowners. Within this market segment,
it looks like there are 105 678 government-sponsored properties that were allocated to qualifying
beneficiaries since 1994. While this is considerably less than the 180 000 that the city estimates it has
delivered to date, the discrepancy might have to do with the lag in title deeds. Government-sponsored
units include old township stock built before 1994 but transferred to residents as part of the Discount
Benefit Scheme in the mid-1990’s, as well as RDP and later BNG houses delivered as part of the
national housing subsidy programme. They might also include properties that began as serviced sites
through the IDT’s subsidized housing programme in the very early 1990’s, that later were awarded
consolidation subsidies. The potential for property appreciation in this market, enhancing the asset
value benefit enjoyed by subsidy beneficiaries, should be significant.

In addition to the 447 301 residential properties that comprise eThekwini’s property market, the 2011
Census identified 317 613 housing units that are in some way informal. Many of these properties are
not recognised on the deeds registry or on the valuations roll. One percent of this total (about 3 096
dwellings), however, are formal dwellings in informal areas. The experience of these households in
formalizing their housing may provide some insights into informal settlement upgrading potential.

eThekwini’s property market has been hampered by the very low levels of new build, which have
constrained the market overall. Delivery constraints include low income levels, high land and
infrastructure costs, and financing costs which increase the cost of housing. This constraint in supply
is evident in the rise in average transaction price (the price that is achieved in sales) and property
value (the estimated value of the property based on trends). Over the years between 2010 and 2015,
as illustrated in the graph below, the average value of transactions was well above the average
property value – by 35% – and rose by 42% in the period, versus a 37% rise in property values. This
suggests that demand is pushing prices up above actual values and indicates an opportunity for more
supply. eThekwini is currently (2017) revising its valuations roll.

The number of transactions has remained steady at about 15 000 – 16 000 per annum, with the vast
majority of these in the resale market. About a quarter of all new housing construction has been the
delivery of government subsidized housing. A key challenge is that the rate of new build has not
matched the population growth rate for some time – suggesting a growing rather than declining
housing backlog. Lender participation as a proportion of total transactions has been relatively
consistent overall: over half of all transactions, whether for new build or resale, have been financed
with a mortgage. As noted, change in properties is below eThekwini’s population growth rate,

2
  These figures are derived from municipal valuations property records, and thus by definition do not include unregistered
informal settlements or unregistered backyard dwelling units.

eThekwini’s Residential Property Market: February 2018                                                                   7
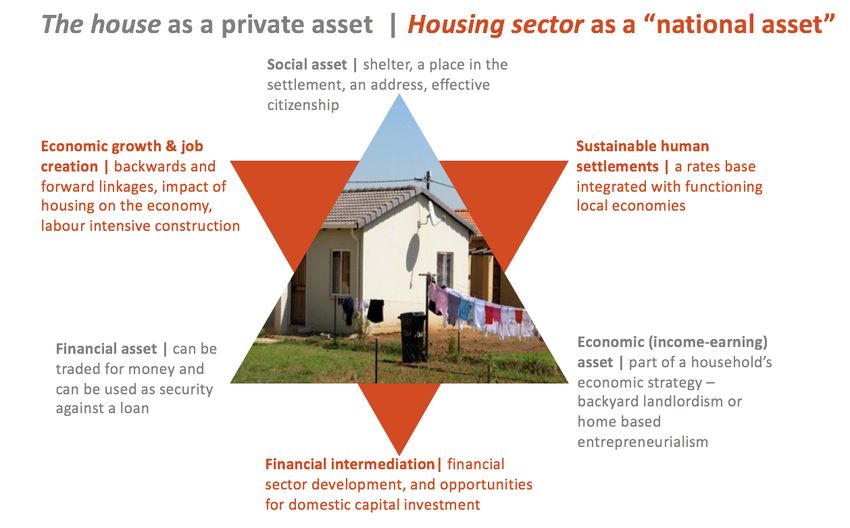
suggesting that the housing backlog is growing. This has contributed to the relatively stable, albeit
limited annual turnover (or churn) of existing housing.

To understand housing market performance, it is useful to think about the housing unit as an
individual, private asset, and to think of a functioning housing sector as a “national asset” of sorts,
that contributes to the overall economy. As an individual asset, the housing unit performs three ways:
as a social asset, providing shelter, an address, and effective citizenship; as a financial asset that can
be traded for money and used as security against a loan; and as an economic or income-earning asset,
part of a household’s economic strategy through backyard landlordism or the establishment of a
home-based business. As a “national asset” the housing sector also performs in three ways: the
construction of new housing, the resale market and the residential rental sector all contribute towards
economic growth and job creation; sustainable human settlements create productive neighbourhoods
and a rates base which is integrated with functioning local economies; and the financing of the housing
sector offers opportunities for financial intermediation which contributes toward financial sector
development and creates opportunities for domestic capital investment.

A key point of focus for the city is to understand how the two asset dimensions – housing as an
individual asset and the housing sector as a sort of “national asset”– interact, and the impact that the
informal housing sector has on both. Ultimately, the goal is to maximise housing market performance
for the benefit of City residents, as well as for the city itself. This requires careful attention to the
extent to which households can maximise the social, economic and financial performance of their
housing – and implementing measures that support them in this effort – while also enhancing the
impact that the City’s work in human settlements has on its local economy, its labour market, and its
overall sustainability as a city.

eThekwini’s property market dynamics present City management with a set of challenges that are
complex and diverse. The key challenge appears to be the delivery of sufficient stock to match the
breadth and diversity of the population.

The various segments that comprise eThekwini’s property market perform differently, in some cases
for the benefit of residents, and in others exacerbating inequality. Informality is prevalent, and it is
likely that this is undermining functioning markets. Low levels of churn reflect limited housing choices,
and while some households are managing to realise equity through the appreciation of their property,
this is limited. Although there is no explicit data to support this, it is likely that eThekwini’s property
market also includes informal transactions, reflecting a context in which households struggle to access
and navigate administrative systems to access funding, obtain information and transact formally. This
discount of market value on replacement cost itself reflects poor governance, with high crime and
poor connectivity. Often city management is limited and competes with alternative governance
structures. Secured lending is minimal and declining in these markets, as lenders avoid additional risks
- both financial and reputational – of operating in these areas.

The overall goal for building an inclusive and productive residential property market in eThekwini
suggests five broad areas of attention for the city:

1. Growing eThekwini’s rates base: This would involve exploring how the city levies rates on
   residential properties and reconsidering how certain properties are exempted from paying
   property tax. Beyond this, it is recommended that the city grow its rates base through various
   ‘value creation’ measures that stimulate property market growth at the local level. On the one
   hand, property prices reflect underlying supply conditions, which the City can influence through

eThekwini’s Residential Property Market: February 2018                                                   8
the management of its development controls. Increasing prices might indicate limitations in the
    supply zoned or serviced land. On the other hand, prices will reflect the success or failure of city-
    led strategies designed to make some areas more habitable or to improve the quality of life of
    residents. The simple implementation of development controls in support of quality home
    improvements can also have an important impact. The city can use these insights to identify areas
    that are under-performing in terms of value, and actively support targeted household investments
    on these particular metrics.

    The key goal for City management must be to see eThekwini’s property market as a single property
    market, with high and low values that all have investment potential and worth. The rates policy
    itself can assist in shifting the approach in this way – by focusing on the twin goals of maximizing
    both financial and social value of the housing asset and using the strengths of one to support the
    growth of the other.

2. Stimulating and supporting housing construction in the affordable market: The low level of new
   housing construction, both by the private sector and the state, is a serious issue that should be
   getting the attention of the city. All the data points highlight a serious gap between supply and
   demand, not to mention the visible proof of informal living. The situation is compounded by the
   affordability constraints faced by many of the city’s residents. It is clear, however, that the
   national housing subsidy programme will not be able to meet the breadth of this need any time
   soon.

    The city has a number of tools at its disposal to influence the market focus of the supply side.
    While developers naturally target high value properties where they can anticipate a high margin,
    the development controls imposed by the city can change the financial parameters in favour of
    affordable housing, or social housing, both of which would better serve the city’s demand for
    accommodation. For example, the city could prioritise redevelopment applications in low value
    areas, offering an expedited approval process. Or, the city could impose a subdivision tax of sorts
    in high value areas where the market is naturally seeking returns and direct the revenue from this
    into lower value areas. By understanding where developers naturally focus and why, the city can
    insert its will with the role it plays in the development process.

3. Understanding and working with informality: Informal market activity is often an expression of
   formal systems not working as the market requires. The city should explore strategies to improve
   household compliance with requirements regarding planning approval. Access to simple building
   plans and active support of in situ home improvements, through expedited and supported
   development approvals would also contribute to households’ own efforts to improve their
   housing situations. Similarly, given that informal transactions effectively remove housing assets
   from the pool of formal, titled properties in the City and undermine the performance of the
   property market in many areas in which the State has invested significantly, it should be a matter
   worthy of urgent attention by City management.

4. Considering the dynamics and potential of the rental market: Special attention should be given
   to exploring the existence, functioning and potential of the rental market, not limited to social
   housing, but also including privately provided rental, both formal and informal. By understanding
   this breadth and how it functions, and applying its various development levers, eThekwini can
   influence the rental sector and how it meets this diversity of demand, and the extent of private
   investment that it attracts. In the immediate term, the city should consider which of its datasets
   offer an indication of rental activity, such as building permits data, utility hookups and account

eThekwini’s Residential Property Market: February 2018                                                 9
information for distribution of units and usage. A focused analysis on the supply of and demand
    for rental in the city, with particular attention on certain nodes, would be very useful.

    There may be opportunities for backyard and other forms of small scale rental housing provision,
    as well as targeted densification along transport routes and in specific urban hubs. The city can
    stimulate this through the prioritization of building plan approval for these sorts of investments,
    as well as through the good governance attention that gives comfort to lenders regarding area
    risk potential.

5. Realising priorities with data-supported development decisions: A key aspect of a city’s ability
   to track the property market is its ability to count it. The central source of reference must be the
   National Deeds Registry, on which the entire property market depends. The extent to which it
   represents the full property market, however, is complicated by the delayed titling process in the
   government-sponsored market, and other factors that affect low value properties in particular.
   eThekwini’s Valuations Roll is a separate database that enables the city’s property taxation regime
   – a critical component of its revenue base. At the moment, these two databases do not fully align.
   Understanding and addressing the anomalies must be a priority going forward.

    The ability to track specific markets and characteristics allows municipalities to appropriately
    manage resource allocations in terms of infrastructure investment, while monitoring any
    economic disequilibrium in property prices. This would assist eThekwini tremendously in
    understanding particular neighbourhood or area-based property market dynamics, which would
    both contribute to a more refined application of rates against property values, and to greater
    precision in the implementation of particular policy measures such as infrastructure investment
    or area-based management.

In all of the data, and across all the analyses, the clear challenge for eThekwini is to stimulate new
construction, especially in the affordable market. In part, this may be a challenge to the lending sector,
to recognize value in the new, lower value housing that is coming annually on stream through the
national housing subsidy programme, and to support quality home improvements through the
provision of credit for this purpose. It is most critically a challenge internally, to the City, however, to
prioritise building plan and other development approvals for affordable market stock in targeted
areas, highlighting to the development sector that this is where the City wants to focus its efforts.

The realization of government’s commitment to access to adequate housing for all depends on well-
functioning housing markets, and not just the delivery of new housing. This report quantifies
eThekwini’s residential property market, exploring market size and value, and market activity, paying
attention to both formal and (where possible) informal market activity. It further explores property
market performance, specifically in terms of key metrics that are important to the city at this stage in
its growth and development and given the population that it serves. Cities play a critical role in the
performance of the residential property market, through the various development levers they apply
and their overall management and governance of the neighbourhoods in which their residents reside.
Cities must therefore extend their attention to how housing markets, highly complex systems,
perform, and use this knowledge to support their overall human settlements goals.

eThekwini’s Residential Property Market: February 2018                                                   10
1 Introduction South Africa’s residential property market is the largest component of the South African property market, comprising the majority of property assets within the country, and an important component of household wealth. The South African deeds registry comprises seven million properties, worth almost R6 trillion.3 Of this, about 6,1 million registered properties, or 87%, are considered residential, ranging from sectional title to freehold properties and estates; including government-sponsored homes, homes occupied by their owners or rented to others, and holiday homes; and found across the country, from rural areas (with formal title), to mining towns, to small and secondary cities, to metro municipalities. The majority of the residential property market – 62% in 2015 – includes homes valued at less than R600,0004. Of this, two thirds (or 43% of all properties) are homes that are valued at less than R300,000, of which the majority are estimated to be government sponsored homes: clear evidence of the significance of government’s subsidised housing programme and the sheer volume of property assets transferred to qualifying beneficiaries since 1994.5 Almost two thirds (about 57%) of the total formal residential property market is found in the eight metro municipalities. Thirteen percent (817 009) of the nation’s residential properties are found in the KwaZulu Natal. With about 447 318 residential properties on the national deeds registry, eThekwini’s property market comprises roughly 7% of the total residential property market in South Africa, and 55% of the residential property market in KwaZulu Natal. Residential property is the largest and most differentiated asset within any city, and a significant part of a city’s economy, especially insofar as it relates to household wealth, livelihoods, and the prospect of inclusive growth. As the property market grows and develops, housing can be an instrument of economic transformation, with property values growing faster than inflation and offering leapfrog opportunities to lower income households as they benefit from the appreciation of their housing asset. This creates further opportunities to leverage property with finance, supporting the development of small businesses, so important in the context of low employment. At the same time, this activity contributes to a growing revenue base for the city and improves its ability to invest in further growth and deliver appropriate services to the breadth of its population. Understanding housing markets is a key first step in maximising the power of the housing asset for all residents and for the city itself. Cities have a myriad of tools with which to stabilise and grow housing markets, including policy, programmes and legislative oversight and management; financial resource redistribution including the ability to collect taxes and distribute subsidies; and property asset redistribution, including the acquisition and disposal of land and buildings. With a more detailed 3 The data analysed in this report has been provided by the Centre for Affordable Housing Finance in Africa (CAHF), which draws its data from the National Deeds Registry, as provided by Lightstone. Additionally, some of the data is drawn from the City itself – this is clearly indicated. The data in this report reflects eThekwini’s property market as it stood at end 2015. 4 These market segments have been established by CAHF using Lightstone’s valuation methodology. 5 This includes housing delivered as part of the national housing subsidy scheme since 1994, as well as housing delivered prior to 1994 but transferred within the democratic administration to occupants as part of the Discount Benefit Scheme. Counting the number of government-sponsored properties in the city is surprisingly difficult, as no database is conclusive, each having been compiled for different reasons. The approach to this is clarified in the section on methodology. eThekwini’s Residential Property Market: February 2018 11
understanding of housing markets, the City can better implement a robust, supportive and
coordinated housing market regime. Metro administrators can:

•   Better meet demand – identify housing affordability challenges and more efficiently provide well-
    located housing options, identify, capture or create momentum in as yet unrecognised areas of
    growth and development, better connecting employment and housing;
•   Better stimulate supply – identify, measure, and incentivize supply gaps (in price or location) that
    prevent an otherwise willing and able market to achieve their housing goals;
•   Invest scarce public funds more effectively and more efficiently - to reinforce and influence better
    connections between supply and demand;
•   Support sustainable livelihoods – through promotion of housing asset performance, providing the
    means for lower income families to move up and out of poverty; and
•   Build local economic viability at the neighbourhood level – through the creation of investment-
    worthy areas in which private individuals and businesses place their own resources, further
    leveraging the city’s investment, and contributing to a growing rates base.

This report provides an analysis of eThekwini’s residential property market in terms of its size and
value, activity, and performance. Market size, value and activity are status quo analyses, setting out
the shape and dynamics of eThekwini’s property market. Market performance then considers these
dynamics against specific performance objectives.

Following this introduction, Section 2 provides the analytical framework for looking the market. It
considers the role of the housing asset, how property market filtering happens, and how the housing
market can be segmented to develop appropriate responses that are relevant to all of the City’s
residents. In Section 3, the size and value of eThekwini’s residential property market is set out,
together with an analysis of current activity in terms of supply of new housing, the resale market,
lending and house prices. Section 4 then considers the actual performance of eThekwini’s property
market and whether it is responding to the City’s goals for affordable and accessible housing,
economic transformation and inclusive growth, and sustainable human settlements. The report then
considers how responsive the market is to the demand pressures that exist and looks in some detail
at performance in the city’s strategic zones – the Inner City, KwaMashu, and Umlazi. In Section 5,
eThekwini’s property market is compared with those in the other major metros in South Africa.
Section 6 concludes with considerations towards the realization of an inclusive residential property
market in the city. The methodology for the analysis is summarized in Section 7.

2   The Housing Market – An Analytical Framework

Housing exists in a market: housing is produced, owned, rented, maintained and sold in a complex
system involving buyers and tenants (individuals, households, companies and governments), suppliers
and sellers (developers, builders, homeowners, landlords and governments), market facilitators
(financiers, estate agents, conveyancers) and regulators (the City, the province, national government,
and various public agencies and regulatory bodies). Like other economic goods, housing supply is
influenced by an expression of demand, which itself is influenced by affordability – the ability and
willingness of the buyer or tenant to invest in or pay for the housing product. In eThekwini, demand
is substantially constrained by affordability. What the supply side delivers is too expensive for what
the demand side can afford to pay. This is the case for a number of reasons, but ultimately, what it
results in, is a widening and diversifying of the housing market to include both formal and informal

eThekwini’s Residential Property Market: February 2018                                               12
housing supply. Formal housing, delivered or improved according to city building regulations with approved building plans, on regularized land, and by registered builders, targets higher income earners. Informal housing, often escaping observation without plan approval, built or improved by informal builders, in backyards or on unregistered land, targets lower income earners and the poor. To bridge the affordability gap and assist poor households to access the formal housing market, the national government offers a state-subsidised housing programme. But as is evident across the country, this is not delivering enough housing, and inadequate housing circumstances persist. There is a further dimension. Unlike other economic goods, housing exists on land, a finite resource that has value relative to its location and access to services and amenities. The value of land often interferes with the value of housing: a fabulous, three-bedroom unit with a state-of-the-art kitchen, on a piece of land on the edge of the city, or where the government fails to deliver its services, may have cost more to build, but is likely to sell for less than a tiny bachelor flat in the city centre where the homeowner can have a view of the ocean and enjoy uninterrupted services supply. This is because households with affordability will compete to buy the well-located and well-serviced housing, and may be willing to pay more for these benefits. House prices are determined by the trade-offs that buyers make in choosing where and how to live, and as a result, housing markets are all about location. At the same time, the city has an important role to play in influencing housing supply and demand dynamics. Essentially, cities can influence market behavior through providing information (including outreach to external audiences as well as its own planning needs), regulation (zoning and land use restrictions and incentives), and finance (investment in infrastructure and service delivery, including subsidized housing). Cities play a significant role in place making and value creation, including managing the effects of social exclusion precipitated by gentrification, or in creating inclusionary housing opportunities. These all influence (and sometimes directly drive) housing demand and supply dynamics and create opportunities to leverage both public and private resources towards meeting housing needs and making markets perform in the interests of all residents and the city as a whole. 2.1 The Housing Asset The question of market performance – the value that housing realises for both the household and the city as a whole – is important. Housing is an asset. For households, it is likely to be the most significant investment that they will make in their lifetimes. With the national housing subsidy programme, it is also a significant investment for the State. Beyond the subsidy programme, housing markets also offer the city substantial revenue opportunities that create the budget that makes the city function. Cities want to make sure that they get the best value out of their investment. To understand housing market performance, it is useful to think about the housing unit as an individual, private asset, and to think of a functioning housing sector as a “national asset” of sorts, that contributes to the overall economy. eThekwini’s Residential Property Market: February 2018 13
Figure 1 The Housing Asset

Source: CAHF

As a private asset, the house brings value to the household, whether they own or rent, in three main
ways. First, there is a social value. The house sits within a neighbourhood and is the place to which
family and friends come to celebrate and share life experiences, and from which the household goes
to find work or otherwise engage in society. The house itself is the site from which the household
accesses infrastructure services – water, sanitation, electricity and refuse collection. In the
neighbourhood, the household can also access social services – schools, clinics, community centres –
that profoundly impact on their quality of life. Enhancing the social asset performance of housing is
about improving the quality of the neighbourhood and creating spaces for families to come together.

The house also has a financial value: it is worth something and can be traded for money. It can also
be used to leverage a loan from a bank – the home owner can secure a mortgage loan by using the
house as collateral. This can be used to invest further in the house, to start a business, to pay for
education, or to make other significant investments. The house can also be passed on as an
inheritance to children or other family members, and in this, operates as a form of savings that
contributes towards household wealth. Enhancing the financial asset performance of housing is about
enabling incremental home improvements, improving property values, increasing access to loan
finance, and improving transaction support to ensure that households can access the financial value
of their properties when they need to.

Lastly, the house can also function as an economic asset for the household. In this, the house becomes
the base from which a household might run a small business, offer accommodation for rent, or
otherwise earn an income. In the context of high unemployment, this creates an especially important
opportunity for households to realise sustainable livelihoods. The establishment of home-based

eThekwini’s Residential Property Market: February 2018                                             14
enterprises also diversifies land uses and creates more sustainable human settlements. A spaza shop
operating from a home in a residential neighbourhood saves neighbours from taking the bus to buy
milk, while creating an income stream for the shop owner.

The formality of the household’s rights over the property, and whether or not the housing unit itself
is a formal structure, impacts substantially on the performance of housing as a private asset. It is
obvious that formally titled or leased properties that are well-placed within the urban context and
constructed out of durable building materials that protect their inhabitants from the elements, offer
stronger social, financial and economic potential than informal housing. Informal housing also has
value, however. A shack in a well-located settlement may offer the household better income earning
opportunities than a formal structure that is outside an area of economic activity, or may provide
better access to economic opportunity. Similarly, an informal transaction may be worth more to the
transacting parties, even if it realises less financial value, simply because it can be concluded more
quickly. Cities need to understand these dynamics if they are to improve housing asset performance
for their residents, whether they live in formal or informal settlements.

While housing and private property is in many ways the quintessential private good, the housing
sector as a whole performs a vital role in an economy, and can therefore be thought of as a sort of
“national asset”. All supply chains associated with products and services create jobs and contribute
to the economy, and housing is no exception. Add data. But beyond this, housing impacts on the
economy in some unique ways. By understanding what makes housing different from other products
and services we can explore the critical role for cities in shaping housing markets. There are three
dimensions to this.

First, the construction, maintenance and transacting of housing (which includes both sales and leases)
contributes substantially to economic growth and job creation, which can have very tangible local
benefits. CAHF has estimated that the housing construction and rental sectors contribute about 2.4%
to Gross Value Added at the national level, equivalent in the economy to the agriculture, forestry and
fishing sectors, and to the food sector.6 The reason for this contribution has to do with the economic
activity that housing stimulates – upstream demand for building materials and labour, and
downstream demand for furniture, home improvements, and other housing services. All of this
economic activity also contributes towards employment. CAHF estimates that in 2014, the housing
construction sector created approximately 242 000 full time equivalent jobs (formal and informal)
across the country. The rental housing sector created a further 226 000 full time equivalent jobs
across the country in 2014. 7 Cities that promote housing construction and rental can use this to
stimulate job creation in their areas, further contributing to economic growth.

Second, housing constitutes a vital component of the financial system, and plays a critical role in
financial intermediation, assisting the flow of money through the economy. This is because housing
is a leverage-able asset that can be used as collateral for other loans, thereby enabling private
investment. In many developed economies, housing underpins a sizeable proportion of the assets of
the financial sector through the mortgage instrument. This in turn underpins the efficacy of the
money transmission mechanism in the household sector, enabling monetary authorities to manage

6  See http://housingfinanceafrica.org/what-role-does-housing-play-in-african-economies/ and http://housingfinanceafrica.org/story-
housing-economy-exploring-south-africas-housing-value-chains/
7 Centre for Affordable Housing Finance in Africa (2017) Housing Economic Model: South Africa. See http://housingfinanceafrica.org/what-

role-does-housing-play-in-african-economies/       and    http://housingfinanceafrica.org/story-housing-economy-exploring-south-africas-
housing-value-chains/

eThekwini’s Residential Property Market: February 2018                                                                              15
economic growth cycles. Mortgages are also useful as an investment class, given their long-term
nature. In addition, housing consumption is in most cases, the largest share of household
consumption, and often the most significant asset a household will ever have. The house is then a
fulcrum around which a household’s financial and investment decisions are made, both influencing
and enabling further financial activity.

In South Africa, while the mortgage market is well developed relative to the rest of the economy, it
serves a minority of households. This is unsurprising given the high levels of inequality that
characterise the country. However, there has been significant investment in housing by the State, and
a significant transfer of wealth through the housing subsidy programme directly to poorer households.
The failure of these assets to translate into performing financial assets through mortgage instruments
is not only disappointing for low income home owners themselves, but it also fails society in doing
little to reduce wealth disparities. Despite the formalisation of housing, many RDP properties transact
below replacement cost and owners fail to realise value and grow their wealth through housing. While
several factors contribute to poorly performing housing markets, local government and urban
management have a significant impact on the value of housing, its market performance, and therefore
its contribution to the overall financial system.

Finally, the housing sector contributes to the sustainability of human settlements in a number of ways.
Housing and settlement patterns fundamentally shape the experience of households who live in a city
as well as the capacity they contribute and the resources they draw. Households located far away
from jobs in areas poorly served by public transport are unlikely to be able to participate in the labour
market even to the limited extent that the economy currently allows. The sheer distances require
increased public investment transport and on-going subsidisation. Segregation also limits
opportunities for social interaction and undermines critical social objectives.

A further contribution to the city sustainability is through the rates and taxes generated by property
and the ability of the city to capture this value to serve its broader development goals. As properties
appreciate in value, they increase a city’s rates base, and this contributes to the growth in city budgets
that enable them to invest in further infrastructure and services delivery, which further supports
growth.

For eThekwini, the individual housing asset and the housing sector more broadly is a fundamental
component to each of the city’s six strategic priority areas8. Housing, no matter the value, contributes
to:
• A financially sustainable city primarily through the valuations and property ratings process
• A safe city by ensuring quality living environments
• An accessible city, by being well located and networked within existing economic opportunities
    and other social amenities
• An environmentally sustainable city, in the way it is constructed as well as the way it fits within
    existing urban form
• A city creating sustainable livelihoods by offering economic opportunities through home-based
    enterprises, and small-scale landlordism
• A socially cohesive city, by integrating previously segregated neighbourhoods and providing
    access to well-located housing for all levels of affordability.

8   http://www.durban.gov.za/City_Government/City_Vision/IDP/Documents/Final%202016_17%20IDP%2029052016.pdf

eThekwini’s Residential Property Market: February 2018                                                        16
You can also read