Poverty Alleviation and Retirement Protection - Progress and Vision - Chief Secretary for Administration's Office
←
→
Page content transcription
If your browser does not render page correctly, please read the page content below
Poverty Alleviation and
             Retirement Protection
             Progress and Vision

Self-reliance

                                      Upward
                                      Mobility             Retirement
                                                           Protection

  Social
Innovation

                                            Poverty
                                           Alleviation

             Chief Secretary for Administration’s Office
             January 2017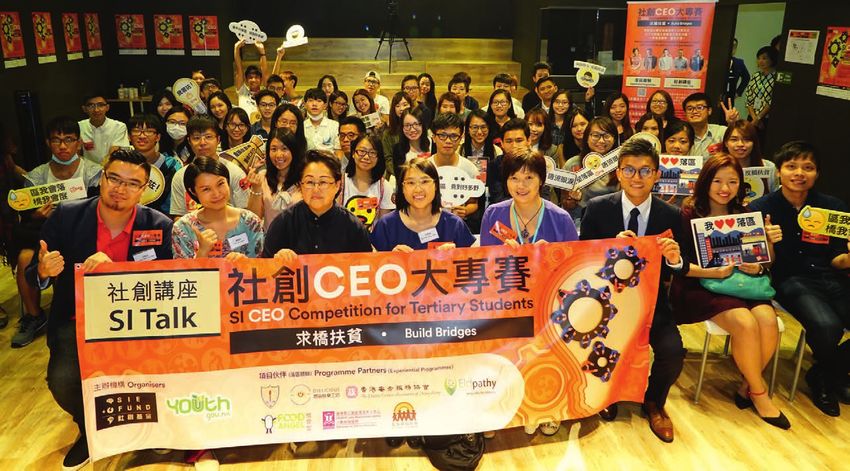
Contents
Executive Summary
Chapter 1: Poverty Alleviation — Philosophy and Institution Set-up
Our Philosophy 10
Reinstating the Commission on Poverty 10
Expenditure on Poverty Alleviation 12
Setting the Official Poverty Line 13
Poverty Situation of Hong Kong in Recent Years 14
Challenges on Poverty Alleviation arising from Population Ageing 18
Chapter 2: Poverty Alleviation — Progress Achieved
Role of the Government 22
Elderly Poverty 24
Working Poor 25
Upward Mobility of Young People from Underprivileged Background 27
Support for the Disadvantaged 29
Community Care Fund 33
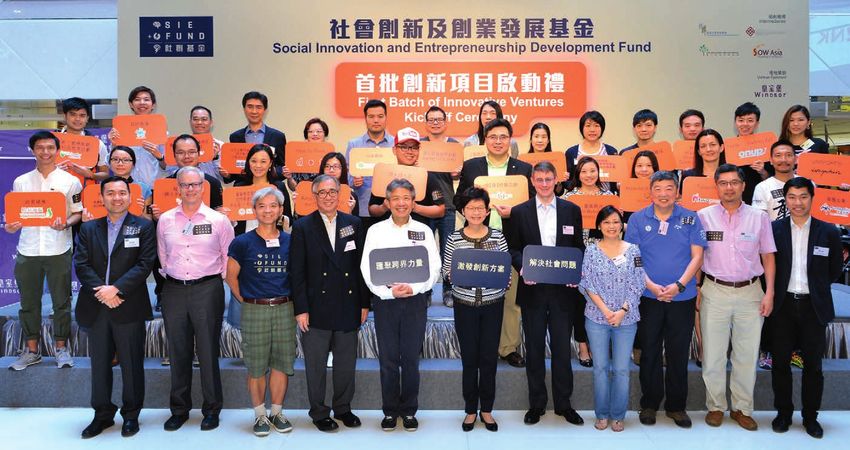
Social Innovation and Entrepreneurship Development Fund 35
2
Chapter 3: Full Range of Support for Retirement Protection

       “Retirement Protection Forging Ahead” public engagement exercise             42
       •     Major public views                                                     43

       Demographic, fiscal, elderly poverty, etc. considerations                    46

       Government’s comprehensive policy response                                   50
       •     Reinforcing the multi-pillar system                                    50

       Enhancing the multi-tiered social security pillar                            52
       •     Providing additional targeted support for elderly persons under OALA   54
       •     Enhancing the CSSA application arrangement for elderly persons         59

       Improving the public services pillar                                         62
       •     Extending the coverage of the medical fee waiver system                62
       •     Enhancing the Elderly Health Care Voucher Scheme                       63
       •     Enhancing medical services for elderly persons                         64

       Enhancing the MPF pillar                                                     66
       •     Abolishing the “offsetting” arrangement                                68
       •     Developing the eMPF platform                                           81

       Making the voluntary savings pillar more assured                             82
       •     Supporting elderly persons in investment management                    82
       •     Encouraging voluntary savings                                          82

       Measures already introduced                                                  83

       Government’s financial commitment under the package                          84

       Conclusion                                                                   85

Chapter 4: Our Vision

                                                                                         3

Executive
Summary
Poverty Alleviation and Retirement Protection:
Progress and Vision
Executive Summary
1. In December 2012, this term of the Government reinstated the Commission on
Poverty (CoP) which is chaired by the Chief Secretary for Administration, with four
Directors of Bureau and 20 non-officials from different fields as members. In the
past four years or so, the CoP has been working closely with the Government in
combating poverty. The CoP has spared no efforts in taking forward various
initiatives from formulating the official poverty line, developing and launching the
Low-income Working Family Allowance, mounting the territory-wide retirement
protection consultation exercise to strengthening support for disadvantaged
groups, enhancing upward mobility for young people with grassroots background,
and furthering the work of the Community Care Fund and social innovations.
Apart from providing the Government with constructive advice, the CoP has also
participated actively in various activities. This booklet has reviewed the work of the
CoP in the past.
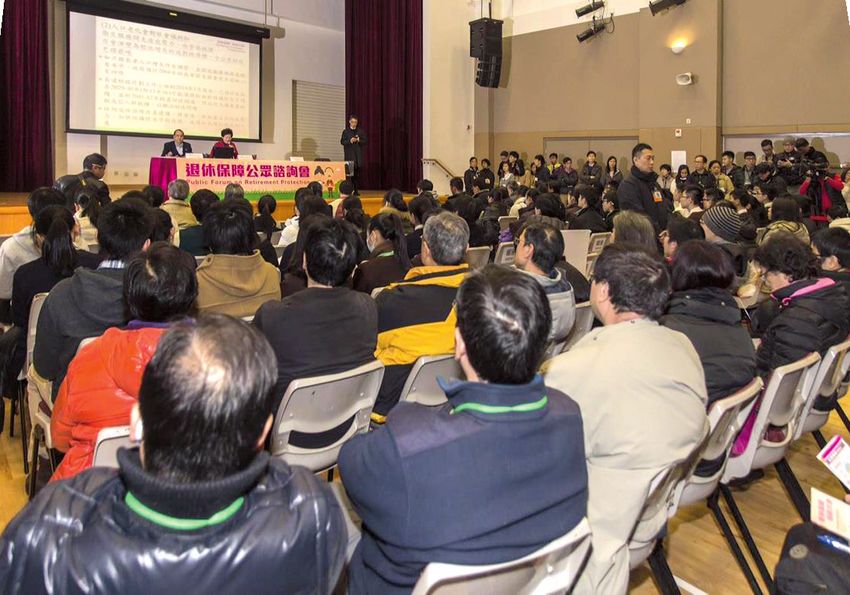
2. Last June, the CoP completed a six-month public engagement exercise on
retirement protection. After taking into account the public views and ensuring
the sustainability of our financial commitment, the Government has formulated
a package of measures to strengthen each pillar, as a comprehensive response to
the public aspiration for enhancing retirement protection. We will provide in this
booklet a full account of the Government’s proposals.
3. Salient features of the retirement protection package include-
Reinforcing the multi-pillar system
(a) Hong Kong should continue to adopt a multi-pillar retirement protection model
that underlines the principle of shared responsibility among individuals/families,
employers and the Government. We should strengthen each of the existing pillars
while maintaining the affordability and financial sustainability of the system;
Enhancing the multi-tiered social security pillar
(b) adding a higher tier of assistance under the Old Age Living Allowance (OALA) by
providing a higher monthly allowance of $3,435 per person for elderly persons
with more financial needs who are eligible for the allowance, i.e. elderly singletons
with assets not exceeding $144,000 or elderly couples with assets not exceeding
$218,000; and relaxing the asset limits for the existing OALA1 from $225,000 to
$329,000 for elderly singletons and from $341,000 to $499,000 for elderly couples
to benefit more elderly persons with financial needs;
(c) while maintaining the requirement that applicants under the Comprehensive
Social Security Assistance (CSSA) Scheme will need to apply on a household basis,
abolishing the arrangement for the relatives concerned to make a declaration
1
The existing asset limits refer to the limits to take effect on 1 February 2017.
6
on whether they provide the elderly persons who apply for CSSA on their own
      (e.g. an elderly person who does not live with his children) with financial support
      (the so-called “bad son statement”). The information should be submitted by the
      elderly applicants only;
(d)   raising the eligibility age for elderly CSSA from 60 to 65 to align with the direction
      of our population policy on the extension of retirement age. Elderly persons aged
      between 60 and 64 who are receiving CSSA before the new policy takes effect will,
      however, not be affected;

      Meeting the healthcare needs of elderly persons better
(e)   granting medical fee waivers automatically to older and more needy OALA
      recipients (i.e. OALA recipients aged 75 or above and with assets not exceeding
      $144,000 for singletons or $218,000 for couples) in receiving services from the
      public medical system;
(f)   lowering the eligibility age for the Elderly Health Care Voucher from 70 to 65;
(g)   providing Hospital Authority with additional $2 billion recurrent resources from
      2017-18 to improve medical services for the elderly and other patients and reduce
      waiting time. Services provided by the Department of Health’s Elderly Health
      Centres and Visiting Health Teams will also be enhanced;

      Enhancing the Mandatory Provident Fund (MPF) System
(h)   abolishing progressively the “offsetting” arrangement through three key measures -
      (i) abolishing the “offsetting” arrangement with effect from a prospective date
          (the Effective Date) and putting in place an arrangement to “grandfather”
          the accrued benefits from employers’ MPF contributions before the Effective
          Date and the returns derived therefrom for “offsetting” against the severance
          payment (SP) /long service payment (LSP) payable for the employment period
          before the Effective Date;

      (ii) reducing the SP/LSP amount for the employment period from the Effective
           Date from the existing entitlement of two-thirds of the monthly wage to half a
           month’s wage as compensation for each year of service; and

      (iii) providing time-limited government subsidy to phase in employers’
            responsibility for SP/LSP in the absence of the “offsetting” arrangement over a
            period of ten years from the Effective Date;

(i)   tasking the MPF Authority to explore the feasibility of developing a centralised
      electronic platform, eMPF, to streamline and standardise the operation of the MPF
      System with a view to further reducing fees; and

      Supporting elderly persons in investment management
(j)   exploring the feasibility of a public annuity scheme, Silver Bond of longer tenor, etc.
      to help elderly persons annuitise lump-sum assets into a steady stream of monthly
      income.

                                                                                                7
8
Chapter 1:
Poverty Alleviation —
Philosophy and Institutional Set-up

                                      9
Our Philosophy
Poverty alleviation is a priority policy area of the current-term Government. Our
philosophy in poverty alleviation originates from the 2012 Election Manifesto of the Chief
Executive (CE). Our philosophy is to encourage people capable of working to become self-
reliant through employment, while putting in place a reasonable and sustainable social
security and welfare system to help those who cannot provide for themselves. The CE
believes that poverty is not only a livelihood issue which concerns only the grassroots.
It also affects the social harmony and stability of Hong Kong, and is closely linked to
our long-term competitiveness and economic development. To alleviate poverty, the
Government has to promote balanced economic development with a view to enabling
different strata of society to share the fruits of development by taking part in economic
activities. At the same time, the Government has strived to enhance the safety net to
better protect those in need in society.
Reinstating the Commission on Poverty
1.2 To put our philosophy into practice, the Government needs a policy platform to
discuss poverty alleviation initiatives. With this platform, we can draw on collective wisdom
on a regular basis in understanding the forms and causes of poverty, identifying room for
improvement in the existing policies and deliberating on long-term policy directions. To
this end, the Government reinstated in December 2012 the Commission on Poverty (CoP),
which operates under a three-tier structure (see Figure 1.1):
Figure 1.1: Organisational structure of the Commission on Poverty
Commission on Poverty Summit
Deliberates on poverty alleviation strategies
Chaired by the CE
Commission on Poverty
Important policy platform
on poverty alleviation chaired by
the Chief Secretary for Administration
(with 20 non-official members from different sectors)
Community Care Fund Task Force Social Innovation and Entrepreneurship
Cares about the underprivileged Development Fund Task Force
Plugs gaps in the existing system Nurtures innovative ideas
Tackles social problems
Special Needs Groups Task Force Youth Education, Employment and
Promotes social inclusiveness Training Task Force
Facilitates self-reliance Creates platforms for development
Promotes upward mobility
(1) Commission on Poverty Summit: Chaired by the CE, the CoP Summit is held once
a year and attended by representatives from various sectors of society. The Summit
would provide an annual update of the poverty line analysis and report CoP’s work
progress. The CE, the Chief Secretary for Administration (CS) who chairs the CoP,
and CoP members would also exchange views with participants on various poverty
alleviation issues and took part in thematic discussions;
10Mr Leung Chun-ying, the Chief Executive,
chairing the Commission on Poverty Summit 2016 Mrs Carrie Lam, the Chief Secretary for Administration,
with participating students at the Commission on
Poverty Summit
The Commission on Poverty Summit
attracted a full-house attendance
Mrs Carrie Lam, the Chief Secretary for Administration,
and representatives of the four Task Forces under the
Commission on Poverty exchanging views with participants
Mr Leung Chun-ying, the Chief Executive, taking selfies
with ethnic minority participants at the Commission on
Poverty Summit
11(2) Commission on Poverty: Chaired by the CS, the CoP is a major platform for
deliberation on poverty alleviation policies, with particular emphasis on the
tripartite partnership among the community, the business sector and the
Government. It is composed of 20 non-official members from different sectors,
including the Legislative Council, trade unions, academia, business sector, and
welfare organisations, as well as four ex-officio members, namely the Secretary
for Labour and Welfare, Secretary for Education, Secretary for Food and Health
and Secretary for Home Affairs. Its broadly representative composition allows the
Government to take heed of public views and fosters consensus building during
policy formulation; and
(3) Task Forces under the CoP: There are four Task Forces under the CoP, namely the
Youth Education, Employment and Training Task Force, Special Needs Groups Task
Force, Community Care Fund Task Force and Social Innovation and Entrepreneurship
Development Fund Task Force, each of which has a specific area of focus and is
chaired by a non-official member. The CoP members are joined by 57 co-opted
members to deliberate fully on policies and measures concerning specific aspects
of poverty alleviation and to manage the two poverty alleviation-related funds.
1.3 The CoP operates on a “bottom-up” approach, under which members play a key
role in steering policy formulation. Proposals are knocked out by the Task Forces and then
put forward to the CoP for consideration before being implemented by the Government.
Chaired by the CS, the CoP is a high-level collaboration platform. Participation of the
relevant policy bureaux and government departments can facilitate cross-bureau and
cross-department collaboration in implementing new poverty alleviation policies. This is
conducive to maximising policy effectiveness.
Expenditure on Poverty Alleviation
1.4 The current-term Government is committed to taking poverty alleviation forward.
To address the needs of different groups in our society, we have introduced a series of
initiatives to tackle poverty and support the disadvantaged, including launching financial
assistance schemes such as the Old Age Living Allowance (OALA) Scheme and the Low-
income Working Family Allowance (LIFA) Scheme, facilitating the integration of ethnic
minorities into the community, promoting the employment of persons with disabilities,
and strengthening support services for students with special education needs (SEN).
Correspondingly, government spending on social welfare has increased significantly. Our
estimated recurrent expenditure on social welfare for 2016-17 is $66.2 billion, accounting for
19% of the total recurrent government expenditure of the year, second only to education.
Compared to the figure for 2012-13, it represents an increase of 55%, far exceeding
the increase of 32% in total recurrent government expenditure of the same period
(see Figure 1.2).
12Figure 1.2: Recurrent government expenditure on social welfare, 2012-13 - 2016-17
($ bn) (%)
80 Recurrent government expenditure on social welfare (LHS) 20
19.0
Share in recurrent government expenditure (RHS)
70 17.8 18.0 66.2
18
18.2
16.3 58.3
60
54.3 16
51.6
50
42.8
14
40
0 0
2012-13 2013-14 2014-15 2015-16 2016-17
Estimates
Source: Financial Services and the Treasury Bureau
Setting the Official Poverty Line
1.5 Setting an official poverty line was a priority task of the CoP. First announced in
September 2013, the poverty line provides an objective and evidence-based analysis
for the Government to understand the poverty situation, formulate poverty alleviation
policies and assess policy effectiveness. Providing a common basis for study of poverty
issues in Hong Kong, the poverty line has gradually gained wide acceptance by academia
and welfare organisations.
1.6 Adopting the concept of “relative poverty”, the poverty line is set at 50% of the
median monthly household income before policy intervention (i.e. before taxation and
welfare transfers) by household size. Households with incomes below the poverty line
are classified as poor while the household members concerned are counted as poor
people. This concept, widely adopted by developed regions, is not only comparable
to international and local practices but also consistent with our philosophy of enabling
different strata of society to share the fruits of economic development.
Limitations of the Poverty Line
1.7 There is no perfect way of setting the poverty line. The official poverty line has
its limitations, and one should bear this in mind in interpreting the related figures. As
the poverty line measures poverty based on household income only without considering
assets and liabilities, “income-poor, asset-rich” households would be classified as poor. The
poverty situation may be overstated as a result. Under the concept of “relative poverty”,
there will always be poor population before policy intervention. Even an economic upturn
with a broad-based and significant improvement in household income will not guarantee
a decrease in the size of the poor population. Moreover, the poverty line should not be
regarded as a “poverty alleviation line” because poverty alleviation measures should have
the dual policy functions of reducing and preventing poverty. Apart from supporting
the households that fall below the poverty line, we should also prevent those marginally
above the poverty line from falling into poverty. In fact, the income limits of many social
welfare programmes are above the thresholds of the poverty line in order to benefit more
people at grassroots level as far as resources permit.
13Group-specific Poverty Analyses
1.8 Based on the poverty line analysis,
we published a poverty situation report
on persons with disabilities in 2014
and another one on ethnic minorities
in 2015. These studies help us better
understand the poverty situation of
specific groups and facilitate relevant
Task Forces to follow up and formulate
targeted support measures. We also
published in 2016 a study on the earnings
mobility of post-secondary graduates
from grassroots families of different
cohorts. Furthermore, to supplement
the income-based poverty line analysis, we will soon publish an information paper
entitled Supplementary Poverty Line Analysis: Expenditure Patterns of Poor Households
in 2015. The supplementary analysis provides data on the expenditure patterns of poor
households based on the results of the 2014/15 Household Expenditure Survey conducted
by the Census and Statistics Department to further enrich the poverty line analysis.
1.9 The poverty data has also been used by scholars and research institutes in their
various studies, many of which are useful references for the CoP to further improve the
analytical framework of the poverty line. Adopting the methodologies of two university
professors, the CoP enriched the poverty line analysis in the Hong Kong Poverty Situation
Report 2015 published recently by analysing the poverty situation by the age of household
heads and decomposing the changes in the poverty rate into different factors.
Poverty Situation of Hong Kong in Recent Years
1.10 Poverty situation and economic development are inextricably linked. This can be
reflected by the changes in the poverty line over the past few years. In recent years, our
labour market has remained in a state of full employment amid steady economic growth.
Coupled with the introduction and subsequent upratings of the Statutory Minimum Wage
(SMW), there was substantial improvement in the earnings of grassroots workers. Along
with the rising trend of median household income, the poverty line thresholds based on
the concept of “relative poverty” have also gone up (see Figure 1.3).
14Figure 1.3: Poverty lines by household size, 2009-2015
($, per month)
22,000
20,000 19,500 6-person+
18,800
18,200 5-person
18,000 17,100 17,000
15,800 16,000 17,600 4-person
16,000 16,400
14,500 14,800
15,400
14,000 13,500 13,500
13,000 14,300
12,300 14,000 3-person
11,900 13,000 13,000
12,000 12,500
11,800
11,300 11,500
10,000 10,500
10,000 8,800 2-person
9,900 8,300 8,500
8,000 7,500 7,700
6,900 7,000
6,000
3,800 1-person
4,000 3,300 3,300 3,400 3,600 3,500 3,500
2,000
0
2009 2010 2011 2012 2013 2014 2015
Source: General Household Survey, Census and Statistics Department
Main Analysis of the Poverty Line
1.11 The poverty situation of Hong Kong has improved in recent years. According to
the poverty line analysis, after recurrent cash intervention (i.e. after taking into account
recurrent cash benefits such as Comprehensive Social Security Assistance (CSSA), OALA,
Disability Allowance (DA), School Textbook Assistance, etc.), Hong Kong’s poor population
stood at 0.97 million in 2015, which is below one million for the third consecutive year.
As compared to 2009, the size of the poor population after policy intervention shrank
by more than 70 000 persons. The poverty rate in 2015 was 14.3%, representing a drop
of 1.7 percentage points from 2009 and remaining at a low level of the past seven years
in record (see Figure 1.4).
1.12. Meanwhile, the overall CSSA caseload as at end-November 2016 had dropped for
68 consecutive months, and the numbers of unemployment cases and low-earnings cases
had fallen for 87 and 93 months in a row to 14 448 and 5 299, representing decreases
of 57.8% and 67.6% respectively. The drop in the number of CSSA cases alongside the
improvement in our economy (see Figure 1.5) demonstrates that most people will choose
to improve their living through employment when the economic conditions are favourable
and that self-reliance remains a core value of Hong Kong.
15Figure 1.4: Poor population and poverty rate after
recurrent cash benefits, 2009-2015
Poor population (’000)
1 600
1 348 1 322 1 312 1 336 1 325 1 345
(20.6%) 1 295
Pre-intervention 1 400 (20.1%) (19.6%) (19.6%) (19.9%) (19.6%) (19.7%)
1 200 1 043 1 031 1 005 1 018
Post-intervention (16.0%) (15.7%) 972 962 971
(recurrent cash) (15.2%) (15.2%) (14.5%) (14.3%)
1 000 (14.3%)
800
600
400
200
0
2009 2010 2011 2012 2013 2014 2015
Poor population (’000) 2009 2010 2011 2012 2013 2014 2015
Pre-intervention 541 536 530 541 555 555 570
Post-intervention (recurrent cash) 406 405 399 403 385 383 392
Note: ( ) Figures in parentheses denote the corresponding poverty rates
Source: General Household Survey, Census and Statistics Department
Figure 1.5: Overall CSSA caseload and numbers of
unemployment and low-earnings cases
Overall CSSA cases CSSA unemployment cases
CSSA low-earnings cases
350 000 100 000
Overall CSSA cases
300 000
80 000
250 000 266 571
237 658
60 000
200 000
150 000 40 000
CSSA unemployment cases
40 513
100 000
14 448 20 000
50 000
CSSA low-earnings cases 5 299
10 607
0 0
2002 2003 2004 2005 2006 2007 2008 2009 2010 2011 2012 2013 2014 2015 2016
Year end Nov
Source: Social Welfare Department
Supplementary Analysis of the Poverty Line
1.13 The main analytical framework of the poverty line reflects the poverty situation
before policy intervention, evaluates the effectiveness of the Government’s recurrent
cash measures in poverty alleviation and analyses the poverty situation of households
of different socio-economic characteristics after the recurrent cash interventions.
Supplementary analysis is conducted on a yearly basis to assess the effectiveness of
non-recurrent cash benefits and in-kind benefits in alleviating poverty (see Figures 1.6
and 1.7), so as to allow us to gain a more comprehensive understanding of the
effectiveness of our poverty alleviation policies as a whole. Non-recurrent cash benefits
16include mainly the one-off relief measures announced in the Budgets, such as a one-off
additional payment or allowance for CSSA and Social Security Allowance recipients. Of the
in-kind benefits, the provision of the means-tested public rental housing (PRH) is the most
important policy. Given that the welfare transfer of PRH is not an actual cash subsidy,
in line with international practice, we have adopted the concept of opportunity cost to
estimate the amount of PRH welfare transfer in the poverty line analysis. The concept is
that if a PRH unit were leased in a hypothetical open market, the difference between the
imputed market rent and the actual rent paid by the household would be the housing
benefit enjoyed by the household.
Figure 1.6: Poor population and poverty rate after
non-recurrent cash benefits, 2009-2015
Poor population (’000)
1 600
1 348 1 322 1 312 1 336 1 325 1 345
1 295
Pre-intervention 1 400 (20.6%) (20.1%) (19.6%) (19.6%) (19.9%) (19.6%) (19.7%)
Post-intervention 1 200 1 043 1 031 1 005 1 018
(16.0%) (15.7%) 972 962 971
(recurrent cash) (15.2%) (15.2%) (14.5%) (14.3%)
1 000 (14.3%)
[876 (13.2%)] [882 (13.2%)]
Post-intervention 800 937 910 892
(recurrent + (14.3%) 847 873
(13.8%) 805 (13.2%) (12.8%)
non-recurrent cash) 600 720 (12.0%)
(12.6%)
(10.9%)
400
200
0
2009 2010 2011 2012 2013 2014 2015
Poor households (’000) 2009 2010 2011 2012 2013 2014 2015
Pre-intervention 541 536 530 541 555 555 570
Post-intervention (recurrent cash) 406 405 399 403 385 383 392
Post-intervention 361 354 281[339] 312[341] 333 355 354
(recurrent + non-recurrent cash)
Note: ( ) Figures in parentheses denote the corresponding poverty rates
[ ] Figures in square brackets denote the corresponding poverty figures with the effect of “Scheme $6,000” excluded
As “Scheme $6,000” was covered in 2011 and 2012 only, there were no corresponding figures for other years
Source: General Household Survey, Census and Statistics Department
Figure 1.7: Poor population and poverty rate after
in-kind benefits, 2009-2015
Poor population (’000)
1 600
1 348 1 322 1 295 1 312 1 336 1 325 1 345
Pre-intervention 1 400 (20.6%) (20.1%) (19.6%) (19.6%) (19.9%) (19.6%) (19.7%)
1 200 1 043 1 031 1 005 1 018
(16.0%) (15.7%) 972 962 971
Post-intervention (15.2%) (15.2%) (14.5%) (14.3%) (14.3%)
(recurrent cash) 1 000
726 699 675
800 (11.1%) 674 656 648 669
(10.6%) (10.2%) (10.1%) (9.8%) (9.6%) (9.8%)
Post-intervention 600
(recurrent + in-kind)
400
200
0
2009 2010 2011 2012 2013 2014 2015
Poor households (’000) 2009 2010 2011 2012 2013 2014 2015
Pre-intervention 541 536 530 541 555 555 570
Post-intervention (recurrent cash) 406 405 399 403 385 383 392
Post-intervention 284 278 271 272 269 271 281
(recurrent + in-kind)
Note: ( ) Figures in parentheses denote the corresponding poverty rates
Source: General Household Survey, Census and Statistics Department
17Challenges on Poverty Alleviation arising from Population Ageing
1.14 An ageing population poses challenges to further improving the poverty figures in
the future. The poverty line analysis reflects that the poverty rate of elderly persons has
been consistently above those of other age groups (see Figure 1.8) despite its noticeable
improvement since the introduction of the OALA in 2013. This is due to the use of household
income as the sole indicator for poverty measurement. As most of the elderly persons
are retirees with no employment earnings, they would be classified as poor. A growing
proportion of the elderly population will therefore push up the poverty rate. Population
ageing may also affect the poverty figures through dwindling household size as elderly
persons are more often living alone or with their spouses only. Statistics indicate that the
numbers of 1- and 2-person households have been on the rise in recent years and their
poverty rates are markedly higher than those of the larger households (see Figure 1.9).
These two structural factors arising from population ageing have made it more difficult to
bring down the poverty figures in the future.
Figure 1.8: Poverty rates by age group (after policy intervention)
(%)
40
34.6 34.8 34.1
35 33.3
30.5 30.0 30.1
30 Elders aged 65+
25
19.9 19.3 19.5 19.9
20 18.6 18.2 18.0
Children aged1.15 With reference to the studies of Professor Paul Yip Siu-fai, we attempted to
decompose the changes in the poverty rate into different factors. Estimates indicate
that from 2009 to 2015, factors such as economic growth and the Government’s poverty
alleviation efforts could have reduced the poverty rate by 2.51 percentage points.
However, 0.80 percentage point of it was offset by the increase in elderly population and
the number of 1- to 2-person households. As a result, a drop of only 1.7 percentage points
was seen in the poverty rate during the same period (see Figure 1.10).
Figure1.10: Decomposition of changes in the poverty rate, 2009-2015
Post-recurrent cash intervention poverty rate in 2009 16.0%
Decomposition of changes in the poverty rate between 2009 and 2015
into the following three factors
1. Age structure
+ 0.51percent point
(Ageing → Overall poverty rate↑ )
2. Household size
+ 0.29percent point
(Smaller household size↑ → overall poverty rate↑)
3. Other factors including economic performance and the
- 2.51percent points
Government’s poverty alleviation efforts
Post-recurrent cash intervention poverty rate in 2015 14.3%
Source: Hong Kong Poverty Situation Report 2015
1.16 Looking ahead, population ageing is expected to accelerate. Changes in the
population age structure and the dwindling household size are expected to increase the
pressure for poverty figures to rise further. This, together with the lifting of the poverty
line thresholds as a result of rising wages, would entail looming difficulty for a continuous
decline in future poverty figures. Given limited public resources, future poverty alleviation
measures and resource allocation have to be more targeted in order to further improve the
poverty figures.
1920
Chapter 2:
Poverty Alleviation —
Progress Achieved

                        21
Role of the Government
Creating Job Opportunities through Economic Development
2.1 The Government is committed to enabling different strata of society to share
the fruits of prosperity by promoting balanced economic development and offering
diversified job opportunities. Hong Kong’s economy has grown steadily in recent years
and enjoyed an average annual growth rate of about 2.5% in real terms in 2012 to 2015.
With the unemployment rate staying at a low level of 3.3% to 3.4% over the past four years,
the overall labour market has been generally stable and is in a state of full employment.
Employment earnings in different segments show continuous improvements in real terms.
As compared with 2011, the average employment earnings of all full-time employees
(excluding foreign domestic helpers) in 2015 increased by 22.5% or 4.9% in real terms after
netting off inflation.
2.2 The SMW protects the interests of grassroots workers in Hong Kong. In our
regular review and adjustment of the SMW, we need to strike an appropriate balance
between the objectives of forestalling excessively low wages and minimising the loss
of low-paid jobs, while sustaining Hong Kong’s economic growth and competitiveness.
The introduction of the SMW in May 2011 and the two rounds of uprating in 2013 and
2015 have seen significant increase in the earnings of grassroots workers. Subject to
the approval of the Legislative Council, the revised SMW rate (i.e. $34.5 per hour) will
take effect in May 2017. As compared with 2011, the average employment earnings of
full-time employees in the lowest decile group (excluding foreign domestic helpers)
in 2015 increased by about 28.6% or 7.6% in real terms after netting off inflation. The
SMW, coupled with the steady economic development of Hong Kong, has encouraged
more people who can work to become self-reliant by entering or re-entering the
labour market.
Income Redistribution
2.3 The Government is also playing an active role in income redistribution. Through
different policy initiatives, social and Government resources are allocated to ensure that
different strata of society can share the fruits of economic development and those in
need are provided with the necessary support. By doing so, we are able to build a more
harmonious community and provide better protection for the grassroots.
Public rental housing
2.4 PRH is a heavily-subsidised poverty alleviation measure. At present, about one-third
of Hong Kong’s total population (i.e. over 2 million people) are living in PRH. Poor
PRH households, benefiting from the lower rents, have notably lower average share of
expenditure on housing, and can afford to spend a larger proportion of their financial
resources on non-housing expenditure items such as food and education than their
22counterparts living in private rental housing. This shows that the provision of PRH can help
relieve the financial burden of grassroots families and improve their living standards. The
poverty line analysis for 2015 also indicates that the provision of PRH reduced the poverty
rate by 3.9 percentage points (see Figure 2.1). It is clear that PRH is effective in alleviating
poverty.
Figure2.1: The notable effect of PRH provision in poverty alleviation
Population (’000) (Percentage point(s))
400 7
374
350 6
Reduction in poor population (LHS)
300 Reduction in poverty rate (RHS)
5.4 272 5
250
4
197
200 3.9
3
150 2.8
118
2
100
69
1.7 1
50
1.0 18 23
0.2 0.3 3@
0 0
CSSA OALA Education OAA DA Work All recurrent PRH
benefits Incentive cash provision
Transport Subsidy benefits
CSSA OALA Education OAA DA WITS All recurrent PRH
benefits cash benefits provision
Reduction in
poor households (’000) 108 54 18 9 8 1 177 102
Note: (@) Less than 0.05 percentage point
Source: General Household Survey, Census and Statistics Department
2.5 To address the housing needs of the grassroots, the Government has been striving
to allocate more resources to increase PRH supply, and has formulated and implemented
the Long Term Housing Strategy. According to the estimation as at the end of September
2016, over 70 000 PRH units will be produced in the coming five years (2016-17 to 2020-21).
Nonetheless, the current average waiting time1 of general PRH applicants (i.e. family and
elderly one-person applicants) is more than four years. As it takes time to identify land
for housing development and the progress of individual projects is often affected by
factors outside our control, it is unlikely that the deep-seated problem of supply-demand
imbalance can be resolved in the near future. Coupled with the increasing new demand
for PRH, it will be impossible for the Government to fully meet the public’s PRH demand in
the short run. The Government will continue its efforts to increase PRH supply. Meanwhile,
we will actively consider rolling out appropriate measures to help improve the quality of
life of the households in need in the short or medium term.
1
Waiting time refers to the time taken between registration for PRH application and the first flat offer, excluding any frozen period
during the application period (e.g. when the applicant has not yet fulfilled the residence requirements; the applicant has requested
to put his/her application on hold pending arrival of family members for family reunion; the applicant is imprisoned, etc.).
The average waiting time for general applicants refers to the average of the waiting time of those general applicants who were
housed to PRH in the past 12 months.
23Social security
2.6 The current-term Government’s philosophy on poverty alleviation is to promote
economic development and encourage employment while striving to improve the social
security system so as to offer those who cannot provide for themselves appropriate
support and a safety net as the last resort (see Figure 2.2).
Figure 2.2: Government expenditures on social security schemes
Estimates for 2016-17 Number of recipients as at
Scheme
($ Billion)# end-November 2016
CSSA 22.51 350 000
OALA 14.61 442 000
Old Age
3.75 235 000
Allowance (OAA)*
DA 3.68 141 000
Note: * The Government has also implemented the Guangdong Scheme to provide OAA to eligible Hong Kong elderly persons who
choose to reside in Guangdong. The estimated expenditure for 2016-17 is $290 million. The number of recipients was
around 15 000 as at end-November 2016
# Figures include the amount spent on one-off relief measures
Source: Social Welfare Department
Education
2.7 We provide 12 years of free education to all school-age children in Hong Kong
irrespective of their family backgrounds and household incomes. In the 2017/18 academic
year, the Free Quality Kindergarten Education Scheme will be implemented to extend the
duration of free education to 15 years. In addition, education grants, including School
Textbook Assistance, Student Travel Subsidy and Subsidy for Internet Access Charges, are
provided for students in financial need to meet their various learning needs.
Healthcare
2.8 The services provided by our public healthcare system are heavily subsidised
(overall subsidisation rate is as high as 93%) and serve as a public health safety net for
Hong Kong people. To ensure that no one will be denied adequate healthcare due to lack
of means, the Hospital Authority (HA) has put in place a medical fee waiver mechanism
to provide assistance for patients who meet the assessment criteria and cannot afford
the public healthcare service charges owing to financial difficulties. In addition, all CSSA
recipients are waived from payment of public healthcare services.
Elderly Poverty
Poverty Situation of Elderly Persons
2.9 According to the poverty line analysis, about 0.31 million elderly persons aged 65
or above were defined as poor in 2015, representing a poverty rate of 30.1%, about double
of the overall poverty rate. Our social security system currently covers over 80% of poor
24elderly persons (see Figure 2.3),
Figure2.3: Coverage of various
providing them with some form of social security schemes
support for their living.
2.10 Nevertheless, we are aware
that some elderly persons have yet CSSA
to be adequately cared for under 43 600
the current retirement protection 14.1% OAA
77 900
system. To address the issue, the 25.2%
Government commissioned the Without CSSA
and SSA
CoP to carry out the 6-month 60 200
“Retirement Protection Forging 19.5%
Ahead” public engagement
exercise which ended in June last OALA
DA
119 000
year. After analysing the views 7 800
38.6%
2.5%
collected during the consultation
period, we have formulated the
policy direction for the future
development of retirement Number of elderly persons : 308 500
protection. Details can be found
Note: Poor elderly persons after recurrent cash policy intervention
in Chapter 3. Source: General Household Survey, Census and Statistics Department
Working Poor
Situation of the Working Poor
2.11 Despite the steady development of Hong Kong’s economy and labour market in
recent years and the protection offered by the SMW, not all poor people can be lifted out
of poverty through employment. In 2015, there were more than 0.13 million of non-CSSA
working poor households (involving nearly 0.45 million people) (see Figure 2.4). Despite
a slight decline in recent years, the number of these households was still substantial. This
indicates that the problem of the working poor remains unresolved and targeted policy
support is needed.
Figure 2.4: Poverty data on non-CSSA working households, 2009-2015
Poverty
2009 2010 2011 2012 2013 2014 2015
statistics
Number of
146 100 140 500 133 600 143 500 140 800 136 200 132 700
households
Population 495 800 480 600 462 700 493 200 469 700 459 100 447 800
Poverty rate
8.9 8.6 8.2 8.6 8.1 7.9 7.7
(%)
Note: Based on poverty statistics after recurrent cash intervention
Source: General Household Survey, Census and Statistics Department
25Characteristics of Non-CSSA Working Poor Households
2.12 To provide effective support for the working poor households, we need to gain a
more comprehensive understanding of their poverty situation. Figure 2.5 shows that over
80% of working poor households were large families with three members or more, and
over half of the families had children to take care of. Moreover, more than 80% of these
households had only one working member, leading to a high dependency ratio (each
working member supporting 1.8 family members on average). Of these working poor
households, many were new-arrivals, single-parent and ethnic minority households. Given
their relatively low educational attainment and skills levels, the working members of these
households were usually engaged in elementary-level jobs. Given their heavy family burden,
the Government needs to provide these households with targeted support in order to
alleviate their poverty situation and reduce the risk of inter-generational poverty.
Figure 2.5: Selected socio-economic characteristics of non-CSSA working poor households, 2015
Non-CSSA working poor households (132 700) Overall poor households (392 400) Overall households (2 465 200)
100
Household characteristics Characteristics of working members
90 86.5 86.7
82.5 80.3
80
70 65.4 63.4
60 58.5
54.4 55.3
50 44.7 45.0
41.1
40
30.8 28.9
30 27.4 29.5
23.8
20
9.7
10
0
3-person+ With-children Educational attainment at Lower-skilled Part-time / Working 144 hours
lower secondary or below underemployed or above per month
Proportion of households / working members with respective socio-economic characteristics in total number
of corresponding households / working members (%)
Note: ( ) Figures in parentheses denote the corresponding number of households
Poverty statistics refer to statistics after recurrent cash intervention
Source: General Household Survey, Census and Statistics Department
Low-income Working Family Allowance
2.13 With reference to the poverty line analysis, the Government launched the
LIFA Scheme in May 2016. Under the Scheme, the amount of the allowance is tied to
applicants’ working hours and monthly family income (see Figure 2.6). LIFA aims to
provide financial assistance to these self-reliant low-income families and to encourage
them to stay in active employment. It is designed with the dual functions of alleviating
and preventing poverty. To reduce the risk of inter-generational poverty, eligible families
with school children will receive an additional allowance. Since its implementation
in May 2016, over 32 000 applications from over 28 000 families has been approved,
26benefiting more than 0.1 million people. Having regard to the policy objectives of
the Scheme and comments from the public and concern groups, we abolished the
absence rule in December 2016. The Labour and Welfare Bureau (LWB) will conduct
a comprehensive policy review in mid-2017 to further improve the Scheme.
Figure 2.6: Amounts of allowances and working hour requirements of LIFA
Monthly Working Hours Monthly Basic Allowance Monthly Child Allowance
(Hours) for Each Family for Each Child
144 to less than 192 Full-rate Basic Allowance:
(non-single-parent families) $600
36 to less than 72 Half-rate Basic Allowance: Full-rate Child Allowance:
(single-parent families) $300 $800
192 or more Full-rate Higher Allowance:
(non-single-parent families) $1,000 Half-rate Child Allowance:
$400
72 or more Half-rate Higher Allowance:
(single-parent families) $500
Upward Mobility of Young People from
Underprivileged Background
Young People from Underprivileged Background in need of Educational
Resources from the Government
2.14 Family resources are vital for the education and future development of our next
generation. However, the 2015 data indicate that there were 0.18 million children under the
age of 18 living in poor households, representing a poverty rate of 18.0%. The above data
also show that a significant number of children were living in working poor households.
Parents of these households, though being self-reliant, are not able to lift their families
out of poverty nor afford to give their children access to extracurricular activities or other
personal development opportunities. Apart from allocating additional resources to the
children in eligible working poor households through the LIFA Scheme to enable them to
better equip themselves, the Government is also actively implementing various projects
to give these children a fair chance to climb up the social ladder.
Current Situation of Upward Mobility of Young People from
Grassroots Families
2.15 In May 2016, the Youth Education, Employment and Training Task Force under the
CoP published the findings of a study on the earnings mobility of post-secondary graduates
from grassroots families, focusing on the comparison of changes in earnings of post-
secondary graduates from the 2001/02 and 2006/07 cohorts after they entered the labour
market. The findings show that post-secondary graduates of different qualifications from
the 2006/07 cohort had lower upward earnings mobility than the 2001/02 cohort, which
is in line with the general impression of the public. Among the first degree graduates,
89% of the 2001/02 cohort moved upwards within five years, whereas the corresponding
27proportion for the 2006/07 cohort was 81%. The statistics also show that, among the first
degree graduates from the 2006/07 cohort, those from families of lower income had lower
upward earnings mobility. CoP members expressed their concern when they examined the
findings and made several recommendations on promoting the upward mobility of young
people. One of the recommendations is to use a more targeted approach in providing
students from needy families with grants to ensure that they have equal access to post-
secondary education and have the chances to achieve upward mobility.
Government Promoting the Whole-person Development of Young People
from Underprivileged Background
2.16 In recent years, society considers that providing a level-playing field for all young
people involves multiple efforts. Apart from ensuring that no young people would be
denied access to quality education owing to lack of resources, society generally considers
that all young people, regardless of their backgrounds, should enjoy equal opportunities
to explore the world, develop their interests and fully realise their potential. The current-
term Government has developed a platform for the community, the business sector,
the Government and the academia to collaborate and provide more comprehensive
learning support for young people from
underprivileged background. The Partnership
Fund for the Disadvantaged is one of
these initiatives. To encourage organisations
in the community to launch more after-
school learning and support programmes
for primary and secondary students from
grassroots families, the Fund has set aside a
dedicated portion of $200 million to provide
matching grants for the resources devoted
by the business sector. These programmes
provide academic support, as well as training
on social skills and confidence-building, and
equip students from grassroots families with
knowledge about workplace, so as to facilitate
their whole-person development. Besides, the
Child Development Fund, the “Future Stars”
Programme and the “Life Buddies” Scheme,
all encompass an element of mentorship,
enable participants from the community and
the business sector to establish a friendly
relationship with young people or provide
them with opportunities to gain workspace The “Future Stars” Programme and the “Life Buddies” Scheme
exposure. All these can help young people helping young people from underprivileged background
broaden their horizons
broaden their horizons and develop a clearer
understanding of their own life goals.
28Support for the Disadvantaged
2.17 The current-term Government has implemented a number of policies and initiatives
to provide targeted support to meet the specific needs of different underprivileged groups.
We also conducted thematic studies on the poverty situation of ethnic minorities and
persons with disabilities respectively in order to better understand their daily problems
and facilitate the integration of possible solutions.
Ethnic Minorities
Facilitating ethnic minorities to learn Chinese
2.18 According to the statistics from the 2011 Population Census, there were
over 60 000 South Asian ethnic minorities who called Hong Kong home, and their poverty
rate was as high as 22.6%. Employment and education are the most effective means for
them to integrate into mainstream society. Learning Chinese is of particular importance
for them to adapt to Hong Kong’s way of life. Starting from the 2014/15 school year, the
Education Bureau (EDB) has implemented the Chinese Language Curriculum Second
Language Learning Framework (Learning Framework). In tandem, an annual provision
of $200 million has been provided for schools to help non-Chinese speaking (NCS)
students overcome the difficulties of learning Chinese as a second language and create
an inclusive learning environment in schools. The objective is to support NCS students to
learn Chinese systematically with a view to enabling them to bridge over to mainstream
Chinese Language classes as soon as possible to learn Chinese together with their Chinese-
speaking counterparts, hence achieving social inclusion. According to the findings in the
2015/16 school year, the Learning Framework helped NCS students improve their Chinese
proficiency. On writing, the performance of NCS students with relatively higher ability was
comparable with that of their Chinese-speaking counterparts of the corresponding grade,
while their performance in reading slightly lagged behind. Besides, we have implemented
at the senior secondary levels Applied Learning Chinese (for Non-Chinese Speaking
Students) (ApL(C)) courses, which are pegged at the Qualifications Framework Levels 1
to 3, to provide NCS students with an additional channel to acquire an alternative Chinese
Language qualification other than the Hong Kong Diploma of Secondary Education
(Chinese Language) Examination.
The Special Needs Groups Task Force under the Commission on
Poverty chatting with ethnic minority students to understand first-
hand their difficulties in learning Chinese
29Employment support for
ethnic minorities
2.19 The current-term Government leads
by example in promoting the employment
of ethnic minorities. In respect of civil
service recruitment, some departments
have suitably adjusted the recruitment
selection process having regard to the
job requirements in terms of Chinese
proficiency. For example, over 20 civil
service grades have lowered the Chinese
Language Proficiency Requirements and Two police officers of non-ethnic Chinese origins
some grades have replaced the written
test in Chinese with a group interview. The Fire Services Department also made
adjustments to their policy in 2015, by making available recruitment aptitude tests,
examinations taken during training of new recruits and training notes in both Chinese
and English, so as to facilitate more non-ethnic Chinese to access job opportunities
in the Department and provision of effective training after appointment. The Police
Force and the Correctional Services Department (CSD), have actively tapped into non-
ethnic Chinese job applicants in recent years. The success rates of non-ethnic Chinese
applying for the posts of Police Constable and Assistant Officer II of the CSD are 18.8%
and 5.6% respectively, higher than those of other applicants. By tapping the talent pool
of ethnic minorities, we hope to enhance the diversity of our civil service workforce to
provide quality public services for people of different backgrounds. At the same time,
the Labour Department (LD) has been providing various dedicated employment support
services that cater to the needs of ethnic minority job seekers through its job centres
and job fairs.
Promoting the use of public services among ethnic minorities
2.20 To better understand the levels of awareness and satisfaction of ethnic minorities
of our key public services, we have commissioned a think tank to conduct a thematic study
to review the existing public services provided especially for ethnic minorities and make
specific recommendations to ensure that ethnic minorities are given equal access to public
services. The services covered by the study include employment support services of the
LD, training services of the Employees Retraining Board, family and youth services of the
Social Welfare Department (SWD), and integration, interpretation and translation services
of the Home Affairs Department. The study is expected to be completed in mid-2017.
Persons with Disabilities
Policy objective to support persons with disabilities
2.21 According to the statistics for 2013, the poverty rate of persons with disabilities in
Hong Kong was 29.5%, representing a poor population of about 0.15 million people. It is
our policy objective to provide persons with disabilities with training and support services
in order to enable them to realise their potential and utilise their own capabilities in suitable
jobs. This can help them achieve self-reliance, gain self-confidence and integrate into the
30community. The Government launched the Talent-Wise Employment Charter at the CoP
Summit 2013, with an aim to foster social integration through encouraging government
departments, the business sector, public bodies, and subvented and non-governmental
organisations (NGOs) to adopt measures to promote the employment of persons with
disabilities. So far, over 520 organisations have participated in the Charter.
Promoting the employment of persons with disabilities
2.22 To promote the employment of persons with disabilities and strengthen support for
their carers, the current-term Government rolled out three pilot schemes in one go through
the Community Care Fund (CCF) in 2016. The three pilot schemes respectively raises the
maximum level of disregarded earnings for CSSA recipients with disabilities; provides an
additional monthly subsidy of $5,000 for Higher DA recipients in paid employment to hire
carers; and offers a monthly living allowance of $2,000 to low-income carers of persons
with disabilities.
2.23 To strengthen employment support for job seekers with disabilities, the LD launched
a two-year pilot scheme in September 2016 to engage a non-governmental welfare
organisation to offer professional psychological and emotional counselling service for job
seekers with disabilities in need. The service aims to alleviate the emotional problems of
job-seekers with disabilities arising from the state of their disabilities, or personal or family
issues, so as to help them concentrate on job search and settle down in their new jobs,
thereby realising their potential in employment.
2.24 The Civil Service Bureau launched a pilot scheme in 2016, arranging 20
undergraduate students with disabilities and 23 students from the Shine Skills Centres of
the Vocational Training Council to work as interns in different government departments.
The scheme offered them the opportunities to gain hands-on work experience and learn
how to get along and co-operate with their colleagues, so as to get prepared for entering
the job market in the future. The scheme also gave civil service colleagues the opportunity
to gain a better understanding of the potential of students with disabilities. In view of
the positive feedback on the pilot scheme, we plan to continue to offer students with
disabilities internship opportunities in government departments in 2017.
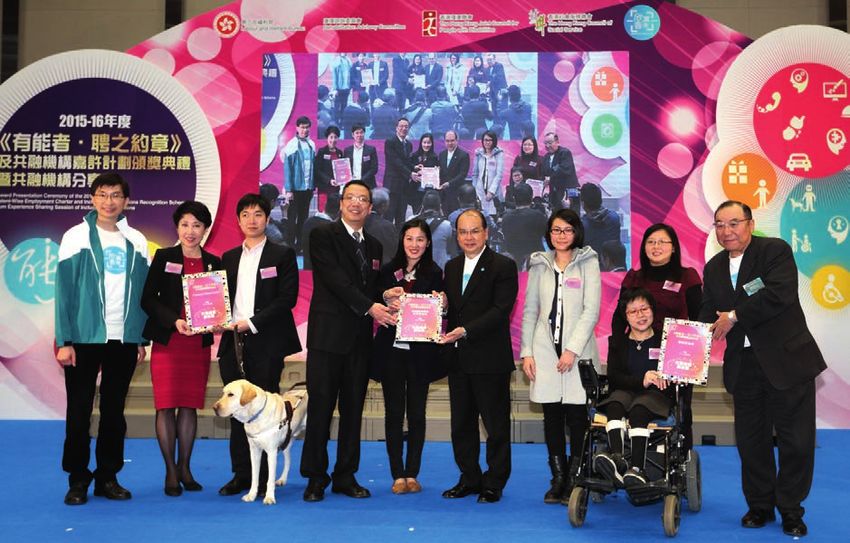
Mr Matthew Cheung Kin-chung,
Secretary for Labour and Welfare,
Award presentation ceremony of the 2015-16 Talent-Wise Employment and an undergraduate student
Charter and Inclusive Organisations Recognition Scheme participating in the internship
scheme of the government
31Review of the Disability Allowance
2.25 The inter-departmental working group co-ordinated by the LWB completed the
review of the DA in 2016, and improvement measures are being implemented progressively.
These include improving the medical assessment mechanism for the DA; keeping in view
the implementation of the World Health Organization’s updates of the International
Classification of Functioning, Disability and Health in neighbouring places with a view
to exploring how to devise a set of comprehensive and widely accepted definitions of
disabilities and the levels of disabilities in Hong Kong; and launching the pilot schemes to
support the employment of persons with disabilities through the CCF and NGOs.
Children with Special Needs
Pilot Scheme on On-site Pre-school Rehabilitation Service
2.26 Providing rehabilitation services for children with special needs in a timely manner
within the critical treatment period can give these children a greater chance of integrating
into the mainstream education in the future. Through the early intervention programmes
co-ordinated by the SWD, subvented pre-school training places are provided for children
with special needs from birth to the age of six. However, the shortage of subvented places
has been a long-standing problem. As at October 2016, over 7 000 children were on the
waiting list for the services and the average waiting time in 2015-16 was 12.3 to 18.8 months.
To ensure children with special needs will have timely access to intervention services
during the critical treatment period, the current-term Government allocated $422 million
from the Lotteries Fund to roll out in phases from November 2015 to January 2016 a two-
year Pilot Scheme on On-site Pre-school Rehabilitation Services. Under the Pilot Scheme,
around 3 000 training places were provided for children with special needs by inter-
disciplinary teams co-ordinated by NGOs. The Government has also earmarked a recurrent
provision of $460 million to continue and extend the service at the end of the two-year pilot
scheme. Upon regularisation of the Pilot Scheme, the number of service places will increase
to 7 000 in phases, significantly reducing the waiting time for the subvented services.
The Pilot Scheme on On-site Pre-school Rehabilitation Service provides timely training and support to
children with special needs
32You can also read