Cruises and Recreational Boating in the Mediterranean - Alberto Cappato, Secretary General of the IIC Istituto Internazionale delle ...
←
→
Page content transcription
If your browser does not render page correctly, please read the page content below
Cruises and Recreational Boating
in the Mediterranean

Alberto Cappato, Secretary General of the IIC (Istituto Internazionale delle Comunicazioni, Genoa - Italy)
Final Draft

Plan Bleu                                                                                                    Sophia Antipolis
UNEP/MAP Regional Activity Centre                                                                            March 2011
Authors
This study is the fruit of work carried out by a team within the IIC over the second semester of 2010, under the
scientific oversight of Alberto Cappato, Secretary General of the IIC.
The following work in particular can be attributed to:
Alberto Cappato, paragraphs: 1.1, 1.2, 1.3, 1.4, 1.7, 2.1, 2.2, 2.3, 2.4, 2.5, 2.6, 2.7 (with the support of Lorenzo
Pollicardo) 2.8, 2.9, 2.13 as well as sections 3 and 4.
Sara Canevello, paragraphs: 1.5, 1.6, 2.10, 2.11 and 2.12.
Bianca Baggiani, paragraphs: 2.11 and 2.13.

Reading committee
Fabio Capocaccia, President of the IIC, former president of Med Cruise and Secretary General of the Genoa Port
Authority.
Lorenzo Pollicardo, international expert in the recreational boating industry.
Alexandra Bracco, IIC collaborator.

Acknowledgements
Bianca Baggiani and Sara Canevello for drafting the graphs and editing the tables; European Odyssea Group for
information on the Odyssea project.
Union of Marinas – Provence Alpes Côte d’Azur (UPACA - Union des Ports de Plaisance de Provence-Alpes-Côte
d'Azur) for information on the “Clean Ports” initiative.

Realization
Layout: Sandra Dulbecco

The study is financed under the FEMIP Trust Fund. This Fund, which was established in 2004 and has been financed – to date – by
15 EU member States and the European Commission, is intended to support the development of the private sector via the
financing of studies and technical assistance measures and the provision of private equity.

This study also benefited from the support of:

The analysis and conclusion expressed in this report do not necessarily reflect the view of the European Investment Bank the
l’Agencia Española de Cooperación para el Desarrollo or the Agence Française de Développement
Contents

List of acronyms                                                                                                                          5

I. The cruise market                                                                                                                      6
  1. Context on a global level ....................................................................................................... 6
  2. The European market ........................................................................................................... 9
  3. Industry performance .......................................................................................................... 10
  4. Economic impact of the industry ............................................................................................ 14
  5. Mediterranean cruise itineraries ............................................................................................. 18
  6. Port infrastructures............................................................................................................. 23
  7. Differences between Northern and Southern Mediterranean ports ................................................... 23

II. The recreational boating market                                                                                                     26
  1. Context on a global level ...................................................................................................... 26
  2. Change in the global boat fleet ............................................................................................... 28
  3. Super yachts segment .......................................................................................................... 30
  4. Super yacht manufacturing ................................................................................................... 32
  5. Refit & repair: a booming sub-sector ........................................................................................ 36
  6. Super yacht chartering ......................................................................................................... 38
  7. Charter destinations ........................................................................................................... 39
  8. The rest of the recreational boat fleet in the Mediterranean .......................................................... 41
  9. Economic and social impacts .................................................................................................. 41
  10. Recreational boating infrastructures ...................................................................................... 42
  11. The situation of marinas in the Mediterranean (updated from IIC 2008 study).................................... 44
  12. Detail of services in Mediterranean marinas ............................................................................. 46
  13. Dry storage facilities: carefully growing phenomenon in the Mediterranean ...................................... 50

III. Environmental impacts                                                                                                              52
  1. Sea and ocean waste ........................................................................................................... 52
  1.1. The European context ......................................................................................................... 52
  1.2. Location of macro-waste.................................................................................................... 53
  1.3. Focus on the cruise industry ................................................................................................. 54
  1.4. Focus on the recreational boating industry ................................................................................ 55
  2. Legislative aspects and other environmental impacts ................................................................... 56
  2.1. Air pollution .................................................................................................................... 57
  2.2. Assessment of greenhouse gas emissions ................................................................................... 58
  2.3. Ballast water ................................................................................................................... 58
  2.4. Anti-fouling paint .............................................................................................................. 58

IV. The cruise market in 2050, possible scenarios                                                                                       59
  1. Basic considerations ......................................................................................................... 59
  2. The three scenarios ............................................................................................................ 60
  3. Opportunities and threats .................................................................................................. 61
  Conclusions ......................................................................................................................... 62

                                                                                                                                          3
V. Appendices                                                                                                                            63
    1. Clean Ports ....................................................................................................................... 63
    1.1. Summary description .......................................................................................................... 63
    1.2. National recognition of “Clean Ports” ...................................................................................... 64
    2. Proposal for eco-friendly actions for recreational boaters (owners and renters) .................................. 64
    3. Odyssea ........................................................................................................................... 65
    3.1. Perpignan Declaration of 26 February 2010 ................................................................................ 65

VI. Sources                                                                                                                              69

VII. Table of illustrations                                                                                                              73

4
List of acronyms
APER - Association pour la Plaisance Eco-Responsable – Association for eco-responsible recreational boating
CENSIS - Centro Studi Investimenti Sociali – Italian social research centre
CLIA - Cruise Line International Association
CNI - Camper & Nicolson Super Yachting Index – Camper Nicolson International
ECC - European Cruise Council
EPA - Environmental Protection Agency (EPA) - USEPA (United States Environmental Protection
Agency)
ICOMIA - International Council of Marine Industry Association
IMF - International Monetary Fund
IMO - International Maritime Organisation
ISPS Code - International Ship and Port Facilities Security Code
MARPOL - MARitime POLlution
MIA - Marine Industry Associations
MSC (Cruises) - Mediterranean Shipping Company Cruises MSC
PSA - Passenger Shipping Association
UNFPA - United Nations Population Fund
UNWTO - United Nations World Tourism Organization / WTO

                                                                                                              5
I. The cruise market

1. Context on a global level
The cruise industry has been growing steadily worldwide for nearly 30 years. Over the last fifteen years, the
pace has been particularly sustained from strong demand in North America for cruises to Central America
(mainly the Caribbean). More recently, there has been a strong increase in the number of European cruise
passengers, with numbers growing five-fold between 1995 and 2009. At the same time, other markets have
been developed by cruise lines in an attempt to extend the cruise season, explore new markets, or transfer
ships that have become unsuitable for the more developed markets. For instance, China and South America
are among the most popular new destinations.
In 2008, the financial crisis had a significant impact on the number of passengers and particularly those
from North America. This drop in performance was offset in 2009 with numbers reaching almost the same
as those in 2007. Cruising therefore still attracts North American clients who increasingly prefer cruises over
other types of traditional tourism.
Just like with other geopolitical events1, the cruise market was very responsive and recorded 8% growth
between 2008 and 2009 (compared to +2.07 % in 2007 - 2008). However, European passenger numbers
have yet to be affected by the crisis as annual growth has been estimated at approximately 10% since 2005
(+12.1% from 2008 to 2009).

                                            Table 1 – Change in the number of cruise passengers in millions

              Region                      1995         1996      2000      2001      2002     2003          2004          2005     2006      2007      2008      2009

North America                              4.35         4.61      6.88      6.91      7.70       8.23            9.14      9.96     10.38    10.45       10.29   10.40
Europe                                     1.00         1.20      2.06      2.14      2.39       2.76            2.87      3.19       3.48    4.05        4.46     5.0
Other                                      0.37         0.44      0.78      0.87      0.97       1.05            1.13      1.21       1.29    1.37        1.45     2.1
TOTAL                                      5.72         6.25      9.72      9.92     11.06     12.04            13.14     14.36     15.15    15.87       16.20   17.51
% Europe                                   17.5         19.0      21.0      21.5      21.5       23.0            22.0      22.2       23.0    22.8        27.5    28.6
Source: G.P. Wild & ECC; 2006-2010

Growth for the European market has remained steady since 1995 along with the market for “other” regions
of the globe, which has practically doubled over the same period.
                                                 Figure 1 – Geographical distribution of cruise passengers (%)
               100%
                         6,5        7,0          8,0       8,8      8,8       8,7      8,6    8,4        8,5        8,6     9,0
                                                                                                                                    12,0
                90%

                80%

                70%

                60%                                                                                                65,9     63,5    59,4
                                    73,8      70,8        69,7      69,6      68,4    69,6    69,4       68,5
                         76,1

                50%                                                                                                                            Others
                                                                                                                                               North America
                                                                                                                                               Europe
                40%

                30%

                20%

                                                                                                                            27,5    28,6
                                                                              22,9                       23,0      25,5
                                              21,2        21,6      21,6              21,8    22,2
                10%      17,5       19,2

                 0%
                        1995    1996         2000        2001      2002      2003    2004    2005       2006      2007     2008    2009
                Source: IIC, 2010

1   Terrorist attacks of 11 September 2001.

6
The impacts of the financial crisis seem to have reached their peak in North America in 2008, with results
for 2010 being quite positive. However, a global analysis of data for the tourism market worldwide shows
that the effects of the crisis were more pronounced in 2009. The numbers speak for themselves: the
industry recorded a more than 4% drop for the 2008-2009 period.
                   Figure 2 – Change in world tourism for 1995-2009 period (tourism in general in millions)

                 Source: Based on WTO data; IIC, 2010

Although the cruise industry still only represents 2 to 4% of the total tourism market, it has shown that
even in difficult times, its specific characteristics have enabled steady growth since 1995 and potential for
further development. This occurs to the detriment of other forms of traditional tourism, though still to a
moderate degree. This also underlines the distinctive character of this type of tourism and its new appeal for
a client base that now also includes, among others, families with children.
                                    Figure 3 – Weight of cruise tourism on overall world tourism
          1000
                                                                                                                                                     919,0
                                                                                                                                             898,0
                                                                                                                                                             880,0
           900                                                                                                                       842,0
                                                                                                                        806,8
                                                                                                           765,1
           800

                                                                          686,7      707,0       694,6
                                                              687,0
           700                                      639,6
                                          616,7
                                  598,6
                          575,0
           600    540,6

           500

           400

           300

           200

           100
                                                                                     11,05       12,04      13,13      14,36         15,15   15,87   16,2    17,5
                   5,72   6,26    6,87     9,7       8,7      9,72        9,91
             0
                   1995   1996    1997    1998      1999       2000       2001        2002       2003       2004        2005         2006    2007    2008    2009

                                            Passagers de croisières internationales (million)   Touristes internationaux (million)

           Source: Based on WTO data; IIC, 2010

Even though the effects of the crisis did not have a major impact on the cruise industry, it did affect the
supply. This impact was especially measured in 2009 with a drop or delay in investments in the shipbuilding

                                                                                                                                                                     7
sector. This has affected shipyards having to cope with the negative effects on the economies of ship
producing countries (mainly Italy, Germany, Norway and France) and jobs in the sector.
Several reasons can explain the continued demand for cruise tourism:
• Cruise lines commissioned increasingly large ships to create greater economies of scale, combined with
  aggressive pricing policies that compete strongly with other tourism products and holidays;
• It has been a winning concept for years from a commercial and marketing standpoint with all-inclusive
  (or almost all-inclusive) packages and destinations with strong appeal;
• With a simple package, passengers can spend on average between six and ten days on a cruise ship that
  changes destination each night and allows them to visit 5 to 8 destinations, often in different countries
  with rich histories and cultures (particularly in the Mediterranean).
Up until and including in 2010, the offer for cruising increased by number of nights by extending the cruise
season, which now covers almost the entire year in the Mediterranean, along with the steady increase in the
number of ships in service. In 2010, twelve new cruise ships were commissioned, which increased supply by
13.5% from the previous year. With the cruise market being driven up until now by supply, the CLIA
(Cruise Line International Association) anticipated 18 million cruise passengers worldwide in 2010, i.e. 2.8%
more than in 2009. The outlook for the industry should see the same growth until at least 2012/2013.
Though the market is driven by supply, ship constructions already underway should result in an increase in
the number of potential passengers worldwide. It may be difficult to come up with reliable forecasts, but it
should be noted that order books are not as full as they used to be and it will stay that way until 2014.
During periods of crisis, especially financial crisis, cruise lines are very vigilant and cautious, meaning that
new construction projects are put on hold or cancelled.
The main sub-sector affected by economic instability therefore appears to be the shipbuilding sector.
Orders have been placed for the construction of eight new ships for 2011, seven for 2012, two for 2013 and
one for 2014. This major decline will certainly have repercussions on the growth rate of passenger numbers
but most importantly, it will have considerable and serious repercussions on employment and the
economies of ship-producing countries. Some shipyards are already announcing difficulties and are reducing
their direct and indirect staff (the latter making up the majority), and changing their purchasing strategies on
the construction market2.
The order books up to 2014 also reveal that the demand for huge ships is still a trend, although a larger
segment of the market is beginning to evolve with a return to construction of smaller ships. This can be
explained by the fact that cruising has become a mass trend and wealthier passengers seek more exclusive and
unique products in terms of itineraries and services aboard. Another factor is the still limited ability of ports to
accommodate large ships.
In any case, the industry remains very concentrated with just a few major groups commanding 80% of the
market (Carnival Corporation, Royal Caribbean, Genting Hong Kong3).
The table below details the order books up to 2014, indicating the cruise line, tonnage, number of passengers,
delivery date, construction costs and shipyards (note that the last two ships delivered in 2010 are not included).
The largest cruise ship ever built was delivered in 2010 to the Royal Caribbean International cruise line. It is
362 metres long, 72 metres high, with 9.4 metre draught, 225,282 gross tonnage, 5,400 passengers and
2,700 cabins (+2,165 crew members), and sister ship of “Oasis of the Sea”, which has been in service since
2009.

2   Quite recently, a large Italian shipyard gave up the purchase option to participate in the control of a large German shipyard.
3   Star Princess Cruises, which changed names in November 2009.

8
Table 2 – Orders placed by major cruise lines
                                                     Tonnage/Maximum passenger
    Year     Cruise line            Name                                            Delivery    Price (Million)                        Shipyard
                                                              capacity
    2011
           Oceania           Marina                                  65,000/1,260    1/2011              $530     Fincantieri - Sestri Ponente, Genoa, Italy
           Disney Cruise     Disney Dream                           124,000/4,000    1/2011              $850     Meyer Werft, Papenbourg, Germany
           AIDA              AIDAsol                                 71,000/2,644    4/2011              € 380    Meyer Werft, Papenbourg, Germany
           Ponant Cruises    L’Austral                                10,500/ 268    5/2011              € 150    Fincantieri, Italy
           Carnival          Carnival Magic                         130,000/4,631    5/2011              € 565    Fincantieri - Monfalcone (Trieste) - Italy
           Seabourn          Seabourn Quest                           32,000/450     5/2011              € 200    T. Mariotti, Genoa, Italy
           Costa             Costa Favolosa                         114,200/3,780   10/2011              € 510    Fincantieri - Marghera (Venice) - Italy
           Celebrity         Celebrity Silhouette                   122,000/3,150   10/2011              $698     Meyer Werft, Papenbourg, Germany
    2012
           AIDA              to be determined                        71,000/2,644    4/2012               € 385   Meyer Werft, Papenbourg, Germany
           Oceania           Riviera                                 65,000/1,260    5/2012                $530   Fincantieri - Monfalcone (Trieste) - Italy
           Disney Cruise     Disney Fantasy                         124,000/4,000    5/2012                $850   Meyer Werft, Papenbourg, Germany
           Costa             Costa Fascinosa                        114,200/3,780    5/2012               € 510   Fincantieri - Marghera (Venice) - Italy
           Carnival          Carnival Breeze                        130,000/4,631    6/2012                $738   Fincantieri - Monfalcone (Trieste) - Italy
           MSC               MSC Fantastica                         140,000/4,087    6/2012    to be determined   STX France de Saint-Nazaire, France
           Celebrity         Reflection                             122,000/3,150   10/2012                $698   Meyer Werft, Papenbourg, Germany
    2013
           Princess          to be determined                       139,000/3,600    4/2013              € 558    Fincantieri, Italy
           AIDA              to be determined                        71,000/2,644    4/2013              € 330    Meyer Werft, Papenbourg, Germany
    2014
        Princess        to be determined                            139,000/3,600    4/2013              € 558    Fincantieri, Italy
Source: ECC and IIC research, 2010

2. The European market
In late 20094, there were 45 cruise lines (44 in 2006 and 42 in 2008)and 124 ships in service in Europe
(compared to 118 in 2006 and 129 in 2008) with a capacity of 127,000 lower beds (102,000 in 2006 and
116,000 in 2008). Furthermore, in 2009 again, 64 ships owned by non-European cruise lines sailed in the
Mediterranean (as opposed to 47 in 2006 and 63 in 2008) with a capacity of 76,600 lower beds (compared to
51,300 in 2006 and 71,300 in 2008).
The Mediterranean market continues to see strong growth, confirming that the industry is still thriving and
as mentioned above, seems only to have been affected by the financial crisis in terms of new ship
constructions.
The ability of cruise lines to move their ships wherever they want to respond to market demand is a crucial
advantage that makes the market unique and much more responsive compared to other tourist products
that make substantial non-transferable investments.
Furthermore, the aggressive sales policies implemented by cruise lines over the last three to four years, along
with major investments in advertising through all forms of media (television, Internet, social networks, etc.)
have enabled the cruise industry to capture market shares from other segments of the tourism market that
suffered greatly from the effects of the crisis.
The growth margin of the cruise industry on the tourism market thus maintains potential for growth,
especially in the Mediterranean, which has suffered the least from the effects of the current economic and
financial crisis.

4   The most recent data for this sector date back to 2009.

                                                                                                                                                               9
3. Industry performance
In 2009, more than 4.9 million (4.4 million in 2008) European residents booked a cruise, i.e. an 11.3%
increase from 2008. Europeans now account for approximately 30% of cruise passengers worldwide,
practically doubling their numbers from fifteen years ago. 3.6 million Europeans select European cruises
and 1.3 million choose cruise itineraries outside Europe.
4.8 million passengers chose European cruises (+3.2% from 2008), 75% of which were European residents.
1.2 million non-European cruise passengers opted for European cruises although the exact numbers by
country of origin are not clear (the majority were North American from the United States and Canada, with
a small yet increasing number of cruise passengers coming from Asia).
Europe and the Mediterranean (which recorded 23.8 million overnight stays on cruises in 2009) still attract
the majority of cruise passengers. Performance figures are positive but remain limited due to the short
cruising season, particularly in the Baltic Sea region, which covers 13% of the market.
The Mediterranean continues to grow as a cruise destination with 20 million overnight stays in 2009
(18.9 millions in 2008), up 5.8% from 2008.
Mediterranean ports with the highest performance are listed in the table below. Table 3 shows the main
ports in terms of number of passengers (in thousands) for 2006, 2008 and 2009, and irrespective of whether
they are home ports or ports of call5.
Table 4 shows the change in the number of passengers (in absolute values) from 2004 to 2009 in the main
home ports, most of which are in Spain and Italy.
Table 3 – Busiest ports by number of passengers
Ports Number of passengers
Departures Arrivals Ports of call Total
2009 2008 2006 2009 2008 2006 2009 2008 2006 2009 2008 2006
Barcelona 593 573 389 587 571 393 971 926 625 2,151 2,070 1407
Civitavecchia 353 500 258 367 500 258 1,082 819 684 1,802 1,819 1,200
Palma Majorca n/a 300 240 n/a 300 240 n/a 531 525 n/a 1,131 1,005
Naples 65 72 50 70 72 59 1,130 1,093 862 1,265 1,237 972
Savona 282 309 299 293 306 299 138 157 1 713 772 599
Venice 581 530 362 589 530 363 251 205 161 1,421 1,265 886
Source: MedCruise, European Cruise Council, IIC, 2010
Barcelona maintains sustained growth with cruise passenger traffic more than doubling since 2004.
Civitavecchia saw a few thousand less passengers than in 2008; however numbers have nearly tripled since
2004. Naples is growing, Savona has experienced a drop in numbers and Venice has seen a strong increase.
5 It should be noted that passengers at home ports are generally counted twice: once at boarding and a second time at the end of the cruise.
10Table 4 – Home ports
Home port Country 2004 2005 2006 2007 2008 2009
Barcelona Spain 1,024,851 1,228,561 1,402,643 1,765,838 2,069,651 2,151,465
Civitavecchia Italy 659,277 983,171 1,268,477 1,586,101 1,818,616 1,802,938
Piraeus (Athens) Greece 407,723 502,308 771,241 1,000,000 1,290,000 1,500,000
Venice Italy 677,976 815,153 885,664 1,003,529 1,265,000 1,420,980
Palma Majorca Spain 744,974 877,912 923,868 1,048,906 1,131,147 1,056,215
Savona Italy 530,057 595,859 599,000 761,000 772,000 712,681
Genoa Italy 310,000 362,000 475,134 520,197 547,905 671,468
Source: Based on data from ports, MedCruise and Cruise Europe; IIC, 2010
Table 4 underlines the fact that most ports with the highest performance are Italian. This can be explained by the
location of Italian ports in the Mediterranean and their infrastructures. To be selected by cruise lines as home ports,
they must guarantee specific characteristics that have been met more quickly by Italian ports.
Finally, Table 5 shows the change in the number of passengers in the main Mediterranean ports, whether they are
home ports or ports of call.
Table 5 – Performance by number of cruise passengers
Ports Country 2007 2008 2009 % var 07/09
Barcelona Spain 1,765,838 2,069,651 2,151,465 21.8
Civitavecchia Italy 1,586,101 1,818,616 1,802,938 13.7
Palma Majorca Spain 1,048,906 1,131,147 1,056,215 0.7
Naples Italy 1,151,345 1,237,078 1,265,000 9.9
Venice Italy 1,003,529 1,215,088 1,420,980 41.6
Piraeus (Athens) Greece 1,000,000 1,290,000 1,500,000 50.0
Savona Italy 761,000 772,000 712,681 -6.3
Genoa Italy 520,197 547,905 671,468 29.1
Livorno Italy 713,144 849,050 795,313 11.5
Nice/Villefranche/Cannes France 559,411 708,785 742,668 32.8
Limassol/Larnaka Cyprus 427,408 376,296 320,467 -25.0
Marseille France 434,087 540,000 622,300 43.4
Valetta Malta 487,817 556,861 441,913 -9.4
Palermo Italy 471,395 537,721 478,900 1.6
Bari Italy 351,897 465,739 567,885 61.4
Messina Italy 291,296 337,117 253,200 -13.1
Malaga Spain 290,558 352,875 487,955 67.9
Monte Carlo Monaco 184,117 231,639 35,904 28.1
Gibraltar Gibraltar - UK 275,993 308,989 348,199 26.2
Ajaccio France 191,548 197,571 229,882 20.0
Valencia Spain 179,209 199,335 184,909 3.2
Source: Based on data from ports, MedCruise and Cruise Europe, 2010
The strong increases in Malaga, Bari, Marseille, Nice-Villefranche-Cannes and Genoa since 2007 are of note.
As for the nationality of passengers, British, German, Italian, Spanish and French passengers account for
86.9% of all passengers.
11Figure 4 – Distribution of European nationalities
0,6%
3,7%
3,5%
2,2%
1,6%
1,5%
United Kingdom
7,0% 31,0%
Germany
Italy
Spain
France
11,9%
Switzerland
Austria
Benelux
Scandinavia
16,2% Portugal
20,8%
Other UE
Source: ECC, 2010
British passengers make up 30% of the market and Germans 20.8%. Their destinations of choice are in the
Mediterranean while Italian and Spanish passengers are increasingly attracted to Northern European and
Baltic Sea itineraries. Saint Petersburg is also an extremely popular destination.
Table 6 – Passenger nationalities
Number of passengers
Country % 2009
2006 2008 2009
United Kingdom 1,204,000 1,477,000 1,533,000 31.0 %
Germany 705,000 907,000 1,027,000 20.8 %
Italy 517,000 682,000 799,000 16.2 %
Spain 391,000 497,000 587,000 11.9 %
France 242,000 310,000 347,000 7.0 %
Switzerland 56,000 65,000 76,000 1.5 %
Austria 44,000 59,000 80,000 1.6 %
Benelux 62,900 92,000 110,000 2.2 %
Scandinavia 23,000 123,000 173,000 3.5 %
Portugal - 28,000 30,000 0.6 %
Other EU - 192,000 182,000 3.7 %
Total 3,475,000 4,432,000 4,944,000 100.0 %
Source: European Cruise Council, 2010
12The number of British passengers has increased by 27.3% since 2006, Germans by more than 45%, Italians
by 54.5%, Spanish passengers by 50% and the French by 43.3% over the same observation period.
The distribution of overnight stays per destination country shows that Mediterranean regions and
Northern Europe are the most popular destinations.
Table 7 – Number of overnight stays per destination country
Country Number of overnight stays 2009 Number of overnight stays 2008 % 2009 % 2008
Greece 4,973,000 4,269,000 20.9 19.6
Italy 4,956,000 4,993,000 20.9 23.0
Spain 4,118,000 3,600,000 17.3 16.6
France 1,851,000 1,787,000 7.8 8.2
Norway 1,672,000 1,460,000 7.0 6.7
Portugal 825,000 786,000 3.5 3.6
Denmark 524,000 338,000 2.2 1.6
Sweden 514,000 433,000 2.2 2.0
United Kingdom 454,000 406,000 1.9 1.9
Estonia 416,000 377,000 1.8 1.7
Malta 414,000 512,000 1.7 2.4
Gibraltar 348,000 308,000 1.5 1.4
Finland 329,000 325,000 1.4 1.5
Germany 328,000 196,000 1.4 0.9
Cyprus 225,000 227,000 1.0 1.1
Ireland 160,000 134,000 0.7 0.6
Poland 153,000 137,000 0.6 0.6
Iceland 144,000 112,000 0.6 0.5
Netherlands 113,000 79,000 0.5 0.4
Other EU 255,000 283,000 1.1 1.3
Other Europe* 984,000 966,000 4.1 4.4
Total 23,756,000 21,728,000 100 100
*including ports of call in Saint Petersburg and the Black Sea.
Source: G.P.Wild, 2010 and IIC, 2010
Compared to 2008, Greece and the Mediterranean coasts of Spain and France showed strong
performance thanks to cruise lines opting for itineraries based on their sales policies, port conditions
(in terms of infrastructures and costs) and alternatives with respect to shore excursions, a lucrative
source of revenue for cruise lines. It should be noted that the cruise industry benefits from a high
number of “repeaters”, i.e. passengers who repeat their experience by choosing cruises based on two
fundamental criteria: itineraries and ships6.
6Some passengers choose their cruise based on the ship and not its itinerary. Some websites are even dedicated to specific ships or popular forums used by
cruise passengers.
134. Economic impact of the industry An evaluation of the economic impacts of the cruise industry is released each year by “The European Cruise Council”, which represents the majority of cruise lines operating worldwide. In 2008, the cruise industry generated the following in terms of economic impact: • 14.2 billion in direct revenue from cruise lines and passengers; • 32.2 billion in economic returns to the total European economic system; • 311,512 jobs, representing approximately € 10 billion in terms of salaries. Initial assessments of the effects of the financial crisis for 2009 show a 1.2% drop in direct economic impact from the sector compared to 2008. Industry experts confirm that this is tied to two major factors: an 11.5% reduction in naval construction, and a 6% increase in costs (fuel, insurance, etc.). Expected industry performance for 2009 was as follows: • 14.1 billion in direct impact (down from 2008); • 34.1 billion in economic returns to the economic system (a 6% jump from 2008); • 296,288 jobs, i.e. a sharp drop from 2008 (approximately 5%). Therefore each million in direct spending generates 2.42 million in total economic returns and roughly 21 jobs (with an average gross salary of € 30,000 per year). If a detailed analysis is made of the direct impact of the cruise industry in Europe (14.1 billion compared to 10.6 in 2006, but 14.2 in 2008), the following can be observed: • passengers (and crew) spent € 2.9 billion during their stays (compared to 2 billion in 2006 and 2.7 billion in 2008). This calculation also includes spending prior to and after cruises in home ports as well as all gift purchases, etc.); • shipbuilding projects represented 4.6 billion (compared to 4.1 billion in 2006 and 5.2 billion in 2008), i.e. 11.5% less than in 2008; • cruise lines spent 5.4 billion (compare to 3.5 billion in 2006 and 5.1 billion in 2008) in addition to nearly 1.2 billion in employee salaries (compared to 1 billion in 2006). Cruise lines employ 4,500 staff in corporate and administrative offices, in addition to approximately 46,500 European crew members. As for the expenses of cruise lines (5.4 billion): • 479 million (compared to 268 million in 2006 and 385 million in 2008) covered food and beverages; • 646 million in fuel (compared to 327 million in 2006 and 578 million in 2008); • 491 million was spent on equipment management (compared to 317 million in 2006 and 512 million in 2008); • 825 million was paid in travel agency commissions (compared to 495 million in 2006 and 750 million in 2008); • 1.2 billion for financial and commercial services like insurance, advertising, consulting, etc. (compared to 640 million in 2006 and 700 million in 2008). As for passengers (2.9 billion): • 1.3 billion was spent on airline tickets, port taxes, excursions (compared to 989 million in 2006); • 1.45 billion was spent by cruise passengers (compared to 1 billion in 2006 and 1.4 billion in 2008); • 150 million related to crew spending in ports. According to ECC estimates, in 2009, 143,233 direct jobs were created by the industry (107,780 in 2006 and 150,369 in 2008), 108,975 jobs from indirect employment (116,888 in 2008) and 44,080 jobs in related sectors (44,255 in 2008). 14
Figure 5 – Direct jobs created by the cruise industry in Europe

Source: ECC, 2010

A sharp drop in terms of jobs was registered for the first time in 2009.

                                  Table 8 – Distribution of direct jobs generated by the cruise industry

                                              Direct Jobs         Direct Jobs       Growth from 2008 in     Share of Total (2009) in
               Industry
                                                 2008                2009                    %                        %

Agriculture., Mining &
                                                        107                 100                     -6.54                        0.1
Construction
Manufacturing                                        50,528              37,976                    -24.84                      26.5
Food & Tobacco                                        1,528               2,188                     43.19                        1.5
Textiles & Apparel                                    1,050               1,476                     40.57                        1.0
Paper & Printing                                        691               1,025                     48.34                        0.7
Petroleum & Chemicals                                   855                 820                     -4.09                        0.6
Stone, Clay & Glass                                     103                 157                     52.43                        0.1
Metals                                                3,305               2,014                    -39.06                        1.4
Machinery                                             3,485               1,060                    -69.58                        0.7
Electrical Machinery                                    748                 628                    -16.04                        0.4
Shipbuilding                                         36,922              25,938                    -29.75                      18.2
Other Manufacturing                                   1,841               2,670                     45.03                        1.9
Wholesale Trade & Retail Trade                        7,226               7,953                     10.06                        5.6
Hospitality                                           4,723               5,007                      6.01                        3.5
Transportation & Utilities                           18,799              20,258                      7.76                      14.1
Financial and Business services                      11,173              12,862                     15.12                        8.9
Finance, Insurance & Real Estate                        691                 899                      30.1                        0.6
Business Services                                    10,482              11,963                     14.13                        8.3
Personal Services & Governmentt                       3,072               7,981                     159.8                        5.6
Subtotal                                             95,628              92,137                     -3.65                      64.3
Cruise Line Employees*                               54,741              51,096                     -6.66                      35.7
Grand Total                                         150,369             143,233                     -4.75                       100
*European Nationals
Source: G.P. Wild, 2010 and IIC, 2010

An analysis of Table 8 attests to a sharp decrease in jobs in the shipbuilding, equipment and metal sectors.

                                                                                                                                  15
In total, 296,288 indirect jobs distributed among the sectors listed in Table 9 and Figure 6 were recorded in
2009 (compared to 311,512 in 2008 and 225,586 in 2006):
Table 9 – Distribution of indirect jobs generated by the cruise industry
Industry Total Jobs 2008 Total Jobs 2009 Growth from 2008 in % Share of Total 2009 in %
Agriculture, Mining & Construction 26 369 14 914 -43.44 5.0
Manufacturing 94 061 71 281 -24.22 24.1
Food & Tobacco 3 462 4 611 33.19 1.6
Textiles & Apparel 4 575 4 022 -12.09 1.4
Paper & Printing 3 648 3 551 -2.66 1.2
Petroleum & Chemicals 4 777 3 507 -26.59 1.3
Stone & Glass 1 314 1 303 -0.84 0.4
Metals 13 870 10 440 -24.73 3.4
Machinery 7 592 3 457 -54.47 1.2
Electrical Machinery 5 475 3 129 -42.85 1.1
Transportation Equipment7 44 244 30 679 -30.66 10.3
Other Manufacturing 5 104 6 582 -28.96 2.2
Wholesale Trade & Retail Trade 21 373 25 073 17.31 8.5
Hospitality 12 930 13 580 5.03 4.6
Transportation & Utilities 38 442 38 611 0.44 13.0
Air Transport 6 065 5 284 -12.88 1.8
Transport Services 18 968 19 325 1.88 6.6
Other Transport 6 587 8 881 34.83 3.0
Communications & Utilities 6 823 5 121 -24.95 1.7%
Financial & Business Services 48 697 57 653 18.39 19.5
Finance, Insurance & Real Estate 8 046 8 865 10.18 3.0
Business Services 40 651 48 788 20.02 16.5
Personal Services & Government 14 898 24 080 61.63 8.1
Subtotal 256 771 245 192 -4.51 82.8
Cruise Line Employees 54 741 51 096 -6.66 17.2
Grand Total 311 512 296 288 -4.89 100.0
Source: G.P. Wild, 2010 and IIC, 2010
Figure 6 – Indirect jobs generated by the cruise industry in Europe (2009)
Source: ECC, 2010
7 “Transportation equipment” includes shipbuilding as well as the construction of transportation equipment such as cars, buses, trucks, airplanes, etc.
16The distribution of jobs by country shows that nearly 62% of all jobs are concentrated in three European
countries: Italy, the United Kingdom and Germany. Italy accounts for more than 32% of jobs with 96,076
jobs (employment related to the industry is maintained though there was a slight decrease from 2008
numbers). There was significant job contraction in Germany, France, Norway and especially Poland.
Table 10 – Employment distribution by country
Country Total jobs 2008 Total jobs 2009 Growth from 2008 Share of Total 2009 in % Share of Total 2008 in %
Italy 97,152 96,076 -1.11 32.4 31.2
United Kingdom 49,015 55,599 13.43 18.8 15.7
Germany 41,560 31,395 -24.46 10.6 13.3
Spain 22,397 24,248 8.26 8.2 7.2
Finland 14,268 13,658 -4.28 4.6 4.6
France 18,265 15,128 -17.17 5.1 5.9
Norway 13,974 10,897 -22.02 3.7 4.5
Greece 10,775 11,794 9.46 4.0 3.5
Portugal 7,048 7,296 3.52 2.4 2.3
Poland 7,903 2,411 -69.49 0.8 2.5
Top 10 (2008) 282,357 268,502 -4.91 90.6 90.7
Netherlands 4,079 4,753 16.52 1.6 1.3
Malta 1,666 2,531 51.92 0.8 0.5
Hungary 2,095 - Nd - 0.7
Sweden 1,993 2,036 2.16 0.7 0.6
Cyprus 1,355 1,052 -22.36 0.4 0.4
Denmark 2,013 1,931 -4.07 0.7 0.7
Rest of EU+3 15,954 15,483 -2.95 5.2 5.1
Total 311,512 296,288 -4.89 100.0 100.0
Source: G.P. Wild, 2009-2010 and IIC, 2010
Finally, there is a correlation between the number of jobs in each country and the direct economic impact
for each country. In terms of economic impact, 2009 recorded positive performance in relation to 2008 in
Italy, the United Kingdom, Spain, Greece and the Netherlands. However, this was not the case in Germany,
France and Norway.
Table 11 – Distribution of general economic impact per country
Direct economic impact 2008 Direct economic impact 2009 Share of total in Share of total in
Country
(Millions of Euros) (Millions of Euros) % 2009 % 2008
Italy 4,318 4,331 30.8 30.4
United Kingdom 2,263 2,408 17.1 15.9
Germany 2,351 1,918 13.7 16.5
France 1,399 1,158 8.2 9.8
Spain 1,078 1,119 8 7.6
Finland 902 906 6.4 6.3
Norway 477 417 3 3.4
Greece 471 598 4.3 3.3
Netherlands 204 290 2.1 1.4
Portugal 180 169 1.2 1.3
Denmark 156 203 1.4 1.1
Sweden 142 158 1.1 1.0
Malta 65 62 0.4 0.5
Cyprus 46 49 0.3 0.3
Austria 32 32 0.2 0.2
Other countries 132 233 1.8 0.9
Total 14,216 14,051 100 100
Source: G.P. Wild, 2009, 2010 and IIC, 2010
175. Mediterranean cruise itineraries
Cruise itineraries in the Mediterranean remain traditional with a growing number of stopovers in the Greek
islands. In 2009 they became the leader in terms of overnight stays (see Table 7).
Spain, Italy and France combined account for approximately 47% of all overnight stays in the Western
Mediterranean and Greece dominates the Eastern Mediterranean with more than 20% of the total. The
average cruise length is 6 days.
One of the reasons for the success of the Mediterranean is the ability to diversify itineraries in comparison
to the Caribbean, though it should be specified that a significant number of cruise passengers, even in the
Mediterranean, do not disembark from the ship. Thus the varied offer of itineraries helps meet the demand
catering mainly to two age brackets: American passengers of roughly 60 years of age on average; European
passengers aged 35 to 50 travelling in families with children of all ages (it should be noted that cruise lines
often sell packages where children up to 18 years of age travel for free).
The Mediterranean offers the ability to design cruise itineraries that are extremely varied and different
depending of the period of the year. There are a wide number of ports of call that have been increasing
considerably since the early 2000’s.
The number of home ports (departure / destination ports) account for less than 16% of all ports of call,
which total more than 150.
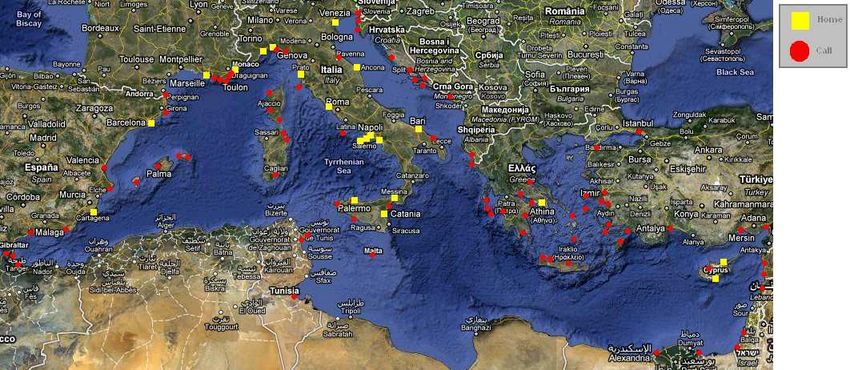
Home ports must provide services to ships and passengers that are not available everywhere. Figure 7
shows the distribution of the different categories of ports in the Mediterranean.
Figure 7 – Main cruise ports in the Mediterranean
Source: IIC, 2010
The main ports visited by Mediterranean cruise ships are listed below by type.
18Table 12 – List of home ports for Mediterranean cruises
Port No. Port Country Type of port
1 Ancona Italy port of call - home port
2 Barcelona Spain port of call - home port
3 Bari Italy port of call - home port
4 Capri Italy port of call - home port
5 Cartagena Spain port of call - home port
6 Catania Italy port of call - home port
7 Civitavecchia - Rome Italy port of call - home port
8 Genoa Italy port of call - home port
9 Larnaka Cyprus port of call - home port
10 Limassol Cyprus port of call - home port
11 Livorno Italy port of call - home port
12 Marseille France port of call - home port
13 Messina Italy port of call - home port
14 Monte-Carlo Principality of Monaco port of call - home port
15 Naples Italy port of call - home port
16 Palermo Italy port of call - home port
17 Piraeus Greece port of call - home port
18 Salerno Italy port of call - home port
19 Savona Italy port of call - home port
20 Sorrento Italy port of call - home port
21 Trieste Italy port of call - home port
22 Toulon France port of call - home port
23 Venice Italy port of call - home port
24 Villefranche - Nice France port of call - home port
Source: IIC, 2010
The 24 home ports listed are all on the Northern coast of the Mediterranean, with the exception of a few
located on Cyprus. The home ports of the largest cruise lines are concentrated in 12 ports.
Table 13 lists the various ports of call for cruises in the Mediterranean or neighbouring regions where part
of the itinerary is in the Mediterranean.
Table 13 – List of ports of call for Mediterranean cruises
Port No. Port Country Type of port
1 Agadir Morocco port of call8
2 Aghios Nikolaos Greece port of call
3 Ajaccio France - Corsica port of call
4 Alanya - Antalya Turkey port of call
5 Alexandria Egypt port of call
6 Algiers Algeria port of call
7 Alghero Italy – Sardinia port of call
8 Alicante Spain port of call
9 Almería Spain port of call
10 Amalfi Italy port of call
11 Amorgos Greece – Crete port of call
12 Argostoli Greece port of call
13 Ashdod Israel port of call
14 Bastia France - Corsica port of call
15 Beirut Lebanon port of call
16 Bodrum Turkey port of call
17 Bonifacio France - Corsica port of call
18 Brac Croatia port of call
19 Brindisi Italy port of call
8 The port of Agadir (Atlantic Ocean) is included in Mediterranean cruise itineraries.
19Port No. Port Country Type of port
20 Cagliari Italy port of call
21 Calvi France - Corsica port of call
22 Canakkale Turkey port of call
23 Cannes France port of call
24 Capodistria Slovenia port of call
25 Capri Italy port of call
26 Cartagena Spain port of call
27 Casablanca Morocco port of call9
28 Cassis France port of call
29 Castellon Spain port of call
30 Ceuta Spain port of call
31 Chania Greece port of call
32 Collioure (Port Vendres) France port of call
33 Corfu Greece port of call
34 Corinth Greece port of call
35 Crete Greece port of call
36 Cyprus Cyprus port of call
37 Delos Greece port of call
38 Dikili Turkey port of call
39 Dubrovnik Croatia port of call
40 Durres Albania port of call
41 Ephesus Turkey port of call
42 Fethiye Turkey port of call
43 Fiskardho Greece – Cephalonia port of call
44 Folegandros Greece port of call
45 Gabès Tunisia port of call
46 Giannutri Italy port of call
47 Gibraltar United Kingdom port of call
48 Gythion Greece port of call
49 Haïfa Israel port of call
50 Heraklion Greece port of call
51 Hvar Croatia port of call
52 Ibiza Spain port of call
53 Ilos Greece port of call
54 Istanbul Turkey port of call
55 Iskenderun Turkey port of call
56 Itea Greece port of call
57 Izmir -Smyrne Turkey port of call
58 Katakolon Greece port of call
59 Kavala Greece port of call
60 Khios Greece port of call
61 Koper Slovenia port of call
62 Korčula Croatia port of call
63 Kos Greece port of call
64 Kotor Montenegro port of call
65 Kuşadası Turkey port of call
66 La Goulette Tunisia port of call
67 La Rochelle France port of call
68 La Savina Spain - Balearic Islands – Formentera port of call
69 La Spezia Italy port of call
70 Valletta Malta port of call
71 Larnaka Cyprus port of call
72 Lattakia Syria port of call
73 Le Lavandou France port of call
74 Lemnos Greece port of call
75 Limassol Cyprus port of call
76 Lipari Italy – Sicily port of call
77 Livorno Italy port of call
9 The port of Casablanca (Atlantic Ocean) is included in Mediterranean cruise itineraries.
20Port No. Port Country Type of port
78 Mahon Spain port of call
79 Malaga Spain port of call
80 Marmaris Turkey port of call
81 Mersin Turkey port of call
82 Milos Greece port of call
83 Minorca Spain port of call
84 Molyvos Greece - Lesbos port of call
85 Monemvasia Greece port of call
86 Monte-Carlo Monaco port of call
87 Motril Spain port of call
88 Mykonos Greece port of call
89 Mytilene Lesbos Greece - Lesbos port of call
90 Nafplio Greece port of call
91 Navplion Greece port of call
92 Naxos Greece port of call
93 Olbia Italy port of call
94 Olympia Greece port of call
95 Palamos Spain port of call
96 Palma de Majorca Spain port of call
97 Paphos Cyprus port of call
98 Paros Greece port of call
99 Patmos Greece port of call
100 Pescara Italy port of call
101 Ploce Croatia port of call
102 Pollensa Spain - Balearic Islands – Majorca port of call
103 Poltu Quatu Italy – Sardinia port of call
104 Ponza Italy port of call
105 Poros Greece port of call
106 Port Saïd Egypt port of call
107 Porto Azzurro Italy – Elba port of call
108 Porto Cervo Italy – Sardinia port of call
109 Porto Empedocle Italy port of call
110 Porto Venere Italy port of call
111 Portoferraio Italy port of call
112 Portofino Italy port of call
113 Propriano France - Corsica port of call
114 Pula Croatia port of call
115 Rapallo Italy port of call
116 Ravenna Italy port of call
117 Rethimnon Greece – Crete port of call
118 Rhodes Greece port of call
119 Rijeka Croatia port of call
120 Rovinj Croatia port of call
121 Safaga Egypt port of call10
122 Saint - Tropez France port of call
123 Saint Raphaël France port of call
124 Santa Margherita Ligure Italy port of call
125 Santorini Greece port of call
126 Sarande Albania port of call
127 Serifos Greece port of call
128 Sète France port of call
129 Šibenik Croatia port of call
130 Sorrento Italy port of call
131 Souda Bay Greece port of call
132 Spetses Greece port of call
133 Split Croatia port of call
134 Syracuse Italy – Sicily port of call
135 Tangier Morocco port of call11
10 The port of Safaga (Red Sea) is included in Mediterranean cruise itineraries.
11 The port of Tangier (Strait of Gibraltar) is included in Mediterranean cruise itineraries.
21Port No. Port Country Type of port
136 Taormina Italy port of call
137 Tarragona Spain port of call
138 Tartus Syria port of call
139 Taşucu Turkey port of call
140 Thessalonica Greece port of call
141 Toulon France port of call
142 Trapani Italy port of call
143 Trieste Italy port of call
144 Tripoli Libya port of call
145 Trogir Croatia port of call
146 Tunis Tunisia port of call
147 Valencia Spain port of call
148 Villefranche - Nice France port of call
149 Volos Greece port of call
150 Xlendi Malta - Île de Gozo port of call
151 Zadar Croatia port of call
152 Zakinthos Greece port of call
Source: IIC, 2010
The situation for ports of call is as follows: 75% are located in Italy, Spain, France, Greece, Croatia,
Slovenia; 9% in Turkey and Cyprus and only 7% in North Africa. The large number of cruise ships in the
Mediterranean Sea is causing more and more logistical and operational problems. This is attributed to the
high concentration or even congestion of home ports. Few ports included in the list above are able to
accommodate the largest cruise ships.
The growth of the industry over the last few years has not been accompanied by sufficient expansion or
adaptation of ports. Only home ports have carried out or are in the process of carrying out major work to
adapt quays (the latest Royal Caribbean ships in the “Oasis of the Sea” series are 360 metres long).
Few ports are currently able to sustainably handle ship and passenger traffic, whether from a management
or environmental standpoint.
Some ports have launched feasibility studies to look into implementing cold ironing to supply ships directly
with electrical power while at berth, enabling them to shut down engines or onboard generators to reduce
noise and other pollution in ports and port towns/cities.
Port congestion is a reality that is especially true on cruise departure days. Many smaller ships seek to avoid as
many busy ports of call as possible in favour of smaller and less congested ones. Similar to the same situation
in the Caribbean, some Mediterranean destinations are now besieged by cruise passengers and are almost
viewed in a negative light by local economic operators. These passengers often have limited purchasing
power and the congestion that they generate risks making certain tourist destinations less attractive.
Several analyses show that a majority of passengers (70%) return to their ship for lunch since onboard meals
are included in the cruise package, and on average, they spend very little at each port of call (less than €50
per person)12.
Cruise lines have several tricks to optimise passenger spending. They make their greatest profits from
onboard spending and land excursions that they organise directly. However the number of “free”
passengers who disembark without taking part in an organised excursion is on the rise.
It should also be noted that the emergence of low-cost cruise lines for 2008 did not occur as originally
expected.
12A recent IIC investigation for the Port of Genoa (Nov. 2010) found that on average, cruise passengers spent €26 per person with a modal value of €18.
This can be explained by the fact that cruise ships dock in the Port of Genoa on Sundays, when shops and businesses are closed.
226. Port infrastructures
The infrastructures required for a port to accommodate cruise ships are as follows:
• Suitable quays (up to 360 metres for the largest ships currently in service) with a draught of at least 10 metres;
• Functional passenger terminals (especially in home ports), with gangways directly connected to ships that meet
international safety standards;
• Long term affordable parking lots at home ports and parking lots for highway coaches used for excursions at ports
of call and home ports;
• An efficient and well-organised luggage control and handling system (home ports) with high level security (ISPS
code13, X-ray, metal detectors);
• Efficient check-in procedures (ships accommodate a growing number of passengers);
• High performance cruise line logistics for provisions and supplies (home ports);
• Optimisation of land transfers with efficient connections to transportation networks (railway and airports).
As for services made available by ports, the following are essential:
• A good level of quality tourist service (tourist information and passenger assistance services);
• Easy access to public transportation systems;
• Staff safety systems;
• Information signs for tourists (cruise passengers in particular);
• Well-indicated pedestrian routes;
• Efficient public transportation systems;
• Flexible opening hours for shops and businesses;
• Local support for excursions organised by cruise lines.
The port reception of cruise passengers, especially free passengers who do not purchase excursions offered
by the cruise, is becoming important as a growing number of local institutions begin to put inter-
institutional coordination organisations in place to optimise the economic benefits of having this clientele in
their area. Destination towns and cities must therefore be ready to handle a flow of tourists who are only
ashore for a few hours, most often in a group (sometimes large groups that are therefore difficult to handle)
and who have limited purchasing power.
Passenger terminals are a €10 to 20 million investment that cruise lines help directly finance if they are
guaranteed exclusive use.
In addition to their operational prerogatives, terminals can also become profit centres for cruise lines if they
rent out the terminal space for seminars, parties and other functions when ships are not at dock.
7. Differences between Northern and Southern Mediterranean ports
As shown in Table 12, the majority of home ports is located on the European coasts of the Mediterranean.
Table 14 outlines the infrastructures of the main Mediterranean ports. Ports that do not yet have a
dedicated cruise passenger terminal are indicated with red shading; those able to accommodate the latest
generation of large ships with green, and finally ports needing dredging capabilities to increase the depth of
the port and thus accommodate deep draught ships are indicated with pink shading.
Analysis of Table 14 shows that the ports of La Goulette (Tunisia) and Alexandria (Egypt) are the only ones
with infrastructures comparable to the ports on the Northern shores of the Mediterranean. Turkey and
13 ISPS Code ( International Ship and Port Facilities Security): for more information go to: http://www.trans- inst.org/defense-programs.html.
23Cyprus are also capable of accommodating the latest generation of ships with respect to the length of quays
or draught.
Table 14 - Infrastructures of the main Mediterranean ports
Dedicated Passenger Quay length (min – max) Length Draught (min-max)
Ports
quays terminal (m) >350m (m)
Ancona 1 yes 206 no 8.5
Barcelona 7 yes 160 - 700 yes 7.70 - 12.00
Bari 6 yes 250 - 300 no 8 - 11.50
Cartagena 2 no 344 no 12
Catania 2 yes 290 no 8 - 9.50
Civitavecchia -
6 yes 219 - 537 yes 8.71 - 18.00
Rome
Genoa 5 yes 90 - 350 yes 4.50 - 11.00
Larnaka n/a yes 250 no 11.4
Limassol n/a yes 300-480 yes 11-14
Livorno 6 yes 170 - 940 yes 6.50 - 12.00
Marseille 7 yes 220 - 250 no 14.5
Messina 5 no 98 - 295 no 7.00 - 11.00
Monte-Carlo 1 no 130 no 7
Naples 10 yes 120-493 yes 5.00 - 10.00
Palermo 2 yes 304-319 no 9.00 - 12.00
Piraeus 2 yes 79-201 no n/a
Salerno 1 yes 380 yes 11.5
Savona 1 yes 450 yes 9
Trieste 2 yes 240 - 389 yes 8 - 11
Toulon 4 yes 176 - 345 no 7.5 - 9.5
Villefranche - Nice 0 yes 180 no 10-15
Venice 3 yes 294 no 8.55
La Goulette 3 yes 320 no 11-12.2
Alexandria 3 yes 200-500 yes 11
Istanbul 2 yes 527-627 yes 7 - 10
Bodrum 2 yes 220-240 no 9 - 22
Source: IIC, 2010
However, physical infrastructures are not enough to guarantee the development of the cruise industry.
Parking lots, bus and taxi services must be available and the distance between the port, downtown and
public transportation hub in home ports is key.
24Table 15 – Infrastructures of the main Mediterranean ports
Shuttle/bus Taxi Distance to Distance to Distance to train
Port Parking
service service downtown (km) airport (km) station (km)
Ancona yes - - 1.2 18 1.9
Barcelona yes yes yes 4 7 9
Bari yes yes yes 0.8 7 1
Capri - - - 3.5 50 38
Cartagena yes upon request yes 0.2 30 1
Catania - - - 1.2 9.5 1.4
Civitavecchia -
yes - - 1.2 65 0.5
Rome
Genoa yes upon request yes 1 5 0.5
Larnaka yes no yes 2 6 no
Limassol yes yes yes 5 70 no
Livorno yes yes yes 0.5 13 (Pisa) 3
Marseille yes - - 2 25 2.5
Messina yes no yes located downtown located downtown located downtown
Monte-Carlo no yes 0.5 20 0.8
Naples yes upon request yes located downtown 10 6
Palermo yes - yes 0.5 25 2
Piraeus - - - located downtown 8 8
Salerno - - - 2 65 (Naples) 2.5
Savona yes - - 1.5 42 (Genoa) 2
Sorrente - - - 1 56 (Naples) 0.7
Trieste yes yes yes 1.4 34 2
Toulon no yes yes 0.3 24 1.2
Villefranche - Nice yes yes yes located downtown 14 6.5
Venice yes yes yes located downtown 16 11
La Goulette - yes yes 8 18 n/a
Alexandria - yes - located downtown 40 n/a
Istanbul - yes yes 20 20 n/a
Bodrum - yes yes located downtown 36 n/a
Source: IIC, 2010
25II. The recreational boating market
1. Context on a global level
The global boat fleet is assessed based on data provided each year by the various MIAs (Marine Industry
Associations) of the ICOMIA (International Council of Maritime Industry Associations), which process the
information they receive through their own internal statistics committee. Collecting data is often difficult
and complex as it requires numerous adjustments depending on the different methods for collecting
information, the different classifications of watercraft, and the varying degrees of reliability of the various
sources used.
An initial segmentation by macro-region (ICOMIA, 2009) shows the predominance of the United States
(68% of the global boat fleet), followed by Europe (25 %) and the rest of the world (7 %). Official statistics
do not specifically target the Mediterranean; however a detailed analysis of various sources suggests that the
Mediterranean represents approximately 20% of the global boat fleet. This distribution has been consistent
for at least 10 years.
Figure 8 – Global boat fleet (2009) – (United States, Europe and Other countries)
Source: ICOMIA, 2010
A second interesting and useful approach to understanding this sector is the segmentation of the global boat
fleet by type of boat. In 2009, motor boats represented 87% of all watercraft, compared to 11% for sail
boats and 2% for other types (inflatable boats, canoes, etc.).
26Figure 9 – Global boat fleet (segmentation by type: with motor, with sail or others) – 2009
Sources: ICOMIA, 2010
The current international economic crisis also affecting the recreational boating industry and its field (2008
data and therefore the beginning of the crisis) has caused changes, at least in part, to the distribution of the
boat fleet between the United States and Europe, as shown in the graph below:
Figure 10 – Global boat fleet (change in % since 2004 by macro-region)
80
70
60
50
United States
40
Europe
30
Other
20 countries
10
0
2004 2005 2006 2007 2008
Source: based on ICOMIA data, 2010; IIC, 2010
Initial estimates made by specialised industry organisations and associations recorded an approximately 30%
drop for the 2009-2010 period in terms of sales on the recreational boating market, and several cases of
bankruptcy or extreme difficulty for certain boat manufacturers and throughout the sector in general. New
boat manufacturing is the most affected, however the maintenance and repair sectors are seeing strong
growth as it is currently cheaper for boat owners to upgrade their boats rather than purchase a new one.
Scandinavian countries once again have a high number of boats per 1,000 inhabitants compared to the other
countries examined where data is reliable and up to date.
27You can also read