D 3.4 Exploitation Roadmap - Final Exploitation Strategy - Ground Truth 2.0
←
→
Page content transcription
If your browser does not render page correctly, please read the page content below
D 3.4 Exploitation
Roadmap
Final Exploitation Strategy

The Ground Truth 2.0 project has received funding from the European Union’s Horizon 2020
research and innovation programme under grant agreement No. 689744. www.gt20.eu
Deliverable Title              Exploitation Roadmap
Status                         Final
Related Work Package           WP3 – Business development to accelerate market uptake
Deliverable lead               Starlab
Author(s)                      Nina Costa (NDConsult), Elizabeth Gil-Roldan (Starlab)
Contributors                   Uta Wehn (IHE Delft), Joan Maso (CREAF), Hans van der Kwast (IHE Delft),
                               Stijn Vranckx (VITO), Annemarleen Kersbergen (HR), Ellen Pfeiffer (IHE
                               Delft), Thomas Bjelkeman-Pettersson (AKVO)
Internal reviewer(s)           Thomas Bjelkeman-Pettersson (AKVO), Luigi Ceccaroni (CERT-Earth-
                               watch), Sasha Woods (CERT-Earthwatch)
Contact for queries            nina.costa@ndconsult.eu; elizabeth.gil-roldan@starlab.es
Dissemination level            Public
Due submission date            M33
Actual submission              M40
Project acronym                Ground Truth 2.0
Grant agreement number         689744
Funding scheme                 H2020-SC5-2015-two-stage/Topic SC5-17-2015/Innovation Actions
Abstract of deliverable        In this final Exploitation Roadmap report, the key activities to achieve
                               sustainability of the 6 GT2.0 COs is presented as well as their Social Re-
                               turn on Investment (SRoI). Also, initial business plans for the exploitation
                               of the Quality Tool and the Co-design Methodology are described.

Versions and Contribution History

Ver-     Date          Modified by                                                   Modification details
sion
v0.1     5/12/19       Nina Costa (NDConsult), Elizabeth Gil-Roldan (Starlab) with   First draft version
                       contributions from all demo teams and other tool leads
v0.2     9/12/19       Simon Gathuru (Upande)                                        Final inputs on Kenyan CO
                       Thomas Bjelkeman-Pettersson (AKVO), Ana Perez (Starlab)       Internal reviews
v0.3     16/12/19      Ellen Pfeiffer (IHE)                                          Final inputs on Zambian CO
V0.4     18/12/19      Luigi Ceccaroni (CERT-Earthwatch), Sasha Woods (CERT-         Internal review
                       Earthwatch)
V0.5     19/12/19      Nina Costa (NDConsult)                                        Final edits based on re-
                                                                                     viewer feedback

                                                                                                                 2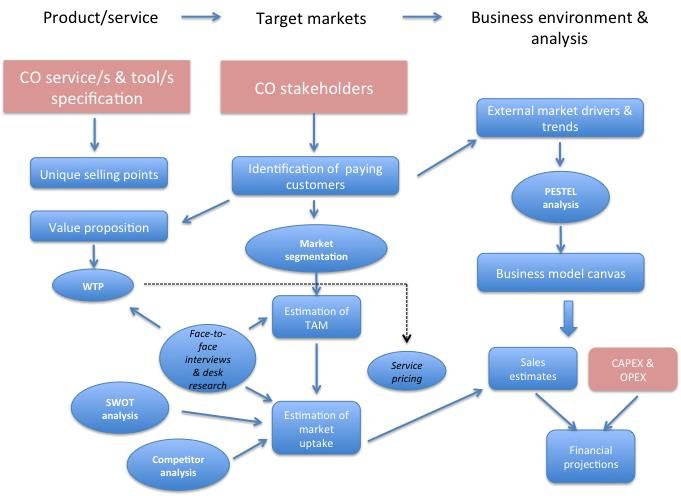
Ground Truth 2.0 Deliverable D3.4 Exploitation Roadmap

Table of Contents
1     Introduction........................................................................................................................................... 4
    1.1    Objectives of the WP ..................................................................................................................... 4
      1.1.1 Purpose and scope of this document                                                                                                                5
      1.1.2 Links with other WPs                                                                                                                              6
    1.2    Methodology and activities undertaken ....................................................................................... 6
    1.3    Lessons learnt and revision of our approach ................................................................................ 7
      1.3.1 Market analysis and exploitation                                                                                                                  7
      1.3.2 Financial sustainability                                                                                                                          8
      1.3.3 Social sustainability                                                                                                                             8
    1.4    Community sustainability .............................................................................................................. 9
    1.5    Exploitation of the GT 2.0 tools and methodology ....................................................................... 9
2     Sustainability of Meet Mee Mechelen CO ..........................................................................................10
    2.1    Social return on investment ........................................................................................................10
    2.2    Most likely sustainability scenario ..............................................................................................11
    2.3    Market expansion........................................................................................................................12
    2.4    Roadmap for sustainability..........................................................................................................13
3     Sustainability of Grip op Water Altena, Netherlands ..........................................................................15
    3.1    Social return on investment ........................................................................................................15
    3.2    Most likely sustainability scenario ..............................................................................................16
    3.3    Market expansion........................................................................................................................17
    3.4    Roadmap for sustainability..........................................................................................................17
4     Sustainability of RitmeNatura, Spain...................................................................................................19
    4.1    Social return on investment ........................................................................................................19
    4.1    Most likely sustainability scenario ..............................................................................................20
    4.2    Market expansion........................................................................................................................21
    4.3    Roadmap for sustainability..........................................................................................................22
5     Sustainability of VattenFokus, Sweden ...............................................................................................23
    5.1    Social return on investment ........................................................................................................23
    5.2    Most likely sustainability scenario ..............................................................................................24
    5.3    Recommendations on market expansion ...................................................................................25
    5.4    Roadmap for sustainability..........................................................................................................26
6     Sustainability of Maasai Mara CO, Kenya............................................................................................26
    6.1    Social return on investment ........................................................................................................26
    6.2    Most likely sustainability scenario ..............................................................................................28
    6.3    Recommendations for market expansion ...................................................................................29
    6.4    Roadmap for sustainability..........................................................................................................29
7     Sustainability of National CBNRM CO, Zambia....................................................................................31
    7.1    Social return on investment ........................................................................................................31
    7.2    Most likely sustainability scenario ..............................................................................................33
    7.3    Recommendations for market expansion ...................................................................................34
    7.4    Roadmap for sustainability..........................................................................................................34
8     Exploitation of the Quality Tool ..........................................................................................................36
    8.1    Recap ...........................................................................................................................................36
    8.2    Potential market uptake..............................................................................................................36
    8.3    Exploitation roadmap ..................................................................................................................37
9     Exploitation of the GT2.0 Co-design Methodology .............................................................................38
    9.1    Recap ...........................................................................................................................................38
    9.2    Potential market uptake..............................................................................................................39

                          The Ground Truth 2.0 project has received funding from the European Union’s Horizon 2020
                          research and innovation programme under grant agreement No. 689744. www.gt20.eu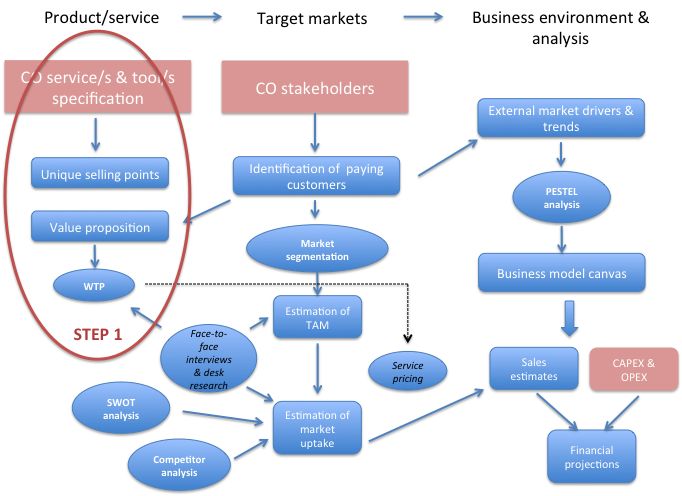
9.3 Exploitation roadmap ..................................................................................................................41
10 The OSM LULC Mapper .......................................................................................................................42
10.1 Recap ...........................................................................................................................................42
10.2 Exploitation of LUM .....................................................................................................................43
11 Overall Recommendations ..................................................................................................................43
Annex 1: Initial Methodology ......................................................................................................................45
Annex 2: Impact Questionnaire for SRoI .....................................................................................................49
List of Figures
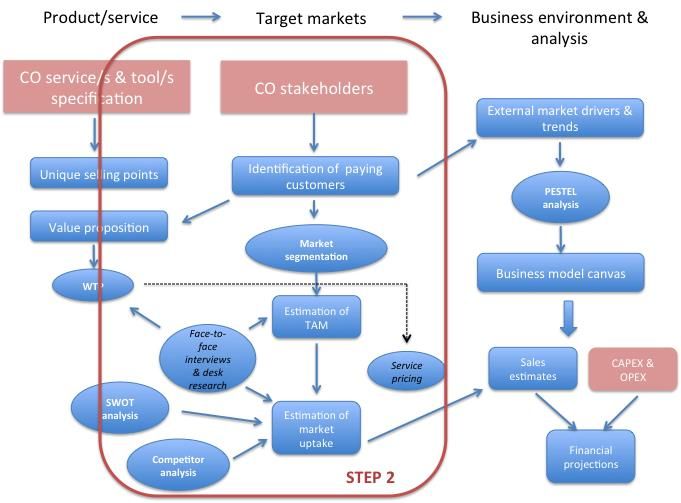
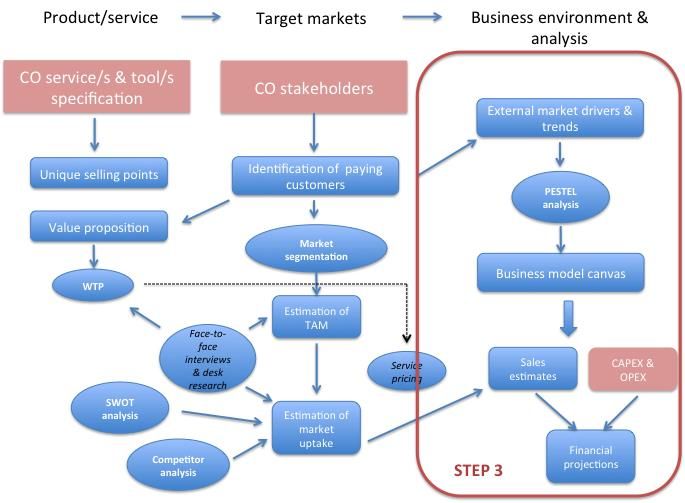
Figure 1. Contribution of the fours tasks to the final analysis and inputs from other WPs and tasks.......... 6
Figure 2. Potential revenues and costs for the quality Tool. ......................................................................37
Figure 3. Potential revenues and costs for the Co-design Methodology. ...................................................40
List of Tables
Table 1. COs and tools developed during the GT 2.0 project........................................................................ 5
Table 2. Summary of the responses of the interviewees regarding outputs, outcomes and impacts. ......10
Table 3. Summary of the sustainability outlook for the most important responsibilities of the CO. .........12
Table 4. Summary of campaigns that will be undertaken. ..........................................................................13
Table 5. Actions that need to be undertaken to ensure the sustainability of the Meet Mee Mechelen
CO. 14
Table 6. Actions that need to be undertaken to ensure the sustainability of the Klimaatrobuust Sint-
Andries CO. 15
Table 7. Summary of the responses of the interviewees regarding outputs, outcomes and impacts. ......15
Table 8. Summary of the sustainability outlook for the most important responsibilities of the CO. .........17
Table 9. Actions that need to be undertaken to ensure the sustainability of Grip of Water Altena. .........18
Table 10. Summary of the responses of the interviewees regarding outputs, outcomes and impacts. ....19
Table 11. Summary of the sustainability outlook for the most important responsibilities of the CO. .......21
Table 12. Actions that need to be undertaken to ensure the sustainability of RitmeNatura. ....................22
Table 13. Summary of the responses of the interviewees regarding outputs, outcomes and impacts. ....23
Table 14. Summary of the sustainability outlook for the most important responsibilities of the CO. .......24
Table 15. Actions that need to be undertaken to ensure the sustainability of VattenFokus. ....................26
Table 16. Summary of the responses of the interviewees regarding outputs, outcomes and impacts. ....27
Table 17. Summary of the sustainability outlook for the most important responsibilities of the CO. .......28
Table 18. Actions that need to be undertaken to ensure the sustainability of Maasai Mara. ...................29
Table 19. Summary of the responses of the interviewees regarding outputs, outcomes and impacts. ....31
Table 20. Summary of the sustainability outlook for the most important responsibilities of the CO. .......33
Table 21. Actions that need to be undertaken to ensure the sustainability of CBNRM. ............................34
Table 22. Number of potential customers. .................................................................................................36
Table 23. Actions that need to be undertaken to ensure the sustainability...............................................37
Table 24. Number of potential customers. .................................................................................................39
Table 25. Actions that need to be undertaken to ensure the sustainability...............................................41
Table 26. Number of potential customers. .................................................................................................42
2
Ground Truth 2.0 Deliverable D3.4 Exploitation Roadmap

List of abbreviations
AQ     Air quality
BMC business model canvas
CAPEX Capital Expenditure
CERT Earthwatch
CO     Citizen Observatory
CRB    Community Resource Board
CBNRM Community based natural resource management
CS     Citizen Science
CSO    Civil Society Organisation
DC     GT 2.0 Demonstration Case
DCL    GT 2.0 Demonstration Case Leader
EC     European Commission
EQL    Environmental quality of life
GT2.0 Ground Truth 2.0 project
ICT    information and Communications Technology
IPR    Intellectual property rights
LUM Land Use Mapper
LULC Land use land cover
NCRBA National Community Resource Board Association
NGO Non-governmental organisation
NRM Natural resource management
OPEX Operating expenditure
OSM Open Street Map
QoL    Quality of life
PESTEL political, economic, social, technological, environmental and legal
SP     Service provider
SRoI Social Return on Investment
SVA    Social Value Add
SVP    Social value proposition
SWOT Analysis of supplier strengths and weaknesses, and market opportunities and threats
TAM Total addressable market
TRL    Technical Readiness Level
tbc    to be confirmed
tbd    to be determined
VA      Value add
VAG Village Action Group
WB     Water Board
WP     Work package
WTP willingness to pay

                The Ground Truth 2.0 project has received funding from the European Union’s Horizon 2020
                research and innovation programme under grant agreement No. 689744. www.gt20.eu
1 Introduction
The Ground Truth (GT) 2.0 project’s vision is to develop Citizen Observatories (COs) tailored to a range of
user cases during the project duration, with the goal to expand these geographically (world-wide) and
thematically (to cover a wide range of environmental themes).
The GT 2.0 project has delivered six scaled-up citizen observatories with varying degrees of operational
conditions. The six are widely distributed geographically, with four being undertaken in Europe (Belgium,
Spain, Sweden and the Netherlands) and two in Africa (Kenya and Zambia).
The long-term sustainability of each CO depends on two aspects:
1. the long-term engagement of the community of users (including the contributions from this com-
munity in terms of information collection) and
2. the financial sustainability of the information provision via the CO platforms (the CO products and
services).
The issue of ensuring continued user engagement is covered in WP1 of GT 2.0, with the Stakeholder En-
gagement Strategy (D1.3 and D1.4), while the work presented here forms part of the second aspect and
concerns the financial sustainability of the COs.
1.1 Objectives of the WP
The objectives of WP3 are:
To clearly identify the value propostion to customers/users of the CO products and services.
To understand the markets in which the COs will be operating, in terms of structure, segmenta-
tion, size and competition.
To understand and define business models suitable for COs, taking into account the specific char-
acteristics of each of the stakeholder communities.
To develop the case for the sustainability for the six GT 2.0 information platforms, in terms of
organisational structures and funding (private or public).
To support the service providers (SPs) for the implementation of measures for long-term sustain-
ability of their platforms, and for the leverage of new market opportunities both inside and out-
side of Europe.
To achieve these objectives three main tasks were undertaken:
Market research and analysis,
Business model analysis,
Development of an exploitation roadmap.
The outcomes of the market analysis and business model analysis both form key inputs for the develop-
ment of this sustainability roadmap for each of the CO platforms. The outcomes of these specific analyses
are reported in a number of previous deliverables, including D 3.1 and D3.2 – Reports on Market Analysis
and Market Update (versions 1 and 2), and D3.3 – Sustainable Business models for the GT 2.0 prod-
ucts/services. Each CO is considered individually since they have very different product/service offerings
and target markets. Tools developed under GT 2.0 that potentially have commercial value are also con-
sidered, such as the Land Use Mapper, the GT 2.0 Methodology and the Quality Tool.
4Ground Truth 2.0 Deliverable D3.4 Exploitation Roadmap
1.1.1 Purpose and scope of this document
The purpose of this report is to outline the activities or roadmap that are required for the exploitation of
the COs and tools developed during the GT 2.0 project. These COs and tools are summarised in the table
below:
Table 1. COs and tools developed during the GT 2.0 project.
Name Type Topic for data collection City or location Country
Meet Mee Mechelen CO Air quality (& noise) Mechelen Belgium
Klimaatrobuust Sint- CO Heat stress Sint-Andries,
Andries Antwerp
Grip op Water Altena CO Pluvial flooding Altena The Netherlands
RitmeNatura CO Phenological observations Catalonia Spain
VattenFokus CO Water quality Lake Dunkern, Sweden
Södermanland
County
Maasai Mara CO Natural Resource Management Maasai Mara Kenya
conservancy
area
National CBNRM CO Natural Resource Management (national scope) Zambia
Quality Tool web tool Verification of data collected by n/a n/a
citizens
Co-design Methodol- methodology For the implementation of co-de- n/a n/a
ogy signed projects
OSM LUM web tool Land use and land cover mapper n/a n/a
By roadmap, we refer to a plan that outlines the short, medium and long-term activities that should be
undertaken by each of the community partners or service providers to achieve the goal of exploitation of
the COs or tools. This report comprises a dedicated chapter for each of the COs and tools/methodology
listed in the table above.
On the topic of exploitation of the COs, we have to admit to naivety at the start of the project for thinking
that the COs would attract private investment and revenues through subscriptions, etc. When it became
obvious to the team such ‘commercial’ returns were very unlikely, we changed our approach to put more
emphasis on the social value add (from for example environmental benefits) and wider public good as-
pects of the COs. It became clear that the value of the CO outcomes is significant when considering the
social dimension, and thus it made more sense to evaluate the social return on investment (SRoI) of the
COs, rather than their potential financial return on investment. Thus we started moving away from think-
ing about commercial exploitation and towards a search for public funding to sustain the platform and
operations of the CO. This is coherent with the approach that public good initiatives should be funded
from the public purse, in whatever shape the funding may take.
Besides an analysis of the financial sustainability of the COs, we have also taken into account other activ-
ities that are necessary to ensure that the COs are ‘kept alive’ or sustained. These include sustainability
of the data/information platforms that have been developed, continuation of the data collection cam-
paigns by citizens (regular campaigns or on an ad-hoc basis), and the endurance of the CO community or
The Ground Truth 2.0 project has received funding from the European Union’s Horizon 2020
research and innovation programme under grant agreement No. 689744. www.gt20.eugroup of stakeholders. These aspects have been included in the roadmaps of each of the COs and are
discussed more in depth in the sections below.
In contrast, the GT2.0 Co-design methodology and the Quality Tool are products and services that can be
commercialised, and we have defined exploitation roadmaps for them with the aim of running a profitable
business. These business cases are based on their target markets, their total number of potential custom-
ers (total addressable market) and an estimated increase in number of customer year on year (market
uptake). Once service pricing and costs are included in the mix, the annual revenues can be estimated.
1.1.2 Links with other WPs
The diagram below illustrates how the four tasks undertaken by WP3 contribute to this final analysis, but
also how this strongly relies on inputs from other WPs and tasks, especially WP1 (for stakeholder analysis
and stakeholder engagement).
Figure 1. Contribution of the fours tasks to the final analysis and inputs from other WPs and tasks.
1.2 Methodology and activities undertaken
During the initial years of the GT 2.0 project, the focus was on the co-design and specification of the COs
with the core stakeholders. Once the functional design of the COs was completed, the products and ser-
vices offered by the COs were specified and this allowed the WP3 team to start their analyses on the
benefits or value-add that these would offer their end-users or customers.
WP3 also built upon the stakeholder analysis and the functional definition of the six citizen observatories
(reported in D1.1 and D1.5). The next step was to research and analyse the markets in which the COs
operate. The aim was to attain that market size estimates together with information on who would be
willing to pay for such products and services. This, together with estimates of the costs and revenues (or
funding), would inform the exploitation potential of the COs.
6Ground Truth 2.0 Deliverable D3.4 Exploitation Roadmap
In parallel an investigation was undertaken to identify the most appropriate business models for operat-
ing the CO platforms. This was a challenge in light of the fact that COs are relatively new to the realm of
environmental information service provision, and that they have strong social value or public good di-
mension. Thus, WP3 adopted the non-profit business model canvas (which includes social value proposi-
tion, indirect beneficiaries and social return on investment (SRoI) aspects), to accommodate the specific
characteristics of the COs, e.g. the key partners or core stakeholders are also beneficiaries of the CO. See
D3.3 for details.
1.3 Lessons learnt and revision of our approach
Initially WP3 planned to follow a traditional marketing approach to the exploitation of the COs, which is
outlined in Annex 1. In practise, we had to adapt this approach significantly during the project as it turned
out to be a poor fit. Here we outline the key lessons learnt and the adaptations that we applied during
our analysis.
1.3.1 Market analysis and exploitation
Desk research was carried out to analyse the markets for the CO products and services, especially with
regard to the market size, e.g. the number of conservancy areas in Zambia and Kenya. The total address-
able market (TAM) figures were obtained in this way, but these proved less useful than in a traditional
market analysis as the local focus of the COs did not lend itself well to upscaling, but rather to geo-repli-
cation, i.e. replication of the CO for another city or region. This information and data on the market op-
portunities for each of the CO platforms and the GT2.0 Methodology and Quality Tool is presented in
deliverable D3.2 – Update report on market analysis and market uptake. Similarly, the SWOT, PESTEL and
competitor analyses turned out to be an interesting exercise for an in-depth understanding of the COs,
but it did not lend itself to estimation of the market uptake. This is probably due to the fact that market
uptake, in its traditional sense, is not really applicable to COs which are principally driven by the commu-
nities involved. In retrospect it would have been better to consider the factors that drive community ex-
pansion, as this would better reflect the potential growth in size of the CO.
In lieu of market uptake, we did consider two ways in which COs can expand – either thematically, to
include other environmental thematic areas, or geographically, towards other cities, counties or regions.
Thematic expansion is possible within the COs as they have been initially developed with a limited number
of environmental parameters in mind. Geographic expansion is more challenging for the six COs of GT 2.0,
since many have (by design, or by co-design in this case) a local focus which the core stakeholders want
to retain (as this is seen as a key advantage of the COs). Thus, rather than geographic expansion of the
individual COs, we considered geographic ‘replication’ of the COs – i.e. a copy of the CO based in another
city, region or country. This might not apply to the whole CO platform, but it could apply to the front-end
of the CO platform – such that the user ‘sees’ (through the user interface) only a local system and local
data.
On the topic of exploitation, we were initially naive in thinking that the COs would attract significant pri-
vate investment, as well as accrue revenues from CO subscriptions or for the provision of information
services. This approach was however thwarted by a number of factors:
The communities were strongly against investment by the private sector, as this would undermine
the goals of keeping the CO independent and the information impartial.
The value propositions of the COs have a strong social dimension related to improved environ-
mental stewardship and management.
The Ground Truth 2.0 project has received funding from the European Union’s Horizon 2020
research and innovation programme under grant agreement No. 689744. www.gt20.eu It is mainly citizens and the public sector that will benefit from the information collected and col-
lated on the platforms.
The non-profit business model canvas was more applicable to the COs.
Over time it become clear to us that true ‘exploitation’ of the COs – in that the COs would be operated as
‘profitable’ businesses – was unlikely. Thus, we scaled our expectations back to them being run on a basis
more akin to organisations or foundations with charitable or social advocacy /environmental goals. In
retrospect this now seems rather obvious. Thus, in this analysis, our focus changed from exploitation to
ensuring financial and social sustainability of the COs.
1.3.2 Financial sustainability
It was essential to consider some financial figures, even if they are not part of a business plan per se. It is
still essential that the operating costs of the COs are estimated such that it is known what level of funding
will be required to sustain the CO – albeit from social enterprises or the public purse. It should be noted
that for the COs, their development costs have not been taken into consideration in our analysis. Normally
these would be considered under CAPEX or capital costs, but in all cases the development was paid for
under the GT2.0 project budget and therefore can be considered as a sunk cost.
Potential business models for each of the COs have been developed, and in all cases a non-profit model
was applied, as explained above. This exercise was carried out around six months before the end of the
project, and at this stage there were a large number of uncertainties surrounding the future ownership
and financial support for the COs. For this reason, a number of options for each CO were presented in
D3.3 with a view to a positive outcome for hand-over of each of the information platforms by the demo
teams before the end of the project in December 2019. In this next step, and profiting from the progress
made in many of the COs, we asked the teams to identify the most likely scenario from future ownership
of the CO and how its continued operations will be funded. This is reported for each of the COs in Chapters
2-7.
1.3.3 Social sustainability
The social sustainability of the COs is dependent on the benefits or value-add that the stakeholders will
accrue from having an on-going and operational CO. The non-profit business model canvas (BMC - eluci-
dated in D3.3 for each CO) includes the social value proposition (SVP) or value-add, but it also considers
non-financial outcome streams. This is considered as important as revenues for the standard BMC, as it
quantifies, as far as possible, the social value that is delivered. This in turn can be used to justify a request
for public support and funding for the continuation of the CO.
To estimate these non-financial outcomes, the team had to apply a new methodology. We considered the
Value of Information (VoI) and the contingent valuation methods, but choose the methodology described
in ‘Measuring Social Value – A social metric primer1’ with its focus on stakeholders. This seemed to be
well aligned with the participatory design principles of the COs and the extensive involvement of the core
stakeholders. In addition, it is aimed at organisations that have a triple bottom line in that they blend
three different values – economic, social and environmental outcomes, which fits well with the COs de-
veloped in this project.
The first step in this approach is to define and identify the stakeholders – an exercise carried out already,
with great depth from the beginning in WP1. These key stakeholders are then asked to identify their inputs
1
B.Bhatt and T. Hubb, Carleton Centre for Community Innovations, Carleton University, Canada, 2013
8Ground Truth 2.0 Deliverable D3.4 Exploitation Roadmap
(or resource contributions) to the CO, the outputs of the CO, the subsequent outcomes (defined as the
short to medium term effect of the outputs) and then finally the long-term impacts of the CO. In a final
step, financial proxy or contingency values were given to these impacts (as far as possible) to give an
indication of the social return on investment (SRoI) of the CO. It should be noted that this SRoI value, is of
particular importance when seeking public funding for the COs and for justification of the amount of fund-
ing sought.
To this end, WP3 carried out face-to-face interviews with a range of stakeholders from each of the six
COs. The aim was to get different views on the potential impact of the CO from the triumvirate of stake-
holders (i.e. citizens, policy makers and data aggregators). See Annex 2 for the impact questionnaire that
guided these interviews which was based on insights (namely, expected outcomes and impacts of the
COs) produced by WP1 and reported in D1.7 Initial report incentives and barriers and D1.11 Initial valida-
tion and socio-economic impacts report. The interviewees needed to be strongly involved in the develop-
ment of the COs, very well informed on the objectives and the outputs, and thus only 2-4 interviews were
carried out for each CO. Thus, we have to stress that the outcome of this analysis is purely indicative of
the extent of the SRoI rather than attempting to be a definitive estimate.
A minor modification was made to this methodology in that we categorised the outcomes according to
those that are knowledge & inspiration outcomes and those that are actionable, in order to be coherent
with the reverse impact journey exercise that was carried out by WP1 for all the COs through the co-
design methodology developed throughout the project.
The final step is to put a financial ‘proxy’ value on the long-term impacts of the CO, i.e. to translate the
non-monetary value of the impact into monetary value or proxy for the stakeholders. One way of doing
this is through contingent valuation or value-based monetarisation. This method links a value to an impact
(that does not have a direct market price or cost price) by assessing how people value the solution through
their willingness to pay or willingness to accept it.
We have included this analysis in this report – with the principal aim of comparing this value to the esti-
mated costs of keeping the CO operational. Clearly if the social value outweighs the operational costs,
then it makes sense to keep the CO sustained.
1.4 Community sustainability
As explained above, the financial support of the CO by the institutions that have agreed to take over
ownership of the CO, is key. However, platforms, websites and agreements are not the only thing that
keeps a CO running. One of the most critical aspects of keeping the COs ‘alive’ is the sustainability of the
community that took part in the co-design process and that drives the CO. During the project, considera-
ble coordination and dissemination effort was undertaken by the project partners, but the majority of
project partners will no longer have a mandate to do so after the project ends. It is critical that it is recog-
nised by the new owners that considerable effort is needed to sustain the CO community and to keep the
citizens engaged. This aspect has also been considered and analysed in-depth for each CO under the Stake-
holder Engagement task of WP1, and is reported in D4.1 – Updated Engagement Strategy.
1.5 Exploitation of the GT 2.0 tools and methodology
When it comes to the GT2.0 tools (Quality tool and LUM) and Co-design Methodology, here we can talk
about exploitation in the traditional sense, and the marketing aspects of product, price and promotion
can be defined. Here it also makes sense to consider the total addressable market (TAM), i.e. all potential
users of these tools, and to estimate the likely year on year uptake by customers of these tools. For these,
the market-based and business case methodologies, detailed in Annex 1, can be applied.
The Ground Truth 2.0 project has received funding from the European Union’s Horizon 2020
research and innovation programme under grant agreement No. 689744. www.gt20.euIn D3.3, the standard BMC (business model canvas) was developed for the two tools and the Co-design-
Methodology. For all three, there is no product pricing per se, i.e. a standard product will be made avail-
able without charge, but the customer is offered consultancy services (at a price) for customisation or for
support in applying the tools or Methodology.
In D3.2 (Updated Report on Market Analysis and Market Uptake), an analysis of these tools is presented,
(e.g. market segmentation, value-add, SWOT, PESTEL and competitor analyses), allowing us to define the
TAM and consultancy pricing. Now in a final step, we have estimated the potential market uptake over
the next few years and the promotion activities that are needed to support this. This is presented in Chap-
ters 8-10.
2 Sustainability of Meet Mee Mechelen CO
2.1 Social return on investment
For the analysis of the Meet Mee Mechelen CO we managed to conduct four interviews, three with citi-
zens representing various local community groups and one with an individual from the Mechelen munic-
ipality. For the citizens, their inputs mostly concerned their voluntary time dedicated to the measurement
campaigns and information meetings. For the municipality, their inputs were more onerous and including
staff time of 1-2 days a month and the production of promotion materials of around €1,000 per year.
In the table below, we present a summary of the responses of the interviewees regarding outputs, out-
comes and impacts:
Table 2. Summary of the responses of the interviewees regarding outputs, outcomes and impacts.
Outputs Data on soot/black carbon (BC) levels in the city, showing pollution hotspots
Open information events held to inform the wider community on air quality
in the city
Knowledge and Inspira- Evidence to pressure the municipality to take action regarding pollution
tion OUTCOMES hotspots
Raise awareness and urgency of air quality problems
Open discussions between citizens and the municipality of Mechelen on sus-
tainable mobility in the city centre
Action OUTCOMES Management plans by the municipality to extend the car-free zones in the city
Behaviour change on the part of citizens to use bicycles rather than their cars
for trips into the city centre
Long term IMPACTS Improved air quality in the densely populated city centre.
Inspiration for other cities for follow suite.
Quantitative estimate 5-40% reduction in traffic in the city centre, leading to improved air quality
of impacts
% attributable to the 25% of the reduction in soot levels in the city centre
CO
Note that for this analysis we have assumed that the above-mentioned action outcomes will be under-
taken for the impacts to be realised. Consequently, we also recognise that the full extent of the impact
10Ground Truth 2.0 Deliverable D3.4 Exploitation Roadmap
cannot be solely attributed to data/information provided by the CO, but that the can play a significant
role in CO contributing to these outcomes and impacts – especially considering that the information pro-
vided often forms the starting point for discussions on future management plans. For Meet Mee Meche-
len the stakeholders estimated that 25 % of the improvement in air quality in the city centre could be
attribute the existence of the CO.
To estimate the ‘proxy’ value of this extent in air quality improvement, we researched the willingness for
people to pay for a reduction in air pollution. The most appropriate estimate we found was from paper
by Istamto et al.2 , where citizens in a number of central European countries3 were willing to pay around
€ 100/year/person for a reduction in air pollution of 50%. (A study in Poland indicated €60/year/person4).
If the former is extrapolated to the city centre of Mechelen with its population of 85,700 (in 2017), the
citizens would be willing to pay €8.6 M per year for such a 50% improvement in air quality. Considering
that only an 18% improvement on air quality is envisaged for Mechelen (taken from the 5-40% estimate
above), this reduces this overall value to around €3M per year, of which 25% or €771,000/year can be
attributed to the CO. Thus, we estimate that the SRoI of the Meet Mee Mechelen is around €0.8 M per
year for the city of Mechelen. This ‘theoretical’ estimate of the public good for the CO, exceeds the
amount of funding that will be sought from the City of Mechelen to continue the air quality monitoring
campaigns (of €5,000 to €7,500 biannually – see section below), by more than a factor of 10.
2.2 Most likely sustainability scenario
The sustainability of the Meet Mee Mechelen CO and platform has been agreed, in that it will be handed
over to Klimaan – klimaan.be . Klimaan is a broader citizen initiative run by a Flemish group of volunteers
that are concerned with ‘common goods’ such as (healthy) air, (clean) water, land, renewable energy,
(local) healthy food, open data, information, knowledge, etc. Management of these are carried out by
citizens who are supported by the community.
Meet Mee Mechelen becomes a working group on Air Quality within Klimaan, thereby strengthening
Klimaan but still keeping the CO citizen driven – representing a win-win situation for both parties. An
agreement was reached in Klimaan in October 2019, but the physical migration of the data and content
of the CO to Klimaan remains to be carried out. In the hand-over, the main change concerns the role of
the experts from the GT2.0 team and the role of city of Mechelen. The team aims for a smooth continua-
tion with keeping up frequent contacts with the municipality of Mechelen.
It is likely that the air quality (AQ) monitoring campaigns will continue in order to monitor the impact of
new implemented policies. Klimaan will request funding for this from the municipality and VITO will or-
ganise these campaigns with funding from the Flemish Government (Science and Innovation Department)
on a project by project basis. It is estimated that the AQ campaigns will take place every second year, and
that in 2022, heat stress monitoring will also start in Mechelen. These activities are summarised in the
table below.
2
Multi-country willingness to pay study on road-traffic environmental health effects: are people willing and able to provide a number?, Istamto
et al, Environmental Health 2014 13:35
3
UK, Finland, Germany, The Netherlands and Spain
4
Measuring the Willingness to Pay for Improved Air Quality: A Contingent Valuation Survey, Magdalena Ligus, Pol. J. Environ. Stud. Vol. 27, No.
2 (2018), 763-771
The Ground Truth 2.0 project has received funding from the European Union’s Horizon 2020
research and innovation programme under grant agreement No. 689744. www.gt20.euTable 3. Summary of the sustainability outlook for the most important responsibilities of the CO.
Key activities Responsible entities Associated costs Sources of funding
Handover of Meet Mee Mechelen VITO and Klimaan n/a GT2.0 project
data and information to the Klimaan budget
platform
Hosting, operations and mainte- Klimaan - RESCOOP5 Europe
nance of the platform
Leasing of sensors for AQ and noise Mechelen munici- (included in cam- (see below)
(from VITO) pality paign costs)
Air Quality monitoring campaigns Klimaan and VITO €10,000 – 50% funded by
every two years in Mechelen 15,000/campaign Mechelen city and
50% by Flemish gov.
Heat stress campaigns in Mechelen Klimaan and VITO €10,000 – 50% city funding
every two years, starting in 2022 15,000/campaign (from Mechelen
city), 50% funding
by Flemish gov.
Thus, VITO foresees their continued involvement and an increase in their project business by €5,000 –
7,500 € every year from the Science and Innovation Department of the Flemish Government.
2.3 Market expansion
In D3.2 – Updated Report on market analysis and market uptake, we reported on the thematic and geo-
graphic expansion opportunities for Meet Mee Mechelen. At this point in time, geographic and thematic
expansion had already been realised, in that VITO set up a CO concerning heat stress in a suburb of Ant-
werp, Sint-Andries.
Mechelen is also interested in the monitoring of temperatures and heat stress in the most densely popu-
lated areas and it is estimated that this could start as early as 2022. The monitoring of noise pollution,
which was planned for inclusion under the original Belgium demo case, has not yet been realised but
neither has this idea been scrapped by the Mechelen municipality as it is an important aspect of their city
mobility initiative. It is thus highly likely this topic will be introduced under Klimaan. However, thematic
expansion to mapping of green areas in Mechelen is unlikely since the municipality of Mechelen is already
doing this under another initiative.
There is a likelihood of geographic expansion to other Belgian cities, albeit not high, since many other
cities are developing climate adaptation plans, and also due to the fact that air quality is increasingly
moving higher on the agenda of policy makers as well as citizens. Geo-replication to another city in a
neighbouring country, such as Amsterdam is also thought likely, as the local government there is already
considering plans for city mobility and improving routes for urban cycling and walking paths.
Klimaatrobuust Sint-Andries
The demand/request for a CO to monitor extreme heat events in urban areas came to the attention of
VITO from a very active citizen group in the Sint-Andries quarter of Antwerp. Due to the lessons learned
in setting up the Meet Mee Mechelen CO, the team could compress the process for Sint-Andries into a
shorter time scale and the Klimaatrobuust Sint-Andries CO was realised in 2019. In this way, these two
COs have been developed synergistically over the last year of the GT2.0 project. The VITO team foresees
5
Rescoop.eu
12Ground Truth 2.0 Deliverable D3.4 Exploitation Roadmap
the continuation of this CO through embedding the CO into the citizen organization Klimaatrobuust Sint-
Andries, partly with funding support from the Stadslab2050 initiative of the City of Antwerp. The local
community have happily taken responsibility for ‘maintaining’ the CO under the auspices of the Stadslab
2050 web site - https://stadslab2050.be/klimaatadaptatie/klimaatrobuust-sint-andries.
Active members from the local community carried out temperature monitoring campaigns in Sint-Andries
during the summers of 2018 and 2019, using advanced digital thermometers6. It is expected that from
2021, such campaigns will be rolled out to other quarters of Antwerp (45 in total). It is expected that
similar campaigns, not only for heat stress, but also for water resilience and greening of gardens
(green/blue measures), will be undertaken. Such campaigns will be undertaken every year at a cost of
around €10,000 to 15,000, with 50% of the funding coming from StadsLab Antwerp and 50% from the
Flemish government through project work by VITO.
Table 4. Summary of campaigns that will be undertaken.
Key activities Responsible entities Associated costs Sources of funding
Hosting of the data Stadslab2050 (short- Stadslab2050 existing
term) budget for their web-
Klimaatrobust Sint- €20-30/year site
Andries (longer term)
Leasing of sensors from VITO Antwerp City (included in campaign (see below)
costs)
Implementation of early warning Klimaatrobust Sint- around €30,000 Antwerp City
system for heat stress (Hitteverk- Andries and Antwerp
likker) City
Heat stress and other CS campaigns Local community €10,000 – 15,000 50% city funding
in Antwerp every year (Sint-Andries) and /campaign (from Burger-
VITO begroting7 Antwerp),
50% funding by Flem-
ish gov
Once again VITO will benefit from this CO by receiving additional funding from the Flemish government
for projects related to heat stress.
2.4 Roadmap for sustainability
Meet Mee Mechelen CO shows a strong social/public good value, and this strongly justifies its public sup-
port. However, the biggest challenge for Meet Mee Mechelen lies in the competition for government
funding from many other ‘green’ initiatives. On the positive side, the Flemish Department of Environment
(LNE) is looking to support local initiatives that will improve the EQL (environmental quality of life) for
citizens in Flanders, and once the Meet Mee Mechelen and Sint Andries COs are sustainable, they will
show convincing outcomes to gain funding from the public sector.
6
Wet bulb globe temperature sensor
7
Budget set aside for citizen initiatives
The Ground Truth 2.0 project has received funding from the European Union’s Horizon 2020
research and innovation programme under grant agreement No. 689744. www.gt20.euKlimaan has agreed to owning and hosting the platform, and the municipality is likely to fund around 50%
of the future measurement campaigns (with the other 50% coming from the Flemish Department of Sci-
ence and Innovation). VITO will stay involved through project budgets from the Flemish government for
organising the campaigns and providing their tools and apps.
Here we present the various actions that need to be undertaken to ensure the sustainability of the Meet
Mee Mechelen, in light of it being subsumed into the Klimaan sphere.
Table 5. Actions that need to be undertaken to ensure the sustainability of the Meet Mee Mechelen CO.
Actions to CO platform Data collection CO community
sustain
Short-term Transfer of data and con- Organise and info event regard-
(until end of tent to the Klimaan plat- ing the hand-over to Klimaan
project) form
Medium-term Find a ‘home’ or location Leasing of sensors by city of Ensure that Mechelen munici-
(next 1-2 on the Klimaan web site Mechelen from VITO for Air pality remains involved through
years) for reporting on noise ‘pol- Quality the city’s Environment Advisory
lution’ or disturbance Board project-based meetings
Run an air quality monitoring
campaign every two years Continuation of the construc-
tive relationship with the city of
VITO to support with organisa- Mechelen
tion of monitoring campaigns
and obtaining funding of up to Organise regular information
50%) from the LNE (Flemish events (on AQ and noise) to en-
gov) sure that citizens remain ac-
tively involved
Run the first noise monitoring
campaign in Mechelen Citizens to lobby city of Meche-
len and follow political ad-
vancements
Citizens to promote CO on so-
cial media
Long-term Organise heat stress monitoring Propose heat stress monitoring,
(2022 on- campaigns every two years or of other topics, to citizen
wards) groups in Mechelen
Verify the impact of changes in
implemented policies on mobil-
ity in Mechelen
Here we present the various actions that need to be undertaken to ensure the sustainability of the
Klimaatrobuust Sint-Andries CO. As mentioned before, sustainability of this CO is very likely due to hosting
by the citizen organization and partial funding from Antwerp’s Stadslab 2050 initiative, and continued
support from VITO through projects funded by the Flemish government.
14Ground Truth 2.0 Deliverable D3.4 Exploitation Roadmap
Table 6. Actions that need to be undertaken to ensure the sustainability of the Klimaatrobuust Sint-Andries CO.
Actions to CO platform Data collection CO community
sustain
Short-term Finalise discussion on sus- Local community members Find a sustainable working rela-
(until end of tainability of data and infor- with support from VITO tionship between the Sint-An-
project) mation dries community, the city of
Antwerp and VITO
Medium-term Find a ‘home’ for reporting Local community members Explore the possibility of includ-
(next 1-2 on heat stress monitoring with support from VITO ing other possible partners if
years) campaigns need be
Leasing of specialised sensors
Transfer of data and infor- by Antwerp City or citizens Actively lobby city of Antwerp
mation to Stadslab 2050 and follow political advance-
web site, or other city, open Annual data collection cam- ments
access web site paigns in Sint-Andries
Organisation of meetings to
Create communication and plan campaigns and inform citi-
promotional materials zens
(Klimaatrobust Sint-Andries)
Long-term Maintain data and infor- Run data collection campaigns Involve local communities from
(2022 on- mation in other quarters of Antwerp the other quarters of Antwerp
wards)
Expand data and infor- Verify the impact of changes in
mation repository with data implemented policies on
from other areas of Antwerp green/blue measures in the
quarters of Antwerp
3 Sustainability of Grip op Water Altena, Netherlands
3.1 Social return on investment
For the Dutch CO, three interviews were undertaken, one with a concerned citizen, one each with the
representatives of the municipality and the Waterboard. In the table below, we present a summary of the
responses of the interviewees regarding outputs, outcomes and impacts:
Table 7. Summary of the responses of the interviewees regarding outputs, outcomes and impacts.
Outputs Observations during heavy rainfall events
Information on measures citizens can take to minimise flooding
Data and information on projects from the Waterboard and municipality (e.g.
wetlands outside of the urban areas)
Knowledge and Inspira- Understanding the situation in the event of heavy rainfall
tion OUTCOMES Evidence – showing an example of regional based work
Awareness of local measures that can reduce pluvial flooding, e.g. through
collaboration with local specialists in garden design
Awareness – improvement in the image/visibility of the work done by the Wa-
terboard and municipality re mitigation of flooding
The Ground Truth 2.0 project has received funding from the European Union’s Horizon 2020
research and innovation programme under grant agreement No. 689744. www.gt20.euAction OUTCOMES Improved decision making and management plans by the municipality and
WB
Behaviour change on the part of citizens, inspire them to take their measured
on their own properties
Community action – creation of a network of professionals/local specialist
and citizens
Long term IMPACTS The area is better prepared for heavy rains and thus less damage caused by
pluvial flooding
Gardens will be ‘greener’ (reduction in sealed surfaces) and more rain re-
sistant
Quantitative estimate Flood event in 2014/2015 damaged 100 properties with an average overall
of impacts cost around €500,000
€20 M has been invested by municipality of Altena on measures to reduce the
damage caused by pluvial flooding (including enlargement of sewer systems,
dredging water cannels to improve discharge, creation of wetland outside ur-
ban areas)
% attributable to the 5%
CO
We estimated that the economic loss of around €500,000 in damage was caused by the last pluvial flood-
ing in Altena. If a CO can reduce this even by a small amount (e.g. €25,000), this still compares favourably
with the associated costs of hosting the website – see below (€20-30/year). Efforts to improve the man-
agement of the risk of pluvial flooding should be undertaken by the Water Boards, municipalities and
citizens alike.
3.2 Most likely sustainability scenario
At the time of writing the different scenarios of continuing Grip op Water Altena (Deliverable 3.3), it was
not yet clear how the CO would be sustainable after the project. In the summer of 2019 the conversations
with the CO member on this topic continued, and fortunately a framework for continuation emerged.
Grip op Water will continue as a working group under the Agrarische Natuurvereniging Altena (ANV -
Agricultural Nature Organization). It will be an umbrella platform for all the different organizations and
citizens within Altena that deal with water and climate. The principal activity of the platform would be to
discuss and align goals & activities.
The municipality and the water board will still be involved in Grip op Water. For the municipality Grip op
Water is a good channel to communicate with the citizens. For the Waterboard, Grip op Water is a useful
network to keep in contact with the Land of Heusden en Altena. They are keen on making their data and
information available to the public. This will benefit them in a number of ways: they will save staff time in
responding to citizens’ questions and complaints and they see Grip op Water Altena as a means to reach
out to and involve more citizens (coherent with the Dutch government’s new policy). At this stage, citizens
are less interested in monitoring water levels or water on the streets, but they are keen on taking preven-
tative actions in their own gardens. This is also due to the fact that heavy rains which cause floods have
not occurred in the past few years.
The plan is to organize two group meetings per year (organized by the water board and ANV). The website
and communication channels will be maintained by enthusiastic volunteers, with support from ANV, the
16Ground Truth 2.0 Deliverable D3.4 Exploitation Roadmap
municipality and the water board. A commitment has been expressed for a period of two years, after
which the CO and its sustainability will be evaluated.
Because the Grip op Water platform is using existing licenses (from the water board) for HydroNET and
ESRI storymaps, the only cost to be financed by Grip op Water, is the hosting of the website.
At the moment the ANV is taking lead in organizing a meeting in January 2020 with all stakeholders to
discuss the next steps.
Table 8. Summary of the sustainability outlook for the most important responsibilities of the CO.
Key activities Responsible entities Associated costs Sources of funding
Hosting and maintaining the plat- Volunteering citizens €20-€30 per year Municipality/ANV and
form (website + Storymaps) (hosting service) Waterboard
licences of HydroNET
and ESRI storymaps
are available from Wa-
terboard
Organizing Grip op Water meetings ANV and Water board - -
Promotion of Grip op Water and working group Depending on means Municipality/ANV
events of promotion (e.g. so-
cial media, flyers, etc.)
3.3 Market expansion
The geographical coverage of the focus region within the Rivierenland area includes the municipalities
Aalburg, Werkendam and Woudrichem, which merged from January 2019 to form the Altena municipality.
Besides these 3 municipalities, the Rivierenland WB includes a large area of another 29 municipalities,
which could be a possibility for expansion. This would imply geo-replication of the platform (or at least
replication of the front end), such that the local focus of Grip op Water Altena is not lost.
Further expansion to other water boards is possible in light of the fact that between 1986 and 2009 the
total damage from pluvial flooding was €674 million8 in the Netherlands.
In D3.2 – Updated Report on market analysis and market uptake, we considered the option of expanding
the thematic topics of Grip op Water Altena to water quality and river flooding but this depends on the
level of interest in these topics by the citizens.
3.4 Roadmap for sustainability
Here we present the various actions that need to be undertaken to ensure the sustainability of Grip op
Water Altena. The planning of these actions is already taking place.
8
https://ore.exeter.ac.uk/repository/bitstream/handle/10871/17835/J%20Susnik%20et%20al%20Eindhoven_revised_1.pdf;sequence=1
The Ground Truth 2.0 project has received funding from the European Union’s Horizon 2020
research and innovation programme under grant agreement No. 689744. www.gt20.euYou can also read