The Cassava Monitoring Survey in Nigeria - IITA
←
→
Page content transcription
If your browser does not render page correctly, please read the page content below
The Cassava Monitoring
        Survey in Nigeria
    Tesfamicheal Wossen, Gezahegn Girma, Tahirou Abdoulaye, Ismail Rabbi,
       Adetunji Olanrewaju, Jeffrey Bentley, Arega Alene, Shiferaw Feleke,
Peter Kulakow, Godwin Asumugha, Adebayo Abass, Mark Tokula and Victor Manyong

                                                              www.iita.org
ii
The Cassava Monitoring
      Survey in Nigeria

  Tesfamicheal Wossen, Gezahegn Girma, Tahirou Abdoulaye,
Ismail Rabbi, Adetunji Olanrewaju, Jeffrey Bentley, Arega Alene,
      Shiferaw Feleke, Peter Kulakow, Godwin Asumugha,
       Adebayo Abass, Mark Tokula and Victor Manyong

           International Institute of Tropical Agriculture, Ibadan.

                               February 2017

                                      i
Published by the International Institute of Tropical Agriculture (IITA)
Ibadan, Nigeria. 2017
IITA is a non-profit institution that generates agricultural innovations to meet Africa’s most pressing
challenges of hunger, malnutrition, poverty, and natural resource degradation. Working with various
partners across sub-Saharan Africa, we improve livelihoods, enhance food and nutrition security,
increase employment, and preserve natural resource integrity. It is a member of the CGIAR System
Organization, a global research partnership for a food secure future.
International address:
IITA, Grosvenor House,
125 High Street
Croydon CR0 9XP, UK
Headquarters:
PMB 5320, Oyo Road
Ibadan, Oyo State
ISBN 978-978-8444-81-7
Correct citation: Wossen, T., G. Girma, T. Abdoulaye, I. Rabbi, A. Olanrewaju, J. Bentley, A. Alene,
S. Feleke, P. Kulakow, G. Asumugha, A. Abass, M. Tokula and V. Manyong. 2017. The cassava monitoring
survey in Nigeria final report. IITA, Ibadan, Nigeria. ISBN 978-978-8444-81-7. 66 pp.
Printed in Nigeria by IITA
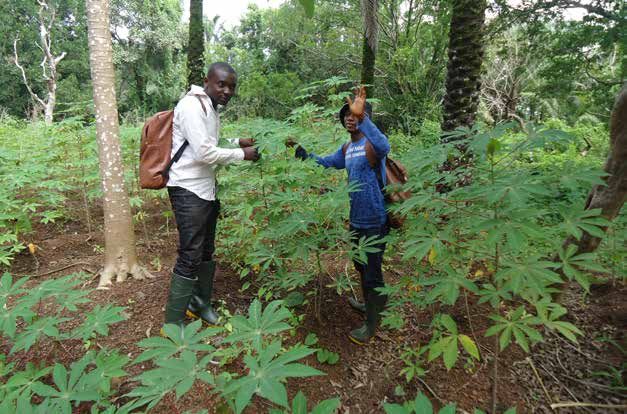
Cover photo: A survey enumerator measuring a cassava field with handheld Global Positioning System
and recording data into a computer tablet.
iiii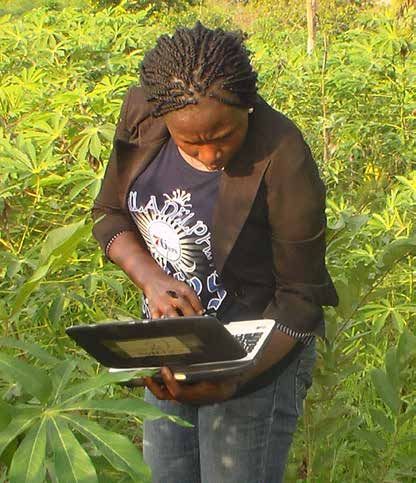
Contents
Acronyms .................................................................................................................................................... vii
Acknowledgements.................................................................................................................................... viii
Executive summary........................................................................................................................................i
Project milestones.........................................................................................................................................1
     General introduction.............................................................................................................................1
     Data collection instruments and sampling strategy..............................................................................3
		         Developing the sampling frame....................................................................................................3
		         Sample selection..........................................................................................................................4
		         Training of survey enumerators and pretesting of data collection instruments............................4
		         CMS data collection and Collaboration with partners...................................................................5
     Project outcomes..................................................................................................................................6
Component 1: Large-scale household survey ..............................................................................................7
     Adoption of improved cassava varieties...............................................................................................8
     General preferred traits of cassava......................................................................................................8
     Agronomic practices, access to information and planting material.....................................................10
     Access to planting material and duration analysis..............................................................................11
		         Access to improved planting materials.......................................................................................11
		         Extension and credit access.......................................................................................................13
		         Membership of social networks and associations......................................................................15
     Utilization of cassava ........................................................................................................................15
     Disadoption among farmers................................................................................................................17
     Variety-specific trait preference heterogeneity....................................................................................17
		         Production traits..........................................................................................................................17
		         Processing traits.........................................................................................................................17
		         Consumption traits......................................................................................................................17
     Determinants of adoption and disadoption: econometric analysis......................................................19
     Results on the determinants of adoption............................................................................................21
     Determinants of disadoption...............................................................................................................23
Component 2: DNA-based varietal identification using SNPs ....................................................................25
     Introduction.........................................................................................................................................25
     Overview of the DNA fingerprinting workflow......................................................................................26
     Main activities in the DNA fingerprinting component..........................................................................26
		         Sample and sample associated data collection..........................................................................26
		         Establishment of sample tracking system..................................................................................26
		         Summary on the samples collected ...........................................................................................27
		         DNA extraction and genotyping by sequencing .........................................................................27
		         Development of a reference library for varietal identification .....................................................28
		         Bioinformatics.............................................................................................................................29
		         Distance threshold to establish criteria to determine identical sets of genotypes......................31
		         Cluster analysis..........................................................................................................................32
		         Matching farmers’ varieties to those in the reference library......................................................32
     Extent of improved and/or released varieties on farmers’ field across all samples investigated
		         based on DNA fingerprinting.......................................................................................................35
     Farmers’ variety matching released varieties.....................................................................................36
     Frequency of varieties in the collection...............................................................................................38
     Geographical distribution of the identified varieties............................................................................39
     Comparison of adoption rates based on matched self-reported and DNA data.................................40
     Extent of adoption of improved varieties based on matched CMS-DNA data....................................40
     Determinants of adoption using matched CMS-DNA data..................................................................43
     Who are the farmers that correctly identified improved varieties?......................................................46
Component 3: GPS-assisted area measurement........................................................................................47
     Why GPS-assisted area measurement?............................................................................................47
Component 4: Gender-differentiated end-user surveys on varietal and trait preferences...........................51
     What farmers like about the varieties they grow.................................................................................51
     What farmers like in specific varieties.................................................................................................51
     Improvements farmers want in the varieties they grow......................................................................52

                                                                            iii
                                                                            iii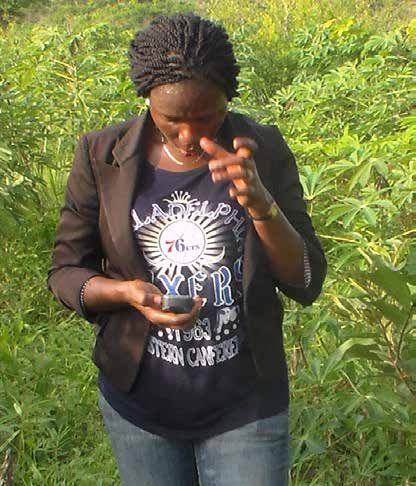
General preferences for cassava traits...............................................................................................53
     Gender differences.............................................................................................................................54
     Processing traits are more important for women than for men...........................................................54
     Access to planting material.................................................................................................................55
     Access to cassava seeds...................................................................................................................56
     Disadoption of cassava varieties........................................................................................................57
     Does gender based preference heterogeneity affect adoption decision.............................................58
     Econometric analysis on gender-disaggregated data.........................................................................59
Reference ....................................................................................................................................................61
Appendix ....................................................................................................................................................63

Tables
1.      CMS study regions and states in Nigeria............................................................................................... 3
2.      Adoption rate of improved cassava varieties in 2015 (%)...................................................................... 9
3.      Data on cassava varietal trait preference (%)........................................................................................ 9
4.      Fertilizer application, plot management and soil fertility status (%)..................................................... 10
5.      Source of planting material for improved cassava varieties................................................................ 11
6.      Year of first planting an improved variety (% of farmers)..................................................................... 11
7.      Planting material replenishment rate................................................................................................... 12
8.      Contact with extension agents (%)...................................................................................................... 12
9.      Extension service on farm work and cassava production.................................................................... 14
10.     Sources of credit.................................................................................................................................. 14
11.     Credit access for cassava related activities......................................................................................... 14
12.     Community-based associations (%).................................................................................................... 15
13.     Cassava utilization (%)........................................................................................................................ 16
14.     Share of cassava income from total household income...................................................................... 16
15.     Share of cassava from total household food consumption.................................................................. 16
16.     Reasons for disadoption (%)............................................................................................................... 18
17.     Most preferred production traits........................................................................................................... 18
18.     Preferred processing traits by household heads (%)........................................................................... 18
19.     Preferred consumption traits by household heads (%)........................................................................ 19
20.     Descriptive statistics............................................................................................................................ 20
21.     Determinants of adoption..................................................................................................................... 21
22.     Determinants of disadoption................................................................................................................ 24
23.     Total number of samples collected from the respective region, enumeration area and household..... 27
24.     Summary on the number of samples genotyped by sequencing......................................................... 28
25.     List of genotypes in the reference library matching farmers’ field collected varieties with its
        respective genetic group, release information and improvement status.............................................. 33
26.     Percentage of improved and/or released varieties on the farmer’s field based on DNA fingerprinting....... 36
27.     List of released cassava varieties in Nigeria and matching with the current collection....................... 37
28:     Categories used for defining improved varieties based on DNA fingerprinting results........................ 41
29.     Misclassification rate............................................................................................................................ 43
30.     Regional misclassification rate based on household level adoption rate............................................. 43
31.     Determinants of adoption..................................................................................................................... 44
32.     Determinants of correct classification.................................................................................................. 46
33.     GPS vs self-reported........................................................................................................................... 47
34:     Distribution of measurement errors by land decile.............................................................................. 48
35.     Trait preferences by women and men in Nigeria................................................................................. 53
36.     Access to cassava seed by women and men in Nigeria...................................................................... 56
37.     Descriptive statistics for gender based preference.............................................................................. 58
38.     Probit results on gender based trait preference................................................................................... 60
39.     Land use characteristics...................................................................................................................... 63
42.     Participation in cassava project........................................................................................................... 64
43.     Assessment of the socioeconomic status of the community................................................................ 64
44.     Availability of cassava stems market................................................................................................... 64
45.     Means of transport to the local market................................................................................................ 64
46.     Quality of roads to the main market..................................................................................................... 64
47:     Changes in the cassava based system in the last five years.............................................................. 65
48.     Average price of cassava roots and stems.......................................................................................... 66

                                                                            iv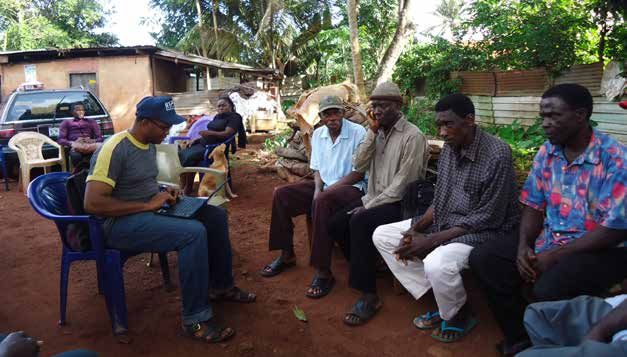
Figures
1:    Study areas of CMS............................................................................................................................... 4
2:    Number of sequence reads across genotyped samples. The dashed red line indicates
      the minimum pass count...................................................................................................................... 28
3:    A neighbor-joining tree consisting of a reference library of diverse genotypes of multiple sources..... 29
4:    Schematic representation of the TASSEL-GBS Discovery Pipeline adapted from Glaubitz et al. 2014. ......... 30
5:    The TASSEL-GBS production pipeline and its relationship with discovery pipeline. .......................... 31
6:    Established criteria for determining identical sets of clones based on 89 samples genotyped in duplicates.... 32
7:    The TMS versus TME cluster groups. The red bars represent the genetic gain whereas the blue bars .........
      represent IITA germplasm collection ....................................................................................................... 32
8:    Hierarchical cluster of 11,302 accessions representing both the CMS collection and the reference library..... 33
9:    Number of samples matching released varieties................................................................................. 36
10:   Major and minor cultivars growing in the four study regions................................................................ 38
11:   Major varieties with frequency of greater or equal to 100.................................................................... 38
12:   Number of varieties growing in all the regions, three of the regions, two of the regions
      and only in one of the four regions...................................................................................................... 39
13:   Number of different varieties growing across the four study regions................................................... 39
14:   Frequency and geographic distribution of cultivars across the study regions..................................... 37
15:   Adoption rate based on matched CMS-DNA data............................................................................... 40
16:   Intensity of adoption based on matched CMS-DNA data...................................................................................42
17:   Distribution of GPS and self-reported area.......................................................................................... 49
18:   Correlation between GPS-based plot area and self-reported plot area............................................... 49
19:   Distribution of measurement biases.................................................................................................... 50

                                                                       v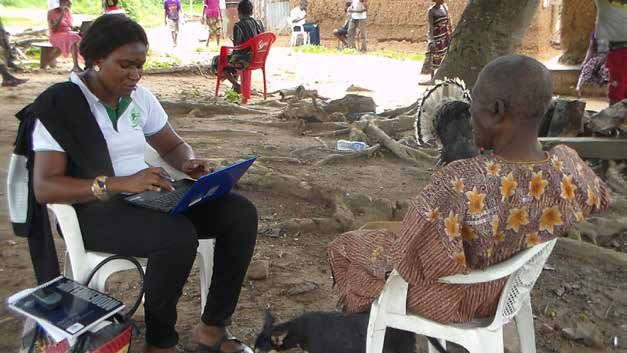
iv
vi

Acronyms

ADP      Agricultural Development Project/ Agricultural Development Program
BNARDA   Benue State Agricultural and Rural Development Authority
CMS      Cassava Monitoring Survey
DNA      Deoxyribonucleic acid
FGD      Focus group discussion
GBS      Genotyping by sequencing
GDF      Genomic diversity facility
GPS      Global positioning system
IBS      Identity by state
IITA     International Institute of Tropical Agriculture
LGA      Local government area
MAF      Minor allele frequency
M&E      Monitoring and evaluation
NARS     National agricultural research systems
ng/μl    Nano gram per micro liter
NRCRI    National Root Crops Research Institute
OAU      Obafemi Awolowo University
QC       Quality control
RTB      CGIAR Research Program on Roots, Tubers and Bananas
SNP      Single nucleotide polymorphism
TME      Tropical Manihot esculenta. A group of early improved varieties
TMS      Tropical Manihot species

                                             vii
Acknowledgements
Funding for this study came from the CGIAR Research Program on Roots, Tubers and Bananas
(RTB), and the Bill & Melinda Gates Foundation (BMGF) through the Cassava Monitoring Survey
CMS project at IITA. The authors would like to thank Dr Graham Thiele, Director of RTB, Dr Laurence
Kent, and other Gates Foundation staff (past and present) for their guidance and encouragement
during the design and implementation of CMS. They especially thank Jared Jones (former Gates
Foundation) and Elvis Fraser of Gates Foundation for their support and guidance throughout the
implementation of the CMS project. The contributions of all the participants of the Nigeria Cassava
Monitoring Convening Workshop organized, 15–21 March, 2015 by BMGF in Dar es Salam, Tanzania
are gratefully acknowledged. The contributions of Dr Alfred Dixon, Dr Holger Kirscht (former IITA
staff), Mr Henry Musa Kpaka to the conceptualization and design of the CMS project are also
gratefully acknowledged. The contribution of the National Roots Crops Research Institute, Umudike,
Nigeria and other local partners to the success of the CMS Project is also acknowledged. The
enumerators, extension agents, and IITA staff from socioeconomics, bioscience and cassava breeding
units are recognized and thanked for their contributions. A special thanks to all the farmers and other
people who generously gave their time for the interviews.

                                                  viii
Executive summary
The Bill & Melinda Gates Foundation (BMGF) and the CGIAR Research Program on Roots, Tubers
and Bananas (RTB) cofunded the Cassava Monitoring Survey (CMS) project with the objective
of documenting the extent of adoption of improved cassava varieties with a rigorous sampling
and DNA based identification of improved varieties in Nigeria. For examining the determinants of
adoption, the project undertook the following four major tasks: (i) Large-scale household (HH) survey
(2500 households from the states responsible for 80% of cassava production in Nigeria), (ii) DNA-
based varietal identification using single nucleotide polymorphism (SNP), (iii) GPS-assisted area
measurement and (iv) gender-differentiated end-user surveys on varietal and trait preferences. This
Executive summary presents the main results from each component.
i) Results from large-scale household survey
Results from CMS showed that 60% of farm households have adopted improved cassava varieties
in Nigeria. The distribution of adoption by gender also revealed that the adoption rate among
male-headed households (MHHs) was about 61.5% while among female-headed households
(FHHs) it was relatively low, about 48.6%. The adoption rate across the different regions of the
country showed a large spatial heterogeneity. In particular, adoption rates were as high as 79% in
the Southwest region but only about 31% in the Southeast. In terms of preference heterogeneity,
more than 70% of the farmers considered varietal traits such as quality of garri or fufu/akpu, high
root yield, big root size, high market demand, and early maturity as very important. In addition,
a substantial share of respondents considered traits such as storage, white root color, and pest
and disease resistance as very important. However, more than 40% of the farmers reported
varietal traits such as yellow root color, root shape, starch content, and good tapioca taste as
not important. Based on farmers’ self-reported data, the main determinants of adoption can be
categorized into the following groups:
(i) Information market imperfections: Both extension access and mobile ownership positively
affected the probability of adopting improved varieties
(ii) Credit market imperfections: Both access to formal credit sources and membership of social
networks that relax credit market constraints such as membership in informal Savings and
Credit associations as well as membership in cooperatives affected the probability of adopting
improved varieties positively.
(iii) Labor market imperfections: Households with a large size are more likely to adopt improved
varieties, suggesting that availability of labor affects the probability of adoption positively.
(iv) Heterogeneity in plot fertility and management: We found that soil fertility and plot
management are important determinants of adoption. In particular, farmers are less likely to
grow cassava on plots of medium fertility compared with highly fertile plots. Moreover, farmers
are more likely to adopt improved varieties on plots managed by men or jointly by men and
women compared with the plots managed by women.
(v) Trait preference heterogeneity: Individual preference heterogeneity in improved varieties
affected adoption decisions. For instance, farmers who perceived traits such as quality of
garri, root yield, and early maturity as highly important are more likely to adopt improved
varieties. Surprisingly, we found a significant and negative effect for the trait, starch content.
This might be due to the lack of local processors for starch. The major determinants of
disadoption included the following: distance to market, lack of planting material, availability of
better improved varieties, and pest and disease problems.
ii) Results from DNA-based varietal identification using SNPs
While combining DNA fingerprinted data with the CMS socioeconomic data, average adoption
rates tended to be similar. Even though the average adoption rates between farmers’ self-reported
and DNA fingerprinted data seem similar, the misclassification rate is large. Misclassification
ixhappens when farmers who think they are growing improved varieties actually grow local varieties
or when farmers who think they are growing local varieties actually grow improved varieties.
Therefore, for examining the determinants of adoption, the measurement of “improved varieties”
matters as the determinants of adoption are different while using farmers’ self-reported and DNA
fingerprinted data. Three sources of heterogeneity largely explain the probability of correctly
classifying cassava into improved and local varieties. These include level of education, access to
information (such as mobile phone ownership and access to extension access), membership of
formal and informal organizations, and location.
iii) Results from Global Positioning System (GPS)-assisted area measurement
In terms of GPS-based cassava plot measurement, we found that GPS-based area measurements
and those based on self-report from farmers produce different results. In particular, farmers
overestimated the size of small farms and underestimated the size of large farms. The
measurement error (the discrepancy between GPS-assisted and self-reported areas) is normally
distributed.
iv) Gender-differentiated end-user surveys on varietal and trait preferences
Our findings from focal group discussions confirm that farmers like varieties that are high-yielding
(with many big roots), especially if the cassava tolerates poor soil, early maturing (but they may
also need some that are late maturing for food security (especially if late maturing cassava stores
better underground) and varieties that store underground for a long time. Even though regional
heterogeneities are large, we found traits that are common in all regions. Thus, farmers want high
yielding, early maturing cassava that stores well underground. The Southwest expressed a need
for cassava that controls weeds, and the North wanted cassava with resistance to mealybugs. The
South-South wants varieties that tolerate poor soil. In addition, we also found important gender
differences in trait preferences. In particular, women want cassava that is easy to peel. This is by
far the most important gender difference. In the Southwest and the North, men asked for markets
for cassava roots but women had little or no trouble in selling their finished products, such as garri.
Both women and men in all regions were eager to try improved varieties. However, farmers were
not using more improved varieties because of a lack of access to planting material. If improved
planting material were more widely available, farmers would experiment with it and probably adopt
many varieties. Disadoption occurs for local varieties. Occasionally an early improved variety has
been disadopted, after 20 or 30 years.
Furthermore, our gender-disaggregated econometric analysis on data from spouse and household
head revealed that preference trait heterogeneity between the spouse and household head affects
adoption decisions differently. We found that important traits such as early maturity, quality of fufu
and garri, root yield and storability have statistically significant effects on the adoption decision of
both the spouses and household heads. However, traits such as stem yield, poundability, and pest
and disease resistance affected the adoption decision only of spouses whereas the trait, ease of
loading, affected the adoption decision only of household heads. These results underscore the fact
that asking the spouse and household head the same question could result in different determining
factors of adoption. For some traits such as tapioca taste, effects were positive and significant
when using responses from spouses but negative and significant when using responses from
the household heads. Consequently studies that assume a unitary (male) decision-maker as the
basis of their analysis may miss some underlying factors. The importance of each factor on the
adoption decision of the household head/spouse depends on their individual relative importance in
agriculture related activities.
Project milestones
xGeneral introduction
The Cassava Monitoring Survey in Nigeria (CMS) was designed to assess the adoption of improved
cassava cultivars and reveal the drivers of adoption and disadoption in Nigeria, the largest producer of
cassava in the world. Focusing on cassava, this report examines the following empirical questions.
i) What are the levels of adoption of improved cassava varieties?
ii) What are the factors driving adoption and disadoption of improved varieties of cassava?
iii) What are the preferences of different end users for varietal attributes in terms of production,
processing, and consumption traits?
iv) Are there gender differences associated with varietal adoption, preferences and adoption
pathways?
Understanding how and why households decide what varieties to adopt is crucial for ex-post impact
assessment of adoption. In this project, we combined a large household (HH) survey, DNA-based
varietal identification, GPS-based area measurement, and gender-disaggregated trait preferences
to answer these policy relevant questions. The report gave special attention to individual preference
heterogeneity for cassava traits as it affects adoption decisions through various channels (Useche
et al. 2009; Useche et al. 2013; Bajari and Benkard 2005; Hensher et al. 1999; Ladd and Suvannunt
1976). New and improved cassava varieties could, for example, reduce cooking time or have a
long/short growing period, and these considerations factor into the adoption decisions of farmers
(Useche et al. 2009; Useche et al. 2013). Especially in the context of Nigeria, genetic improvements
on cassava can affect the taste of edible cassava varieties, which can then affect farmer utility
and thus adoption. As such, ceteris paribus, adoption decision of a new cassava variety may be
different for two similar individual farmers as traits may differentially affect their food consumption
habits. In this project, by explicitly accounting for trait preferences, we draw conclusions that help
policymakers to develop targeting interventions for addressing supply-side constraints (for example,
credit, infrastructure, or market failure, as well to identify the specific cassava varieties that fit the
circumstances of farmers (demand-driven breeding) instead of advocating a “one size fits all”
intervention (supply-driven breeding).
In an attempt to circumvent traditional survey-based measurement errors in varietal identification
and area measurement, this project further implemented two novel approaches: DNA-based varietal
identification and GPS-based cassava plot measurements. Ex-post assessment of adoption rates
and the benefits of adoption heavily rely on farm household surveys. However, the magnitude of
measurement errors and self-reported bias in adoption surveys has never been taken into account,
leaving the bias (direction) and standard errors (magnitude) of existing adoption studies unknown. In
addition, the bias in the magnitude and direction of reported regression coefficients for supply-side
constraints emanating from measurement errors is also widely unknown (Maredia & Reyes 2015). The
main sources of measurement errors in self-reported adoption rates include seed contamination by
dealers or farmers and inability of farmers (extension agents) to correctly identify what is an improved
vs. a traditional variety. Irrespective of the source of the bias, the wrong identification of varieties
creates a problem in identifying the appropriate treatment and counterfactual group for possible
impact evaluation as well for correctly identifying the main determinants of adoption and disadoption.
In the presence of measurement errors (even after controlling for endogeneity), reported estimated
effects capture the pure technological effect plus random/systematic measurement error effects
(Manski 2004; Bulte et al. 2014; Chassang et al. 2015; Aldashev et al. 2016; Lewbel 2007; Hasselt
and Bollinger 2012). The use of data from DNA-based varietal identification can produce credible
point estimates for the pure technological effect by eliminating possible measurement and self-
1reported biases. Failure to address the problem of bias (when bias is systematic) may lead to wrong
conclusions and policy interventions, especially when targeting is needed. Even worse is when
heterogeneity effects are considered in terms of gender or assets along the income distribution. For
instance, the effect of credit or access to extension on technology adoption could have a wrong sign
and magnitude if the bias from self-reported adoption surveys is large enough. In addition, reported
impacts on yield/income could well be wrong if improved varieties are wrongly recorded as traditional
and vice versa.
However, there is a caveat in using DNA-based varietal identification as a benchmark due to the
inherent behavioral adjustment of farmers based on their own subjective self-assessment of a
variety (Bulte et al. 2014). This is the case as productivity of a certain variety depends not only on
the technology itself but also on the use of complementary inputs such as fertilizer, labor, or irrigation
(Bulte et al. 2014; Chassang et al. 2015). While using DNA-based varietal identification data, certain
dimensions of the farmer’s efforts are unobservable which leads to biased causal inference (De
Janvry et al. 2011; Bulte et al. 2014). For instance, conditioning for all other confounding factors, a
given farmer will certainly allocate more labor and fertilizer and apply better management techniques
for an improved variety than a traditional variety. Since the level of efforts and field management
of plots depends on a farmer’s own perceptions and beliefs, caution is needed in using DNA
fingerprinted results as a benchmark for impact assessment. In an effort to minimize the two sources
of bias (self-reported from survey data and behavioural adjustment from DNA fingerprinted data), we
used a unique data set that combines self-reported and DNA-based adoption rates to provide robust
results on the determinants of adoption.
Another related measurement error is related to plot measurement. In the mainstream development
economics literature the inverse relationship between farm size and productivity is taken as a stylized
fact (Collier 1983; Van Zyl et al., 1995; Barrett 1996; Kimhi, 2006; Barrett et al. 2010; Carletto et al.
2013; Dillon et al. 2016; Holden &Fisher 2013). However, such relationships are mostly based on
self-reported area measurement, which is prone to measurement errors. In many household surveys,
farm sizes are measured by simply asking farmers to estimate the area of their farm plots. While this
approach is simple and inexpensive (in terms of money and survey time), it may produce imprecise
values for many reasons: Firstly, most farmers have limited understanding of the purposes of surveys.
As such they may report wrong values if they perceive that the information collected by enumerators
is used as a basis to take away their land as part of a large land re-distribution policy (Dillon et al.
2016; Holden and Fisher 2013). This is the case in the context of many developing countries as land
tenure systems are quite fragile or non-existent. Secondly, due to a low level of formal education and
underdeveloped land markets, farmers are often unfamiliar with standard units of area measurement
(Dillon et al. 2016). Even when local units of measurement are used, conversion to standard area
measurement units is also prone to errors. Therefore, estimates of farm size based on self-reporting
could be considered inaccurate. However, these errors can be consequential as ex-post assessment
of the benefits of adoption relies heavily on the accurate measurement of land size and production
values.
In an effort to measure the level of measurement errors, the CMS project introduced Global
Positioning System (GPS)- based area measurement in Nigeria. This serves to measure the
magnitude of self-reported bias as well as to undertake a credible causal analysis of the determinants
of adoption. This is particularly important as the discrepancy between self-reported and GPS-based
area values may become substantial and in some cases may vary by farm size or level of formal
2education.
Data collection instruments and sampling strategy
1
Working with all the partners on the project, the CMS questionnaire and the Surveybe programming
were finalized in May 2015. Key project staff and survey enumerators had been recruited in April 2015
and were trained on the use of Surveybe software. The data collection instruments were pre-tested
during the training of the enumerators 20–22 May 2015. Given the more technical requirements of
the type of data to be collected for the CMS project, a strong emphasis was placed on the recruitment
of enumerators with at least a first university degree (BSc/BA) to participate in data collection.
Furthermore, the project’s field materials were procured including a van for fieldwork, computer
tablets, and others materials.
Developing the sampling frame
The list of enumeration areas (EAs) for conducting the national census in Nigeria was obtained from
the National Population Commission of Nigeria (NPCN). The EA list was obtained for the 16 states
that contribute at least 80% of the total production of cassava in Nigeria. The states cut across four
geopolitical regions (Table 1). Relying on agricultural development programs (ADPs) in the targeted
states, a prior visit was made to each of the selected EAs to develop the lists of all cassava growing
households. This lists provided a sampling frame for the selection of at least 50 cassava growing
households in each EA, of which five household heads and two spouses were interviewed. This
exercise facilitated the unbiased selection of samples for the final interviews. Furthermore, this prior
visit also provided an opportunity to brief the sampled EAs on the CMS project and to help the staff
of the ADPs that would finally provide guidance to the CMS survey teams to locate the randomly
selected EAs.
Table 1. CMS study regions and states in Nigeria.
s/n Region States
1 Southwest Ogun
2 Southwest Ondo
3 Southwest Oyo
4 Southwest Ekiti
5 Southwest Osun
6 North Kaduna
7 North Nasarawa
8 North Taraba
9 North Benue
10 North Kogi
11 Southeast Enugu
12 Southeast Imo
13 Southeast Anambra
14 South-South Cross River
15 South-South Akwa Ibom
16 South-South Delta
1 It is a type of computer-assisted personal interview software.
3Sample selection
As mentioned earlier, this survey used a multistage clustering sampling design, stratified by four
well-established geopolitical regions of Nigeria: Southeast, South-South, Southwest and North. Each
region had a sample size of 125 EAs. Furthermore, from each EA, random samples of 50 cassava
growing households were selected for interview, and five out of the 50 were finally interviewed. This
gave a total of 625 households that were interviewed in each region. In line with the initial proposal,
interviews were conducted with 2500 randomly selected cassava growing households in the major
cassava growing states in the four geopolitical regions of Nigeria that together account for over 80%
of the annual total cassava production (See Fig. 1). The initial plan was to restrict data collection to
the states in the North Central only; however, because Kaduna State (in the Northwest) and Taraba
State (in the Northeast) were evidently among the states that account for 80% of the total cassava
production in Nigeria, they were included in the study. Their inclusion gave an opportunity to collect
data whose analysis and results can be extrapolated to cover the entire northern region.
Training of survey enumerators and pretesting of data collection instruments
The CMS project organized a 3-day training workshop from 20 to 22 May 2015 for the survey
enumerators that would carry out data collection. A total of 60 survey enumerators were trained on the
campus of IITA in Ibadan and provided a pool of enumerators that were used for data collection. The
training was one of the most important components of the prerequisites for the successful use of the data
collection tool (i.e., Surveybe program) and the collection of high quality data. The training workshop
Figure 1. Study areas of CMS.
The points on the map represent the distribution of the HHs across the four study regions.
4Picture 1. A cross-section of survey enumerators during the training on CMS research approach and the
use of Computer Assisted Personal Interview tools.
equipped participants with practical skills on the use of Surveybe software for socioeconomic data
collection, the methods of collection and preservation of cassava samples for DNA analysis, the use
of GPS for area measurement, and training on the use of agronomic traits to differentiate the various
cassava cultivars on-farm. The training participants undertook a one-day field visit to three cassava-
producing communities around Ijaye town in Oyo State (30 km drive from IITA Headquarters) on Day
2 of the training workshop (21 May 2015). The objectives of the field visit were to pre-test the survey
instrument, allow the enumerators to practice everything that they had learned at the workshop, and
undergo testing on the use of GPS and methods of DNA sample collection. The practical exercises during
the field visit provided an opportunity for IITA to assess training outcomes. Furthermore, a post-field
assessment session also gave an opportunity to the enumerators to receive feedback on their individual
and group performances. The best of the enumerators were allowed to participate in the final survey.
CMS data collection and Collaboration with partners
Data collection began in June 2015 and ended in September 2015. Surveys were enumerated at
two levels: Household and village. Implementation of all project activities involved the engagement
and collaboration with NARs in Nigeria. IITA collaborated with the National Root Crops Research
Institute (NRCRI), Umudike, on the development of the survey instruments, selection and training of
enumerators, field data collection, and project management. IITA collaborated extensively with ADPs
in all 16 states on field data collection and the management of social and cultural relationships with
the study communities. Furthermore, IITA collaborated with Cornell University’s Genome Diversity
Facility on the analysis of DNA samples collected from the fields of interviewed farmers. We further
undertook a qualitative case study in selected locations on gender differences and gendered decision-
making in collaboration with international consultants to capture the role of gender in adoption and
get a deeper understanding of adoption pathways, varietal preferences, and traits. Other end users
that were involved in this segment of the study include a large number of commercial processors
(medium-to-large scale or fully mechanized processors of garri, flour, instant fufu, native starch,
ethanol, and feeds) whose preferences differ from those of households.
5Picture 2. Survey enumerators carried out community social mobilization before starting interviews.
Project outcomes
As mentioned in the introduction and the Executive summary, the project has the following four major
components: Part I: Large-scale household survey (2500 households from the states responsible for
80% of cassava production in Nigeria), II: DNA-based varietal identification using SNPs, III: GPS-
assisted area measurements, and IV: Gender-differentiated end-user surveys on varietal and trait
preferences. In the following section, we document the results from each component of the project.
6Component 1: Large-scale household survey
Take-home message:
• On average, about 60% of farmers have adopted improved cassava varieties. Adoption rates
across the different states of the country suggest a large spatial heterogeneity. In particular,
adoption rate reaches as high as 79% in the Southwest region but was only about 31% in the
Southeast.
• In terms of preference heterogeneity, more than 70% of the farmers considered varietal
traits such as quality of garri or fufu/akpu, high root yield, big root size, high market demand,
and early maturity traits as very important. In addition, a substantial share of respondents
considered traits such as storage, white root color, and pest and disease resistance as very
important. However, more than 40% of the farmers reported varietal traits such as yellow root
color, root shape, starch content, and good tapioca taste as not important.
• The main determinants of adoption of improved cassava varieties can be categorized
into the following groups: (i) Information market externalities: Both extension access and
mobile ownership affect the probability of adopting improved cassava varieties positively. (ii)
Credit market externalities: Both access to formal credit sources and membership in social
networks that relax credit market constraints such as membership in informal saving and
credit associations as well as membership in cooperatives affect the probability of adopting
improved cassava varieties positively. (iii) Labor market externalities: Households with large
household size are more likely to adopt improved cassava varieties. (iv) Heterogeneity in plot
management: We found that soil fertility and plot management are important determinants
of adoption. In particular, farmers are less likely to grow cassava on plots of medium fertility
compared with highly fertile plots. Moreover, farmers are more likely to adopt improved
varieties on plots managed by men or jointly by men and women than on plots managed by
women only. (v) Preference heterogeneity: farmers who perceive traits such as quality of garri,
root yield, and early maturity as highly important are more likely to adopt improved varieties.
Surprisingly, we found a significant and negative effect on adoption for the trait starch content.
• The major determinants of disadoption include the following: distance to market, lack of
planting material, availability of better improved cassava varieties, and pest and disease
problems.
In Nigeria, achieving food security requires new and productive investments, innovations, and
policy actions in agriculture since it is the predominant sector on which the majority of food insecure
households directly depend for their livelihood (Koundouri et al. 2006; Alene et al. 2007; Alene and
Coulibaly 2009; Alene 2010; Dercon and Christiaensen 2011; Suri 2011; Alene et al. 2012). One
particular intervention in this regard is the widespread dissemination of new varieties as cassava is
the most important food crop in the country (Abdoulaye et al. 2014). However, despite considerable
efforts to improve productivity through the sustained promotion of new and improved cassava
varieties, adoption rates have not been well documented (Abdoulaye et al. 2014). Moreover, there
is scant empirical work and literature on the main determinants of adoption. One source of problems
in identifying the determinants of adoption in the context of Nigeria is the lack of data at varietal
level. Given the large gaps in the existing adoption databases for crop genetic improvement and
policy-oriented research, the CMS project collected data at varietal level which will be important for
updating the adoption database of improved varieties and for unpacking the determinants of adoption
and disadoption. The International Institute of Tropical Agriculture (IITA) has invested substantially in
generating improved cassava varieties in the past, but the extent of diffusion of such improved cassava
technologies at varietal level has hardly been documented (Abdoulaye et al. 2014; Alene et al. 2012).
7Picture 3. A survey enumerator conducting village level Focus Group Discussion with farmers in the
Southeast.
These diffusion data on new cassava varieties are particularly important, since there is at present
hardly any nationally representative data to document adoption and diffusion levels. Unpacking the
determinants of adoption and disadoption is also crucial to identify options and to design “best fit
interventions” instead of “one size fits all” interventions in the cassava sector. However, it must be
noted that the outcome of this report is not an end in itself. Instead it is an instrument that answers
questions relevant to policy using empirical data to support decision-makers in allocating resources
in the most efficient way. This is particularly important since mapping possible demand-driven
intervention areas is an integral part of planning and development for any development-oriented
research institution such as IITA. With the focus on cassava, in this section we address the following
empirical questions. What cassava varieties are households using? Why are some farmers not
adopting improved cassava varieties? Why do farmers disadopt improved cassava varieties?
Understanding how and why households decide what varieties to adopt is crucial for designing
appropriate dissemination policies and for ex-post impact assessment of adoption.
Adoption of improved cassava varieties
Table 2 reports adoption rates of improved cassava varieties at country and regional levels. On
average, about 60% of farmers have adopted improved cassava varieties. The distribution of adoption
by gender reveals that the adoption rate among MHHs is about 61.5% while the adoption rate among
FHHs is relatively low (about 48.6%). Adoption rates also show a large spatial heterogeneity. In
particular, adoption rates reach as high as 79% in the Southwest region of the country while it is only
about 31% in the Southeast region of the country.
Table 2. Adoption rate of improved cassava varieties in 2015 (%).
Adoption rate (%)
Full sample (Nigeria) 59.5
North 59
Southwest 79.2
Southeast 30.7
South-South 69.4
8General preferred traits of cassava
In CMS, we also collected detailed data on varietal trait preference as it may directly affect the
adoption decision. Individual preference heterogeneity in cassava traits affects the farmer’s adoption
decision through various channels in addition to profit (Useche et al. 2009; Useche et al. 2013;
Bajari and Benkard 2005; Hensher et al. 1999; Ladd & Suvannunt 1976). Especially in the context
of Nigeria, genetic improvements on cassava can affect the taste of edible cassava varieties, which
can then affect farmer utility and thus adoption through the consumption side. The purpose of
capturing heterogeneity in varietal trait preferences is twofold: First, it helps to develop targeting policy
interventions for addressing supply-side constraints (for example, credit, infrastructure, or market
failure).
Secondly, it helps breeders to identify varieties which fit circumstances instead of advocating a
“one size fits all” intervention (demand-driven breeding). Table 3 presents data on preference
heterogeneity. This section asked households for their general trait preference for cassava.
Preferences were not variety specific. In particular, the survey instrument asked each respondent to
rank on the Likert scale the specific traits of cassava varieties from not important to very important for
their adoption decision. Our results revealed that more than 70% of the farmers considered varietal
traits such as good quality of garri and fufu/akpu, high root yield, big root size, high market demand,
and early maturity to be very important. In addition, a substantial share of respondents considered
traits such as storage, white root color, and resistance to pests and diseases as very important.
However, more than 40% reported varietal traits such as yellow root color, root shape, and good
tapioca taste as not important. It must be noted that these are indicators of correlation between
adoption decisions and trait preferences. Any causal inference for trait preference should account for
other confounding factors that also affect the adoption decision.
Table 3. Data on cassava varietal trait preference (%)
Not important Moderately important Important Very important
Makes good quality garri 3.3 2.3 13.8 80.6
High root yield 0.2 2.1 18.2 79.5
Big root size 0.4 3.4 18.1 78.1
Make good quality Fufu 4.7 3.8 15.8 75.7
High market demand 2.2 5.6 21.1 71.1
Stores well underground 3.79 5.12 23.46 67.63
White color roots 7.50 12.86 32.49 47.16
Pest and disease resistance 5.64 13.61 33.67 47.1
Early maturity 1 4.59 21.48 72.91
Yellow color 49.3 18.65 18.24 13.81
Poundability 16.6 11.44 30.06 41.9
Root shape (ease of loading) 31.16 29.06 25.55 14.23
High starch content 19.15 22.33 32.21 25.31
Good tapioca taste 43.61 9.15 19.55 27.69
9Picture 4. Interviewing a farmer using Computer Assisted Personal Interview tools in the South-South
region of Nigeria.
Overall, the data on trait preferences show that breeding programs need to account for production traits
(such as early maturity, pest and disease resistance, and high root yield), consumption traits (such
as quality of garri and fufu), market and other related preferences (such as white root color and high
market demand). However from a breeding perspective, some inherent trade-offs may exist among the
available options. As such, it is very important not only to discuss correlates in terms of trait preference
but also to unpack determinants of adoption while controlling for preference heterogeneity. Such analysis
helps in understanding the current most binding problems of adoption and ultimately contributes to the
improvement of productivity and sustainability of the existing cassava production system.
Agronomic practices, access to information and planting material
CMS collected data on basic agronomic practices such as application of fertilizer, crop and plot
management, and soil fertility status. In addition, data on planting material, membership in social
networks, and access to credit and extension were collected. In terms of inorganic fertilizer
application, our analysis revealed that about 36% of farmers apply fertilizer to cassava (Table
4). Moreover, we found a very high spatial heterogeneity as application rate is the lowest in the
Southwest (about 12%) and highest in the Southeast (about 53.9%).
Another agronomic related practice that we considered is plot management as it directly affects the
productivity level. Our survey results revealed that in about 50% of the farmer households, both husband
and wife jointly managed cassava plots. There were fewer households (16%) where women only are
Table 4. Fertilizer application, plot management and soil fertility status (%).
Cassava plot management Soil fertility status
Application of Men Women Both Poor Medium Good
fertilizer (%)
Full sample 36 35.3 15.9 48.9 2.3 23.8 73.9
North 42 41.8 4.6 53.7 0.4 16.9 82.7
Southwest 12 63.8 8.1 28 1.3 9.1 89.6
Southeast 48 23.8 25.8 50.4 3.1 36.5 60.4
South-South 37 20 20 60 3.7 26.5 69.8
10You can also read