OccupaƟ onal Outlook in Turkey - Hakan Ercan - ILO - Ankara
←
→
Page content transcription
If your browser does not render page correctly, please read the page content below
International
                             Labour
                             Organization

Occupaonal Outlook
in Turkey
Hakan Ercan

              ILO - Ankara
ILO Office for Turkey
Ferit Recai Ertuğrul Cad. No:4
06450 Oran - ANKARA
International
                     Labour
                     Organization

OCCUPATIONAL OUTLOOK
      IN TURKEY

       Hakan ERCAN

      ILO - ANKARA
Copyright © International Labour Organization 2011
First published 2011

Publications of the International Labour Office enjoy copyright under Protocol 2 of the Universal Copyright Convention. Nevertheless,
short excerpts from them may be reproduced without authorization, on condition that the source is indicated. For rights of reproduction
or translation, application should be made to ILO Publications (Rights and Permissions), International Labour Office, CH-1211 Geneva
22, Switzerland, or by email: pubdroit@ilo.org. The International Labour Office welcomes such applications.
Libraries, institutions and other users registered with reproduction rights organizations may make copies in accordance with the
licences issued to them for this purpose. Visit www.ifrro.org to find the reproduction rights organization in your country.

ILO Cataloguing in Publication Data

Ercan, Hakan

Occupational Outlook in Turkey / Hakan Ercan ; International Labour Organization. - Ankara: ILO, 2011
1 v.

ISBN: 9789220256152
ISBN: 9789220256169 (web pdf)

ILO Office in Ankara

employment / labour force participation / occupation / wages / projection / Turkey

13.01.3

The designations employed in ILO publications, which are in conformity with United Nations practice, and the presentation of material
therein do not imply the expression of any opinion whatsoever on the part of the International Labour Office concerning the legal status
of any country, area or territory or of its authorities, or concerning the delimitation of its frontiers.
The responsibility for opinions expressed in signed articles, studies and other contributions rests solely with their authors, and
publication does not constitute an endorsement by the International Labour Office of the opinions expressed in them.
Reference to names of firms and commercial products and processes does not imply their endorsement by the International Labour
Office, and any failure to mention a particular firm, commercial product or process is not a sign of disapproval.
ILO publications and electronic products can be obtained through major booksellers or ILO local offices in many countries, or direct
from ILO Publications, International Labour Office, CH-1211 Geneva 22, Switzerland. Catalogues or lists of new publications are
available free of charge from the above address, or by email: pubvente@ilo.org
Visit our web site: www.ilo.org/publns

Printed in Turkey
FOREWORD

“Occupational Outlook in Turkey”, which is one of the national level outputs of the United Nations
Joint Programme “Growth with Decent Work for All: A National Youth Employment Programme
and Pilot Implementation in Antalya”, has been prepared by Assoc. Prof. Dr. Hakan Ercan from the
Department of Economics of the Middle East Technical University to develop population, labour
force and employment related projections for Turkey by using brand new data. The report is also
intended to provide a basis for the regular publication of “Occupational Outlook” in the next years
as a sustained endeavour.

“Occupational Outlook in Turkey” has been prepared by using two-digit microdata on occupations
and economic activities obtained from the Household Labour Force Surveys conducted by the Turkish
Statistical Institute (TURKSTAT) between 2004-2010 and the “Survey on Transition of Young People
into the Labour Market” conducted by the same agency in 2009. Microdata prepared specifically for
this study with extraordinary efforts of TURKSTAT staff, in particular Enver Taştı, Head of the
Department of Social Statistics and Didem Sezer from the same Department, has been analyzed by
Assoc. Prof. Dr. Hakan Ercan to forecast occupational trends in Turkey up to year 2020.

Furthermore, two-digit microdata of Household Labour Force Survey, which was provided specifically
for this study by TURKSTAT, is now prepared annually and is accessible to anyone interested in
return for a small fee. Besides having produced “Occupational Outlook in Turkey”, providing such a
public service is also a significant achievement of the United Nations Joint Programme.

I am very grateful to Assoc. Prof. Dr. Hakan Ercan, who prepared “Occupational Outlook in Turkey”
meticulously in a long and challenging process; to Enver Taştı and Didem Sezer along with all
TURKSTAT staff involved in the preparation of the microdata; and to Ozan Çakmak, who has been
implementing the ILO components of the United Nations Joint Programme with dedication and
success.

                                                                   Ümit Deniz Efendioğlu
                                                                   Director, ILO Office for Turkey

INTRODUCTION
1. Introduction 1
2. Analysis of Population and Labour Market Trends 3
Population Trends to 2020 3
Pre-crisis (2000-07) Labour Market Trends 5
Sectoral Employment Trend 9
Education and Job Status 10
Wages and Earnings: 2004 – 2010 HLFS Microdata 11
2009 Turkstat Survey: Education – Employment Transition 14
3. Crisis Impact 16
Impact on Unemployment Duration 18
Informal Employment Trends and Crisis Impact 18
Self-Employment During the Crisis 20
Occupational Distribution, 2004-2010: Crisis Impact 21
4. Recovery and Future Trends 23
Recovery 23
Future Trends 25
Employment: Expected Changes to 2020 25
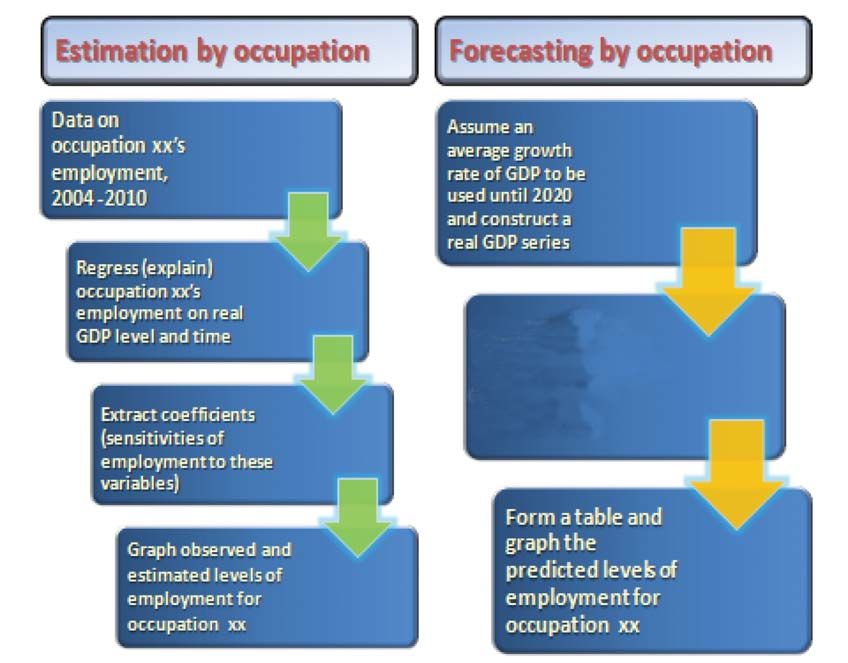
Note on the Forecasting Methodology 31
5. Conclusion 37
Bibliography 38
Appendix 40
Turkish Employment Agency’s and
Social Partners’ Perspectives On Skill Demand: What Role For Social Partners? 45
International Labour Organization

                             OCCUPATIONAL OUTLOOK IN TURKEY

                HAKAN ERCAN, MIDDLE EAST TECHNICAL UNIVERSITY, ANKARA*1

1. INTRODUCTION
This report presents basic medium-term projections of population, labour force, and industrial em-
ployment projections to 2020.2 Medium-term framework assumes that current industrial structure
will prevail along its existing growth trends.
The following quote from Lacey and Wright (2009, p.82, in an article based on their work for the
US Bureau of Labour Statistics’ Occupational Outlook ) frames this report well: “Professional and
related occupations and service occupations are expected to create more new jobs than all other oc-
cupational groups from 2008 to 2018. In addition, growth will be faster among occupations for which
postsecondary education is the most significant form of education or training, and, across all occupa-
tions, replacement needs will create many more job openings than will job growth.” Similarly, Hu-
man Resources and Skills Development Canada (2008, p. iv) expects two-thirds of all job openings
over the next ten years to be in occupations that require postsecondary education (university, college
or apprenticeship training) or in management occupations (which often require postsecondary educa-
tion). HRSD Canada (2008) expects new job creation to be weakest in occupations that require a high
school diploma or only on-the-job training.
Although the above references concern the North American market, future job growth being in ser-
vice industries, faster growing occupations being the ones that require post-secondary degrees, and
weakest job growth to be expected in low-education occupations should be easy generalizations to the
Turkish labour market. These expectations have strong implications for designing effective education
and training policies for joblessness, especially for the women and the youth in Turkey. Today’s3 sta-
tistics already hint at the current existence of the seeds of these expectations. Finding a job is easiest
for college graduates, vocational high school graduates, primary school graduates, and high school
graduates, in that order, for the young (15-29 year-old cohort). Primary school graduates in today’s
Turkey can find jobs easier than the high school graduates because their reservation wages are lower
(they accept to work for lower wages) and they are more likely to accept informal (undesirable) (im-
plicit) employment contracts. Turkey is not likely to remain an economy where such low skills will
continue to be in demand.
One must be aware of the Turkish labour market’s three inter-connected salient features. Rural-urban
migration is yet to be completed. Average education level is low. Labour force participation rates are
the lowest in the OECD region. Its female LFPR is currently 28%, which is an anomaly in its income
group of countries, upper middle income according to World Development Indicators online database
of the World Bank. Turkey kept its population in rural areas (50% urbanization rate was reached
only in the mid 1980’s) by subsidizing its agricultural sector. Through IMF-led stabilization policies,
governments gradually removed these subsidies in the last decade. Agricultural employment was
already slowly dissolving at the time. These out-migrants at best had five years of primary education
for males, and less than that for females (mandatory schooling went up to eight years only in 1997-
1   * hercan@metu.edu.tr . The author gratefully acknowledges support from the ILO Ankara Office and its former director Ms.
    Gülay Aslantepe, current director Ms. Ümit Efendioğlu, and Mr. Ozan Çakmak.
2   Population projections are those of the Turkstat. The author is grateful to Mr. Enver Taştı and Ms. Didem Sezer from Turkstat for
    their careful review of statistics in this text.
3   2009 microdata Turkstat Youth Education-Employment Transition Survey results analysed by this author, later in this report.

                                                                                                                                    1
International Labour Organization 98). In the twelve years that passed since, the average education level of the population went up to six years from five. Previous unpaid agricultural workers (unskilled women) do not participate in the urban labour market and Turkish female and thus overall participation rates keep falling as a trend. These are the underlying pre-pre-crisis (2000-07) trends. Uneducated young males could work in seasonal agriculture, construction, and tourism sectors. Young unskilled urban women could work in informal clothing and textiles or in urban personal services and retail trade. Informality in the labour market is very high. The following quote from the executive summary of World Bank (2010) defines informality as used by Turkstat and exposes the pre-crisis trend: “Although the headline measure of informality has been falling, this is almost entirely explained by migration out of ag- riculture into more formal sectors. The headline measure of informality (provided by TUIK, Turkish Statistical Institute, the proportion of workers unregistered for social security) fell from 53 % to 44 % between 2004 and 2008. However, this aggregate decline hides important patterns. Most of the decline between 2001 and 2006 is explained by migration of the workforce out of agricultural employment (where nearly all workers are informal) to manufacturing and services, mainly in urban areas (where informality rates are below 20 % for wage earners). Moreover, during this period – a period of rapid expansion of the economy – urban and non-agricultural informality increased (from 29 % to 34 % for non-agricultural employment).” Note that, Turkey is still going through its demographic transition’s final stage. This transition will be going on well into the mid 21st century (Hoşgör and Tansel, 2010, p. 14). The above dynamics thus will only slowly go away. In the meantime, thanks to increasing urbanization and slowly increasing education levels that also increase the age at first marriage, average family size has been going down (to 4.5 in 2010 from 5.6 in 1955, see Hoşgör, 2010, p.46). Turkish population growth rate has been converging to the industrial country averages. It is estimated that net reproduction rate became one in Turkey in 2010. Turkish population is now increasing because of population momentum. There are implications of the rural-urban transition not being complete, for employment. Turkish ur- ban areas should expect another ten-twelve million or so migrants from its rural areas in the coming two decades (Ercan, 2007a, Ch.2). Rural young migrate into urban areas in search of education and jobs. Rural population has thus stabilized at below eighteen million with a slightly declining trend (according to Turkstat’s downward population correction of 3.5 million in rural areas, while conduct- ing its first de jure population census in 2007). Rural population’s proportion will diminish, as only the urban population will keep rising. Presently, agricultural employment (mostly rural) almost totally lacks social security coverage. Rural- urban migrants are uneducated, they form the casual wage and self-employed segment of the urban labour force, where the first is almost fully and the latter is two-thirds informal (HLFS results, 2008). There is a strong negative correlation of education and informality in the labour market. The trend is favouring education and formal work, but this is a slow process. As things turned out from an ex- amination of microdata from HLFS, an employment impact analysis of the crisis was best conducted along the job status and occupation lines, not necessarily on the industrial composition of employ- ment (except broad-brush findings). The remainder of the report is structured as follows. Section 2 presents an overview of the pre-crisis trends and global financial crisis’ impact on employment and unemployment. This section concludes with an analysis of recovery. Section 3 analyzes recent informal employment trend and crisis impact using microdata. Section 4 discusses Turkey’s near-term outlook, with a particular focus on implica- tions for employment recovery. Section 5 concludes the report with some policy recommendations. 2
International Labour Organization

2.     ANALYSIS OF POPULATION AND LABOUR MARKET TRENDS

POPULATION TRENDS TO 2020
In the 1990 and 2000 intercensal period, Turkey’s young population (0-14 year-olds) reached its
peak at 20.0 million.According to Turkstat population projections in 2008, Turkey’s 2010 popula-
tion would be 73 million. Children (0-14) constituted 19 million of this population. In 2050, number
of children will fall to 16.6 million. Turkish population will reach 94.6 million. While the number
of children is falling, at the other end of the dependency spectrum, numbers are rising. The number
of 65+ year-olds was 5.1 million in 2010 (6.9% of the population). Their number will rise to 17.3
million in 2050 (18.3% of the population, one in five persons)! Working age population in Turkey
(15-64 years) will be rising at a decreasing rate before stabilizing in 2050. By then, the numbers in
the young cohorts of 15-24 and 25-34 will have already started to decline (in 2020 and 2030, respec-
tively). Working age population in 2010 was 49 million (67.1% of total population), and the number
in 2050 will be 60.7 million (64.2% of total population). The dependency rate will thus have climbed
from 49.2% (number of children plus the number of elderly, divided by the working age population)
to 55.8%. Therefore, Turkish young population is slightly declining, its working age population is
increasing at a decreasing rate, and its older population is rising fast. The above proportions are good
relative to the industrialized countries that have a population-aging problem. There is a downside
however. Turkish population is not well educated and its labour force participation rate is low (49%)
and it is very low for women (27%). Along with the rural-urban migration trends, these numbers paint
the long-term labour supply picture in Turkey.
Current participation ratio of 49% is thus a mixed blessing in the Turkish labour market. Given the
current education trends where continuation rate after the mandatory eight years is 50% (according to
the Ministry of National Education’s, MoNE’s online statistics) and employment growth trends, a ris-
ing participation rate would increase the unemployment rate. This is because, in the next ten to fifteen
years, Turkish employment creation capacity will not be sufficient (see the next section). On the other
hand, Turkey is sidelining half of its working age population (and three quarters of its women). This
surely must have consumption and growth implications. The key challenge for Turkey is thus how
not to miss its once-and-for-all demographic window of opportunity. That is, Turkey must modernize
and reform its general and vocational school system to impart contemporary skills to its uneducated
population (average education level of the population is six years, of the workforce is seven years)
so that they may have better labour market opportunities. This point is repeatedly made in various re-
ports concerning the Turkish labour market (e.g. Ercan, 2007b; Tunalı 2003; ETF 2006; World Bank,
2005 on education, 2006 on labour market, 2009 on women’s labour force participation, and 2010 on
informality). Quoting ETF (2006) in its first paragraph, “A continuation of the recent acceleration of
economic growth will increase the need for medium and highly skilled workers.” that Turkey gener-
ally lacks now.
The Turkish non-institutional working age population, including individuals aged 15 to 64, is expect-
ed to increase by 7 million from 2010 to 2020.Total population will rise by 8.8 million. The projection
is taken from Turkstat. The 2010-20 annual average growth rate of this population is 1.2 %.
The working age population in the 15-64 age range is increasing at a decreasing rate. Young age group
is diminishing in numbers in Turkey. Given the prevailing labour force participation rate (LFPR) of
roughly 50% in Turkey, this population increase will mean 3.5 million more participants in the labour
force in the next ten years. Assuming a stable 70-71% LFPR for men, and a slight improvement in

                                                                                                      3
International Labour Organization
women’s LFPR from 26-27% to 28%, the total LFPR will still be less than 51%. Turkish labour force
will thus reach 28 million individuals.
With the above rates, there will be a 2.1 million increase in the number of men in the labour force,
and a 900 thousand increase in the number of women in the labour force by 2020. The share of the
youth labour force will go down from 17% to 15-16% both because of increasing school enrolment
trend, and because of the decline in their numbers. During this period, the number of 65+ year-olds
will increase by 1.9million. There will be 6.9 million persons in this age group in 2020.
Assuming that these trends will be reflected in the labour force as well, in Figure 2.1, percent of
population by age group is shown. The share of the younger labour force, workers aged 15 to 34, is
expected to decrease. Of the remaining working-age group, those between 35 and 64 years old, the
number is projected to increase.
Figure 2.1. Percent of population by age group (2010-2020).
WĞƌĐĞŶƚŽĨƉŽƉƵůĂƚŝŽŶďLJĂŐĞŐƌŽƵƉ
ϯϬй
Ϯϱй
ϮϬй
ϭϱй
ϭϬй
ϱй
Ϭй
ϬͲϭϰ ϭϱͲϮϰ ϮϱͲϯϰ ϯϱͲϰϰ ϰϱͲϱϰ ϱϱͲϲϰ ϲϱн
ϮϬϭϬ ϮϬϮϬ
Source: Turkstat projections (Table 43 of population projections, www.tuik.gov.tr ).
The period that is used for the labour market analysis is 2000-2009. This consists of two phases: pre-
crisis (2000-2007) and crisis (2008-2009). All statistics are also presented disaggregated by sex and
age where possible. One question needs to be answered at this point in order for the analysis to make
more sense. Why has there been such a large share of agriculture in employment in Turkey (which is
still close to 30%)? The answer is agricultural subsidies that went on between 1950 and 2000. These
subsidies slowed down the flow of population from rural to urban areas that should have started after
agricultural mechanization. Agricultural productivity is therefore low in Turkey. Furthermore, Turk-
ish population’s average schooling level is six years. The implications of this in the urban labour mar-
kets are profound. In addition to informality and low levels of education (hence low levels of labour
productivity), participation rates of urban women are very low, about 25%. Turkish production (and
per capita income level) clearly suffers from not utilizing much of its working age women. This is a
downward spiral, as improvements to technology may not be translated easily into productivity with
this kind of a work force composition.
Not surprisingly, Turkish Employment Agency’s annual survey of establishments (2009) reports eight
of the top ten occupations as unskilled occupations like bodily work or general (unspecified) ser-
vices. Long-term supply of skilled occupations depends on urbanization and the resultant increases
4International Labour Organization
in schooling levels. This development will also push age at first marriage up and increase women’s
labour-force participation rates eventually.
Understanding these fundamental dynamics of the Turkish labour market allows one to conduct in-
formed analyses of past and present trends of industrial activity and occupational distribution.
PRE-CRISIS (2000-07) LABOUR MARKET TRENDS
In 2000, there was an IMF-led expansionary stabilization program. In 2001, there was a severe bank-
ing crisis. In 2002-07, there was continuous growth. Turkey started an IMF-led stabilization program
in 2000. The program pegged the TL to USD. The economy initially expanded as expected in such
programs, employment levels went up, and unemployment rates fell. In 2001 there was a banking
crisis, economy contracted, employment levels fell, unemployment rate went back up to its ‘nor-
mal’ plateau and kept climbing up to its new plateau. In the tables and figures that follow, this basic
sequence of events is visible. To start the analysis, in Table 2.1 we report the headline labour force
statistics of Turkey by sex for 2000-10 (September, the latest available at the time of writing of this
report). These are aggregate figures as reported by Turkstat. Crisis shows in 2009 figures (it was late
2008 when it hit Turkey but the impact is visible even in 2008 statistics), recovery should be in the
2010 statistics (September, which happens to be a seasonally good month for employment with agri-
culture, construction, and tourism in full swing).
In Table 2.1, we colour-code 2008 as yellow (pre-crisis values, but one should also check the itali-
cized 2007 values, because in the last quarter of 2008 job losses started in Turkey), the crisis year
2009 as red, and the recovery year of 2010 (September round of HLFS) as green.
5International Labour Organization
Table 2.1. Labour force status by non-institutional population (by sex) (x1000), 2000-2010.
Unempl %
Unempl %
LFPR %
Non-agri
Unempl.
Empl %
Pop 15+
Empl.
NILF
Year
Pop.
LF
TOTAL
2000 66.187 46.211 23.078 21.581 1.497 49,9 6,5 9,3 46,7 23 133
2001 67.296 47.158 23.491 21.524 1.967 49,8 8,4 12,4 45,6 23 667
2002 68.393 48.041 23.818 21.354 2.464 49,6 10,3 14,5 44,4 24 223
2003 69.479 48.912 23.640 21.147 2.493 48,3 10,5 13,8 43,2 25 272
2004 66.379 47.544 22.016 19.632 2.385 46,3 10,8 14,2 41,3 25.527
2005 67.227 48.359 22.455 20.067 2.388 46,4 10,6 13,5 41,5 25.905
2006 68.066 49.174 22.751 20.423 2.328 46,3 10,2 12,7 41,5 26.423
2007 68.901 49.994 23.114 20.738 2.376 46,2 10,3 12,6 41,5 26.879
2008 69.724 50.772 23.805 21.194 2.611 46,9 11,0 13,6 41,7 26.967
2009 70.542 51.686 24.748 21.277 3.471 47,9 14,0 17,4 41,2 26.938
2010 71.343 52.541 25.641 22.594 3.046 48,8 11,9 14,8 43,0 26.901
MALE
2000 22.916 16 890 15 780 1 111 73,7 6,6 8,4 68,9 6.026
2001 23.389 17 040 15 555 1 485 72,9 8,7 11,3 66,5 6.349
2002 23.827 17 058 15 232 1 826 71,6 10,7 13,3 63,9 6.769
2003 24.260 17 086 15 256 1 830 70,4 10,7 12,6 62,9 7.174
2004 23.251 16.348 14.585 1.762 70,3 10,8 12,9 62,7 6.903
2005 23.673 16.704 14.959 1.746 70,6 10,5 12,2 63,2 6.969
2006 24.094 16.836 15.165 1.671 69,9 9,9 11,3 62,9 7.258
2007 24.513 17.098 15.382 1.716 69,8 10,0 11,4 62,7 7.415
2008 24.917 17.476 15.598 1.877 70,1 10,7 12,3 62,6 7.441
2009 25.369 17.898 15.406 2.491 70,5 13,9 16,0 60,7 7.471
2010 25.801 18.257 16.170 2.088 70,8 11,4 13,2 62,7 7.544
FEMALE
2000 23 295 6 188 5 801 387 26,6 6,3 13,5 24,9 17 108
2001 23 769 6 451 5 969 482 27,1 7,5 17,7 25,1 17 318
2002 24 214 6 760 6 122 638 27,9 9,4 19,8 25,3 17 455
2003 24 652 6 555 5 891 663 26,6 10,1 18,9 23,9 18 098
2004 24.293 5.669 5.047 622 23,3 11,0 19,6 20,8 18.624
2005 24.686 5.750 5.108 642 23,3 11,2 18,7 20,7 18.936
2006 25.080 5.916 5.258 658 23,6 11,1 17,9 21,0 19.165
2007 25.480 6.016 5.356 660 23,6 11,0 17,3 21,0 19.464
2008 25.855 6.329 5.595 734 24,5 11,6 18,1 21,6 19.526
2009 26.317 6.851 5.871 979 26,0 14,3 21,9 22,3 19.466
2010 26.740 7.383 6.425 959 27,6 13,0 20,2 24,0 19.357
Source:www.tuik.gov.tr
Note:Pre-2004 series were not revised according to the 2007 address based population census. There was a downward
population adjustment of 3.5 million in total population. Most of this correction fell unto the rural areas. There was double
counting of individuals who immigrated into the cities, which was corrected by Turkstat.
Turkish labour force stands at 25.6 million with 18.3 million men and 7.4 million women. Pre-crisis
unemployment level stood at 2.4 million with 1.7 million men and 700 thousand women. After climb-
ing to 3.5 million in the first quarter of 2009, it came down to 3 million in 2010 (a detailed breakdown
will be given in the crisis impact section). Turkish stock of unemployed has gone up by 500 thousand
and the post-crisis recovery trend levelled in August and September (not shown here, but available
6International Labour Organization
from the Turkstat monthly bulletins at www.tuik.gov.tr ). Women’s unemployment numbers con-
tributed more to this increase then men’s unemployment numbers. Women’s employment numbers
contributed more to the employment recovery then men’s employment numbers. This suggests an
increasing labour force participation rate for women and it is borne in the statistics. Women’s LFPR
went up from a pre-crisis 24% to a post-crisis 28%. It kept rising right through the crisis.
Overall unemployment rate went back to its pre-crisis level of 11% after registering 14% in 2009
(15% in the first quarter of 2009). Women’s unemployment rate rose from a pre-crisis 11% to 13% in
2010. Non-agricultural unemployment rate (a better indicator for international comparison because
of high agricultural employment proportion in Turkey, where almost all women in the agricultural
labour force are ‘gainfully’ employed as unpaid family workers) did not go back to its pre-crisis level
for women (it did for men, from 12% to 12% with 16% in between). The trajectory for women was
18%, 22%, and 21%.
Turkey grew for six years straight between 2002 and 2007. This sustained economic growth did not
reflect itself in an increase in labour force participation. Unemployment rate remained around 10.5%.
Turkish participation rate fell because women’s participation rate fell. This is because of the ongoing
rural-urban migration. Former uneducated unpaid family workers in agriculture do not participate in
the urban labour market. This component still dominates the overall participation rate although ris-
ing urban education levels are pushing participation rates up at the same time. Unemployment rate
remains level until its next jump to a new plateau (as in this crisis) because the better educated (high
school, median education level is primary) urban younger cohort participate more, but the jobs are
not forthcoming at this rate.
As the agricultural employment exodus will still be important in the coming decade or so, this pat-
tern will drive the participation rate and unemployment patterns in Turkey. This is regardless of the
impact of the recent economic crisis. The crisis put the unemployment rate in the first half of 2009 to
its historic high. It may have hastened this outcome maybe by a few years, but this outcome was in
the making. Unemployment levels for urban youth are considerably higher than the general rate. In
the coming decade, these rates would have translated themselves into the overall rates. The across-
the-board employment support programs in Turkey (there was an important regulation in 2008 that
provided incentives for employing first-time job entrant women or the young) have not yet made a
difference for urban youth, likely because of the crisis. We should see such impact given time. This
suggests that there are significant barriers that young people face when trying to get a job or remain
in one (some evidence for this will be provided ahead). The issues of low-skills and a general lack of
childcare facilities come to mind right away.
In Figures 2.2-2.4 LFPR, employment, and unemployment rates are shown by sex. While male over-
all and non-agricultural unemployment rates receded to their pre-crisis values, female unemployment
rates rose sharply during the crisis and remained high with only a slight improvement in 2010.
7International Labour Organization
Note: September values for 2010. Annual rates for 2010 are in Table 2.1.
Figure 2.2. Labour force participation rates (source: Table 2.1).
>ĂďŽƵƌ&ŽƌĐĞWĂƌƚŝĐŝƉĂƚŝŽŶZĂƚĞƐ
ϴϬ͘Ϭ
ϳϬ͘Ϭ
ϲϬ͘Ϭ
ϱϬ͘Ϭ
ϰϬ͘Ϭ
ϯϬ͘Ϭ
ϮϬ͘Ϭ
ϭϬ͘Ϭ
Ϭ͘Ϭ
ϮϬϬϬ ϮϬϬϭ ϮϬϬϮ ϮϬϬϯ ϮϬϬϰ ϮϬϬϱ ϮϬϬϲ ϮϬϬϳ ϮϬϬϴ ϮϬϬϵ ϮϬϭϬ
>&WZй ϰϵ͘ϵ ϰϵ͘ϴ ϰϵ͘ϲ ϰϴ͘ϯ ϰϲ͘ϯ ϰϲ͘ϰ ϰϲ͘ϯ ϰϲ͘Ϯ ϰϲ͘ϵ ϰϳ͘ϵ ϰϵ͘ϭ
DĂůĞ>&WZй ϳϯ͘ϳ ϳϮ͘ϵ ϳϭ͘ϲ ϳϬ͘ϰ ϳϬ͘ϯ ϳϬ͘ϲ ϲϵ͘ϵ ϲϵ͘ϴ ϳϬ͘ϭ ϳϬ͘ϱ ϳϭ͘ϭ
&ĞŵĂůĞ>&WZй Ϯϲ͘ϲ Ϯϳ͘ϭ Ϯϳ͘ϵ Ϯϲ͘ϲ Ϯϯ͘ϯ Ϯϯ͘ϯ Ϯϯ͘ϲ Ϯϯ͘ϲ Ϯϰ͘ϱ Ϯϲ͘Ϭ Ϯϳ͘ϵ
Source: Table 2.1
Figure 2.3. Employment rates
ŵƉůŽLJŵĞŶƚZĂƚĞƐ
ϴϬ͘Ϭ
ϳϬ͘Ϭ
ϲϬ͘Ϭ
ϱϬ͘Ϭ
ϰϬ͘Ϭ
ϯϬ͘Ϭ
ϮϬ͘Ϭ
ϭϬ͘Ϭ
Ϭ͘Ϭ
ϮϬϬϬ ϮϬϬϭ ϮϬϬϮ ϮϬϬϯ ϮϬϬϰ ϮϬϬϱ ϮϬϬϲ ϮϬϬϳ ϮϬϬϴ ϮϬϬϵ ϮϬϭϬ
ŵƉůƌĂƚĞй ϰϲ͘ϳ ϰϱ͘ϲ ϰϰ͘ϰ ϰϯ͘Ϯ ϰϭ͘ϯ ϰϭ͘ϱ ϰϭ͘ϱ ϰϭ͘ϱ ϰϭ͘ϳ ϰϭ͘Ϯ ϰϯ͘ϲ
DĂůĞ
ŵƉů й ϲϴ͘ϵ ϲϲ͘ϱ ϲϯ͘ϵ ϲϮ͘ϵ ϲϮ͘ϳ ϲϯ͘Ϯ ϲϮ͘ϵ ϲϮ͘ϳ ϲϮ͘ϲ ϲϬ͘ϳ ϲϯ͘ϲ
&Ğŵ͘
ŵƉůй Ϯϰ͘ϵ Ϯϱ͘ϭ Ϯϱ͘ϯ Ϯϯ͘ϵ ϮϬ͘ϴ ϮϬ͘ϳ Ϯϭ͘Ϭ Ϯϭ͘Ϭ Ϯϭ͘ϲ ϮϮ͘ϯ Ϯϰ͘Ϯ
Source: Table 2.1
Figure 2.4. Unemployment rates
hŶĞŵƉůŽLJŵĞŶƚZĂƚĞƐ
Ϯϱ͘Ϭ
ϮϬ͘Ϭ
ϭϱ͘Ϭ
ϭϬ͘Ϭ
ϱ͘Ϭ
Ϭ͘Ϭ
ϮϬϬϬ ϮϬϬϭ ϮϬϬϮ ϮϬϬϯ ϮϬϬϰ ϮϬϬϱ ϮϬϬϲ ϮϬϬϳ ϮϬϬϴ ϮϬϬϵ ϮϬϭϬ
DĂůĞhŶĞŵƉůй ϲ͘ϲ ϴ͘ϳ ϭϬ͘ϳ ϭϬ͘ϳ ϭϬ͘ϴ ϭϬ͘ϱ ϵ͘ϵ ϭϬ͘Ϭ ϭϬ͘ϳ ϭϯ͘ϵ ϭϬ͘ϲ
DĂůĞŶŽŶͲĂŐƌŝƵŶĞŵƉůй ϴ͘ϰ ϭϭ͘ϯ ϭϯ͘ϯ ϭϮ͘ϲ ϭϮ͘ϵ ϭϮ͘Ϯ ϭϭ͘ϯ ϭϭ͘ϰ ϭϮ͘ϯ ϭϲ͘Ϭ ϭϮ͘Ϯ
&ĞŵĂůĞhŶĞŵƉůй ϲ͘ϯ ϳ͘ϱ ϵ͘ϰ ϭϬ͘ϭ ϭϭ͘Ϭ ϭϭ͘Ϯ ϭϭ͘ϭ ϭϭ͘Ϭ ϭϭ͘ϲ ϭϰ͘ϯ ϭϯ͘Ϯ
&Ğŵ͘ŶŽŶͲĂŐƌŝƵŶĞŵƉůй ϭϯ͘ϱ ϭϳ͘ϳ ϭϵ͘ϴ ϭϴ͘ϵ ϭϵ͘ϲ ϭϴ͘ϳ ϭϳ͘ϵ ϭϳ͘ϯ ϭϴ͘ϭ Ϯϭ͘ϵ Ϯϭ͘ϭ
Source: Table 2.1
8International Labour Organization
Unemployment statistics for the youth (15-24 year-olds) reveal a dire picture (Figure 2.6). Non-agri-
cultural unemployment rate for young males hit 28% in 2009 and came back down close to its 2005
level in 2010 (22.3% and 22.8%, respectively). Young female non-agricultural unemployment rate hit
33% in 2009 and remained there in 2010. General female youth unemployment rate did not go back
down to its pre-crisis plateau of 21%, either. It went up to 25% in 2009 and fell to 24% in 2010. These
rates are very high (OECD region’s youth unemployment rate was 16.4% in 2009; OECD, 2010).
Young women’s participation rates follow the general trend of all women (not shown).
Figure 2.5. Youth unemployment rates
hŶĞŵƉůŽLJŵĞŶƚƌĂƚĞƐ͗ϭϱͲϮϰLJĞĂƌͲŽůĚƐ
ϯϱ͘Ϭ
ϯϬ͘Ϭ
Ϯϱ͘Ϭ
ϮϬ͘Ϭ
ϭϱ͘Ϭ
ϭϬ͘Ϭ
ϱ͘Ϭ
Ϭ͘Ϭ
ϮϬϬϬ ϮϬϬϭ ϮϬϬϮ ϮϬϬϯ ϮϬϬϰ ϮϬϬϱ ϮϬϬϲ ϮϬϬϳ ϮϬϬϴ ϮϬϬϵ ϮϬϭϬ
DĂůĞhŶĞŵƉůй ϭϯ͘ϳ ϭϳ͘Ϯ ϮϬ͘ϯ Ϯϭ͘ϰ ϮϬ͘ϱ ϭϵ͘ϱ ϭϴ͘ϯ ϭϵ͘ϲ ϮϬ͘ϭ Ϯϱ͘ϰ ϭϵ͘ϴ
DĂůĞŶŽŶͲĂŐƌŝƵŶĞŵƉůй ϭϴ͘Ϭ ϮϮ͘ϵ Ϯϱ͘ϯ Ϯϰ͘ϳ Ϯϰ͘ϳ ϮϮ͘ϯ ϮϬ͘Ϯ Ϯϭ͘ϱ ϮϮ͘ϯ Ϯϴ͘ϰ ϮϮ͘ϴ
&ĞŵĂůĞhŶĞŵƉůй ϭϭ͘ϵ ϭϰ͘ϰ ϭϳ͘ϭ ϭϴ͘ϵ ϮϬ͘ϳ ϮϬ͘ϱ ϮϬ͘ϲ ϮϬ͘ϴ Ϯϭ͘Ϯ Ϯϱ͘Ϭ Ϯϰ͘Ϭ
&Ğŵ͘ŶŽŶͲĂŐƌŝƵŶĞŵƉůй Ϯϭ͘ϳ Ϯϴ͘ϱ Ϯϵ͘ϴ Ϯϵ͘ϭ ϯϭ͘ϭ Ϯϴ͘ϴ Ϯϴ͘ϭ Ϯϳ͘ϰ Ϯϴ͘ϱ ϯϮ͘ϵ ϯϯ͘ϭ
Source: Turkstat
SECTORAL EMPLOYMENT TREND4
Using aggregate data from 2000 and 2008 HLFS, in Figure 2.7, the employment creation tight spot of
the Turkish labour market is observed. Agriculture lost 2.75 million workers in this period. The rest
of the economy created 2.4 million jobs. There was a deficit of 375 thousand. Had the Turkish LFPR,
especially for women, not been low, the unemployment problem would have escalated. Manufactur-
ing employment gain was 630 thousand during the period. Service sector total job creation was 1.9
million.
Figure 2.6. Numeric change in employment (2000 to 2008).
E Ƶ ŵ Ğ ƌ ŝ Đ Đ Ś Ă Ŷ Ő Ğ ŝ Ŷ Ğ ŵ Ɖ ů Ž LJ ŵ Ğ Ŷ ƚ ͕ Ϯ Ϭ Ϭ Ϭ Ͳ Ϯ Ϭ Ϭ ϴ
W Ğ ƌ Ɛ ͘^ Ğ ƌ ǀ ͘
& ŝŶ Ă Ŷ Đ Ğ
dƌ ĂŶ ƐƉ ͘
dƌĂĚ Ğ
Ž Ŷ Ɛ ƚ͘
h ƚŝů͘
D Ă Ŷ Ƶ Ĩ͘
D ŝŶ Ğ
Őƌŝ
Ͳϯ Ϭ Ϭ Ϭ ͲϮ ϱ Ϭ Ϭ ͲϮ Ϭ Ϭ Ϭ Ͳϭ ϱ Ϭ Ϭ Ͳϭ Ϭ Ϭ Ϭ Ͳϱ Ϭ Ϭ Ϭ ϱϬϬ ϭϬϬϬ
Source:Aggregated Turkstat HLFS data are used.
4 This and the following section draw freely on Ercan (2010).
9International Labour Organization
In Table 2.2, employment shares of the industries used in Figure 2.6 are reported. Agriculture lost
employment. Mining, utilities, construction, and transportation total remained quite the same. Manu-
facturing gained three points, service industries gained nine points of what agriculture lost in em-
ployment share, twelve points. One may expect these broad trends to prevail in the coming decade as
well. If the agricultural employment shares of other upper middle-income countries are any indica-
tion, Turkish agricultural employment share will likely go down to the 10-12% range. This means
a twelve-plus point loss still to come from agriculture (which means a loss of approximately three
million jobs). Some of this share-shift could go to manufacturing; the bulk must end up in the service-
sector employment share.
Table 2.2. Employment shares of industries, 2000 – 2008.
Year Agri. Mine Manuf. Util. Const. Trade Transp. Finance Pers. Serv.
2000 36,0% 0,4% 16,9% 0,4% 6,3% 17,7% 4,9% 3,3% 14,1%
2008 24,7% 0,5% 18.6% 0,4% 5,9% 21,6% 5,1% 5,5% 17,3%
Source:Aggregated Turkstat HLFS data.
EDUCATION AND JOB STATUS
Low skill (education) level in Turkish employment is shown in Table 2.3. Schooling classifications
used by the Turkstat need to be explained to the reader. No schooling means not being able to read
or write. As this proportion was historically higher, there was once widespread (today’s equivalent
of) lifelong learning programs for the adult generations: Courses that taught how to read and write to
adults. Men’s mandatory military service was also put to good use once and conscripts were taught
how to read and write. The classification ‘no diploma’ is for people who could read and write but
who do not have a primary school (five years) diploma, including dropouts. Junior high is eight years
and senior (or vocational) high is eleven years (now twelve years) of schooling. These were pre-1997
denominations when mandatory schooling went up to eight years from five. Senior high became four
years. ‘Elementary’ classification refers to this shift. This is eight years of schooling and it implies
that the person has graduated after the mandatory schooling level increase. As this proportion goes
up, slowly, average education level in Turkey will go up. The ‘elementary’ statistic also reflects the
young age of the cohort, less than 2% of these are employed or self-employed in 2008.
The median education level of those in employment is still primary (five years). More than a quarter
of the unpaid family workers have no diploma; 87% have less than high school education. Primary
school graduates constitute more than half of the casual wage (daily or seasonal) workers and the self-
employed. Median education level of the employers is junior high (eight years). Wage-salary workers
are the best educated; their median education is senior high (eleven years). They constitute more than
half of the Turkish work force. Table 2.3 strongly suggests that self-employed look more like casual
wageworkers in Turkey, as opposed to employers. This lends credence to the belief that, failing to
obtain regular wage-salary employment because of their poorer human capital stock, this segment of
the work force exists in the secondary segment.
10International Labour Organization
Table 2.3. Education and job status in Turkish employment (2008).
Elementary
Junior high
Senior high
Voc. high
schooling
(8 years)
Primary
Number
diploma
College
(x1000)
No
No
15 +
(%)
year-olds
Wage-
3.
salary 0.7% 2.0% 29.2% 10.4% 14.2% 14.6% 23.3% 5.7% 100.0%
100.0 % 11527 54.4%
Casual
wage 7.6% 8.9% 54.3% 7.9% 6.2% 4.7% 1.4% 8.9% 100.0%
100.0 % 1409 6.6%
Employer 0.7% 1.8% 39.4% 14.1% 14.1% 10.2% 18.9% 0.8% 100.0%
100.0 % 1250 5.9%
Self-
employed 7.4% 7.7% 58.5% 10.2% 6.5% 5.3% 3.5% 1.0% 100.0%
100.0 % 4325 20.4%
Unpaid
family 16.5% 10.1% 44.2% 4.0% 6.7% 4.1% 1.6% 12.7% 100.0%
100.0 % 2683 12.7%
TOTAL 4.5% 4.6% 39.4% 9.6% 11.1% 10.4% 14.8% 5.5% 100.0%
100.0 % 21194 100.0%
Unempl.
rate 7.0% 12.8% 9.4% 13.4%* 14.0% 11.5% 10.0% 10.9%
Population
proportion 9.1% 6.7% 39.1% 17.5%* 11.0% 7.9% 8.8%
Source: Turkstat online database and microdata. Average schooling level from this table (for the employed) is computed
as 5.082 years.
* Includes elementary (eight years) classification.
In the last rows of Table 2.3, unemployment rates by education level and population proportions by
education levelare reported. No-diploma category is overrepresented in unemployment. Basic educa-
tion/secondary graduates are overrepresented in the unemployed category. Overall unemployment
rate for the data is 10.9%. Excluding the no schooling category, with the exception of primary and
tertiary education levels, at other levels of education, unemployment rates are higher than the overall
unemployment rate. College graduates constitute the managers, engineers, and professional occupa-
tions. Primary graduates are the bulk of the unskilled or informal employment.
WAGES AND EARNINGS: 2004 – 2010 HLFS MICRODATA
Monthly earnings of wage earners (regular and casual employees) have been on the rise.5 In compari-
son to 2004, monthly earnings were up by almost 30 % in 2009 (in 2003 prices!). Monthly earnings in
the formal (registered to social security in current job) non-agricultural sector are substantially high-
er than earnings reported in the informal non-agricultural sector (Figure 2.7 - prepared by Meltem
Dayıoğlu in this section). For instance, in 2008, informal sector earnings were only about 55 % of for-
mal sector earnings. This gap increased further in 2009, informal sector earnings dropping to about a
half of formal sector earnings. Since the new entrants in 2009 were not formal or informal wagework-
ers (see the next section) but rather unpaid family workers in agriculture and self-employed women,
this increase is likely due to increasing skill premium. Supporting evidence for rising skill premium
is provided later in this chapter when we report wages by occupations for 2004-09. Although average
monthly earnings overall and in the formal sector continued to increase in 2009, informal sector earn-
ings registered a drop of about 6 % in a single year from 2008 to 2009.
5 This includes earnings from main job only. Turkstat asks “monthly net income from main job” question for earnings question since
2002 (the first survey in 1988 was an exception). Question is only asked of wage-salary workers (less than 60% of employment in
2008). Earnings are corrected for inflation using CPI as reported by Turkstat. The base year is 2003 in this subsection. Wage data
for 2002 and 2003 were not available to researchers at the time of writing the earlier draft of this report in early 2011.
11International Labour Organization
Figure 2.7. Monthly earnings by year and sector (non-agriculture).
800
700
600
TL per month
All
500
Nonagri
400
Formal
300
Informal
200
100
0
2004 2005 2006 2007 2008 2009
Source: HLFS microdata files.
Note: Data covers individuals aged 15-64. Formal and informal sector wages exclude agriculture.
Figure 2.8. Monthly earnings by year, sex, and sector (non-agriculture).
800
700
600
TL per month
MaleF
500
FemaleF
400
MaleINF
300
FemaleINF
200
100
0
2004 2005 2006 2007 2008 2009
Source: HLFS microdata files.
Monthly earnings of non-agricultural formal sector male and female workers have been quite similar
(Figure 2.8). The average monthly earnings for both groups increased over time including the crisis
years of 2008 and 2009. In the non-agricultural informal sector, monthly earnings of men have been
higher than monthly earnings for women. Unlike the formal sector, monthly earnings of men and
women employed in the informal sector have shown a decline over 2008-2009.
Finally, in Figure 2.9a-c, observed age-earnings profiles for men and women are given for 2010. In
Figure 2.9a, there is a difference in the prime working age years between the monthly earnings of
men and women. In Figure 2.9b, only college graduates are shown. Wages for all men and women at
all ages move up relative to Figure 2.9a. Note also that, while college graduate men and women start
at similar earnings levels after school, men get ahead faster. As these are actual (observed) patterns,
the author will spare his comments. Clearly, further regression analysis controlling for observable
characteristics in the data are needed for further interpretation. Figure 2.19c reveals the striking wage
difference caused by a college education across all age groups for women.
12International Labour Organization
Figure 2.9a. Age-earnings profiles for men and women, 2010 (monthly earnings).
Figure 2.9b. Age-earnings profiles for men and women, 2010 (college graduates).
Figure 2.9c. Women’s earnings by age and education level, 2010.
Source: Author’s computations from 2010 LFS (Turkstat) microdata.
13International Labour Organization
2009 TURKSTAT SURVEY: EDUCATION – EMPLOYMENT TRANSITION
In this section, tabulated results from the 2009 Education-Employment transition survey of Turkstat
are presented. The survey was the first of its kind in Turkey, conducted at the same time with the EU
countries with the same questionnaire structure. It has detailed questions for the young age group,
which is defined by 15-34 year-olds, on their first permanent job or its absence. Education is the key
determinant of future occupational prospects and therefore wages. Table 2.4 provides the broad pic-
ture of the education-employment transitions of the young people.
Table 2.4. Education-Employment transitions of 15-34 year-olds (in thousand persons).
p y y p
First permanent job Freq. Percent Percent
35-64 year-olds 39,796 71.4
15-34 year olds:
Current job 4,251 7.6 26.7
Different job 3,995 7.2 25.1
Had worked 2,615 4.7 16.4
No job 5,083 9.1 31.9
Young total 15,944
Total 55,740 100.0 100.0
Note: First permanent job is defined as the first job that lasts for three months or more.
Source: Tabulated by the author from 2009 Turkstat survey microdata.
Working age population was 55.7 million at the time of the survey in 2009. Of these, 39.8 million persons (71%
of the total) were 35 years old or older. There were 15.9 million young people at working age. Of these, 4.25
million (27% of the young people) had found work and kept the same job. Close to four million of them (25%)
had found work, but later switched jobs. That is, more than half of the young people (52%) found a job and was
working at the time of the survey. Some (2.6 million, 16%) had worked at one time. Close to a third of them (5.1
million, 32%) never worked. Total non-working youth at the time of the survey was 48% of the young total. This
is not a good statistic. Table 2.5 hints at the reason, low levels of educational attainment.
Table 2.5. Education-Employment transitions of 15-34 year-olds, by education level (in thousand persons).
Education 35-64 year-olds 15-34 year olds Total
Current Different Had No
job job worked job
Can’t read
or write 6,540 6,540
(column percent) 16.4 11.7
No
diploma 14,904 14,904
37.5 26.7
Primary
(five years) 8,376 1,144 1,383 960 2,175 14,037
21.1 26.9 34.6 36.7 42.8 25.2
Basic
(eight years)* 3,489 732 280 339 1,050 5,890
8.8 17.2 7.0 13.0 20.7 10.6
Junior
high 1,498 327 488 250 335 2,898
3.8 7.7 12.2 9.6 6.6 5.2
Senior
high 2,196 583 513 429 837 4,558
5.5 13.7 12.8 16.4 16.5 8.2
Vocational
high 1,343 476 738 389 3791 3,323
3.4 11.2 18.5 14.9 7.5 6.0
College
and above 1,451 988 594 248 307 3,589
3.7 23.3 14.9 9.5 6.1 6.4
Total 39,796 4,251 3,995 2,615 5,083 55,740
100.0 100.0 100.0 100.0 100.0 100.0
* Compulsory eight years (which implies that the school completion was after the 1997-98 school year when there was
an increase in mandatory schooling from five to eight years).
Source: Tabulated by the author from 2009 Turkstat survey microdata.
14International Labour Organization
Table 2.5 is sadly informative of the Turkish working age population and the young population in
particular. Of the older segment (35-64 year olds), 59% have no diploma; most of these would be
(rural) women. Thankfully, all of the younger cohort have a diploma. Sadly again, the largest educa-
tion share category is still primary (five years). Of those young persons who never worked, 43% are
primary school graduates. Of the total working age population in Turkey, 79% have less than high
school education. This means that, a meaningful occupational outlook exercise could only apply to
21% of the population who have high school and university degrees. These two tables reveal the dire
problem of the Turkish working age population, no occupational qualification. Young women are in
worse shape (Table 2.6).
Table 2.6. Education-Employment states of all 15-34 year-olds, by sex (in thousand persons).
Men Women Total
No job 1,128 3,955 5,083
Has job or had job 7,009 3,852 10,860
Total 8,137 7,807 15,944
Source: Tabulated by the author from 2009 Turkstat survey microdata
Of the young women, 49% has a job or had a job after graduation. Of the young men, 86% has a job
or had a job after graduation. The observed odds ratio for finding a job after graduation for young
women against men is 0.16 (or men against women is the reciprocal of 0.16, which is 6.25; very good
betting odds in favour of men). This can be calculated from the table as the ratio of women with jobs
over women with no jobs (3.85 / 3.96 = 0.97) over the ratio of men with jobs over men with no jobs
(7.0 / 1.13 = 6.2), that is, 0.97 / 6.2 = 0.16. The picture is somewhat better for the younger half of the
young women. The odds ratio is 0.26 for 15-19 year-olds and 0.24 for 20-24 year-olds. The present
striking difference between young men and women in finding a job is likely to diminish in the coming
years (assuming that young women will keep their jobs and not drop out of the labour force when they
get married, which is an expected outcome as urban young women’s education levels keep rising).
Table 2.7 reports the result of a similar exercise for calculating odds ratios for various explanatory
variables in the survey data set. Such analysis is done through a technique called logistic regression.
Table 2.7. Education-Employment transition determinants of 20-29 year-olds.
20-24 year-olds 25-29 year-olds
Found a job Odds Ratio Std. Err z P>|z| Odds Ratio Std. Err z P>|z|
female 0.2633 0.0007 -504.6400 0 0.1159 0.0003 -853.5200 0
primary 0.6264 0.0032 -91.7100 0 0.2337 0.0010 -357.1100 0
junior high 0.6827 0.0032 -80.3700 0 0.3318 0.0016 -235.6800 0
high school 0.5908 0.0028 -112.0300 0 0.3876 0.0018 -206.0700 0
voc. high 1.1470 0.0059 26.5600 0 0.6932 0.0034 -74.3900 0
training 0.2792 0.0019 -191.3000 0 1.0161 0.0103 1.5700 0.117
married 0.7276 0.0020 -116.5900 0 1.0395 0.0027 14.9900 0
urban 0.7916 0.0022 -83.4900 0 0.9430 0.0024 -22.8400 0
mother primary 0.8775 0.0040 -28.7200 0 0.7694 0.0036 -55.6800 0
father primary 1.2872 0.0042 76.6000 0 1.2520 0.0041 68.6300 0
Note: Dependent variable is the binary variable that takes on a value of one if the person has (or had) a job, zero otherwise (i.e.
the person had no job) in a logistic regression. Omitted (reference) education category is university.
Source: Computed by the author from 2009 Turkstat survey micro-data, using Stata 11.
Table 2.7 reveals a few interesting findings. Odds ratios from a logistic regression are reported in the
table for 20-24 year-olds and for 25-29 year-olds. Dependent variable is having (or having had) a
15International Labour Organization job. Younger women do better than older women do. Relative to a university education, all education categories (except vocational high school for the younger group) fare worse. Note that, this younger group result may be driven by the fact that the age bracket includes those who are still attending college while vocational high school graduates could participate in the labour force. Regardless, a vocational high school degree is the next best thing to a university degree in terms of securing a job. Getting married at a young age is not good for job prospects while it has a positive impact in later years. Urban odds ratios being less than one (that is, logistic regression coefficients being negative) should simply mean that one is more likely in rural areas to be classified as an unpaid family worker in agriculture. The unexpected result comes from the coefficients of the mother’s education being primary school and father’s education being primary school. While mother’s education being low has a negative im- pact on finding a job, father’s education being low has a positive impact on finding a job. One could only conjecture that, mothers whose education levels are low are likely to be non-participants and they may not be prone to appreciate the value of an education in finding a job, especially for their daughters. (“What is an uneducated daughter to do anyway, except getting married at a young age like her uneducated mother?” may be the accepted wisdom for the uneducated mother, submitting to her ‘fate’.) Fathers, on the other hand, who participate in the labour force regardless of their education levels, may be in a superior position to appreciate the benefits of more education in securing a better paying job. They may be more likely to encourage their children to stay in school (with the possible exception of older southeast Anatolian fathers who do not put a value on girls’ education; women’s labour force participation rates are very low even by Turkish standards in the southeast). 3. CRISIS IMPACT In this section, we provide a breakdown of labour market statistics in order to gauge the impact of the crisis. In addition to the annual headline statistics, we use monthly data for employment and unemployment so that we could see the trough and peak months within the year. HLFS microdata tabulations are also used in the analysis for occupations and wages. These annual micro-data sets with wage data are only available starting in 2004 and ending in 2009. This precludes us from forming longer-term wage trends. The data simply do not exist. This is a sore point with the Turkish labour market researchers. In Figure 2.10, we show monthly data on employment and unemployment for 2006 to 2010. We plot employment change (in percentage, year-on-year) for total and urban employment levels. Although total and urban employment change patterns are similar, differences in magnitudes and timing are in- structive. There are two episodes in 2007 and 2008 for example, that urban employment growth was negligible when total employment growth remained around 2%. This could only be possible with an increase in agricultural employment. It is large enough a proportion in the Turkish labour market to influence the overall labour market statistics. In the recent crisis, total employment growth turned positive as early as July 2009, while urban em- ployment growth was negative until December 2009. Urban employment level started to fall in No- vember 2008 and kept falling until December 2009. In the July to November 2009 period, agricultural employment rise (most rural is agricultural in Turkey) was strong enough to pull the overall employ- ment level up from its previous year’s value. This is in spite of the still bleeding urban employment in which there was also a strong increase in the numbers of informal self-employed women (new entrants, more on this later). Part of this agricultural employment increase could be due to return migrants who were then classified as unpaid family workers in their family plots. Part of the agricultural employment stock could be 16
International Labour Organization

the portion that did not move into urban areas because of the crisis, as they have been doing for some
decades now (Turkish urban population and rural population crossed the 50% point as recently as the
early 1980’s). We have no data to identify separately these two components. Note also that, monthly
Turkstat HLFS results were showing a slight upward trend in agricultural employment before the
crisis months during 2008 (not shown here).
Both total and urban unemployment rates peaked in the first quarter of 2009. There was a sharp rise
in the last quarter of 2008. After this fast and heavy blow to employment levels in late 2008 and early
2009, there was a slight decrease of the unemployment rates from the peak in the second quarter. (We
will discuss later that agricultural employment rise, self-employed women entrants, and discouraged
long-term unemployed contributed to this decrease in the statistics.) The rates remained more or less
level in the summer months, rose slightly in the winter, decreased until June 2010. Both the total and
urban rates are higher than their 2008 values (September to September) despite the above-mentioned
boosts to the statistics.
Figure 2.10. Employment growth rate and unemployment rate (monthly).

                      ŵƉůŽLJŵĞŶƚ;ŵŽŶƚŚůLJ͕ƚŽƚĂůĂŶĚƵƌďĂŶͿ'ƌŽǁƚŚZĂƚĞ;LJĞĂƌͲŽŶͲLJĞĂƌйĐŚĂŶŐĞͿ
                                    ĂŶĚdŽƚĂůĂŶĚhƌďĂŶhŶĞŵƉůŽLJŵĞŶƚZĂƚĞƐ
                  ŵƉůйĐŚĂŶŐĞ          hŶĞŵƉů͘ƌĂƚĞ;йͿ           hƌďĂŶƵŶĞŵƉů͘ƌĂƚĞ ;йͿ               hƌďĂŶĞŵƉů͘й ĐŚĂŶŐĞ
  ϭϬ͕ϬϬ                                                                                                                                 ϮϬ͕Ϭ
                                                                                            hŶĞŵƉůŽLJŵĞŶƚƌĂƚĞͲ ƌŝŐŚƚ ĂdžŝƐ
  ϴ͕ϬϬ
                                                                                                                                        ϭϱ͕Ϭ
                                                                       hƌďĂŶ
  ϲ͕ϬϬ                                                                             dŽƚĂů

                                                                                                                                        ϭϬ͕Ϭ
  ϰ͕ϬϬ

  Ϯ͕ϬϬ
                                                                                                                                        ϱ͕Ϭ

    ͕ϬϬ
          ϭ   ϯ   ϱ    ϳ   ϵ   ϭϭ ϭ   ϯ   ϱ   ϳ   ϵ   ϭϭ ϭ   ϯ   ϱ     ϳ   ϵ   ϭϭ ϭ     ϯ      ϱ   ϳ   ϵ     ϭϭ   ϭ   ϯ   ϱ   ϳ     ϵ   Ϭ͕Ϭ
  ͲϮ͕ϬϬ
              ϮϬϬϲ         ϮϬϬϲ       ϮϬϬϳ        ϮϬϬϳ       ϮϬϬϴ          ϮϬϬϴ        ϮϬϬϵ            ϮϬϬϵ           ϮϬϭϬ    ϮϬϭϬ

  Ͳϰ͕ϬϬ                                                                                                                                 Ͳϱ͕Ϭ

Source: Turkstat.

In Table 2.8, we provide a further breakdown of the information presented in Figure 2.7. Percentage
change in employment by sex, total-urban, and young are presented between September 2008 and
September 2009, and September 2009 to September 2010. Total employment adjustment was over
within the year; that is, losses were suffered during the year and these numbers rebounded from 2008
September to 2009 September. Total employment and men’s employment grew strongly within the
last year (2009 September to 2010 September). Note that these total figures look good because of
even stronger growth in women’s employment throughout the crisis and recovery. Youth (15-24 year-
olds) employment remained level. The small increase in young men’s employment during recovery
was somewhat offset by the small decrease in young women’s employment.
The table shows that crisis impact was heaviest for urban men. They did rebound during the recovery.
The urban employment component looks solid in the table because of women’s urban employment
growth during the crisis and recovery. This provides preliminary evidence that there was an added
worker component during the crisis that still goes on into the recovery. We will further breakdown
this component later. During the 2001 crisis and 2002 recovery, neither the increase in agricultural
employment nor the increase in the number of self-employed urban women was observed.

                                                                                                                                               17
International Labour Organization
Table 2.8. Percentage change in employment by workforce group.
2008 Sep to 2009 Sep 2009 Sep to 2010 Sep
Total employment 1,00 4,33
Men -0,53 3,83
Women 5,18 5,60
Youth (15-24) 0,03 0,70
Men -0,04 1,48
Women 0,16 -0,81
Urban employment -0,93 4,63
Men -2,21 3,73
Women 3,57 7,60
Source: Calculated from aggregated Turkstat – HLFS data.
Note: In September 2008, employment impact of the crisis was felt for the first time. The table compares the same month
one and two years hence.
IMPACT ON UNEMPLOYMENT DURATION
One group of participants that one should surmise to be low skilled, is the long term unemployed. Du-
ration of unemployment has been going up in Turkey. Long-term unemployed (more than 12 months)
constituted 21% of the unemployed in 2000, a good year for labour market indicators (see Figure
2.8) as evidenced earlier in the figures for the pre-crisis trends section. By 2005, however, long term
unemployed reached 39% of the unemployed. In 2009, long-term unemployed proportion dipped
down to 25% (not shown, OECD total was 24%). In the recovery year of 2010 (September), it went
back up to 29%. What is likely to have happened is that, although the trend in the proportion of long-
term unemployed is upwards, during the crisis, many of the longest term unemployed (2-3 years and
above) dropped out of the labour force and became discouraged workers. Then they came back to the
statistics during the recovery and reported their total spell of joblessness in the HLFS.
INFORMAL EMPLOYMENT TRENDS AND CRISIS IMPACT
In Figure 2.12, the proportion of informal employment is shown. This proportion was 43.8% in 2009,
down from 45.4% in 2007. The total and male proportions remained level after the drop in the crisis.
The total proportion is currently 44.1% (2010). Note that, during the 2001 crisis, informal employ-
ment rose by 2.3 points and remained high for another two years before settling into its downward
trend in 2004-08. For women, the pattern was more pronounced. The rise in proportion in 2001 was
3.8 points. Non-agricultural proportions rose in 2000-05. This is in line with the widespread assump-
tion that the informal economy is where formal workers who lose their jobs go. This would suggest
that employment in the informal economy might expand during an economic crisis.
The response in the recent crisis is not like the response in the 2001 crisis. Overall and male informal
employment proportions remained level after an initial fall and women’s proportion has fallen in
2008, remained level in 2009, and rose in the recovery. The observation is not a fluke. There are 445
thousand more unregistered women in 2010 (September) over the 2009 average. Only, for non-ag-
ricultural women’s employment, the proportion is in the ‘expected’ direction, but small (see below).
There was a slight rise in informality that diminished during the recovery.
18You can also read