EMPTY PROMISES OF A NEW DAWN - A QUANTITATIVE STUDY ON EDUCATION AND EMPLOYMENT IN SOUTH - DIVA PORTAL
←
→
Page content transcription
If your browser does not render page correctly, please read the page content below
Empty promises of a new dawn
 A quantitative study on education and employment in South
 Africa

 Richard Backman

International Migration and Ethnic Relations
Two-year master
Master Thesis 30 credits
Department of Global Political Studies
Spring 2021: IM639L
Supervisors: Christian Fernandez and Haodong Qi
Word count: 20 558
 i
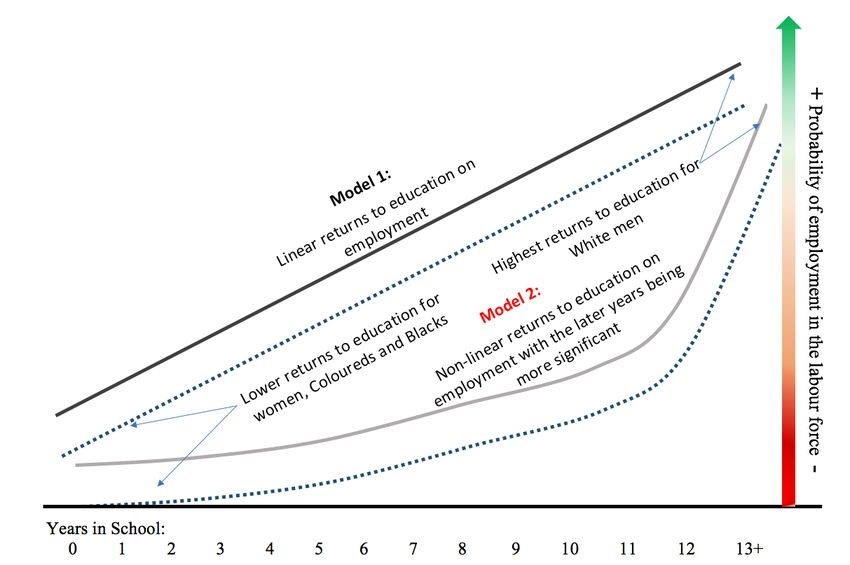
Table of contents
1. INTRODUCTION .................................................................................................................... 1
 1.1 AIM OF THE STUDY AND RESEARCH QUESTIONS .................................................................... 2
 1.2 DELIMITATIONS ............................................................................................................................. 2
 1.4 CLARIFYING TERMINOLOGY .......................................................................................................... 3
 1.5 STRUCTURE OF THE THESIS ........................................................................................................... 4
2. CONTEXTUAL BACKGROUND ................................................................................................ 5
 2.1 THE APARTHEID ERA ..................................................................................................................... 5
 2.1.1 Education during Apartheid .................................................................................................. 6
 2.1.2 Employment during Apartheid ............................................................................................. 10
 2.2 SOUTH AFRICA, ITS EDUCATION AND EMPLOYMENT SYSTEM POST-APARTHEID 1994 UNTIL
 TODAY ............................................................................................................................................... 12
 2.2.1 The Education system and its current challenges ................................................................ 12
 2.2.2 The employment system and its current challenges ............................................................. 15
 2.3 SUMMARY ................................................................................................................................... 19
3. PREVIOUS RESEARCH.......................................................................................................... 20
 3.1 CONCLUSION ............................................................................................................................... 25
4. THEORETICAL FRAMEWORK .................................................................................................... 26
 4.1 THE EDUCATION-EMPLOYMENT RETURNS THEORY.................................................................... 26
 4.2 SUMMARY ................................................................................................................................... 29
5. RESEARCH DESIGN, DATA AND METHODS ............................................................................... 30
 5.1 VALIDITY AND RELIABILITY OF THE STUDY ............................................................................... 30
 5.2 ROLE OF THE RESEARCHER.......................................................................................................... 33
 5.3 VARIABLES USED AND THEIR CATEGORISATIONS ....................................................................... 34
 5.3.1 The Schoolyears variable .................................................................................................... 34
 5.3.2 The employed variable and other employment categorisations .......................................... 35
 5.4 METHODS .................................................................................................................................... 36
 5.4.1 GRAPHICAL DATA ANALYSIS .................................................................................................... 36
 5.4.2 LOGISTIC REGRESSIONS ............................................................................................................ 36
6. RESULTS AND ANALYSIS .......................................................................................................... 39
 6.1 RESULTS FROM THE GRAPHICAL DATA ANALYSIS....................................................................... 39
 6.2 RESULTS FROM THE LOGISTIC REGRESSIONS .............................................................................. 43
 6.3 CONCLUSION ............................................................................................................................... 55
7. CONCLUSIONS ........................................................................................................................ 56
8. BIBLIOGRAPHY ....................................................................................................................... 59
9. APPENDIX............................................................................................................................... 73
 9.1 HISTORICAL BACKGROUND AND ADDITIONAL INFORMATION ABOUT THE SOUTH AFRICAN
 EDUCATION SYSTEM .......................................................................................................................... 73
 9.2 ADDITIONAL INFORMATION ABOUT THE QLFS, AND VARIABLES USED IN THE LOGISTIC
 REGRESSIONS ..................................................................................................................................... 77
 9.3 FULL ESTIMATIONS OF THE LOGISTIC REGRESSIONS, MODEL 3, MODEL 6-8 .............................. 81

 ii
Abstract:

Building on the existing framework of educational returns in South Africa, this quantitative
study uses statistical data from the Quarterly Labour Force Surveys for the years 2008-2018
with the aim to research educational returns on employment in South Africa. Findings from the
logistic regressions models used indicate that tertiary education is essential for employment,
and that returns for each additional school year below grade 12 are moderate. In addition, the
Coloured and Black population groups receive lower returns than the White population group,
and men have higher returns than women. By running independent regressions, new
observations occurred that impact some race and gender combinations while being moderate
for others, which contributes to the research on education and employment in South Africa.

Keywords:

South Africa, returns to education, employment, logistic regressions

 iii
Table of figures and tables

Name: Page:

Table 1: Comparison of different educational variables
between racial categories during Apartheid________________________________________________ 9

Figure 1: Grade 4 learners who can read at a basic level in percentage
by deciles of average school wealth__________________________________________________________ 14

Table 2: Unemployment rate in South Africa 1998-2018 in percentage_____________ 15

Figure 2: Post-Apartheid Unemployment rate in South Arica
by gender and race________________________________________________________________________________ 17

Table 3: Post-Apartheid unemployment rate by gender and race_____________________ 18

Figure 3: Returns to education on earnings 1993-2000___________________________________ 21

Table 4: The employment equation 1995-2015_____________________________________________ 24

Figure 4: The Education-Employment returns theory visualised________________________ 28

Graph 1: Highest education level by racial group 2008-2018
aged 15-64 in percentage_________________________________________________________________________ 39

Graph 2: Employment by racial group and gender
aged 15-64 in percentage_________________________________________________________________________ 40

Graph 3: Employment by racial group and Years in school aged
15-64 in percentage________________________________________________________________________________ 41

Table 5: Linear returns to education using logistic regressions, Model 1-3___________ 43

Table 6: Non-linear returns to education using logistic regressions, Model 4-6______ 45

Graph 7: Non-linear returns to education on employment, all groups___________________ 46
 iv

Table 7: Logistic regressions estimated on each racial group
independently using Model 7_____________________________________________________________________ 48

Graph 8-10: Returns to education on employment from Model 7________________________ 49

Table 8: Logistic regressions estimated on women and men
independently using Model 8_____________________________________________________________________ 52

Graph 11-12: Returns to education on employment from Model 8______________________ 53

Figure 5: The ratio of different employment statuses in the QLFS 2008-2018: _____ 77

Table 9: Classification information of the Schoolyears variable________________________ 78

Table 10: Descriptive statistics of the QLFS sample 2008-2018, aged 15-64________ 79

Table 11: Variable classifications in the logistic regression models____________________ 80

Table 12: Full estimations for model 3________________________________________________________ 81

Table 13: Full estimations for model 6________________________________________________________ 83

Table 14: Full estimations for model 7________________________________________________________ 85

Table 15: Full estimations for model 8________________________________________________________ 87

 v
Acknowledgments:

Finishing this master thesis would not have been possible without the continuous support of my
fantastic friends. They have commented, discussed and encouraged me to carry on writing
throughout this process. The hours you have spent reading, assisting me in finding the relevant
factors and been present whenever I needed you are acts of true kindness that I will never forget.

I would also like to thank my supervisors Christian Fernandez and Haodong Qi for your
incredible support throughout this writing process. Even if the process took longer than I
participated, I have been blessed to receive your helpful supervision nonetheless. Thank you
for your time.

Lastly, I would like to thank my family and especially my dear mother. Regardless of the
setbacks and external factors that occurred during this process, you helped me trust the
process and continue on, as you have done so often throughout my life. All that I am, or ever
hope to be, I will always owe to you.

A big hug to our dear Palle who passed away shortly after the submission, you will always
have a place in my heart.

 vi
vii
1. Introduction
The former South African president and human rights icon Nelson Mandela once said that “No
country can really develop unless its citizens are educated” (Kumar & Puneet 2018, 44).
However, in South Africa today, several severe challenges in the primary education system
remain, such as a dropout rate of over 50% among all students that enter high school (IRR,
2018). In addition, there are significant racial inequalities when observing matric 1 certificate
pass rates among the three main population groups: 88% of the White population attained
matric in 2011, while the combined percentage for the Coloured and Black population was only
44% (Hartnack, 2017). Given that the Black and Coloured population in South Africa in 2018
was estimated to be 88% in comparison to the White population of 8%, the education system
in South Africa continues to fail the same groups that Apartheid once discriminated against
before it ended in the early 1990s (CIA, 2019; BBC, 2018). 2

Furthermore, there are substantial inequalities in employment. Numbers from Statistics South
Africa show that in 2019 the unemployment rate for the Black population was 31.1%, while it
was 22% for the Coloured population and 7% for the White population (Statistics South Africa,
2019a, 21-22). For women across all racial lines, the unemployment rate has consistently been
higher than that of men. The latest census from 2011 shows that the unemployment rate for
women was 46%, compared to 34.2% for men (Statistics South Africa 2012, 52). The income
inequalities have also risen in South Africa, and in 2014 the top 10% highest income earners
received half of the national income (The world bank, 2014). South Africans have waited long
for the “new dawn” that the current president Cyril Ramaphosa promised them in his first State
of the Union speech in 2018 (South African Government, 2018).

Why is education important when it comes to employment? According to the World bank report
“Overcoming poverty and inequality in South Africa”, the likelihood for employment rises
significantly with schooling. (Sulla & Zikhali 2018, 22) According to their estimations, more
years in school increases employment drastically (Ibid). It is unclear however if each year of
additional schooling will increase the likelihood for employment equally or tertiary or
secondary schooling will be more essential than primary schooling. In addition, there could be

1
 The matric certificate is a high school diploma. In order to get a matric certificate, a student needs to pass the national final exams,
completed in grade 12. There are also different passing levels of a metric certificate, and a student needs to score a Bachelors pass on the
metric to attend University (Macha, 2021). For more information about the education system, see the Appendix on page 76.
2
 Definitions of the racial groups and will be examined later in this chapter and Apartheid extensively in Chapter 2.
 1
discriminatory factors involved as well, where Black Coloured and female students would
benefit less from their degrees than White and male students, due to the long history of
colonialism and Apartheid in South Africa. Therefore, the point of departure will be to study if
race and gender have a role on the return to education on employment almost thirty years after
the fall of Apartheid.

1.1 Aim of the study and research questions

This thesis uses statistical data from the Quarterly Labour Force Surveys for the years 2008-
2018 with the aim to research the effect that education has on employment in South Africa. The
following questions will be answered:
 1. If education has a positive return in terms of employment, does the return vary
 proportionally across race and gender lines?
 2. Will each additional year of schooling increase the likelihood of employment, or will
 later years hold more significance? Is the return linear or non-linear for all groups?
 3. Do certain factors affect a specific combination of gender or race when the models are
 applied?

1.2 Delimitations
The empirical analysis in this thesis relies on openly available data from Statistics South Africa
and their Quarterly Labour Force Surveys (QLFS). The years I have chosen to focus on are
2008-2018 inclusively. My interest lies in finding a possible impact that education has on
employment. After familiarising myself with the QLFS datasets, I have decided to drop
observations from the datasets who are younger than 15 and older than 64, and those that belong
to the Indian/Asian ethnicity. Due to South Africa’s young population, and in combination with
a steady education dropout rate before grade 12, some South Africans start working at an early
age (Statistics South Africa, 2012, 21-34). In addition, Statistics South Africa defines the
economically active population to be between the age of 15 to 64 (Ibid). The category
Indian/Asian ethnicity was dropped due to my aim to focus on the three main racial groups in
South Africa: Black, Coloured, and White.

In the census of 2011, there were five racial categories for the population in South Africa. These
are “Black”, “Coloured”, “White”, “Asian” and “Other” (Statistics South Africa 2012, 17). The
three first categories will be discussed and included in this research, while the last two will be
excluded. The reason for this delimitation is their small size as a percentage of the overall
 2
population, representing only 2.5% (Ibid). The “Other” racial category did not exist during
Apartheid, but “Asian”, or “Asian/Indian” has existed since 1961 (Pillay 2015, 121). The
“Asian/Indian” category has, throughout South African history, suffered from discrimination
from the state in various ways, and were forcedly removed to specific areas in several cities
during Apartheid (Ibid; Breckenridge, 2014, 229-230). Recognising that this racial category
was subject to many of the same racist practises of the government as all the other racial
categories who were not “White”, the decision is made to exclude this category only due to my
research focus. Accordingly, the findings of this paper are not meant to apply to the “Asian”
group in the country.

1.4 Clarifying terminology

There are terminologies regarding race used throughout the South African history and in
academic literature. Similar terminology is used in this thesis and this chapter presents the
chosen definitions:

Race: The present data regarding employment and education levels divides the population into
categories based on four different racial categories (Desmond-Harris, 2014). These categories
are implemented in this thesis due to their presence in the data being used and their frequent
use in South African society (Posel 2001a, 109; Datafirst, 2017). Nevertheless, as Megan
Gannon notes in the Scientific American, race as a constructed concept “is too crude to provide
useful information, it's a concept that has social meaning that interferes in the scientific
understanding of human genetic diversity” (Megan, 2016). Even if the meanings and
conceptions about race are constructed, it is visible and experienced in everyday-life for many
through the forms of racism and discrimination and is therefore useful to use in political and
social studies (Ibid; Desmond-Harris, 2014). This thesis focuses on three of the racial categories
South Africa: Black African, Coloured and White. These categories were founded during
Apartheid by the state 3 who also classified individuals through several dehumanizing practices
(Posel 2001b, 59-63). In the data material used in this thesis, the individual classification is
done by the respondent and not the state official. This thesis defines the three racial categories
as the following:

3
 These four categories were first mentioned legally in the Parliament Act no 30 of 1950 at the beginning of Apartheid, and have been present
since then. The legal definitions mentioned in the racial categories are citations from this legislation. This legislation, along with other
Apartheid laws will be discussed further in the next chapter.
 3
- Black/African: A person who is an ancestor of the San people, Bantu speaking people,
 former slaves or native immigrants from other African countries. (Longman & Brown,
 2018; Müller 1982, 1-2). Black is being used as the term for the group instead of
 African, for similarity with the two other groups.
 - Coloured: A member of a diverse group who share a lot of culture with the White
 population (Bloom 1967, 139). This group originates from the ancestors of marriages
 between different slave groups and Whites during South Africa’s long colonial history
 (Ibid, 143) Most people of the group speak English or Afrikaans, and a small minority
 speak Malay and other Asian languages (Ibid, 145).

 - White: A person descendent to British and Afrikaner or other Ethnic European groups.
 The Afrikaner group consists of the Dutch-speaking population who were the first
 colonisers in South Africa (Longman & Brown, 2018).

1.5 Structure of the thesis
This thesis is divided into seven chapters. Following this chapter, a contextual background with
regards to the history of South Africa, its education policies and their implications as well as
current education and employment levels will be discussed. In Chapter 3, relevant previous
research on the current issue will be presented. Next, Chapter 4 will provide information on the
theoretical framework, while Chapter 5 will discuss the research design, method, regression
models and data. Chapter 6 will present and discuss the results from the chosen research
methods, and lastly, Chapter 7 will present a concluding discussion on the results in relation to
the research questions and theory, and propose further research directions in this field.

 4
2. Contextual background

This chapter will offer a brief history of South Africa and its education and employment systems
as well as presenting figures of their performance today. Particular focus will be on both sectors
during the Apartheid years and what implications these policies still have in South Africa. This
is done to keep the background strictly relevant to the aim of this thesis. However, this leaves
some important aspects uncovered. Therefore, it is worth mentioning that systems such as
Apartheid were not new when introduced in the mid 20th century. Several other practises and
laws aimed at different groups were used long before, culminating later in more widespread
systematic segregation and, in the end, to Apartheid. (Dlamini 1990, 65). For a short description
of the Pre-Apartheid era and the education and employment systems from the beginning of the
colonisation of South Africa, see the Appendix on page 73.

The background chapter is intentionally long with in-depth discussions about the present and
previous employment and education systems and their purpose. This detailed chapter is done
because the findings from the chapter will later be used as a part of the theoretical framework
to interpret underlying reasons behind the data patterns presented in Chapter 6, reasons that are
impossible to observe from the data estimations alone. The background chapter includes general
previous research regarding the employment and education in South Africa, while Chapter 3
presents studies that are similar in nature to this thesis in both datasets and methods used.

2.1 The Apartheid era
In 1948, the Afrikaner nationalist party National Party (NP) won the national elections and
started working intensively to make their vision of Apartheid 4 a reality. During the 1950s, a
series of acts were introduced to create a segregated South Africa, such as the Population
Registration Act of 1950. This act required all South Africans to be classified according to the
government specified categories 5 and these categories were White person, Coloured and Black
(Longman & Brown 2018). A fourth group, “Indian/Asian”, was introduced later as an
amendment to the act of 1950 (Posel, 2001a, 98; Pillay, 2015, 121).

4
 The word in Afrikaans means “Separateness” and in English is referring to “a social policy of racial segregation involving political and
economic and legal discrimination” (Vocabulary, 2020)
5
 Those who wanted to change their race needed to go to the Department of Native Affairs for judgement and that department did not have
any official guidelines to make their decisions. In order to determine the race of a person, the officials used different, unofficial and often
humiliating measurements such as how soft the ear lobe was, the location of the cheekbones or used a pencil as a tool to figure the structure
of the hair (Posel 2001, 59).

 5
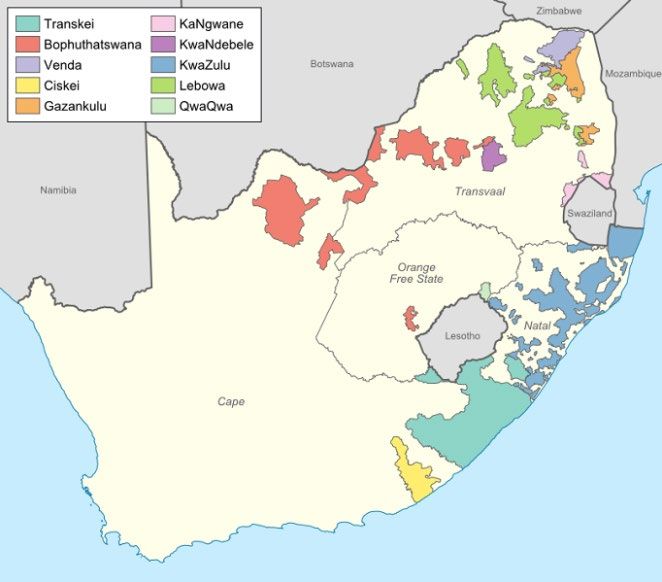
The 1950s also saw the passing of the Group Areas Act, which introduced areal segregation,
and largely forced Blacks and Coloureds out from living in the city centres and into the
township areas created for their race. This happened on a large scale in many cities country
(Longman & Brown, 2018). There are two other notable acts which were legislated during this
decade: The Bantu Education Act, which will be discussed later in this chapter, and the “Pass
laws”, which required every Black person to carry a reference book filled with various personal
information at all times (Ibid). These acts lead to massive protests, such as the Women’s March
to the Union building6, and the Sharpeville massacre, which left seventy Black protesters dead
and got the African National Congress (ANC) banned. Nelson Mandela and other ANC activists
were jailed for life in 1963, and actions from the Apartheid Government started to be
condemned by the international community. This resulted in South Africa being banned from
the Olympic Games and the UN declaring Apartheid a crime against humanity (BBC, 2018;
Dugard 2008, 1-2).

During the 1970s, around three million people were forced to Homelands 7 across the country.
Around 600 more young students were killed in Soweto during a large protest against the Bantu
Education Act. The 1980s were categorised by larger international protests and boycotts, as
well as regular revolts and a six year long declared state of emergency (Longman & Brown,
2018). In addition, the international protests against Apartheid grew, resulting in economic,
political and cultural sanctions, putting a pressure on the South African economy and forcing
the government to prepare a transition to full democracy for all South Africans (CIA, 2021; The
Commonwealth 2021). The decade ended with FW de Klerk being elected president and talks
between him and Mandela taking place (BBC, 2018). In 1990, Mandela was released from
prison and discussions between the NP, ANC and other parties began the following year,
leading to a repeal of old Apartheid laws. In April 1994, the ANC won the first democratic non-
racial elections and Mandela became president (Ibid).

2.1.1 Education during Apartheid

The education system during Apartheid focused on segregation. The ruling National Party

6
 The march to the Union Buildings in Pretoria took place on August 9th 1956, when 20 000 women of all races protested against “The
Abolishment of Passes act”. They marched under the slogan “If you strike a woman, you strike a rock, you will be crushed!” (Boddy-Evans,
2018) This day is celebrated every year as the Women’s Day in South Africa (South African Government, 2021; Lenser, 2019, 10)
7
 The Homelands policy resettled by force over 3.5 million black citizens to areas called homelands, who in size were and location where
ineffective for its inhabitants. The homelands were not self-sufficient, instead by purpose tied to the White areas for employment and goods.
The land that was taken from the black population and sold for a low prize to White farmers (Apartheid Museum, 2021; NYTimesOpinion,
1981). A map of the apparent size differences of the homelands and their locations are included in the Appendix on page 75.
 6
passed the Bantu 8 Education Act in 1953 and the Coloured Persons Education Act in 1963 9 to
prepare the Black and Coloured communities for their role in society, decided by the
government. With these laws, the state brought all Black and Coloured schools under
government control and forbade any school to function if it did not teach a government-
approved curriculum (Dlamini 1990, 39-42). The aim was total control of the education system
in order to reproduce and reinforce the racial inequalities and hierarchy that already existed in
society (Ibid). The language of instruction was specified to be either Afrikaans or English,
creating a substantially higher barrier to education for Black students than for White or
Coloured students, whom the majority spoke either language (Dlamini 1990, 20; Bloom 1967,
145). When the Bantu Education Act was debated in Parliament, the following remarks were made
by Henry Verwoerd, Minister of Native Affairs: “There is no place for (the African) in the European
community above the level of certain forms of labour. It is of no avail for him to receive a training
which has its aim, absorption in the European community” (Wills 2011, 3). The Apartheid
government had specific plans for the implementation of this through Bantu Education in Black
schools. These plans included substantially fewer qualification standards for teachers in Black
schools and a one-tenth per capita state funding for Black schools compared to their White
counterparts (Equal education 2015, 19).

Apartheid did not only segregate among races but also along gender lines. Separate classrooms,
sporting fields and spaces occurred in all three education systems, where girls often got silenced
and directed to smaller spaces than the boys (Carrim 2007, 181-183). In performance, girls were
able to keep up with the boys on the primary level but fell behind in secondary school. They were
often directed away from subjects where boys dominated to avoid competition, and experienced
oppression and harassment in school with the fear of being expelled if they spoke out (Ibid). This
treatment occurred both for female students and female staff. Female staff members also received
smaller salaries and fewer benefits, and were rarely given management positions. The experiences
of women and girls in the education struggle were often downplayed until Apartheid was abolished,
when more attention was given to these issues in order to address the challenges that they faced in
school (Ibid).

Bantu education, unlike the White and Coloured education, was neither compulsory nor free,
creating substantial economic barriers for many families wanting their children to stay in school
(Johnson 1982, 220). The state also systematically replaced White and male teachers from Black
schools with Black and female teachers to make the education less costly, since female teachers
were paid less. In addition, most of the school budget for Bantu education went to teachers’ salaries,

8
 In the law, “Bantu” is a synonym for a “native” person. However, in this thesis, the term “Black” is used instead.

 7
creating a lack of proper facilities and equipment for the students (Equal Education 2015, 19). At
the end of Apartheid, a Black school generally consisted of not much more than a building, (Lemon,
Battersby-Lennard 2009, 518). These practices by the Apartheid Government were met by
resistance from the Black population, culminating in protests such as the Soweto uprisings in
1976. 10 After being released from prison, Mandela called the Bantu education system “a crime
against humanity” (Ibid).

The Coloured Person’s Education Act of 1963 was met with frustration and opposition from the
Coloured community. Similarly to Bantu education, the act brought Coloured education totally
under state control, enabling the Apartheid government to fulfil its vision for the Coloured students
to be a group separated from the White and Black cultures (Parliament Act No. 47 of 1963; Bloom
1967, 149; Carrim 2007, 177-178; Roussow 1974, 17). Limited employment opportunities,
underfunding of schools and unqualified teachers posed a challenge for the Coloured schools. In
addition, a significant dropout rate caused concerns due to parents taking their students out of school
to look after their siblings or to work (Roussow 1974, 16-18). Due to lower salaries for Coloured
teachers compared to their White counterparts, some qualified teachers, along with other highly
educated Coloured persons, left South Africa in search of higher salaries abroad (Ibid). There were
also challenges with racial classification due to the Population Registration Act 30 of 1950. Some
families applied to be reclassified, while others were waiting to be classified, resulting in their
children being unable to attend school, in some cases for years, until the process was completed
(Ibid). The Afrikaans language policy that lead to the Soweto uprisings was designed to bring
Coloured and White communities closer together, but was instead met with disapproval from
Coloured students and teachers who became more vocally critical towards the Apartheid regime
(Ibid). The state funding for Coloured schools was significantly lower than for White schools during
the whole Apartheid period (Wills 2011, 85-88).

The White education system was designed to be the best in South Africa in order to favour the
White population. School for White English and Afrikaans students was free and compulsory from
age 7 until 16. In addition, the state covered the cost of all books and other educational equipment.
In the classrooms, the curriculum attempted to convince the student of White supremacy and
Afrikaner Nationalism though various methods. 11 The schools were also creating an environment
where male aggression, homophobia and patriarchal assumptions could flourish (Carrim 2007 183-
184). Since the schools were mainly segregated in terms of areas, staff and students, Black or

10
 The Soweto uprisings were a series of protests that took place primarily in Soweto, but also were spread to other areas such as Cape Town
and Port Elizabeth (Ndluvo 2011, 350). The Bantu Education policies had, for some time, left the black schools overcrowded and
underfunded, causing growing frustration among the black population (Ibid, 321-323). When the Bantu education board forced Afrikaans as
a language of instruction in all schools, it created a series of protests across South Africa that left 575 people dead from police brutality and
street violence (Ibid, 350).
11
 Afrikaner schoolbooks contained messages such as “South Africa belonged to Afrikaners”, ”The Afrikaner was threatened” and “Whites
were superior, Blacks were inferior” (Wills 2011, 15-16)
 8
Coloured students who enrolled with White students were often marginalised (Ibid, 179). Receiving
the most funds per capita from the government and having the highest enrolment rate, White
students were better at passing the matric, although their performance was decreasing significantly
towards the end of Apartheid. Table 1 illustrates the state funding, the performance and the
conditions in the different schools during Apartheid:

Table 1: Comparison of different educational variables between racial categories during
Apartheid

 State spending per student on education in Rand by race:

 Year: Black Coloured White

 1953 17.1 N/A 127.8

 1960 12.5 N/A 144.6

 1971 25.3 94.4 461

 1980 176.2 286.1 1 021

 1986 477 1 021 2 508

 School enrollment ratios in percentage by race:

 Black Coloured White

 1950 32.9 67.9 85.8

 1960 45 69.2 94.9

 1970 54.2 74.6 95.7

 1980 83.1 93 96.3

 Teacher-Student ratio by race:

 Black Coloured White

 1960 1:57 N/A 1:23

 1970 1:65 1:31 1:20

 1980 1:47* 1:25 1:19

 Percentage of the population illiterate by race:

 Black Coloured White

 1980 33 15.5 0.7

 Sources: Wills (2011), 87, 112; Pillay (1984), 2, 14, 19; Johnson (1982), 220
 *The data for Transkei, Venda and Bophuthatswana is missing for Black schools

 9
From Table 1, the unequal treatment by the Apartheid government regarding education for different
races is visible. The differences in state funding for education illustrates the financial framework
that the schools had available for its students, and even though the funding for all races has increased
and the gaps between races have decreased over time, the inequalities are consistently present. In
all variables, the numbers show the following: firstly, the White schools have the best results while,
in contrast, the Coloured schools outperform the Black schools. Secondly, the situation has over
time improved for all races. Thirdly, racial inequalities have been decreasing, but significant
differences are still apparent. The illiterate percentage of the population by race shows the most
substantial gaps between races and shows that the education system has created large inequalities
between the three main population groups in South Africa.

2.1.2 Employment during Apartheid

Just like education, the labour market became a sector for which new legislation was
implemented to fit the racial vision of the National Party. In 1956, the Industrial Conciliation
Act was passed, which segregated the labour market significantly (Mariotti 2009, 5). This act
gave certain employers’ organisations and trade unions the power to negotiate positions and
salaries for each racial group. Since the act also segregated the unions and banned any Black
representatives, White unions could therefore legally negotiate high paying positions that
required certain levels of skills for themselves, while occupations with lower salaries and
required skills were given to Black and Coloured workers who were unable to negotiate their
salaries or positions (Ibid; Hepple 1971, 51). This created layers of different worker protections
where Whites had the best union rights and access to the highest paying jobs, Coloured workers
had fewer rights, options and often lower pay than Whites, while Black workers were inferior
to both Whites and Coloureds in rights, opportunities and salary (Hepple 1971, 11). In addition,
the right to strike was generally limited and completely forbidden for Blacks, who also received
higher penalty fees if caught striking illegally (Ibid, 28-29).

The Industrial Conciliation Act was later expanded, giving the Minister of Labour the power to
reserve any industry or trade occupation for a certain race. This extension, called “job
reservation”, lead to substantial racial inequalities and caused many Coloured and Blacks to
lose their jobs (Hepple 1963, 6-8). One industry that experienced major changes due to this
extension was the clothing industry which in 1957 was declared a White works only sector,
leading to the discharging of around 35 000 Black and Coloured workers (Ibid). This created a
huge challenge for the industry who struggled to find White workers to fill its positions, leading
to the government to grant a “mass exemption” to allow other races to be employed in the
industry. However, they could be fired at any moment if the Minister of Labour found it
 10
necessary, which caused severe insecurity for employees that were not White (Ibid). These acts
drew the attention of the International Labour Organization in Geneva, who banned South
Africa in 1966 (Ibid; ILO 2002).

The consequences of the acts, along with other discriminatory legislation, were putting
constraints on the South African economy. The labour market started to desegregate in the end
of the 1960’s for semi-skilled occupations, but it was not enough and severe economic
challenges were putting the economy close to a standstill. Despite this, the government was
committed to continue enforcing their acts which were causing a growing frustration for Black
and Coloured workers (Mariotti, 2009, 2-3; Pons-Vignon & Anseeuw, 2009, 886). Major strikes
forced the government to improve general working conditions and recognise Black worker
unions, but it did not stop the unrest. Now legally recognised and more powerful, these unions
continued the struggle to fight for equal pay and rights outside the workplace, which played a
considerable part to bring down the Apartheid system (Ibid; Klaveren et al 2009, 9).

Women of all races faced additional challenges in the labour market due to the strong gender
roles that existed in South African society. Employment was, and still is, a source of
empowerment for women globally because it brings financial independence, improved self-
identity and awareness to have work and income (Nolde 1991, 217). However, societal norms
and systematic harassment from partners was a considerable obstacle for earning an income for
many, since it was seen as a threat that women could become financially independent (Lenser
2019, 7-8). It could also be seen as irresponsible to be employed, instead of taking care of
traditional domestic home duties such as childcare (Nolde 1991, 216; UN 1978, 13). The
Apartheid government did little to eliminate these roles or protect women on the labour market,
and instead actively worked to maintain them (Lenser 2019, 93). By legalising short maternity
leaves, allowing employees to fire pregnant women easily and making abortion practically
illegal, female employment was purposely being opposed by the state (Nolde 1991, 209-210).
Many Black women were employed as domestic workers, which was a sector that was not
regulated by any formal minimum wages. This gave the employer close to full control of wages
and working conditions, while the employee had practically no method of negotiating the
employment terms (Ibid). Lastly, women were generally receiving lower wages than men. One
example is the previously discussed textile industry, where women were paid around 20% less
than the national minimum wage (UN 1978, 18).

 11
2.2 South Africa, its education and employment system Post-Apartheid 1994
until today

This subchapter will focus on the significant shifts and policies in the education sector that
occurred after Apartheid, as well as their intentions and implications. In the post-apartheid era,
the new ANC governments 12 were tasked with tackling the troubling legacy of systematic
discrimination and segregation in the schools and employment sector on the national level. For
education, the steps taken included reforming teacher qualifications, updating the school
curriculum, desegregating schools and changing the funding system. The steps for both sectors
will be discussed below.

2.2.1 The Education system and its current challenges

During Apartheid, there was segregated state education for teachers that took place in teacher
training colleges. Back then, the race of the teacher determined the workplace as well as the
teaching curriculum that matched the state vision for the education for the specific race (Equal
Education 2015, 17-25). The new ANC government decided that all the future teachers needed
to attain a four-year Bachelor of Education from a University. However, this rapid major shift
created some challenges, such as a significant drop in education students (Ibid). In addition, the
standards for education students were set on a level where the state hoped they would be, instead
of where they currently were, due to unequal education that the students had received previously
(Ibid). In the transition of teacher education from teacher training colleges to universities, the
lessons and expertise from the previous institutions were not included in the new education,
and the funding from the state for the process was inadequate, resulting in insufficient education
with fewer graduates before the change (Ibid). Currently, South Africa faces a significant
shortage of qualified teachers in its schools, which poses a considerable challenge for schools
to provide quality education to its students (Maphalala & Mpofu, 2009).

When Apartheid ended in 1994, the new government needed to find a way to desegregate the
schools, especially former White schools, and create solutions to fund the schools equally. For
the former White schools, there was a fear that less funding would convince economically
privileged Whites to form private schools, which would over time outperform the public
schools. To avoid the rise of private education, a compromise was made: The School Governing
Boards (SGB) of a school could decide to charge school fees instead to get the resources to

12 The ANC have won every national election since 1994, securing a majority of the seats in the South African parliament

since Apartheid (IEC, 2020a; IEC, 2020b). In the latest 2019 national election, the ANC received 57.5% of all votes,
resulting in 230 parliament seats out of 400 (IEC, 2020b).
 12
keep the previous high education quality (Spaull 2019, 5-7). However, a contradictory rule was
added that stated that “no learner may be refused admission to a school or discriminated against
in any way on the grounds that his or her parent (i) is unable to pay or has not paid the school
fees” (Woolman 2009, 29). Unfortunately, this rule did little to exclude non-fee students
through different strategies that a SGB could use. These included policies such as only
accepting students from specific “feeder zones”, targeting nearby students would likely be able
to pay fees since the schools were often located in formerly White areas. Another method was
to teach only in Afrikaans or English, and requiring a certain knowledge in the languages from
future students to be accepted, creating a language barrier for Black students (Spaull 2019, 8-
10). With the additional fee income, the top schools can afford to pay higher salaries to their
staff, getting in return educated and talented teachers and principals who would work in well-
resourced schools that are safer due to smaller class size (Equal Education 2015, 106-107).
Schools in former Black and Coloured areas usually do not have the option to require fees since
families from their feeder areas generally cannot afford them, making them unable to compete
with the schools collecting fees. Therefore, these schools have to rely on public funding (Lemon
& Battersby-Lennard, 2009, 527). Although schools with higher poverty levels receive higher
funding than wealthier schools, the amount is not enough to reduce the current inequalities
(Ibid).

In 2005, the latest C2005 curriculum was introduced, more commonly known as Outcome-
based-education (OBE), replacing school subjects and introducing learning areas instead. This
was done through a learner-centred focused pedagogy, introducing a brand-new thinking for
the teachers. The idea, in theory, might have been a step in the right direction, but due to several
factors, it became an additional burden (Equal education 2015, 25-27). Firstly, the curriculum
was drafted and introduced on short notice, leaving the teachers too little time to be introduced
and prepare the new thinking (Ibid). Secondly, it failed to consider the unequal capacity of
teachers and learners to implement the curriculum. Due to the complex but broad individual-
focused content, OBE with its learning outcomes was differently understood and
operationalised by teachers (Ibid). Thirdly, since the curriculum required teachers to follow up
on the individual learner’s progress, it became an additional burden for teachers, especially in
schools with large classes, leaving less time for the actual teaching. Lastly, OBE did not
consider the inequalities in the schools regarding access to textbooks, libraries and computer
labs, making it impossible for some schools to fulfil some aspects of the curriculum (Ibid). Due
to all these factors, OBE became largely a failure and did little to improve pedagogy in the
schools. (Ibid; Spaull 2019, 2).

 13
On an international level, results from the latest Progress in International Reading Literacy
Study (PIRLS) revealed the poor performance of literacy in South African primary schools.
The study placed South Africa last out of the 50 countries that participated, finding that almost
8 out of 10 of the fourth-grade students are unable to read at the lowest international standard.
(Howie S.J et al 2017, 168-172). The report also found that girls perform substantially better
than boys, students coming from schools located in rural areas or township have generally lower
literacy, the class size is increasing with an average of 45 students and no significant progress
has been made for South Africa since the earlier PIRLS report from 2011 (Ibid). The reading
skills are critical for students to advance to higher classes and graduate from secondary school.
However, this skill is missing in far too many students and could in the future become a
substantial obstacle to overcome for future education and employment opportunities (Ibid). It
is also worth mentioning that there are significant differences in literacy performance between
the richest 10% of South African schools and the remaining 90%. Figure 1 shows the magnitude
of these inequalities:

Figure 1: Grade 4 learners who can read at a basic level in any language in percentage by
deciles of average school wealth (Decile 1, lowest wealth, Decile 10, highest wealth)

 Source: Spaull, (2019), 5.

Figure 1 shows that schools belonging to decile 1 and 5 generally perform at similar levels,
while schools belonging to decile 6-9 have a slightly better performance. However, there is a
tremendous difference between schools belonging to decile ten and all the remaining schools,
giving their students a substantial advantage over the rest. Since 85% of all White students
attend fee-charging schools, they will receive quality education on a level that most other
schools cannot compete with. Combining all these factors, it seems that quality education has
transferred from a race privilege to class privilege, keeping most of the unequal legacy of
Apartheid alive (Spaull 2019, 2-3).

 14
Since Apartheid, the education has been improved with more South Africans staying in school
longer and graduating from grade 12. However, there are still many who fail to get a Matric
certificate, while substantial racial inequalities still exist. Table 3 shows the racial education
levels in South Africa:

Table 2: Level of education per race in South Africa 1996-2011 in percentage:

 Level of education attained amongst persons aged 20 or older in South Africa (%)

 Black Coloured White

 1996 2001 2011 1996 2001 2011 1996 2001 2011

 Higher 3.6 5.2 8.3 4.9 4.9 7.4 26.8 29.8 36.5

 Completed Secondary (Gr 12) 12 16.8 26.9 12.3 18.5 25.2 39.3 40.9 39.5

 Some schooling but no Matric pass 60.4 55.8 54.3 72.9 68.3 63.2 32.8 27.9 27

 No schooling 24 22.3 10.5 10 8.3 4.2 1.1 1.4 0.6

Source: Christopher, A.J. (2015) page 518.

Table 2 shows that racial inequalities still exist on the national level, but it has been steadily
improved for all during the observed period. In 2011, the Black population had a slightly higher
education than the Coloured population nationally. However, a clear majority still do not
graduate from grade 12. The White population have a significantly higher education than the
Black and Coloured population, and considerable inequalities are also found in the levels “No
schooling” and “Higher”. In 2011, Whites had a more than four-time higher rate of higher
education graduates than Blacks and Coloureds in South Africa.

2.2.2 The employment system and its current challenges

In 1997, after negotiations between the ANC, the Congress of the South African Trade Unions
and the South African Communist Party, the Basic Conditions of Employment Act (BCEA)
was born. This legislation gave workers the right to, among other things, a 45-hour workweek,
the right to sick leave and 21 days of annual leave. The legislation also gave the minister of
labour the power to intervene in negotiations between labour unions and employees if there was
a concern that the workers were in an unfavourable position (Pons-vignon & Ward 2009, 886).
In addition to the legislation, an employment strategy called “Growth, Employment and
Redistribution” (GEAR) was presented a year earlier. This strategy set up goals for the South
African economy to create, on average, 270 000 new jobs per year during a four-year period
(Oosthuizen & Bhorat 2005, 1). Both GEAR and BCEA were necessary reforms but ultimately

 15
fell short in their accomplishments and the increase in employment was slightly over 100 000
jobs per year during the period. Due to the continuous levels of high unemployment, employers
have been able to continue with practices that oppress and exploit workers, with the workers
receiving little from the government (Pons-vignon & Ward 2009, 895; Ibid). To get the benefits
that BCEA outlines, the workers need to have a written official contract, which almost one-
third are missing. Even if the contract is in order, benefits such as paid leave and maternity
leave are often left out. The more vulnerable a worker is, the less likely it is that the employer
grants these benefits and rights. For example, 78% of the domestic workers reported that their
legislative working benefits are missing, an industry where 9/10 are women (Hlangani SA, 3;
Klaveren et al. 2009, 22).

Women working in other industries and in society at large are often victims of harassment and
violence. A survey from the agency Columinate from 2018 found that close to one-third of its
female respondents reported being subject to sexual harassment at work, while the figure for
men was almost one-fifth (Smith, 2018). Gender-based violence is one of the most common
types of discrimination in South Africa, present among all population groups (Álvarez & Lally
2014, 9). Amnesty International estimates that one woman is killed every sixth hour by her
partner, and around 45 000 cases of rape were reported each year to the South African Police
Service between 2008-2018 (Wilkinson 2016; Amnesty International 2005, 23). The HIV rate
for women is twice as high as it is for men and South Africa, with the highest HIV rate in the
world at 20% of all the global HIV cases (Álvarez & Lally 2014, 9; Alliner & Fleishman 2019).
For many families, the cost of child care is a considerable financial burden, meaning that one
of the parents usually stay home to look after the children. In South Africa, this task mainly
falls on women which hurts them in their professional career, resulting in higher income
inequalities between women and men and lower likelihood for labour market participation for
women (Ruzicka 2018; Ferrant et al. 2014, 1-7). In addition, a recent labour survey found that
many women on maternity leave do not receive the financial support from their employers that
they are entitled to, and over 90% of the female respondents said that their partners do not help
in taking care of the children (TimesLIVE, 2019). Strong societal norms also place burdens on
women to fulfil their reproductive and domestic roles (Ibid; Ferrant et al. 2014, 1-7).

In 2018, president Ramaphosa presented the national development plan for the South African
economy to create 275 000 new jobs annually to combat the high levels of unemployment
(Tshwane, 2018). During that time, the economy struggled heavily in balancing job creation
and job losses. Statistics South Africa reported a decline of 135 000 jobs during 2017, while

 16
there was an increase of 45 000 individuals in the workforce 13. These numbers combined are
creating challenges for lowering the unemployment rate, a rate that has long been stable. Figure
2 presents the unemployment rate during the majority of the post-apartheid period:

Figure 2: Unemployment rate in South Africa 1998-2018 in percentage

35% 33,3%

30% 26,9%

25%

 25,0% 24,9%
20%

 22,4%
15%

10%

 5%

 0%
 1998 1999 2000 2001 2002 2003 2004 2005 2006 2007 2008 2009 2010 2011 2012 2013 2014 2015 2016 2017 2018

Source: International Labour Organization, ILOSTAT database (2021)

When looking at Figure 2, one can observe that the unemployment rate in South Africa has seen
a minor increase with almost two percentage points. During 1998-2002, the rate rose to one-
third of the workforce until it started decreasing, and then in 2008 when the trend shifted again.
From 2008 onward, it was slowly increasing to 26.9% in 2018. However, when looking at the
unemployment rate by gender and race, there are some substantial differences, as demonstrated
in Table 4:

13
 These numbers are the sum of all quarterly data from the Quarterly Labour Survey and the Quarterly Employment Statistics from 2017
(Statistics SA 2017a) (Statistics SA, 2017b, 1) (Statistics SA, 2017c) (Statistics SA, 2017d) (Statistics SA, 2017e) (Statistics SA, 2017f)
(Statistics SA, 2017g).
 17
Table 3: Post-Apartheid unemployment rate by gender and race

 Differences in the unemployment rate 1995-2011 in percentage

 Black Coloured White

 1995 2005 2011 1995 2005 2011 1995 2005 2011

 Unemployment Women: 47.6 52.9 52.9 28.4 36.6 34.4 8.7 10.8 12.5

 Unemployment Men: 29.5 36.7 39.8 17.9 25.8 28.6 3.7 5.5 8.1

 Unemployment in total: 37.8 44.8 46.3 22.8 31.0 31.5 5.8 7.9 10.2

Source: van der Westhuizen et al. (2007) p. 22 & Statistics South Africa (2012), 51-52.

Table 3 shows substantial racial differences in the unemployment rates, which have risen for
all racial groups during the period of 1995-2011. Unemployment for the Black population
group is the highest, close to 50% in 2011, while the Coloured group have gone from nearly
one-fourth to almost one-third. The White population group has the lowest level of
unemployment but has seen the largest unemployment increase during this period. Regardless,
it is much lower than the unemployment of Coloureds and Blacks. When observing the
differences by gender, women of all races have a higher unemployment rate than men.
However, the gender gap has decreased slightly, but this is because men’s unemployment rate
has risen more than women’s. Over half of Black women were unemployed in 2011, while the
rate for Coloured women was slightly higher than one-third. For White women in the same
year, only one in eight were unemployed, but their rate rose between 2005-2011 while the Black
and Coloured rates were stable or slightly lower.

A possible reason for the overall rise in unemployment between 1995-2011 is a combination of
a slowly growing economy unable to create a sufficient number of jobs and a rapid shift in the
labour market with a growing demand for high-skilled workers (Asmal et al 2020, 34). It is
expected that in the next decade, sectors that requires semi-skilled or high-skilled labour will
produce an overwhelming majority of the new jobs in South Africa (Ibid, 38). Here, racial
inequalities in the level of schooling become a challenge, since most of the Black and Coloured
working populations have not graduated from secondary school, which could create a skill
shortage in the labour market and difficulties for many individuals to find employment
(Statistics South Africa, 2021).

 18
You can also read