Farmers and the new green architecture of the EU common agricultural policy: a behavioural experiment
←
→
Page content transcription
If your browser does not render page correctly, please read the page content below
Farmers and the new green architecture
of the EU common agricultural policy:
a behavioural experiment

                       Dessart, F. J., Rommel, J., Barreiro-Hurlé, J.,
                       Thomas, F., Rodríguez-Entrena, M.,
                       Espinosa-Goded, M., Zagórska, K.,
                       Czajkowski, M., van Bavel, R.

                       2021

                                                                         EUR 30706 EN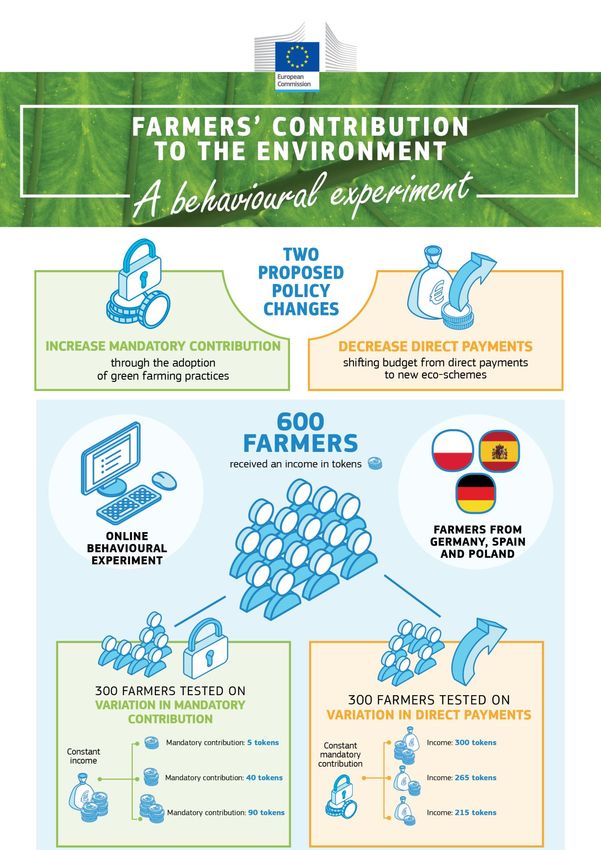
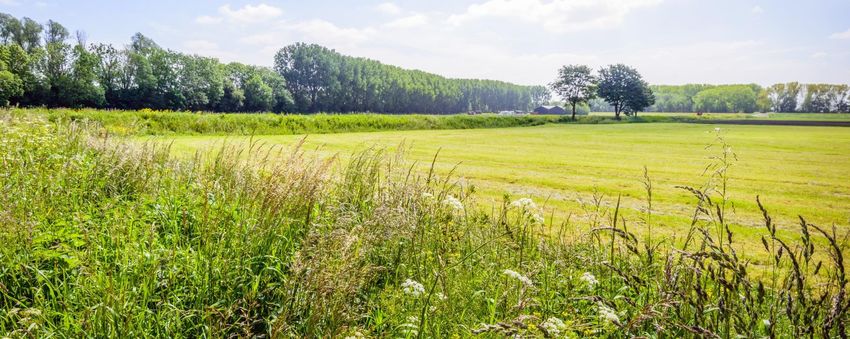
This publication is a Science for Policy report by the Joint Research Centre (JRC), the European Commission’s science and knowledge
service. It aims to provide evidence-based scientific support to the European policymaking process. The scientific output expressed does
not imply a policy position of the European Commission. Neither the European Commission nor any person acting on behalf of the
Commission is responsible for the use that might be made of this publication. For information on the methodology and quality underlying
the data used in this publication for which the source is neither Eurostat nor other Commission services, users should contact the
referenced source. The designations employed and the presentation of material on the maps do not imply the expression of any opinion
whatsoever on the part of the European Union concerning the legal status of any country, territory, city or area or of its authorities, or
concerning the delimitation of its frontiers or boundaries.

Contact information
Name: François J. Dessart
Address: Calle Inca Garcilaso, 3 – 41092 Seville – Spain
Email: francois.dessart@ec.europa.eu

EU Science Hub
https://ec.europa.eu/jrc

JRC123832

EUR 30706 EN

   PDF          ISBN 978-92-76-37778-8                ISSN 1831-9424            doi:10.2760/718383

Luxembourg: Publications Office of the European Union, 2021.

© European Union, 2021.

The reuse policy of the European Commission is implemented by Commission Decision 2011/833/EU of 12 December 2011 on the reuse
of Commission documents (OJ L 330, 14.12.2011, p. 39). Except as otherwise noted, the reuse of this document is authorised under the
Creative Commons Attribution 4.0 International (CC BY 4.0) licence (https://creativecommons.org/licenses/by/4.0/). This means that reuse
is allowed provided appropriate credit is given and any changes are indicated. For any use or reproduction of photos or other material
that is not owned by the EU, permission must be sought directly from the copyright holders.

Abstract
This behavioural experiment with farmers assessed the effect of two policy features of the new green architecture of the EU common
agricultural policy on the adoption of environmentally friendly practices: (1) increasing mandatory adoption and (2) shifting budget to
voluntary schemes. Results shed light on behavioural patterns, highlighting potential trade-offs between mandatory and voluntary
schemes to increase agriculture’s environmental and climate performance.

Acknowledgements
The authors would like to thank Florence Buchholzer and Sylvie Barel for their continuous and insightful guidance throughout the
completion of this study. In addition, we thank the following persons, who provided comments on the experimental design and on earlier
versions of this manuscript (presented in alphabetical order): Lara Blake, Taru Haapaniemi, Martin Hradisky, Elisa Koehr, David Laureau,
Zélie Peppiette, Emmmanuel Petel, Krzysztof Sulima and Marijke Van Schagen. Our gratitude also goes to Fabiana Scapolo, Maciej
Krzysztofowicz and Elena Raluca Ciobanu, who provided valuable guidance and support that contributed to the practical delivery of this
project. Finally, we thank all the farmers who participated in the pilots and in the study.

Copyright
Unless otherwise specified, all tables and all figures constitute the authors’ own elaborations.
Infographic: Borsello, A., Dessart, F. J.
All content © European Union, 2021, except front page picture, © Ruud Morijn, Adobe Stock, and icons, © Hilch, ylivdesign, NikWB,
nuengrutai, Happy Art, nadiinko, and tatianasun, Adobe Stock.

How to cite this report
Dessart, F. J., Rommel, J., Barreiro-Hurlé, J., Thomas, F., Rodríguez-Entrena, M., Espinosa-Goded, M., Zagórska, K., Czajkowski, M. and van
Bavel, R., Farmers and the new green architecture of the EU common agricultural policy: A behavioural experiment, EUR 30706 EN,
Publications Office of the European Union, Luxembourg, 2021, ISBN 978-92-76-37778-8, doi:10.2760/718383, JRC123832.
Contents

Executive summary .......................................................................................................................................................................................................................................... 7
1. Policy context, policy questions and objectives ........................................................................................................................................................11
        1.1. The common agricultural policy’s environmental measures until today ............................................................................11
        1.2. The new common agricultural policy and the new green architecture.................................................................................11
        1.3. Policy questions and objectives ..................................................................................................................................................................................12
        1.4. Structure of this report .......................................................................................................................................................................................................13
2. Behavioural research questions ...............................................................................................................................................................................................15
        2.1. Introduction ....................................................................................................................................................................................................................................15
        2.2. Independent variables .........................................................................................................................................................................................................16
        2.3. Behavioural outcome variables ..................................................................................................................................................................................16
        2.4. Behavioural research questions .................................................................................................................................................................................16
3. Selected national contexts ............................................................................................................................................................................................................17
        3.1. Selection of Member States for this research ..............................................................................................................................................17
        3.2. Agri-environmental and policy context in Germany ................................................................................................................................18
        3.3. Agri-environmental and policy context in Spain .........................................................................................................................................20
        3.4. Agri-environmental and policy context in Poland ......................................................................................................................................20
4. Literature review ....................................................................................................................................................................................................................................23
        4.1. The effect of increasing mandatory requirements ..................................................................................................................................23
        4.2. The effect of reducing basic income support for sustainability..................................................................................................24
5. Methodology ...............................................................................................................................................................................................................................................25
        5.1. General methodological approach ...........................................................................................................................................................................25
        5.2. The basic decision task .......................................................................................................................................................................................................26
        5.3. Instructions and token allocation task .................................................................................................................................................................27
        5.4. Assumptions and simplifications...............................................................................................................................................................................28
        5.5. Factorial design ..........................................................................................................................................................................................................................29
        5.6. Real incentives ............................................................................................................................................................................................................................30
        5.7. Other outcome variables and psychological variables .........................................................................................................................32
        5.8. Sociodemographic and farm-related variables ...........................................................................................................................................32
        5.9. Piloting, preregistration and ethical approval ...............................................................................................................................................33
                5.9.1.              Extensive piloting ...................................................................................................................................................................................................33
                5.9.2.              Preregistration of the experiment ..........................................................................................................................................................33
                5.9.3.              Ethical approval .......................................................................................................................................................................................................34
6. Fieldwork, sample and quality controls ............................................................................................................................................................................35
        6.1. Fieldwork ..........................................................................................................................................................................................................................................35
        6.2. Sample ................................................................................................................................................................................................................................................35
                6.2.1.              Introduction ..................................................................................................................................................................................................................35
                6.2.2.              Farm size ........................................................................................................................................................................................................................36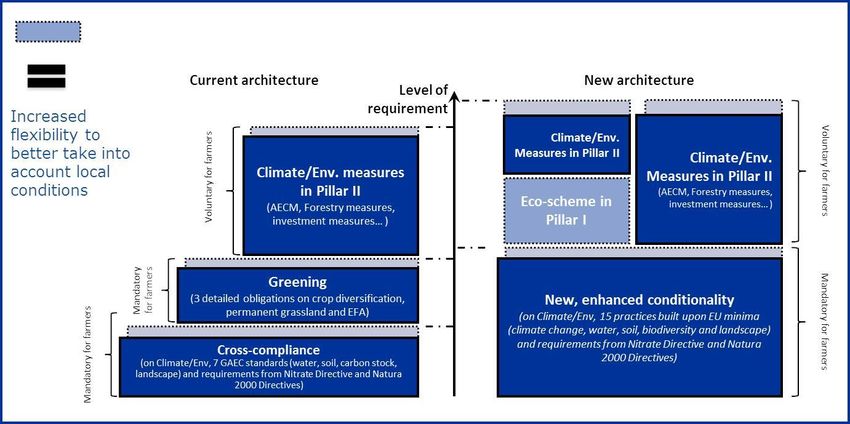
6.2.3.               Type of farming .......................................................................................................................................................................................................37
                6.2.4.               Farmer age ...................................................................................................................................................................................................................38
                6.2.5.               Other variables .........................................................................................................................................................................................................39
                6.2.6.               Integrated assessment of the sample’s representativeness .......................................................................................40
        6.3. Quality controls ..........................................................................................................................................................................................................................40
                6.3.1.               Fieldwork monitoring ..........................................................................................................................................................................................40
                6.3.2.               Comprehension check questions .............................................................................................................................................................40
                6.3.3.               Duration ...........................................................................................................................................................................................................................40
7. Findings ...........................................................................................................................................................................................................................................................41
        7.1. Introduction ....................................................................................................................................................................................................................................41
        7.2. Variation in mandatory contribution ......................................................................................................................................................................42
                7.2.1.               Effect on voluntary contribution ..............................................................................................................................................................42
                7.2.2.               Effect on total contribution ..........................................................................................................................................................................44
                7.2.3.               Effect on total contribution by different farmer profiles ................................................................................................46
                7.2.4.               Effect on share of (non-)contributors.................................................................................................................................................47
                7.2.5.               Effect on fairness perceptions ..................................................................................................................................................................48
                7.2.6.               Effect on likelihood of enrolling in agri-environment-climate measures ........................................................49
        7.3. Variation in direct payments .........................................................................................................................................................................................50
                7.3.1.               Effect on voluntary contribution ..............................................................................................................................................................50
                7.3.2.               Effect on total contribution ..........................................................................................................................................................................53
                7.3.3.               Effect on total contribution by different farmer profiles ................................................................................................55
                7.3.4.               Effect on share of (non-)contributors.................................................................................................................................................56
                7.3.5.               Effect on fairness perceptions ..................................................................................................................................................................57
                7.3.6.               Effect on likelihood of enrolling in agri-environment-climate measures ........................................................58
        7.4. Comparison of variation in mandatory contribution with variation in direct payments ......................................59
                7.4.1.               Introduction ..................................................................................................................................................................................................................59
                7.4.2.               Effect on voluntary contribution ..............................................................................................................................................................59
                7.4.3.               Effect on total contribution ..........................................................................................................................................................................61
                7.4.4.               Effect on share of (non-)contributors.................................................................................................................................................62
                7.4.5.               Effect on fairness perceptions ..................................................................................................................................................................63
                7.4.6.               Effect on likelihood of enrolling in agri-environment-climate measures ........................................................64
        7.5. Opinion on the common agricultural policy ....................................................................................................................................................65
8. Discussion, policy messages, and conclusion .............................................................................................................................................................67
        8.1. Strengths and limitations of this study ..............................................................................................................................................................67
        8.2. Policy messages ........................................................................................................................................................................................................................68
                8.2.1.               Enhancing conditionality .................................................................................................................................................................................68
                8.2.2.               Reducing basic income support for sustainability payments ......................................................................................69
                8.2.3.               Conditionality versus basic income support for sustainability ...................................................................................70
        8.3. Concluding remarks................................................................................................................................................................................................................71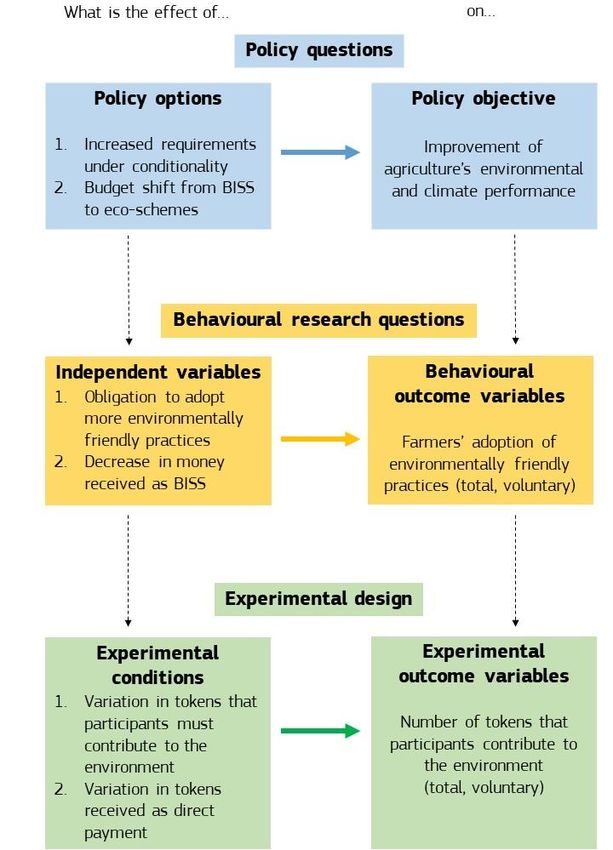
References .............................................................................................................................................................................................................................................................73
Abbreviations ......................................................................................................................................................................................................................................................79
List of boxes.........................................................................................................................................................................................................................................................80
List of figures .....................................................................................................................................................................................................................................................81
List of tables ........................................................................................................................................................................................................................................................83
Annexes ....................................................................................................................................................................................................................................................................85
        Annex 1. Written instructions for the experiment ...................................................................................................................................................85
        Annex 2: infographic ...........................................................................................................................................................................................................................91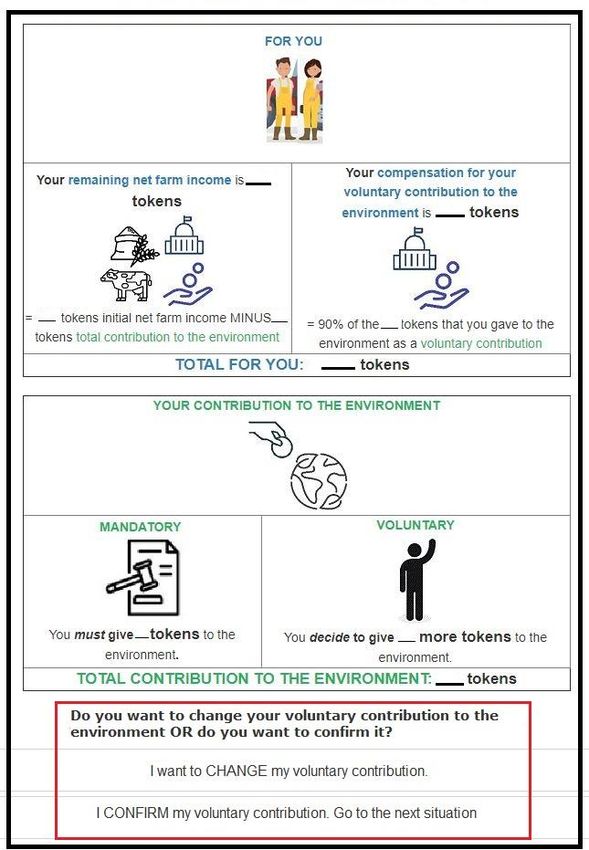
Executive summary
What is the policy challenge?
One of the major policy objectives of the 2021-2027 EU common agricultural policy (CAP) is to improve the
environmental and climate performance of agriculture. To reach this and other objectives, the European
Commission proposed a new green architecture. Two of the main changes proposed are the following.
    (1) Enhancing conditionality, that is, increasing the requirements related to environmentally friendly
        farming practices that farmers must implement to receive direct support.
    (2) Introducing eco-schemes, a new instrument whereby farmers would voluntarily commit to the
        adoption of more environmentally friendly practices against a yearly compensation. Eco-schemes
        would be funded through the direct payments budget, primarily through a budget shift from basic
        income support for sustainability (BISS).
How can this new green architecture of the CAP improve the environmental and climate performance of
agriculture? The challenge will be to find the right balance between mandatory measures (i.e. conditionality)
and voluntary schemes (i.e. the new eco-schemes and the existing agri-environment-climate measures -
AECMs).

What was the objective of this study?
The objective of this study was to gather empirical evidence on farmers’ behaviour to inform the implementation
of the new green architecture of the CAP.
Studying farmer reactions to this new policy context was warranted because the achievement of higher
environmental and climate performance from agriculture will partly depend on farmers’ behaviour, in particular
their enrolment in voluntary schemes. There was a need to collect behavioural evidence, as the existing related
literature was scant.
In particular, this study aimed to answer the two following research questions.
    1.   How, and to what extent, would enhancing conditionality affect farmers’ adoption of more
         environmentally friendly practices (through voluntary schemes and in total)?
    2.   How, and to what extent, would a decrease in farmers’ basic income support for sustainability
         (following the introduction of eco-schemes) affect farmers’ adoption of more environmentally friendly
         practices (through voluntary schemes and in total)?

What methodological approach did this study use?
Six hundred farmers from Germany, Spain and Poland took part in a behavioural experiment (see Figure 1).
This experiment was a simplified representation of real decision settings, designed to reveal basic
behavioural patterns. Readers must interpret the findings with caution, taking into account the specificities of
the experiment.

                                                       7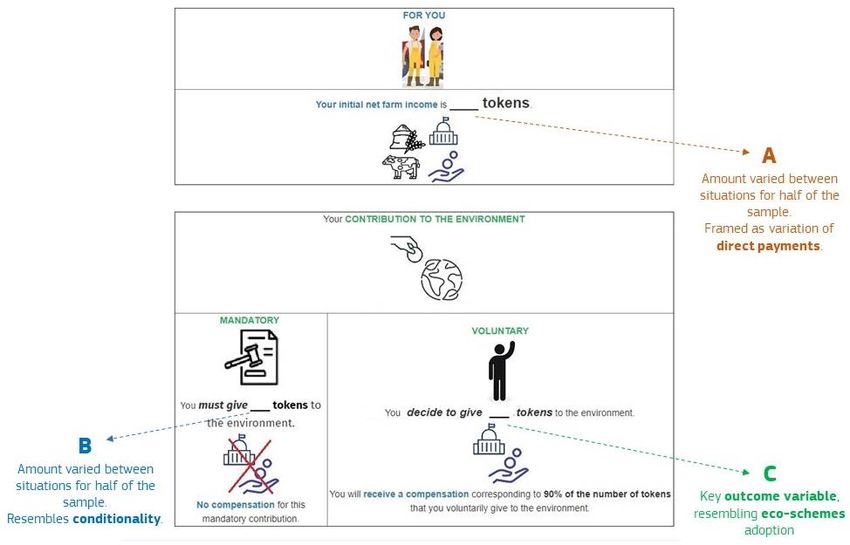
Figure 1. Main features of the behavioural experiment

Participants were given a certain number of tokens that represented their net farm income (see A in Figure
1), which included both their profit from agricultural products and their direct payments (a simplification
representing BISS).
All participants had to make a mandatory contribution of a certain number of tokens to the environment,
with no compensation in return (see B in Figure 1). This mandatory contribution was meant to represent
conditionality linked to CAP support.
For half of the participants, the amount of net farm income (A in Figure 1) varied between three different
situations, and was presented as a variation in direct payments. For the other half of the participants, the
amount of mandatory contribution (B in Figure 1) varied between three different situations.
Participants’ task was to decide how many of the remaining tokens they would voluntarily give to the
environment (see C in Figure 1), a proxy for farmers’ adoption of eco-schemes. Participants received yearly
compensation amounting to 90 % of the tokens voluntarily contributed. This 90 % compensation accounted for
the administrative and behavioural change costs that farmers face when enrolling in 100 % compensated
voluntary schemes.

                                                       8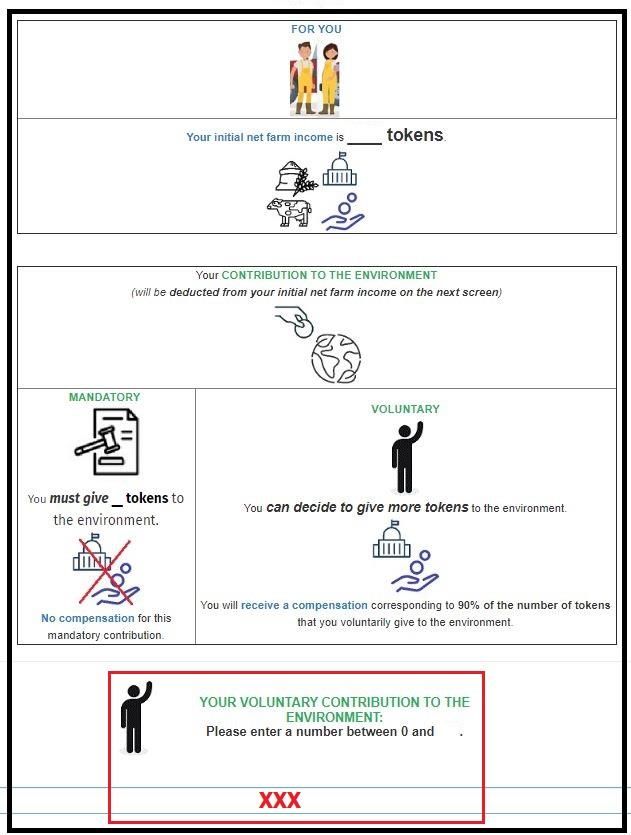
What did the study find?
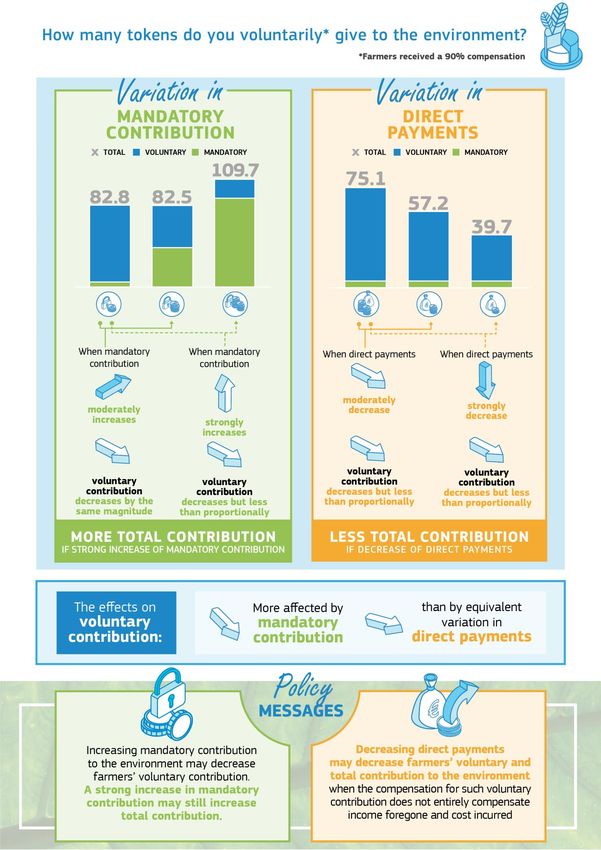
The effect of increasing mandatory contribution (i.e. increase in B in Figure 1)
Figure 2. Effect of varying the mandatory contribution to the environment
120
Total contribtution to the environment
109.1
110
100
(number of tokens)
90 82.8 82.5
80
70
60
Voluntary (C)
50
Mandatory (B)
40
30
20
10
0
Variation in mandatory
contribution (B)
1. When the mandatory contribution to the environment increased from 5 tokens (first blue bar in Figure
2) to 40 tokens (second blue bar in Figure 2), participants reduced their voluntary contribution by
approximately the same amount on average (green bar in Figure 2), leaving the total contribution (blue
bar + green bar) virtually unchanged.
Policy message: a small enhancement in conditionality may result in farmers enrolling less in
voluntary schemes, leaving the total adoption of environmentally friendly practices unchanged.
Nuance: this effect might only occur in the short term. Farmers in real life may reap long-term
benefits from the adoption of environmentally friendly practices and may learn from the adoption of
mandatory practices. These aspects were not captured in the experiment.
2. When the mandatory contribution to the environment increased from 5 tokens (first blue bar in Figure
2) to 90 tokens (third blue bar in Figure 2), participants reduced their voluntary contribution on average
(green bar in Figure 2), but their total contribution (blue bar + green bar) still increased substantially.
Policy message: a major enhancement in conditionality may increase the total adoption of
environmentally friendly practices.
9
The effect of decreasing direct payments (i.e. decrease in A in Figure 1)
Figure 3. Effect of varying direct payments
120
Total contribtution to the environment
110
100
90
(number of tokens)
80 75.1
70
60 57.2
50 Voluntary (C)
39.7
40 Mandatory (B)
30
20
10
0 Variation in inital net
income (A) framed as
variation in direct
payments
3. When farm income decreased from 300 tokens (first bar in Figure 3) to 265 tokens (second bar in
Figure 3) because of a decrease in direct payments, on average participants reduced their voluntary
contribution (green bar in Figure 3), but less than proportionally. The total contribution to the
environment (blue bar + green bar) significantly decreased. The same pattern occurred when farm
income decreased from 300 tokens (first bar) to 215 tokens (third bar).
Policy message: a budget shift from BISS to eco-schemes may reduce total adoption of
environmentally friendly practices if farmers are not fully compensated.
Nuances. (1) This effect is probably highly contingent upon the level of compensation for eco-
schemes, which in this experiment was set at 90 %. (2) In real life, farmers may not determine the
costs of adopting the practices under eco-schemes exactly and consider them in such a transparent
way as in the experiment. They may also mentally account separately for eco-scheme compensations
and the cost of adopting environmentally friendly practices.
Other variables of interest
4. The study also looked at the effects on the share of participants who contribute at least 1 token
(vs no token at all) on self-declared likelihood of adopting agri-environment-climate measures,
and on the perception of fairness.
What can we conclude?
This research constitutes a first piece of behavioural evidence on the effect of the new proposed CAP green
architecture on farmers’ decisions. The assumptions and the simplifications of the experiment make it necessary
to interpret findings with caution and nuance.
The experiment sheds light on potential trade-offs between mandatory (i.e. conditionality) and voluntary (i.e.
eco-schemes and AECM) schemes of the CAP. The study revealed behavioural patterns consistent with the
ideas that, compared with the current CAP:
(1) Enhancing conditionality may decrease farmers’ level of enrolment in voluntary schemes,
but may still increase the overall adoption of environmentally friendly practices if there is
a substantial increase in conditionality.
(2) Reducing BISS in favour of eco-schemes may decrease farmers’ level of enrolment in
voluntary schemes and total adoption of environmentally friendly practices when the
compensation for such schemes does not entirely compensate for income forgone and cost
incurred.
101. Policy context, policy questions and objectives
1.1. The common agricultural policy’s environmental measures until today
The common agricultural policy (CAP) has provided economic support to farmers since the 1960s. In 1992, the
European Commission introduced the agri-environmental schemes (AES), the first voluntary instrument to
encourage farmers towards environmentally friendly practices. AES are a multiannual contract between public
authorities and farmers whereby the latter adopt more environmentally friendly practices against a payment
that covers their costs incurred or income forgone. Through the different CAP reforms, these voluntary schemes
have covered more and more environmental domains and have gained weight in the overall CAP budget. As
part of the 2013 reform, AES were relabelled agri-environment-climate measures (AECMs) to reflect the
growing importance of climate action in the EU’s agricultural policy.
In addition to voluntary measures, the CAP also includes mandatory measures that farmers must comply
with in order to receive direct payments. Since the Agenda 2000 (European Commission, 1997), these
mandatory measures include cross-compliance applied to direct payments. This means that farmers must
implement good agricultural practices to be eligible for CAP payments. Successive reforms of the policy
strengthened the environmental dimension of cross-compliance, with a comprehensive list of measures that
aim to ensure that farmland is in good agricultural and environmental conditions (GAEC) and that farmers
comply with statutory and mandatory requirements (SMRs).
The 2013 reform included, in addition to cross-compliance, a greening conditionality associated with 30 % of
direct payments. Greening requires farmers to increase crop diversification, to maintain permanent grasslands
and to dedicate 5 % of their arable land to areas beneficial for biodiversity, known as ecological focus areas.
Although, theoretically, farmers may choose not to implement the greening measures and forgo the associated
30 % of their direct payments, preliminary evidence (Dessart, 2019; Solazzo & Pierangeli, 2016) suggests that
farmers have varied perceptions of whether greening is a voluntary or a mandatory measure. The facts that
the vast majority of farmers did not have to change their farming practices to comply with greening (Louhichi
et al., 2018) and that greening practices are implemented ‘by nearly all farmers subject to greening’ (European
Commission, 2017b, p. 61) may partly explain this blurred perception.
1.2. The new common agricultural policy and the new green architecture
Following the standard 7-year cycle, a revised CAP should start its implementation in 2023. The review process
started in June 2018 with the European Commission tabling three legislative proposals (European
Commission, 2018d, 2018e, 2018f). The proposals are an attempt to provide the right tools to help the sector
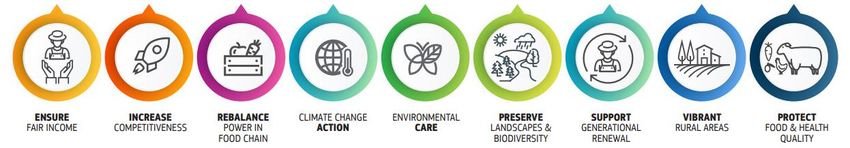
respond to emerging economic, environmental and social challenges. The proposed CAP aims to reach nine
specific objectives (Figure 4) related to the economy, the food system, climate and the environment, and social
issues.
Figure 4. The nine CAP objectives
Source: European Commission (2018c).
Regarding the climatic and environmental aspects of these legislative proposals, there are three main aspects
worth mentioning. First, the proposals aim to set higher ambitions for environmental and climate action.
Second, the proposals envisage a shift from complying with environmentally friendly farming practices to
actually achieving an improvement of agriculture’s environmental and climate performance. Third, the
proposals envisage increasing the flexibility left to Member States to propose appropriate instruments to
achieve common environmental and climatic objectives. In this new delivery model, the European Commission
would lay down the objectives of the policy, the types of interventions that can be funded, the general principles
guiding these interventions, and finally the rules for performance assessment. Member States would then
perform a territorial and sectorial strengths, weaknesses, opportunities and threats analysis, as part of a
11strategic plan. Based on this assessment, Member States would specify, design and develop the specific
interventions needed to address the identified challenges and reach the common environmental and climate-
related objectives.
The CAP legislative proposals suggest a change in the green architecture (see Figure 5). This new green
architecture (illustrated on the right) would maintain the distinction between mandatory and voluntary
measures prevalent in the current architecture (appearing on the left). However, there would be a radical change
in the distribution of requirements and allocation of budget between these tools.
Figure 5. The current and new CAP green architectures
Source: European Commission (2018a).
First, the proposed new green architecture of the CAP would increase the mandatory layer of the policy. This
new, enhanced conditionality would mean, among other things, revising and extending standards for GAEC
in cross-compliance and including the former greening commitments in a strengthened form. As illustrated by
the light blue layer above ‘New, enhanced conditionality’ in Figure 5, Member States would have some degree
of flexibility to further increase the mandatory measures under conditionality.
Second, the CAP legislative proposals also envisage beefing up the budget allocated to voluntary measures. A
minimum requirement of 30 % of Pillar II budget (i.e. pillar for rural development) spending on the environment
and climate would be maintained. The proposals also suggest introducing eco-schemes, a new policy
instrument to stimulate farmers’ adoption of more environmentally friendly practices above and beyond the
mandatory requirements covered by conditionality. Although Member States would have the obligation to offer
eco-schemes, these measures would be voluntary for farmers. Eco-schemes would provide farmers with an
annual payment against the implementation of specific environmentally friendly farming practices. This
payment would be granted either as an addition to the basic income support for sustainability (BISS) or as a
compensation for all or part of the additional costs incurred and income forgone as a result of the commitments
(European Commission, 2018e, Article 28). Eco-schemes would be funded under Pillar I (i.e. pillar for direct
payments and market measures), mainly through a shift from the budget dedicated for BISS. As Pillar I
direct payments constitute the largest proportion of EU agricultural spending, eco-schemes can be an ambitious
way to refocus EU funds on environment- and climate-friendly agriculture.
1.3. Policy questions and objectives
Against this new framework, policymakers will be expected to improve agriculture’s environmental and climate
performance (i.e. the policy objective) by adequately using, adjusting and adapting the following three CAP
policy tools:
12 conditionality (mandatory for farmers),
eco-schemes (voluntary for farmers),
AECMs (voluntary for farmers).
Finding the right balance between these three tools will be critical to the achievement of higher environmental
and climate performance. In particular, policymakers will need to strike the best equilibrium between mandatory
measures (i.e. conditionality) and voluntary measures (i.e. eco-schemes and AECMs).
This study addresses two policy features of this challenge.
The level of requirements of the mandatory environmentally friendly agricultural practices
associated with conditionality.
The European Commission’s proposals envisage increasing the requirements under conditionality (i.e.
enhanced conditionality), which farmers need to comply with to receive CAP income support. Member
States need to decide whether they go beyond these requirements if they deem this appropriate to
achieve the climate and environmental objectives.
The budget associated with BISS and eco-schemes.
The budgets for BISS and eco-schemes will come from the same source (i.e. Pillar I direct payments).
Therefore, a stronger reliance on eco-schemes to achieve higher environmental and climate
performance will imply less budget for BISS.
How will these policy changes affect the environmental and climate performance of the CAP? A key unknown
with regard to this question is how farmers will react to these policy changes. When faced with these policy
changes, how many farmers will decide to sign up to the voluntary instruments (eco-schemes and AECM), and
to what extent? The impact assessment of the CAP legislative proposals (European Commission, 2018b)
included an ex ante evaluation of the different levels of requirements in conditionality (options 1 and 4a) and
the split of Pillar I budget between BISS and eco-schemes (options 3a and 3b). However, this evaluation was
based on assumptions regarding how farmers would react to those tools and did not incorporate an empirical
analysis of farmer behaviour. Moreover, when farmer reaction to voluntary measures was considered in large-
scale agri-economic modelling, the adoption rates were either assumed or based on pure profit maximisation
(Barreiro-Hurle et al., 2020). These assumptions overlooked the potential role that behavioural factors can play
in the adoption of sustainable farming practices (Baumgart-Getz et al., 2012; Dessart et al., 2019; Thoyer &
Préget, 2019).
The objective of this research is to fill this gap by bringing evidence on farmers’ behaviour, in order to inform
the implementation of the new green architecture of the CAP. More specifically, this research aims to address
the following policy questions.
1. What is the (relative) impact of enhancing conditionality on the improvement of agriculture’s
environmental and climate performance?
2. What is the (relative) impact of shifting Pillar I budget from BISS to eco-schemes on the improvement
of agriculture’s environmental and climate performance?
1.4. Structure of this report
The remainder of this report is structured as follows. In Chapter 2, we translate the abovementioned policy
questions into behavioural research questions, taking the perspective of farmers. Chapter 3 includes a
justification for the selection of three Member States in which we collected behavioural evidence, and a
description of the national contexts in these countries. We present a short review of the literature in Chapter 4,
before explaining the methodology and the sample in Chapter 5 and Chapter 6, respectively. Chapter 7 presents
the findings and some initial policy messages. Finally, in Chapter 8, we conclude the report by discussing the
main strengths and limitations of the study and by putting forward an integrated qualitative analysis of the
findings to derive consolidated policy messages.
1314
2. Behavioural research questions

2.1. Introduction
The policy questions identified in the previous chapter take, as it is often the case, a macro perspective. That
is, they concern the impact of high-level policy features (i.e. a budget shift, general enhancement of
conditionality) on general policy objectives (i.e. overall improvement of agriculture’s environmental and climate
performance). A behavioural approach requires, instead, a micro perspective. The EU Better Regulation
Toolbox, in its tool No 19 (‘identification/screening of impacts’) (European Commission, 2017a), shows how one
should understand what the policy options will mean for their targets (in our case, farmers), and what behaviour
will be key to achieving the policy objective. Figure 6 illustrates this process of translating policy options into
independent variables (on the left) and the policy objective into behavioural outcome variables (on the right).
The figure also includes the final step of the process, that is, the practical translation of the behavioural research
questions into an experimental design (see Chapter 5 – Methodology).
          Figure 6. Translating the policy question into behavioural research question and experimental design.

                                                           15
2.2. Independent variables
In Table 1, we translate the policy options into the independent variables of the behavioural research question,
that is, the variables whose impact we are interested in assessing.
Table 1. Policy options in the new green architecture of the CAP and corresponding independent variables
Policy options Independent variables
Enhancing conditionality Obligation to adopt more environmentally
friendly farming practices
Budget shift from BISS to eco-schemes Decrease in money received as BISS
For farmers, enhancing conditionality means that they will have the obligation to adopt more
environmentally friendly farming practices in order to keep receiving direct payments.
The budget shift from BISS to eco-schemes will imply, for farmers, a decrease in the money received as
BISS.
2.3. Behavioural outcome variables
To translate the policy questions into behavioural research questions, one must also convert the policy
objectives into behavioural outcome variables.
One of the most important objectives of the new CAP is to achieve better environmental and climate
performance (European Commission, 2018). In practical terms, this means, for instance, increasing biodiversity,
preserving landscapes and reducing greenhouse gas emissions from farming. Thus, from a policy perspective,
the overall environmental and climate performance is the outcome variable of interest.
Which decisions of farmers will determine the achievement of this policy objective? Improving agriculture’s
environmental and climate performance will come from farmers’ total adoption of environmentally friendly
farming practices, which can be either (1) mandatory under conditionality or (2) voluntary through eco-schemes
and/or AECM. Table 2 shows the correspondence between the policy objectives and the associated behavioural
outcome variables.
Table 2. Policy objectives and corresponding behavioural outcome variables
Policy objectives Behavioural outcome variables
Overall improvement of environmental and Total adoption of environmentally friendly
climate performance practices (voluntary + mandatory)
Improvement of environmental and climate Adoption of environmentally friendly
performance obtained through eco-schemes practices under eco-schemes
Improvement of environmental and climate Adoption of environmentally friendly
performance obtained through AECMs practices under AECMs
2.4. Behavioural research questions
Taking into account the independent and outcome variables identified above, the behavioural research
questions of this study are the following.
1. How, and to what extent, would increasing the obligations to adopt environmentally friendly farming
practices affect farmers’ adoption of environmentally friendly practices
(total = voluntary + mandatory, voluntary under eco-schemes, voluntary under AECM)?
2. How, and to what extent, would decreasing BISS affect farmers’ adoption of environmentally friendly
practices (total = voluntary + mandatory, voluntary under eco-schemes, voluntary under AECM)?
163. Selected national contexts
This chapter will first explain the criteria used to select among the EU Member States three candidates for the
implementation of the experimental study. Then we will offer a brief introduction to the agri-environmental and
policy context in each of these three Member States, focusing on the upcoming reform of the CAP.
3.1. Selection of Member States for this research
As for any behavioural experiment conducted in support of EU policy, researchers must select the Member
States where they will collect data. Budgetary constraints meant that it was virtually impossible to collect data
in all 27 EU Member States and, therefore, to reach full representativeness. However, perfect representativeness
of EU Member States is not always needed (René van Bavel et al., 2015). Instead of full representativeness, our
purpose was to reach a sufficient level of variety in the Member States covered.
For the purpose of this research, we used the following criteria for the selection of Member States:
variety of regions within the EU, as understood from the EuroVoc classification (Publication Office of
the European Union, 2020);
variety of types of farms and agricultural practices (e.g. farm size, relative importance of arable vs
permanent crops);
variety of the level of adoption of environmentally friendly farming practices (e.g. organic farming).
In addition, two constraints guided our choice.
Availability of experts in the selected Member States. Behavioural research with farmers is still in its
infancy (Thoyer & Préget, 2019), and experts with the necessary abilities and experience are scarce
in some EU Member States (1).
Possibility of conducting online research with farmers in the selected Member States. Online
behavioural research with farmers is very novel, implying that sample providers may not have
sufficient access to farmers with an online connection in some Member States.
Considering that budgetary constraints limited the number of Member States covered in this research to three,
and in the light of the abovementioned criteria and constraints we selected Germany, Spain and Poland. Table
3 presents some key statistics on these three Member States.
These three Member States meet the requirements put forward earlier.
They represent three EU regions: western Europe, southern Europe and central/eastern Europe.
They vary in terms of types of farmers and agricultural practices: German farms are relatively large
on average, whereas Polish farms are smaller than the EU average. Spanish average farm size falls
in between. German and Polish farms dedicate, on average, more than 70 % of their agricultural land
to arable crops and less than 3 % to permanent crops. Spain, in contrast, has 20 % of its agricultural
land dedicated to permanent crops.
They vary in terms of the level of adoption of environmentally friendly farming practices.
(1) As evidence, see the list of experts in the Research Network on Economic Experiments for the Common Agricultural Policy
(https://sites.google.com/view/reecap/researchers).
17Table 3. Relevant statistics for the selected Member States and EU-27 aggregate or average
Criterion Statistics Germany Spain Poland EU-27
EU region (EuroVoc classification) Western Southern Central/eastern —
Importance of Total number of farm 276 120 945 020 1 410 700 10 282 700
the farming holdings (2016) (a)
sector Total utilised agricultural 16 715 320 23 229 750 14 405 650 156 665 280
area (2016) (ha) (a)
Farm Average utilised agricultural 60.50 24.60 10.20 15.20
characteristics area per holding (2016)
(ha) (a)
% of utilised agricultural land 70.5 50.1 75.7 61.2
for arable crops (b) (2018)
% of utilised agricultural land 28.3 29.1 21.7 31.0
for permanent grassland
and meadows (b) (2018)
% of utilised agricultural land 1.2 20.3 2.4 7.5
for permanent crops (b)
(2018)
CAP support Average CAP income support 291 258 250 314
per ha (2018) (EUR) (c)
Direct payments and support to areas facing
natural constraints
Average % of direct 38 18 29 24
payments in income
(2018) (c)
Adoption of % of utilised agricultural land 7.3 9.3 3.3 8.0
environmentally converted or under conversion
friendly practices to organic farming (2018) (d)
Utilised agricultural area 3 257 061 3 230 484 1 030 506 21 653 232
subject to AECM contracts (≈ 20 %) (≈ 14 %) (≈ 7 %) (≈ 14 %)
(2018) (ha) (e)
% of utilised agricultural land 6 15 12 12
under contracts to improve
soil (2018) (f)
Soil management and/or prevent soil erosion,
focus area 4C, rural development programmes
% of utilised agricultural land 14 19 9 15
under contracts to support
biodiversity (2018) (g)
Biodiversity and/or landscapes, focus area 4A,
rural development programmes
Share of utilised agricultural 6 15 9 12
land under contracts to
improve water management
(2018) (h)
Water management, focus area 4B, rural
development programmes
Sources: ( ) Common context indicators for rural development programmes – C17; (b) Common context indicators for rural development
a
programs – C18; (c) Agri-food data portal – CAP indicators – Farming Income Support; (d) Agri-food data portal – CAP indicators – Organic
Production; (e) Agri-food data portal – CAP indicators – Environment and Climate Action; (f) Agri-food data portal – CAP indicators – Soil
Quality; (g) Agri-food data portal – CAP indicators – Biodiversity; (h) Agri-food data portal – CAP indicators – Water Quality & Availability.
3.2. Agri-environmental and policy context in Germany
With approximately 16.5 million hectares of utilised agricultural land and more than 270 000 farm businesses
in 2016 (source: see Table 3), the German agricultural sector is still of major economic importance. As a result
of a massive structural change in the farming sector in the past few decades, the average farm size increased
to 60.5 ha in 2016, four times the EU-27 average. In 2018, arable crops represented the main type of land use
(70.5 %), followed by 28.3 % for permanent grassland and meadows (source: see Table 3).
Compared with other Member States, the German implementation of the CAP is slightly more complex, since
Germany is organised in a federal system. In general, conditionality is guaranteed by cross-compliance and
greening, which are both binding in all federal states. In addition, SMRs are part of the national environmental
18legislation, implying that farmers have to adhere to these rules even if they do not receive EU subsidies
(Bundesministerium für Ernährung und Landwirtschaft, 2019a). A major issue in terms of SMRs is nitrate
pollution, which persists as a major problem in some parts of Germany, even though EU sanctions are applied
and national laws have been adapted several times (Umweltbundesamt, 2019).
The implementation of direct payments was long heterogeneous across federal states and has only recently
been unified. Pillar I’s basic premium is now about EUR 175 per hectare in all federal states. The greening
premium is around EUR 85 (Bundesministerium für Ernährung und Landwirtschaft, 2015). Since young farmers
and the first hectares are more than proportionally subsidised, the average direct payment received per farm
can vary. In 2018, the average total income support of EUR 291 per hectare was slightly lower than the EU-27
average (source: see Table 3). In contrast, direct payments accounted on average for 38 % of farmers’ income,
a relatively high figure compared with the EU average (24 %).
Pillar II, which includes AECM, is solely administered at the federal level. In 2020, Germany shifted 6 % of its
Pillar I funds to Pillar II (Bundesministerium für Ernährung und Landwirtschaft, 2019b). With the available
budget, a total of 13 rural development programmes were offered, including different portfolios of AECMs. The
measures offered (e.g. farm management, cultivation practices, landscape management, water management)
are mainly action-oriented (with a few result-oriented measures for extensive grasslands) and are all offered
at the farm level (i.e. there are no group contracts). In 2018, around 3.2 million ha were contracted with AECMs,
which represents roughly 20 % of all utilised agricultural area. In terms of further indicators for the adoption
of environmentally friendly practices, 6 % of utilised agricultural land is subject to contracts aiming at soil
quality/erosion protection and 7.3 % of utilised agricultural land is currently being converted or has been
converted to organic farming (source: see Table 3).
With respect to the upcoming CAP reform, and especially the new enhanced conditionality and eco-schemes, a
public debate has emerged. A position paper from the Scientific Advisory Board on Agricultural Policy, Food and
Consumer Protection (WBAE, 2019), which advises the German Federal Ministry of Food and Agriculture, argued
in favour of a less demanding enhanced conditionality, and well-financed, ambitious eco-schemes and AECMs.
Specifically, the advisory board supports a complete phase-out of direct payments over a period of 10 years.
According to this position paper, in the first stage, 30 % of the sum of Pillar I and Pillar II funds should be
devoted to environmental and climate goals (including eco-schemes). After 10 years, 100 % of Pillar I funds
should go to eco-schemes or animal welfare measures, or via modulation to Pillar II AECMs. If eco-schemes are
oversubscribed, the shortfall should be taken from the direct payments budget. This means that the final
amount of direct payments can only be determined after the eco-scheme subscription process is completed.
The advisory board backs this position with the argument that a much more targeted approach to environmental
and climate protection is needed in order to tackle pressing environmental and climate issues. Instead of relying
on conditional direct payments, the advisory board is in favour of a mixture of eco-schemes, AECMs and national
environmental law. To this end, it is suggested that Germany should stay at minimum conditionality for direct
payments and instead take up suitable GAEC into national law.
Several environmental non-governmental organisations (NGOs) released a joint statement (Verbände-
Plattform, 2019) advocating strongly enhanced conditionality in Germany’s strategic plan and a budget for eco-
schemes of at least 30 % of Pillar I funds, which would progressively increase. This joint statement argued that
eco-schemes should incentivise ambitious ecological efforts by having a positive impact on farmers’ income.
The statement proposed a list of “medium green” to “dark green” measures (depending on their level of
requirements) as candidates to be included in eco-schemes.
The German Farmers’ Union also released a position paper (Deutscher Bauernverband, 2020). In this document,
the union recommends preserving the conditional direct payments to safeguard farm incomes, and does not
endorse enhancing conditionality or reducing the overall CAP budget. Moreover, the union does not support
moving current greening obligations into enhanced conditionality. Eco-schemes are generally seen as a
favourable instrument by the union. However, eco-schemes should, according to the union, be designed in a
way that minimises the administrative burden on farmers and does not undermine tried and tested AECMs.
Regarding the budget for eco-schemes, the German Farmers’ Union argues in favour of an EU-wide uniform
share of Pillar I funds, without further specifying the size of the share. For farmers, eco-schemes should take
the form of a flat rate per hectare of farm land, with measures taken, for example, from current ecological
focus areas.
Finally, regarding the position of the German Federal Ministry of Food and Agriculture, the minister argued,
during the debates in the European Council, in favour of a 20 % share of Pillar I funds to be used as a minimum
budget for the eco-schemes (Bundesministerium für Ernährung und Landwirtschaft, 2021). It remains to be
19You can also read