Development of a tip-enhanced Raman spectrometer to investigate solid-liquid interfaces
←
→
Page content transcription
If your browser does not render page correctly, please read the page content below
Development of a tip-enhanced
Raman spectrometer to investigate
     solid-liquid interfaces

                       Dissertation
                zur Erlangung des Grades
             Doctor der Naturwissenschaften
               im Promotionsfach Chemie

 am Fachbereich Chemie, Pharmazie und Geowissenschaftern
        der Johannes Gutenberg-Universität Mainz

                  Leonie Driessen

                     geb. in Deurne

                      Mainz, 2018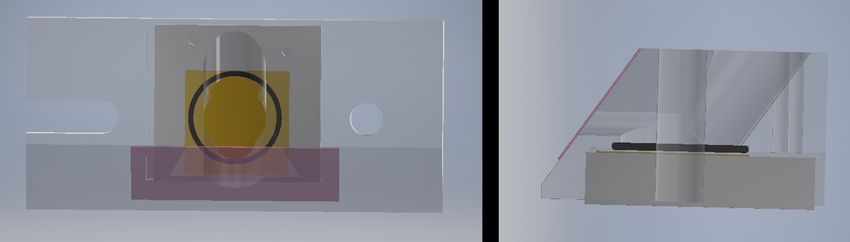
1. Gutachter:
2. Gutachter:

Tag der Prüfung: 18.12.2018
I hereby declare that I wrote the dissertation submitted without any unauthorized external
assistance and used only sources acknowledged in the work. All textual passages which are
appropriated verbatim or paraphrased from published and unpublished texts as well as all
information obtained from oral sources are duly indicated and listed in accordance with
bibliographical rules. In carrying out this research, I complied with the rules of standard
scientific practice as formulated in the statutes of Johannes Gutenberg-University Mainz
to insure standard scientific practice.

                                            iii
Abstract
Plenty of bio-medical and industrially relevant processes take place at solid-liquid inter-
faces. The mechanisms underlying these macroscale solid-liquid interfacial processes are
at the molecular scale, i.e. molecules (and/or ions) in the liquid phase interact with atoms
or molecules at the solid surface. This dissertation discusses the development of a tip-
enhanced Raman spectroscopy (TERS) setup to probe molecules and their interactions
with the environment at solid-liquid interfaces. TERS is a surface-sensitive technique
that is not only sensitive to small numbers of molecules with a nanometric lateral spatial
resolution, but also provides chemical specificity enabling identification of molecules and
probing of their interactions with their environment. Furthermore, TERS enables in situ
investigation of molecules at room temperature, in ambient atmosphere and under atmo-
spheric pressure.
The home-designed solid-liquid TER spectrometer enables the investigation of molecules
at the surface of opaque substrates under a 6.6 mm thick layer of water. The TER
spectrometer can obtain TERS maps, of which the lateral spatial resolution is 12.6 nm
(measured in air).
Solid-liquid TERS has been applied to investigate the interaction between benzene-1,3,5-
tricarboxylic acid (BTC) and a monolayer of Cu/Au in air and under water. Spectral
changes in TER spectra were observed upon immersing the BTC/Cu/Au substrate in wa-
ter. The observed spectral changes suggest a change in binding geometry of BTC on the
Cu/Au substrate upon water immersion.
The results discussed in this thesis show that the developed solid-liquid TER spectrom-
eter can be used to investigate ensembles of molecules at Au-water interfaces. Further
technical improvements will enable the general use of solid-liquid TERS for nanometric
investigation of molecules at solid-liquid interfaces.

                                             iv
Zusammenfassung
An fest-flüssig Grenzflächen finden viele biomedizinisch und industriell relevante Prozesse
statt. Die Mechanismen, die diesen makroskopischen Prozessen zugrundeliegen, finden auf
mikroskopischer Ebene statt. Das heißt, dass Moleküle (und/oder Ionen) in der flüssigen
Phase mit Atomen oder Molekülen an der festen Oberfläche interagiern. In dieser Dis-
sertation wird die Entwicklung eines spitzenverstärkten Raman-Spektroskops (TERS) für
die Untersuchung von Molekülen und deren Interaktion mit der Umwelt an fest-flüssig
Grenzflächen diskutiert. TERS ist eine oberflächensensitive Methode, die in der lage ist
eine sehr geringe Menge an Molekülen, mit einer lateralen Auflösung im nanometer Bere-
ich, zu detektieren. Des Weiteren ist es mit dieser Methode, aufgrund der chemischen
Spezifität, möglich Moleküle zu identifizieren und ihre Interaktionen mit der Umgebung
zu untersuchen. TERS ermöglicht die Untersuchung von Molekülen bei Raumtemperaur,
in Umgebungsatmosphäre und bei Luftdruck.
Das maßangefertigte fest-flüssig TER Spektrometer erlaubt die Untersuchung von Molekülen
an der Oberfläche von undurchsichtigen Substraten unter einem Wasserfilm mit einer
Schichtdicke von 6.6 mm. Des Weiteren können TERS Karten mit einer lateralen Auflösung
von 12.6 nm erstellt werden (an Luft gemessen).
Fest-flüssig TERS wurde angewandt um die Interaktion zwischen 1,3,5-Tricarboxybenzen
(BTC) und einer Monolage von Kupfer/Gold an Luft und in Wasser zu untersuchen. Durch
die Zugabe von Wasser zu dem BTC/Cu/Au Substrat wurden spektrale Änderungen der
TERS Spekren beobachtet. Diese Änderungen deuten darauf hin, dass sich die Bindungs-
geometrie des BTC Moleküls auf dem Cu/Au Substrat durch das Eintauchen in Wasser
ändert.
Die Ergebnisse, die in dieser Arbeit diskutiert werden zeigen, dass das entwickelte fest-
flüssig TERS Spektrometer zur Untersuchung von Molekülen an der Au-Wasser Gren-
zfläche verwendet werden kann. Weitere technische Verbesserungen werden eine weit-
greifendere Verwendung des fest-flüssig TERS für Untersuchungen von Molekülen an der
Grenzfläche von fest-flüssig Grenzflächen im Nanometerbereich ermöglichen.

                                             v
Contents
1. Introduction 1
1.1. Motivation of this work . . . . . . . . . . . . . . . . . . . . . . . . . . . . . 1
1.2. Thesis outline . . . . . . . . . . . . . . . . . . . . . . . . . . . . . . . . . . . 4
2. Theory 5
2.1. Raman spectroscopy . . . . . . . . . . . . . . . . . . . . . . . . . . . . . . . 5
2.1.1. Raman scattering . . . . . . . . . . . . . . . . . . . . . . . . . . . . . 5
2.1.2. Raman cross-sections . . . . . . . . . . . . . . . . . . . . . . . . . . . 6
2.1.3. Interpretation of Raman spectra . . . . . . . . . . . . . . . . . . . . 8
2.2. Surface-enhanced Raman spectroscopy . . . . . . . . . . . . . . . . . . . . . 10
2.2.1. Introduction . . . . . . . . . . . . . . . . . . . . . . . . . . . . . . . 10
2.2.2. Enhancement of Raman scattering in SERS . . . . . . . . . . . . . . 10
2.3. Tip-enhanced Raman spectroscopy at the solid-gas interface . . . . . . . . . 13
2.3.1. Development of TERS . . . . . . . . . . . . . . . . . . . . . . . . . . 13
2.3.2. Enhancement of Raman scattering in TERS . . . . . . . . . . . . . . 14
2.3.3. TERS spectral interpretation . . . . . . . . . . . . . . . . . . . . . . 15
2.3.4. Scanning probe microscopy and TERS tips . . . . . . . . . . . . . . 16
2.4. TERS at the solid-liquid interface and electrochemical TERS . . . . . . . . 16
2.4.1. Development of solid-liquid (electrochemical) TERS . . . . . . . . . 16
2.4.2. Illumination geometry for solid-liquid TERS . . . . . . . . . . . . . . 16
2.4.3. SPM base and tips for solid liquid TERS . . . . . . . . . . . . . . . 18
3. Home-designed solid-liquid TERS setup: instrumentation and data acquisition 19
3.1. Beam path . . . . . . . . . . . . . . . . . . . . . . . . . . . . . . . . . . . . 19
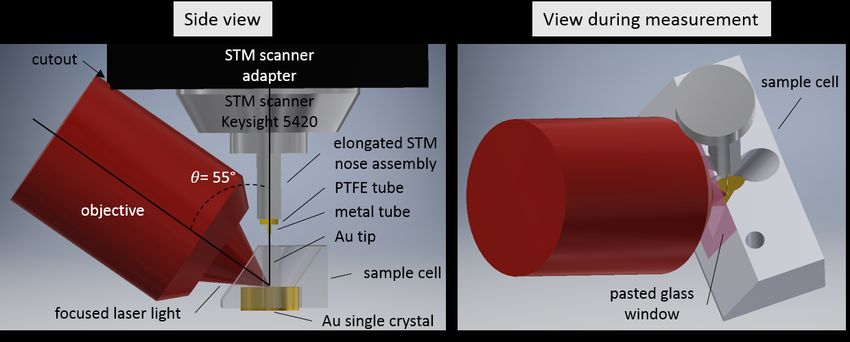
3.2. Illumination geometry of solid-liquid TERS setup . . . . . . . . . . . . . . . 22
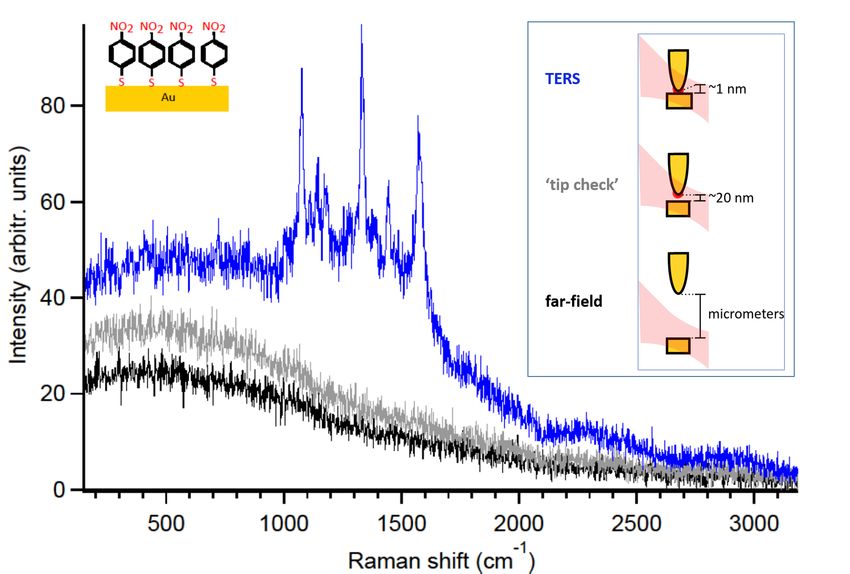
3.3. Sample cell design for solid-liquid TERS . . . . . . . . . . . . . . . . . . . . 23
3.4. Tip preparation for solid-liquid TERS . . . . . . . . . . . . . . . . . . . . . 27
3.5. Cleaning procedure for (solid-liquid) TERS . . . . . . . . . . . . . . . . . . 28
3.6. Processing of (enhanced) Raman and scanning tunneling microscopy data . 29
3.7. Checks for far-field Raman signal and tip-cleanliness in TERS . . . . . . . . 30
4. TERS mapping 32
4.1. Size of laser focus . . . . . . . . . . . . . . . . . . . . . . . . . . . . . . . . . 32
4.2. Measuring the spatial resolution of TERS . . . . . . . . . . . . . . . . . . . 33
4.3. TERS mapping of a binary SAM . . . . . . . . . . . . . . . . . . . . . . . . 34
5. Nucleation of CuBTC MOF on a metal substrate 39
5.1. Introduction . . . . . . . . . . . . . . . . . . . . . . . . . . . . . . . . . . . . 39
5.2. Experimental details . . . . . . . . . . . . . . . . . . . . . . . . . . . . . . . 41
5.3. Interaction of BTC with its environment . . . . . . . . . . . . . . . . . . . . 41
vi
Contents

   5.4. Binding geometry of BTC on CuUPD/Au . . . . . . . . . . . . . . . . . . . 47

6. Outlook                                                                                  56

Appendices                                                                                  58

A. SERS spectra of BTC/CuUPD/Au                                                             59

B. Background subtraction and scaling of SER and TER spectra of chapter 5                   61

C. Peak fitting and peak assignment of spectra of chapter 5                                 65

D. Gas phase density functional theory calculations                                          68
   D.1. Introduction . . . . . . . . . . . . . . . . . . . . . . . . . . . . . . . . . . . . 68
   D.2. Scaling factors for gas phase DFT calculations . . . . . . . . . . . . . . . . 68

                                              vii
1. Introduction
1.1. Motivation of this work
Solid-liquid interfaces play an important role for plenty bio-medical and industrially rele-
vant processes, e.g. adsorption of (bio)molecules to sensors [1, 2], biofouling on biomedical
implants [3], photocatalysis [4], electrocatalysis [5] or electrochemical synthesis of mate-
rials [6]. The mechanisms underlying these macroscale solid-liquid interfacial processes
are at the molecular scale, i.e. molecules (and/or ions) in the liquid phase interact with
atoms or molecules at the solid surface. Many solid-liquid interfacial processes depend
on nanoscale structure-activity relationships, e.g. atomic-scale metal structures form
active sites for electrocatalysis [5]. Rational design of functional solid-liquid interfaces
requires understanding of interfacial molecular processes and nanoscale structure-activity
relationships. Ideally, a tool should exist that can be used to probe solid-liquid interfaces
at the molecular scale. This tool should fulfill the following specifications:

- High sensitivity to detect very low concentrations of molecules at solid-liquid
interfaces.

- Chemical specificity to identify molecules and probe their interactions with
the environment, such as binding to a solid substrate or hydrogen-binding to surrounding
water molecules.

- Surface-sensitivity to only probe molecules close to or interacting with the
solid surface and distinguish them from the bulk contributions of the solid and liquid
phases.

- Nanometric lateral spatial resolution to distinguish laterally displaced (en-
sembles of) molecules and to image nanoscale structures at the solid surface.

- Probe molecules at solid-liquid interfaces in situ, which means under real working
conditions concerning temperature, pressure and surface potential, to study character-
istics of molecules in everyday conditions.

Many tools have been developed to investigate molecular processes at solid-liquid
interfaces. A technique that is highly sensitive to adsorption of molecules to a solid-liquid
interface is surface plasmon resonance (SPR) spectroscopy [7]. SPRs in a thin metallic
substrate are changed upon variations in the refractive index of the medium just outside
the metal film, e.g. by adsorption of molecules to the metal film [8]. Changes in SPR
can be read out by the changes in reflectivity of an incident light beam. However, this
technique lacks chemical specificity, because the change of the optical properties of the

                                             1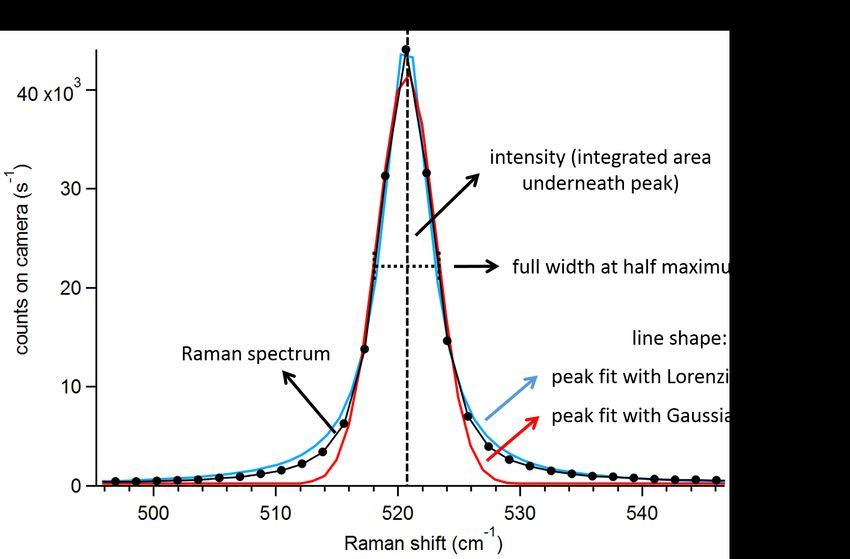
1. Introduction

thin metal substrate is insensitive to what chemical species adsorb to its surface. A
way to include chemical specificity is coating the metal substrate with specific binding
sites for target molecules [7]. With this approach the technique can be used for sensing
and for the investigation of biomolecular interactions. SPR spectroscopy has micrometer
lateral spatial resolution, and thereby lacks the nanometric lateral spatial resolution we
are aiming for.

Another widely used technique to investigate solid-liquid interfaces is cyclic voltammetry
(CV) [9]. CV probes surface reactions involving electron transfer. These reactions involve
atoms of the solid surface itself, chemical species from the liquid phase and/or chemical
species adsorbed to the surface. In CV the entire electrified surface is probed. Spatial
resolution can be improved by using a scanning electrochemical microscope (SECM)
[10]. In SECM an ultramicroelectrode is approached to a surface to locally perform CV
measurements. The surface area probed by the ultramicroelectrode is in the sub-µm scale,
substantially larger than the targeted nanometric resolution in our study. Furthermore, in
general, the probed electrochemical behavior of chemical species (e.g. adsorption state to
a charged surface or reaction rate of electrochemical reactions) can not be used to identify
unknown chemical species. Therefore CV does not provide the chemical specificity we are
looking for. It is therefore common practice to combine CV with other methods which
have chemical specificity, such as vibrational spectroscopy.

A technique that has both molecular sensitivity and nanometric spatial resolution
is fluorescence microscopy. The recent development of several super-resolving fluorescence
microscopy techniques, such as stimulated emission depletion microscopy (STED) [11],
photo-activated localization microscopy (PALM) [12] and stochastic optical reconstruction
microscopy (STORM) [13], was a breakthrough in microscopy for which the 2014 Nobel
Prize in Chemistry was awarded. Super-resolving fluorescence microscopy enables far-field
microscopy of single fluorescent molecules (fluorophores), with spatial resolutions far
below the Abbe diffraction limit. To broaden the applicability of fluorescence microscopy
to other species than fluorophores, it is common practice to label (bio)molecules with a
fluorescent tags. Adding a fluorescent tag to a molecule brings along the risk of altering
the molecule’s properties. Furthermore, unlabeled or unknown species in a system go
unnoticed in fluorescence microscopy. Therefore fluorescence microscopy does not fulfill
the chemical specificity requirement of the tool we are looking for.

Surface science techniques have gained thorough understanding in many nanoscale
processes on solid surfaces. However, the majority of surface science techniques are
applied under ultrahigh vacuum (UHV) where the influence of the liquid phase on surface
processes is excluded. Therefore, surface studies under UHV conditions do not render
the same result as processes taking place at solid-liquid interfaces [14]. Several surface
science techniques can be applied at (electrified) solid-liquid interfaces [15, 16, 17, 18].
Scanning tunneling microscopy (STM) and atomic force microscopy (AFM) are scanning
probe microscopy (SPM) techniques, in which a tip (STM) or cantilever (AFM) with
a nanoscale apex probes local density of states underneath the apex of the tip or force
between cantilever and sample, respectively [19, 20]. At solid-liquid interfaces the lateral
spatial resolution of both techniques can go down to atomic level [21, 22]. However,

                                             2
1. Introduction

in general the extracted local electronic structure or local mechanical properties of a
substrate can not be used to identify molecules or the interaction of molecule with their
environment.
In transmission electron microscopy (TEM), investigations of solid-liquid interfaces
have been enabled by using a hermetically sealed sample cell to prevent evaporation of
the liquid inside the high vacuum chamber [23, 17]. TEM uses electrons to probe the
structure of nanoscale objects. This technique is usually combined with energy dispersive
X-ray spectroscopy (EDS) [24] or electron energy loss spectroscopy (EELS) [25] to probe
elemental distribution of the sample. Because of the transmission geometry in TEM, the
liquid phase and sample cell need to be electron-transparent. Electron-transparancy is
achieved by making the sample very thin: the liquid layer is several µm thick and the
sample cell is formed of thin membranes (e.g. of graphene or SiNx ) [17]. A problem in
solid-liquid TEM is that the interaction of the electron beam with the solvent can lead
to the generation of radiolytic species. Radiolytic species might be highly reactive, such
as free radicals, perturbing the sample and sample cell. Furthermore, organic species
generally have a bad contrast in TEM, which hinders imaging of organic molecules.
Several X-ray spectroscopies have been adapted to study solid-liquid interfaces [18]. X-ray
spectroscopies, such as X-ray absorption spectroscopies (XAS) and X-ray photoemission
spectroscopy (XPS), use X-ray photons to excite core-level electrons into valence orbitals
or continuum states. The information obtained can be analyzed to obtain information
about the chemical environment of the elements under study. Solid-liquid X-ray studies
are scarce, because they are mostly based on synchrotron radiation. Furthermore, X-rays
and high kinetic energy electrons used in X-ray techniques might damage the surface
and molecules under study [18]. X-ray core-level spectroscopies have a sub-nm depth
resolution, but their lateral resolution is in the µm-range.

Vibrational spectroscopic techniques can be used to identify molecules and charac-
terize their interaction with the environment by their unique vibrational ’fingerprint’,
and therefore have chemical specificity. Furthermore, several vibrational spectroscopies,
such as infrared reflection absorption spectroscopy (IRRAS) [26], surface-enhanced
infrared absorption (SEIRAS) [27], vibrational sum frequency spectroscopy (SFG) [28],
surface-enhanced Raman spectroscopy (SERS) [29] and tip-enhanced Raman spectroscopy
(TERS) [30], are solid-liquid surface-sensitive. However, in the cases when IR light is
used, the investigation of solid-liquid interfaces becomes difficult. Many chemical species,
such as water and many solids, strongly absorb IR light. Therefore large portions of IR
light are absorbed by penetrating through millimeters of solids or through millimeters
of liquid, severely complicating IR spectroscopy at solid-liquid interfaces. IR absorption
spectroscopy at solid-water interfaces is only possible with specific technical designs
to diminish IR absorption by the environment, such as using a thin layer of water
(micrometers thick), an even thinner layer of IR-absorbing solid (nanometers thick) or
choosing a solid that is transparent for IR light. In Raman spectroscopy the wavelength
of the incoming laser light does not need to match with the energy levels of the probed
molecules. Therefore, the wavelength of the laser light can be chosen such that the
interaction with the environment is minimal, making Raman spectroscopy at solid-water
interfaces feasible. Raman spectroscopy can be performed at solid-liquid interfaces
after passing a millimeters thick water layer. Surface-enhanced Raman spectroscopy

                                             3
1. Introduction
probes vibrational energies of molecules typically within ∼10 nm of a rough(ened)
metal substrate. However, this technique lacks nanometric lateral spatial resolution. In
tip-enhanced Raman spectroscopy, vibrational energies of chemical species present in the
nanometric area underneath the apex of a metallic SPM tip or cantilever are probed.
TERS generally has a lateral spatial resolution lower than 10 nm.
In the need for a new technique for label-free in situ nanoscale investigation of molecular
processes at solid-liquid interfaces we have developed a solid-liquid tip-enhanced Raman
spectrometer. Solid-liquid tip-enhanced Raman spectroscopy (S/L-TERS) is capable of
retrieving the chemical ’fingerprint’ of molecules at solid-liquid interfaces with nanometric
lateral spatial resolution. In TERS, light is focused at the apex of a tip. This leads to an
enhanced EM near-field underneath the apex of the tip. The Raman scattering signal of
molecules in the near-field is enhanced by several orders of magnitude
1.2. Thesis outline
The first part of this dissertation is committed to the description of the technical de-
velopment of the solid-liquid TER spectrometer: chapter 2 contains the theoretical
background of solid-liquid TERS and the considerations behind choices of experimen-
tal conditions used in the solid-liquid TERS setup. Chapter 3 contains the technical
details of the solid-liquid TERS setup and measurement procedure. In the second part
of this dissertation, the solid-liquid TER spectrometer is applied to investigate molecules
at interfaces. In chapter 4 TERS results are presented to highlight characteristics of
the TERS setup concerning spatial resolution and TERS mapping in air. In chapter 5
the solid-liquid TER spectrometer is applied to investigate the nucleation and growth of
an archetypical metal-organic framework (’CuBTC’, consisting of Cu centers linked by
benzene-1,3,5-carboxyl) on a metal substrate. In chapter 6 an outlook on solid-liquid
TERS is provided and technical improvements for solid-liquid TERS are proposed.
42. Theory
This chapter is dedicated to the theoretical background of solid-liquid tip-enhanced Raman
spectroscopy (S/L TERS). To shorten this chapter to the essence, only those topics that
have a practical implication for S/L TERS are discussed. The principles of TERS can
to a large extent be explained by the principles of surface-enhanced Raman spectroscopy
(SERS). For the interested reader, a thorough and mathematical approach to the Raman
effect can be found in the general textbook written by D.A. Long [31], and principles of
surface-enhanced Raman spectroscopy have been tackled in detail by E.C. le Ru and P.G.
Etchegoin [32].
2.1. Raman spectroscopy
2.1.1. Raman scattering
Raman spectroscopy is a vibrational spectroscopy based on Raman scattering. The
discovery of Raman scattering was made by C.V. Raman, for which he gained the 1930
Nobel Prize in Physics. Today Raman spectroscopy is an ubiquitous tool in analytical
chemistry to characterize materials as diverse as food, art, biomolecules or minerals [31].
When light interacts with a molecule, approximately one in 106 incident photons
are Raman scattered [33]. In Raman scattering an incident photon interacting with
a molecule is inelastically scattered with either more or less energy than the incident
photon, depending on the vibrational energy state of the molecule. If an incident photon
interacts with a molecule in its vibrational ground state v = 0, there is a chance that the
molecule is excited to a vibrational energy state v = 1,2... In this process, called Stokes
Raman scattering, the energy difference between the incident and scattered photon is
the vibrational energy of the molecule Evib = EL − ES . When a photon interacts with
a molecule in an excited vibrational state, there is a chance that the molecule falls back
in its vibrational ground state. In this process, called anti-Stokes Raman scattering, the
energy of the scattered photon is increased compared to the energy of the incident photon
and Evib = ES − EL . In figure 2.1 simplified Jablonski diagrams are shown for Stokes
Raman scattering, anti-Stokes Raman scattering and elastic Rayleigh scattering. Rayleigh
and Raman scattering processes can be visualized in a Jablonski diagram by adding a
virtual energy state. Note that scattering is an instantaneous process. Therefore, the
virtual energy state in the Jablonski diagram is not a real physical state of the molecule,
but rather a quantum mechanical picture of the working principle of Rayleigh and Raman
scattering.
52. Theory
Figure 2.1.: Simplified Jablonski diagrams of elastic scattering (left) and inelastic scatter-
ing (center and right). In inelastic scattering, interaction of incident light with
a molecule leads to excitation of a molecule from its vibrational ground state
v = 0 to its vibrational energy state v = 1,2... (Raman scattering), or from
its vibrational energy state v = 1,2... to its vibrational ground state v = 0
(anti-Stokes scattering).
2.1.2. Raman cross-sections
How strong an object, e.g. a molecule, interacts with light can be quantitative described
by the cross section of an optical process. The cross-section σ [m2 ] relates the incident
power density SInc [W m−2 ] at the molecule position to the power (or intensity) of the
optical process P [W] [32]:
P = σSInc (2.1)
For a scattering process, the cross section has an angular dependency. The angular de-
pendency of Raman scattering has to be taken into account in the definition of the Raman
cross-section, because in common Raman spectrometers an objective is used for the de-
tection of scattered radiation. This objective is placed along a certain angle in respect
to the sample, thereby only detecting part of the total scattered radiation. The variable
Ω ≡ (θ, φ) [sr] contains the two angles necessary to define the direction of scattered radi-
ation in respect to the incident beam direction. The angular dependent scattered power,
called the differential scattered power dPSca /dΩ [W sr−1 ], is defined by:
dPSca σSca
(Ω) = (Ω)SInc (2.2)
dΩ dΩ
The Raman cross-section of a molecule interacting with incident light depends on the
polarizability of the molecule. Polarizability of a molecule can be defined using the classical
electromagnetic (EM) theoretical description of the Raman effect. The oscillating electric
field of EM radiation interacts with electrons in a molecule, thereby inducing an oscillating
62. Theory
dipole moment in the molecule [33]. Polarizability is the proportionality factor relating
the magnitude of the induced dipole moment µ~ [C m] to the strength of the incident EM
~ [V m−1 ] [33]:
field E
µ
~ = αE ~ (2.3)
where α [0 m3 ] is the second-rank Raman polarizability tensor for a specific vibrational
mode of the molecule. Polarizability is a measure of the ease of deformation of the electron
cloud around an atom or in a molecule.
We will now study the influence of a molecular vibration to α. For this, we will focus
one specific normal mode k, which is a vibrational pattern where all atoms in a molecules
oscillate at the same frequency ωk . Qk (t) [kg1/2 m] is a single scalar describing atomic
displacements from the equilibrium position Q0 in normal coordinates of all atoms of
a molecule for normal mode k. Vibrations of a molecule induce small perturbations of
the molecular structure, and thereby also of the polarizability of the molecule. Small
perturbations of the polarizability can be approximated by a Taylor expansion:
∂α
αk = α0 + Qk + ... (2.4)
∂Qk Qk =0
where α0 is the polarizability at equilibrium and the following term is the first-order
perturbation of the polarizability by atomic movements. Second- and further order
perturbations are neglected in equation 2.4 (electrical harmonic approximation [32]).
We add time dependence of Qk , assuming simple harmonic oscillation:
Qk = Q0k cos(ωk t) (2.5)
We add frequency dependence of E:
~ =E
E ~ 0 cos(ωL t) (2.6)
Placing equations 2.4, 2.6 and 2.5 into equation 2.3 and defining αk0 = ∂α
∂Qk gives:
Qk =0
~ = (α0 + αk0 Q0k cos(ωk t)) E
µ ~ 0 cos(ωL t) (2.7)
Using trigonometric identity, equation 2.7 becomes:
µ
~ = α0 E~ 0 cos(ωL t) + 1 α0 Q0 E ~ 0 cos((ωk + ω0 )t) + 1 α0 Q0 E ~ 0 cos((ωk − ω0 )t) (2.8)
k k
2 2 k k
Equation 2.8 shows the three processes leading to the induced dipole µ ~ : the first term
leads to Rayleigh scattering with frequency (ωL t), the second term leads to Stokes
scattering with frequency ωk + ω0 )t and the last term leads to anti-Stokes scattering with
frequency ωk − ω0 )t. Furthermore, from equation 2.8, it becomes clear that a change
in the polarizability (αk0 6= 0) of a molecule by a vibration is a requirement for Stokes
and anti-Stokes Raman scattering, i.e. a Raman selection rule. In certain cases, for
individual vibrations αk0 6= 0, but due to symmetry of the molecule, the overall change
in polarizability is canceled out. The molecules probed by TERS which are presented in
this thesis are larger molecules, in which usually for all of their vibrational modes αk0 6= 0
and therefore all vibrational modes are Raman-active. Another molecule discussed in this
thesis, water, is small, but not linear and therefore all its vibrations are Raman-active.
72. Theory
As a consequence of the tensorial nature of the polarizability, the light-induced change
in polarizability can be different along the various axes of the molecular structure. This
means that the Raman cross section depends on both the intrinsic polarizability tensor
and the orientation of the molecule or chemical bond with respect to the direction of the
incident electric field. In conventional Raman spectroscopy, this effect is in particular
important for the interpretation of Raman spectra of materials which present a high
degree of order due to the fixed orientations of molecules or atoms [32]. For example,
changing the angle of incidence of linear polarized light in Raman spectroscopy of graphene
changes the scattered Raman signal and ratio of the raman bands of its phonon modes [34].
Another effect on the Raman cross-section is the resonance condition of a molecule. If a
molecule is resonant with the frequency of the incident light, the probability for Raman
scattering increases. The resonance condition of a molecule is met when the virtual
energy state corresponds to a physical energy state of the molecule. The resonance
condition of a molecule leads to a at least four orders of magnitude larger differential
Raman cross-section [32]. This thesis does not contain resonant Raman spectroscopy
results.
Stokes Raman scattering of a molecule has a larger cross-section than anti-Stokes
Raman scattering, because the probability to find a molecule at its electronic ground
state S0 , v = 0 is higher than at a vibrational energy level S0 , v > 0. In this thesis we
will only discuss Stokes Raman scattering.
Furthermore, the detected intensity of a Raman scattering signal depends on the
number of scatterers (molecules) in the laser focus and on the characteristics of the
Raman spectrometer, such as efficiency of the detector, optical alignment and background
light.
2.1.3. Interpretation of Raman spectra
In Raman spectroscopy scattered photons are detected as counts on a camera. A grating
is used to lead the photons with different energies to different positions on a line on the
chip of the camera. In this way a Raman spectrum can be read out, with photon energy
on the X-axis and counts on the Y-axis. In both Stokes and anti-Stokes Raman scattering,
the difference in energy between the scattered photon and the incident photon is called
Raman shift. Monochromatic light is used for excitation, to be able to calculate Raman
shifts from the detected scattered photon energies. Usually narrow-bandwidth lasers are
used as light source in Raman spectroscopy, because they produce monochromatic light
with a high power density. Raman shifts are traditionally plotted in wavenumbers, v̄
[cm−1 ]. The Raman shift of scattered photons is calculated by:
1 1
− = v̄ (2.9)
λL λS
where λL [cm] is the wavelength of the incident photons and λS [cm] is the wavelength of
the scattered photons. The Raman shift of Stokes scattering is positive and the Raman
shift of anti-Stokes scattering is negative because for Stokes Raman scattering λS > λL
82. Theory
Figure 2.2.: Raman peak characteristics are visualized in a Raman spectrum of a Si wafer:
central peak position, intensity, FWHM and line shapes of peak fits.
while for anti-Stokes Raman scattering λS < λL .
Raman spectroscopy can access a broad energy range, of which the region of 30 - 3600
cm−1 is of most interest for the majority of users, because this range covers vibrational
modes of molecules and phonon modes of solids [35]. Practically, the lower limit of
a Raman spectrum depends on the spectrometer design. In a Raman spectrometer
Rayleigh scattered photons are filtered out of the scattered radiation to only detect
Raman scattered photons. This is necessary, because the orders of magnitude larger
Rayleigh scattering would overfill the sensitive detectors used for Raman spectroscopy
and thereby hide the weak Raman scattering signal. The edge or notch filter used to filter
out the Rayleigh scattering (and depending on the sample and illumination/detection
configuration also reflected light) cuts off the lowest wavenumber region of Raman spectra
(position of spectral ’cut-off’ depends on filter, usually at about 200 cm−1 [35]).
Raman-active vibrational modes of a molecule show up in a Raman spectrum as peaks.
The characteristics of the peaks, i.e. (center) position, full width at half maximum
(FWHM) and intensity (see figure 2.2), can be used to characterize molecular vibrations
and their interactions with the environment, and coherent collective vibrations (i.e.
phonons) in solids. A molecular vibration can be modeled as a harmonic oscillator. A
harmonic oscillator consists of a particle that experiences a restoring force F when it is
displaced from its equilibrium position by distance x:
F = −kx (2.10)
where k is the force constant (the stiffer the spring, the larger k). Substitution of equation
2.11 into Newton’s equation leads to a differential equation of which a solution is:
92. Theory
x(t) = Asin(ωt)
(2.11)
ω = (k/m)1/2
where A is the amplitude of the motion, ω is the angular frequency and m is the mass of
the particle. The frequency of the particle is ν = ω/2π. A stronger bond (for example
C=C is stronger than C-C) or heavier atoms involved (for example C-Cl is heavier than
C-H) both lead to a higher stretching frequency or Raman shift [36]. Interactions of the
molecule with its environment can influence the frequency of (some of) the molecule’s
vibrations. For example, hydrogen-bonding of a carboxyl side group to surrounding water
molecules decreases its C=O stretching frequency as the C=O bond is weakened [36].
The reason for broadening of peaks in a vibrational spectrum is the interaction of the
molecule with its environment. The interaction of a molecule with its environment leads
to a slight change of the energy of a molecular vibration. Furthermore, the interactions
of a molecule with its environment leads to a different line shape of the peak. The
environment of an atom or molecule in a solid is fixed, and therefore the energy of a
vibrational mode is a statistical distribution of interactions with its neighbors, leading to
a Gaussian line shape. For a molecule in gas phase, the molecule will collide with many
other surrounding molecules leading to exponential vibrational population relaxation.
This process leads to a Lorentzian line shape. For a liquid the line shape theoretically can
be best described by Voigt profile, which has features of both Gaussian and Lorentzian
line shapes. However, in many cases a Lorentzian line shape also works well for fitting
Raman peaks of liquids.
2.2. Surface-enhanced Raman spectroscopy
2.2.1. Introduction
Our aim is to probe ensembles of molecules or even single molecules at solid-liquid in-
terfaces. In the scope of this thesis, the liquid phase is water. As explained in section
2.1.1, Raman spectroscopy fulfills two requirements for probing ensembles of molecules at
solid-water interfaces: Raman spectroscopy has chemical specificity by resolving the vi-
brational ’fingerprint’ of molecules under study, and the incidence laser light can reach the
molecules of interest at the solid-water interface because it is freely propagates through
aqueous electrolytes. However, there is one drawback that hinders Raman spectroscopy of
ensembles of molecules at solid-liquid interfaces. The Raman cross-section is too small to
detect few molecules at an interface by conventional Raman spectroscopy [32]. To enable
the detection of a few molecules at a substrate the Raman signal must be amplified. A
method to amplify the intensity of Raman scattering by several orders of magnitude is
surface-enhanced Raman spectroscopy (SERS).
2.2.2. Enhancement of Raman scattering in SERS
Enhancement of Raman scattering of pyridine molecules at a silver substrate was first
noticed by Fleischmann et al. in 1974 [37]. A few years later Jeanmaire and Van Duyne
demonstrated that the Raman enhancement of pyridine at a silver substrate was due to
102. Theory
roughening of the underlying silver substrate [38]. Shortly after the latter study Moskovits
suggested that the Raman enhancement observed in the earlier papers originated from
the excitation of surface plasmons in bumps on the roughened silver substrate [39]. These
studies were the first to report SERS, which makes Raman spectroscopy of submonolayers
of molecules adsorbed to or close to roughened coinage metal surfaces (typically within
less than ∼10 nm) possible [32].
EM enhancement mechanism
The SERS mechanism is based on the excitation of localized surface plasmons (LSPs) at
metallic nanostructures. Plasmons are collective oscillations of electrons. For two EM
modes (in this case light and surface plasmons, SPs) to couple, they need to have the same
frequency ω (for conservation of energy) and the same wave-vector k (for conservation of
momentum). The dispersion relation of light is linear while the dispersion relation of SPs
shows a curve where k goes to infinity when the ω reaches the resonance frequency ωs p
[32, 40]. For the case of propagating light and SPs along an atomically flat surface, the
dispersion relations of light and SPs never cross when placed in the same graph, i.e. the
momentum of these two EM modes is never the same for a given frequency, therefore these
EM modes can not couple. A method to overcome this momentum mismatch is using
evanescent light, e.g. produced by attenuated total reflection of light in a Kretschmann
or Otto configuration [32]. Evanescent light near the surface of a metal is slower than
propagating light, leading to a match of momentum with SPs along an atomically flat
surface at a certain frequency. Incident evanescent light of that frequency can couple to
SPs, which results in resonant excitation of SPs in the metal. The excited SPs propagate
along the surface of the metal, and are therefore called propagating surface plasmons
(PSPs). PSPs can be used for imaging nanostructures with a spatial resolution beyond
the diffraction limited spatial resolution (Abbe diffraction limit: minimum resolvable
distance of ∼ λ/2 of incident light) of light microscopy.
On the contrary to atomically flat metallic surfaces, propagating light can couple to SPs
in metallic nanostructures, of sizes much smaller than the wavelength of the propagating
light [41]. In the case of a metallic nanostructure, EM modes exist for discrete values of
ω. Therefore, dispersion relations, described for the wavevector k(ω), become irrelevant.
The excited SPs at the surface of the metallic nanoparticle are localized, therefore these
EM modes are called localized SPs (LSPs).
The light-metal nanostructure interaction can be understood as the electric field of the
incident light causing separation of free-charge carriers in the metal (see left of figure
2.3) [40]. This separation of charges (dipole) induces a field oscillating with the same
frequency as the field of the incident light. This near-field is extremely localized and
enhanced, compared to the EM field of the incident far-field light.
Furthermore, the close distance of a molecule to a large polarizable body (nanostructure)
leads to the second step in EM enhancement in SERS. The induced dipole of a molecule
couples to the induced dipole in the nanostructure. This leads to polarizability derivatives
of the nanoparticle-molecule system of typically one to three orders of magnitude larger
than the polarizability derivatives of the molecule [42]. The nanostructure serves as an
optical transmitting antenna, transferring the near-field to the far-field [42].
EM enhancement is the primary enhancement effect in SERS [32, 42]. Other enhancement
112. Theory
Figure 2.3.: Schematic image of electric field distribution near a metallic nanoparticle (left)
and near a dimer of two metallic nanoparticles (right) and resulting field en-
hancement at the poles of the metallic nanoparticle (left) and in the gap be-
tween the nanoparticles (right). Direction of external electric field is indicated
by E.
effects, such as the chemical enhancement which is due to binding of the molecule to the
metal, become important to explain specific cases of single molecule SERS/TERS. This
thesis does not contain results on single molecule SERS/TERS, therefore we will not
discuss other enhancement effects here.
Variables influencing SERS enhancement
The enhancement of SERS depends on the efficient coupling of the far-field light to the
LSPs in the nanostructure. This can be realized when the wavelength of the incident
light matches the plasmon resonance wavelength [43]. The plasmon resonance frequency
depends on the dielectric constant of the nanostructure material, the dielectric constant of
the surrounding medium and the size and shape of the nanostructure [32]. The material
of choice for a SERS substrate is usually Au or Ag, because the LSP resonance frequency
of Au or Ag nanostructures is in the visible region, close to the wavelength of incident
laser light in Raman spectroscopy [32].
The enhancement of SERS also depends on the shape of the plasmonic nanostructure
and polarization of the incident light. Some of the largest known SERS enhancements
were observed to come from the near-field in the few nanometer-sized gap between two
metallic nanostructures. The large field enhancement in the gap between two metallic
nanoparticles is due to dipole-dipole coupling, which can be visualized by drawing the
electric field distribution around a dimer of two nanoparticles (see the right of figure
2.3). The induced dipoles in the nanoparticles in the right of figure 2.3 are parallel, as a
response on the linear polarization of the incident light. Dipole-dipole coupling of two
dipoles strongly depends on the distance r between the dipoles. The interaction energy
between two dipoles is proportional to r−3 [33], given that the dipoles are parallel.
122. Theory
The right of figure 2.3 also shows another important aspect of the near-field in a
nanoparticle gap. The field lines in the gap are straight, from one nanoparticle to the
other nanoparticle. This means that the EM field in the gap is polarized, and as such,
only molecular vibration which polarizability derivatives are along the gap-direction will
be enhanced. This is a SERS selection rule.
SERS enhancement factors
Typically, enhancement factors (EFs) are considered for Raman intensities measured by
SERS or TERS. The enhancement of the field of the incident light EL in the near-field
ELoc , is described by the field enhancement g, g = ELoc /EL . In the same way as the
intensity I of EM radiation is proportional to the square of the EM field strength,
I ∝ E 2 , Raman enhancement is calculated as the square of g. In SERS, g consists
of the enhancement of the incident light gi n(ωL ) and radiation enhancement of the
Raman scattered light gs c(ωS ), where ωL and ωS are the frequencies of the incident light
and Raman scattered light, respectively. The overall field enhancement g can be written as:
ELoc (ωL )2 ELoc (ωS )2
EF = gi n(ωL )2 gs c(ωS )2 = (2.12)
EL (ωL )2 EL (ωS )2
Generally in Raman spectroscopy, the vibrational energy is much smaller than the energy
of the incident light. Therefore, the incident light only looses a small amount of energy
to the molecular vibration (in Stokes Raman scattering) and the wavelength of Raman
scattered light can be considered very close to the wavelength of the incident light.
Assuming ωL ≈ ωS , equation 2.12 can be further simplified to:
ELoc (ωL )4
g4 ≈ (2.13)
EL (ωL )4
Equation 2.13 is the famous g 4 approximation for EM enhancement in SERS.
SERS hot-spots
The enhancement of Raman scattering of a monolayer of molecules on a rough coinage
metal substrate is not evenly distributed over the substrate. Experimental studies showed
that enhanced Raman intensity originates from a small number of SERS ’hot-spots’ on
the substrates [44]. Futhermore, SERS enhancement varies largely from spot-to-spot.
A striking example of this was shown by Fang et al. in 2008, by measuring SERS
of a benzenethiolate monolayer on silver [45]: 24 percent of the total SERS intensity
originated from only ∼63 out of one million benzenethiolate molecules on the substrate.
2.3. Tip-enhanced Raman spectroscopy at the solid-gas
interface
2.3.1. Development of TERS
SERS shows large Raman scattering enhancements, but using SERS for chemical imaging
with a nanometric spatial resolution is difficult, because of the practical difficulty to get
132. Theory
the molecule(s) under study into the near-field in proximity of a metallic nanostructure.
Furthermore, SERS is restricted to metallic surfaces. Nanometric chemical imaging of
surfaces is enabled by fixing a metallic nanostructure to a tip or cantilever and scanning
this probe over a surface, similar to other scanning probe microscopies (SPM). This idea
was first described by Wessel in 1985 [46] and in the year 2000 tip-enhanced Raman
spectroscopy (TERS) was practically proven by four independent research groups [47, 48,
49, 50]. In TERS a tip, usually made of Au or Ag, with an apex radius of about 20 nm is
used as a single hot-spot for Raman enhancement [42] (see image 2.4), contrary to the many
hot-spots inside the laser focus on common SERS substrates. Due to mechanical control
over the positioning of the tip, the hot-spot for Raman enhancement can be positioned
nearby (an ensemble of) molecules of interest, thereby circumventing the difficulty of
bringing the molecule(s) of interest into the hot-spot on SERS substrates. Bringing the
hot-spot to molecules adsorbed at a substrate, by approaching the tip to a distance of
∼1 nm away from the substrate (see image 2.4), largely enhances the Raman scattering
intensity of these molecules. The enhancement factor of TERS compared to conventional
Raman spectroscopy is around 103 to 106 [51]. The lateral spatial resolution of TERS
in the ambient is typically similar to the radius of the tip apex [42], although spatial
resolutions of 1.7 nm [52] and 0.5 nm [53] have been reported.
2.3.2. Enhancement of Raman scattering in TERS
The same plasmon-enhancement principles of SERS apply for TERS, where the apex of
the tip is the plasmonic nanostructure (see section 2.2.2 for the explanation of plasmon-
enhancement in SERS). Focusing light to the apex of the TERS tip leads to the excitement
of localized surface plasmons (LSPs) at the surface of the tip, which induce an enhanced
local EM field (near-field) around the apex of the tip (see figure 2.4). Like in the case
of SERS, the local field enhancement depends on the wavelength and polarization of the
incident light, dielectric constant of the tip material, dielectric constant of the surrounding
medium and shape of the tip (see section 2.2.2).
In TERS, the gap-mode configuration for EM field enhancement, as explained for SERS
in the right of figure 2.3, can be applied. To model the gap-mode configuration for TERS,
the tip is replaced by a metal nanosphere above a metal substrate [54] (see figure 2.4). The
induced dipole in the metal nanosphere creates an image dipole in the metal substrate.
The EM field of the induced dipole in the nanosphere and the EM field of the image dipole
superimpose, leading to an enhanced near-field and improved spatial resolution in the gap.
As explained for the gap-mode configuration in SERS, the strength of the local enhanced
EM field in the gap increases with a decreasing gap distance [1, 55].
Ideally, the enhanced near-field is confined underneath the apex of the TERS tip, as this
is the position of the tip that is brought close to molecule(s) of interest. For TERS in side-
illumination geometry p-polarized incident laser light forms an intense near-field beneath
the apex of the tip, while s-polarized incident laser light does not enhance the field beneath
the tip (see image 6.32 in [56]). The reasons for this are that the direction of the induced
dipole in the tip apex should be along the tip axis to have the most dense electric field
lines of the induced dipole coming out at the apex of the tip (in the same way as shown
schematically for gap-mode SERS in the right of figure 2.3). Furthermore, the lightning
rod effect plays a role in the efficiency to couple light to the tip. The conical shape of the
metallic tip can be modeled as a cascade of spheres of decreasing sizes [57]. Upon coupling
142. Theory
las
er Au �p
ph
Ra ot
ma on
n in
ph
ot ~20 nm
on
ou induced dipole
t + ++
--- near-field
monolayer of ~1 nm
adsorbed + ++
molecules --- image dipole
Au substrate
Figure 2.4.: Schematic representation of formation of enhanced EM near-field in gap-mode
tip-enhanced Raman spectroscopy (TERS) in backscattering geometry with a
Au tip and Au substrate.
with incident light, these spheres will have induced dipoles pointing in the same direction as
the polarization of the light. In case of p-polarized light, the dipoles of the different spheres
couple, leading to amplification of the near-field in the gaps between the smallest particles.
This process is so-called cascade enhancement [57]. The gap between the smallest particles
is in case of gap-mode TERS the gap between tip and sample (between induced dipole in
the apex of the tip and image dipole in the substrate). Cascade enhancement can enhance
the near-field by a factor of several hundred compared with the field of the incident light.
Another effect on the EM near-field is the amount of metal in the laser focus. The conical
shape of the TERS tip makes the diameter of the tip decrease from several hundred µm to
∼ 40 nm. The diameter of the laser focus is several hundred µm. Therefore, the hundreds
of µm of metallic tip in the laser focus will add up to the lightning rod effect.
2.3.3. TERS spectral interpretation
Several ’issues’ make the interpretation of TER and SER spectra more complicated than
that of conventional Raman spectra. TER and SER spectra come with a broad continuum
background, of which its maximum energy can change from TERS tip to TERS tip
and from SERS substrate to SERS substrate. Furthermore, the peak intensity ratios in
single TER or SER spectra can differ as well when changing to another TERS tip or to
another SERS substrate. Very recently, Lin et al. [58] showed that the shape of the broad
background and the peak intensity ratio are both connected to the LSP resonance. At the
LSP resonance frequency the SERS background (which is partly due to photoluminescence
[59]) is high and the SERS peaks are high, compared to non-resonant regions in the
SERS spectrum where the background and SERS peaks are low. Lin et al. proposed
a scaling method where the SERS or TERS background serves as an internal standard
152. Theory
for the plasmon resonance dispersion. By applying their scaling method, they could
retrieve the same SERS and TERS spectra while varying SERS substrates and TERS tips.
2.3.4. Scanning probe microscopy and TERS tips
In TERS, the spatial positioning of the tip with respect to the substrate is typically
controlled by either an atomic force microscopy (AFM) or scanning tunneling microscopy
(STM) [60].
Commercial AFM and STM systems are designed for raster scanning of substrates, which
can be used for TERS mapping.
For AFM-TERS, the most common method to fabricate TERS-active tips is covering
commercial AFM cantilevers with a Au or Ag film. The latter is performed by thermal
evaporation of Au or Ag in vacuum [61].
In STM-TERS, the tip is usually made out of a Au or Ag wire which is electrochemically
etched into a cone shape [61].
In general, STM has a higher resolution than AFM. STM can only be applied on
conductive substrates, while AFM can be used on insulating substrates as well.
2.4. TERS at the solid-liquid interface and electrochemical
TERS
2.4.1. Development of solid-liquid (electrochemical) TERS
In 2009, almost ten years after the first TERS reports, a proof-of-principle study of TERS
at the solid-liquid interface was published by the Zenobi group [30]. Since then, mainly
three groups, Van Duyne [62], Ren [63] and Domke [64] have been working on developing
solid-liquid (electrochemical) TERS. Moving from solid-gas (or solid-vacuum) TERS to
solid-liquid TERS is technically challenging, for several reasons which are explained in the
following sections.
2.4.2. Illumination geometry for solid-liquid TERS
There are various illumination geometries to focus laser light to the apex of a TERS
tip at the solid-liquid interface (see the illumination geometries for solid-liquid TERS
used to date in figure 2.5). All these geometries are used in backscattering geom-
etry, where the same objective is used to focus the incident light to the tip and
collect scattered light. The choice of illumination geometry of a TERS setup depends on
the opacity of the substrates to be investigated and the efficiency to couple light to the tip.
In bottom-illumination (left in image 2.5) laser light is focused on the tip in trans-
mission mode. In this illumination geometry, oil-immersion objectives can be used [30],
which have a higher numerical aperture than in air and liquid-immersion objectives,
which increases both the efficiency of coupling light to the tip and detection efficiency.
Using radially polarized light leads to a better coupling efficiency of light to the tip in this
162. Theory
Figure 2.5.: Illumination geometries for tip-enhanced Raman spectroscopy at the solid-
liquid interface.
geometry [65]. Bottom-illumination TERS can only be used for transparent substrates.
Glass substrates, optionally with a 6 - 10 nanometers thick Au layer to enable gap-mode
TERS, have been used for solid-liquid AFM-TERS [30, 66] and ITO substrates have been
used for electrochemical AFM-TERS [62] with this illumination geometry. The limited
choice of transparent substrates limits the applicability of bottom-illuminated TERS.
Side- and top-illuminated TERS can be used for both transparent and opaque
substrates. This makes side- and top-illuminated TERS versatile for the choice of
substrate material and substrate thickness. Thick and opaque substrates are especially
important in electrochemical TERS, where ideally a several millimeter thick metal (single
crystal) substrate is used to secure a homogeneous surface potential, as opposed to few
nanometer thick metal layers.
As explained in section 2.3.2 the polarization of light influences the coupling of light
to the tip. For side-illumination p-polarized light has to be used to create a near-field
between tip and sample. In top-illumination the tip should be inclined to avoid shadowing
effects. A drawback of side- and top-illumination is the use of long-working distance,
in-air objectives with smaller NA (typically less than 0.55). Touzalin et al. [67] used a
water-immersion objective in top-illumination, to increase coupling efficiency of light to
the tip and detection efficiency of scattered photons. However, as TERS is a molecule-
sensitive technique, all parts touching the liquid phase have to be thoroughly cleaned
to remove (mainly carbonaceous) contamination. Thorough cleaning procedures using
strong acids (for a detailed cleaning procedure, see section 3.5) can not be performed
with an objective, and therefore the objective is a possible source of contamination if
immersed inside the liquid phase in solid-liquid TERS. Furthermore, the small working
distance of water-immersion objectives makes the TERS setup design difficult.
If an in-air objective is used for side-illuminated solid-liquid TERS, the laser light has
to pass several interfaces of media with different refractive indices before reaching the
apex of the TERS tip, compared to solid-air TERS. The introduction of these interfaces
172. Theory
(air-water or air-glass and glass-water) distort the laser focus in two ways: the focal
length increases and the focus gets less sharp. A way to minimize focus distortions is
to decrease the path length of the laser beam inside the liquid phase. The latter has
been shown in an electrochemical STM-TERS study [63] where the apex of the tip was
placed ∼1 mm away from a glass window. Another way is to actively precompensate for
focus distortions by adaptive beam shaping, for example with the help of a spatial light
modulator (SLM) [68, 69]. A SLM is an electronic mirror consisting of liquid-crystalline
pixels that can be tuned independently to actively shape the phase and amplitude of
(parts of) a light beam.
2.4.3. SPM base and tips for solid liquid TERS
The choice of SPM for solid-liquid TERS follows different requirements than the coice of
SPM for in-air TERS. Some of these considerations are discussed here.
In STM the tip holder does not touch the liquid phase, which makes the chance on
contamination smaller than when using AFM, where the tip holder touches the liquid
phase. An STM tip does not touch the sample, as in the case of contact-mode AFM,
therefore the chance to pick up molecules with an STM tip is smaller than with AFM.
In general, knowledge about solid-liquid (electrochemical) AFM is less abundant than
knowledge about solid-liquid (electrochemical) STM.
Both AFM- and STM-TERS tips need an extra treatment before they can be suc-
cessfully used in solid-liquid TERS experiments. For the use of AFM-TERS tips in a
liquid environment, extra protective layers underneath and/or on top of the Au or Ag
film have to be added to protect against delamination of the Au or Ag film [66]. For the
use in water various coatings have been successful, such as Cr - Au - Ag [66].
For use of STM-TERS tips in a liquid environment, the liquid phase might introduce
Faradaic leakage currents. The latter leads to electrons passing the liquid directly instead
of tunneling between the tip and the sample, preventing a stable gap distance between
tip and sample. A way to avoid Faradaic leakage currents is insulation of STM tips,
except for their apex. Tip insulating procedures that have been successful in TERS in
aqueous solutions are coating with Zapon lack [64], coating with polyethylene glue [63] or
deposition of a silica shell [70]. Fluorescence of tip-insulating materials at the wavelength
of the incident laser beam should be avoided, as it might overwhelm the much smaller
TERS signal.
18You can also read