Statistical Assessment of the SDGs in the LDCs and other Vulnerable Countries - Ferdi
←
→
Page content transcription
If your browser does not render page correctly, please read the page content below
P
 rking ape

 114

 Wo

 r
fondation pour les études et recherches sur le développement international

 cies
 Octobe*r

 Dev
 elo 2014
 pme nt P

 oli
 * English version
 october 2015

 Statistical Assessment of
 the SDGs in the LDCs
 and other Vulnerable Countries

 Matthieu Boussichas
 Vincent Nossek

 Matthieu Boussichas, PhD In Economics, is Programme Manager at
 the Ferdi since 2012. He is working on issues related to aid and development
 financing, as well as the development agenda and its objectives after 2015.

 ELLE MET EN ŒUVRE AVEC L’IDDRI L’INITIATIVE POUR LE DÉVELOPPEMENT ET LA GOUVERNANCE MONDIALE (IDGM).
 Vincent Nossek, is a Research Assistant at the Ferdi.

 CETTE PUBLICATION A BÉNÉFICIÉ DU SOUTIEN DU MINISTERE DES AFFAIRES ETRANGERES FRANCAIS.
 ELLE COORDONNE LE LABEX IDGM+ QUI L’ASSOCIE AU CERDI ET À L’IDDRI.
 LA FERDI EST UNE FONDATION RECONNUE D’UTILITÉ PUBLIQUE.
Summary This document provides a statistical comparison of the sustainable development goals (SDGs) and their main targets in the least developed countries, other vulnerable countries and other developing countries. It is based on the list of SDGs adopted in September 2015 during the 70th session of the UN General Assembly (United Nations, 2015). Although the new post-2015 agenda will be universal, the wide range of countries now covered means there may be a need to tailor the agenda to the specific features of individual, and particularly vulnerable, countries. Part of the response will therefore involve identifying each country’s specific features in relation to the different goals and targets proposed. This document thus compares the Least Developed Countries (LDCs), Landlocked Developing Countries (LLDCs) and Small Island Developing States (SIDS) with either non-LDC developing countries or Middle-Income Countries (MICs), depending on the availability of data. This work is a continuation of Ferdi’s P77 working document (Boussichas, Coudert, & Gillot, Atteindre les OMD dans les PMA et autres pays vulnérables : Où en sommes-nous? - Reaching MDGs in LDCs and other vulnerable countries : Where do we stand? , 2013), which gives a factual assessment of each Millennium Development Goal (MDG) in categories of vulnerable countries and compares the results with other non-LDC developing countries. As with the MDG assessment, it would appear that vulnerable countries, and in particular LDCs, are generally lagging significantly behind in terms of the goals and targets of the post-2015 agenda. The concern that broadening the development agenda to include sustainable development would, in the future, dilute the priority thus far given to these countries is not, however, backed up by the statistics given that the sustainable development needs of vulnerable countries appear to be generally greater than those of other country categories. In order to take baseline country data into account when evaluating progress, wherever possible and relevant this work has included a non-linear evaluation of the progress made in these possible future goals since 2000. Although education and health still remain at lower levels in LDCs, it can thus be seen that these countries have performed comparatively better than other developing countries (DCs). The same observation can be made in relation to the use of alternative and renewable energies. In contrast, LDC progress has been disappointing in terms of poverty reduction and malnutrition when compared to the performance of other DCs. These results demonstrate two things: 1/ The MDG approach would appear to have enabled LDCs to catch up some (but only some) of their delay in terms of human capital. This encouraging observation makes a good case for continuing to differentiate between these and other countries, particularly in terms of the specific efforts being made by the international community in their regard; 2/ As LDCs are nonetheless performing particularly poorly in relation to poverty and malnutrition, it is important to focus on the whole range of factors that may be contributing to this. A number of these issues are precisely the new themes being picked up in the post-2015 agenda and for which LDCs are generally showing significant delays. In order to replicate the LDCs’ relatively good human capital performance in other areas of development, vulnerable countries must continue to receive specific support from the international community.
Table of Contents Introduction .................................................................................................................................... 6 SDG 1: End poverty in all its forms everywhere ................................................................. 8 Target proposed by the OWG: 1.1 By 2030, eradicate extreme poverty for all people everywhere, currently measured as people living on less than USD 1.25 a day ............................ 8 Target proposed by the OWG: 1.2 By 2030, reduce at least by half the proportion of men, women and children of all ages living in poverty in all its dimensions according to national definitions .................................................................................................................................................................... 9 SDG 2: End hunger, achieve food security and improved nutrition and promote sustainable agriculture............................................................................................................. 10 TARGETS AND INDICATORS OF ACCESS TO SUFFICIENT FOOD ............................................................................. 10 Target proposed by the OWG: 2.1 By 2030, end hunger and ensure access by all people, in particular the poor and people in vulnerable situations, including infants, to safe, nutritious and sufficient food all year round .................................................................................................................... 10 Target proposed by the OWG: 2.2 By 2030, end all forms of malnutrition, including achieving, by 2025, the internationally agreed targets on stunting and wasting in children under 5 years of age, and address the nutritional needs of adolescent girls, pregnant and lactating women and older persons ................................................................................................................ 11 TARGETS AND INDICATORS FOR AGRICULTURAL PRODUCTION ......................................................................... 13 Target proposed by the OWG: 2.3 By 2030, double the agricultural productivity and incomes of small-scale food producers, in particular women, indigenous peoples, family farmers, pastoralists and fishers, including through secure and equal access to land, other productive resources and inputs, knowledge, financial services, markets and opportunities for value addition and non-farm employment............................................................................................................... 13 Target proposed by the OWG: 2.4 By 2030, ensure sustainable food production systems and implement resilient agricultural practices that increase productivity and production, that help maintain ecosystems, that strengthen capacity for adaptation to climate change, extreme weather, drought, flooding and other disasters and that progressively improve land and soil quality......................................................................................................................................................... 14 SDG 3: Ensure healthy lives and promote well-being for all at all ages................... 15 Target proposed by the OWG: 3.1 By 2030, reduce the global maternal mortality ratio to less than 70 per 100,000 live births ........................................................................................................................ 15 Target proposed by the OWG: 3.2 By 2030, end preventable deaths of newborns and children under 5 years of age, with all countries aiming to reduce neonatal mortality to at least as low as 12 per 1,000 live births and under-5 mortality to at least as low as 25 per 1,000 live births....................................................................................................................................................... 15 Target proposed by the OWG: 3.3 By 2030, end the epidemics of AIDS, tuberculosis, malaria and neglected tropical diseases, and combat hepatitis, water-borne diseases and other communicable diseases........................................................................................................................................ 15
Target proposed by the OWG: 3.8 Achieve universal health coverage, including financial risk protection, access to quality essential health care services, and access to safe, effective, quality, and affordable essential medicines and vaccines for all ........................................................ 16 SDG 4: Ensure inclusive and equitable quality education and promote life-long learning opportunities for all ................................................................................................. 19 Target proposed by the OWG: 4.1 By 2030, ensure that all girls and boys complete free, equitable and quality primary and secondary education leading to relevant and effective learning outcomes .................................................................................................................................................. 19 Target proposed by the OWG: 4.5 By 2030, eliminate gender disparities in education & ensure equal access to all levels of education & vocational training for the vulnerable, including persons with disabilities, indigenous peoples & children in vulnerable situations21 Target proposed by the OWG: 4.6 By 2030 ensure that all youth and at least [x] per cent of adults, both men and women, achieve literacy and numeracy ............................................................ 21 SDG 5: Achieve gender equality and empower all women and girls ........................ 22 Target proposed by the OWG: 5.1 End all forms of discrimination against all women and girls everywhere ............................................................................................................................................................... 22 Target proposed by the OWG: 5.5 Ensure women’s full and effective participation and equal opportunities for leadership at all levels of decision-making in political, economic and public life.................................................................................................................................................................................. 22 SDG 6: Ensure availability and sustainable management of water and sanitation for all ............................................................................................................................................... 25 Target proposed by the OWG: 6.1 By 2030, achieve universal and equitable access to safe and affordable drinking water for all ............................................................................................................. 25 Target proposed by the OWG: 6.2 By 2030, achieve access to adequate and equitable sanitation and hygiene for all, and end open defecation, paying special attention to the needs of women and girls and those in vulnerable situations .......................................................................... 25 SDGs 7 and 13: Energy and climate change ....................................................................... 27 Target proposed by the OWG: 7.1 By 2030, ensure universal access to affordable, reliable and modern energy services .............................................................................................................................. 27 Target proposed by the OWG: 7.2 By 2030, increase substantially the share of renewable energy in the global energy mix........................................................................................................................ 28 Target proposed by the OWG: 7.b By 2030, expand infrastructure and upgrade technology for supplying modern and sustainable energy services for all in developing countries, in particular least developed countries, small island developing States and landlocked developing countries, in accordance with their respective programmes of support ................ 28 Target proposed by the OWG: 7.3 By 2030, double the global rate of improvement in energy efficiency .................................................................................................................................................................... 30 CONSIDERATION OF CLIMATE CHANGE...................................................................................................................... 31
SDGs 8, 9, 10 & 12: Economic growth, infrastructure, employment, inequalities and sustainable production patterns .................................................................................. 33 TARGET AND INDICATOR FOR INCLUSIVE ECONOMIC GROWTH .......................................................................... 33 Target proposed by the OWG: 8.1 Sustain per capita economic growth in accordance with national circumstances and, in particular, at least 7 per cent gross domestic product growth per annum in the least developed countries ............................................................................................... 33 TARGETS AND INDICATORS FOR EMPLOYMENT ISSUES ........................................................................................ 34 Target proposed by the OWG: 8.5 By 2030, achieve full and productive employment and decent work for all women and men, including for young people and persons with disabilities, and equal pay for work of equal value .................................................................................. 34 Target proposed by the OWG: 8.6 By 2020, substantially reduce the proportion of youth not in employment, education or training ........................................................................................................... 35 Target proposed by the OWG: 8.8 Protect labour rights and promote safe and secure working environments for all workers, including migrant workers, in particular women migrants, and those in precarious employment ........................................................................................ 36 TARGETS AND INDICATORS FOR THE MACROECONOMIC ENVIRONMENT ......................................................... 36 Target proposed by the OWG: 9.3 Increase the access of small-scale industrial and other enterprises, in particular in developing countries, to financial services, including affordable credit, and their integration into value chains and markets................................................................. 36 Target proposed by the OWG: 9.5 Enhance scientific research, upgrade the technological capabilities of industrial sectors in all countries, in particular developing countries, including, by 2030, encouraging innovation and substantially increasing the number of research and development workers per 1 million people and public and private research and development spending ................................................................................................................................ 36 Target proposed by the OWG: 17.1 Strengthen domestic resource mobilization, including through international support to developing countries, to improve domestic capacity for tax and other revenue collection ............................................................................................................................. 38 Target proposed by the OWG: 8.2 Achieve higher levels of economic productivity through diversification, technological upgrading and innovation, including through a focus on high- value-added and labour-intensive sectors ................................................................................................... 39 Target proposed by the OWG: 9.1 Develop quality, reliable, sustainable and resilient infrastructure, including regional and transborder infrastructure, to support economic development and human well-being, with a focus on affordable and equitable access for all ........................................................................................................................................................................................ 40 Target proposed by the OWG: 8.3 Promote development-oriented policies that support productive activities, decent job creation, entrepreneurship, creativity and innovation, and encourage the formalization and growth of micro-, small- and medium-sized enterprises, including through access to financial services ........................................................................................... 42 OTHER TARGETS AND INDICATORS ............................................................................................................................ 43 Target proposed by the OWG: 10.c By 2030, reduce to less than 3 per cent the transaction costs of migrant remittances and eliminate remittance corridors with costs higher than 5 per cent ....................................................................................................................................................................... 43

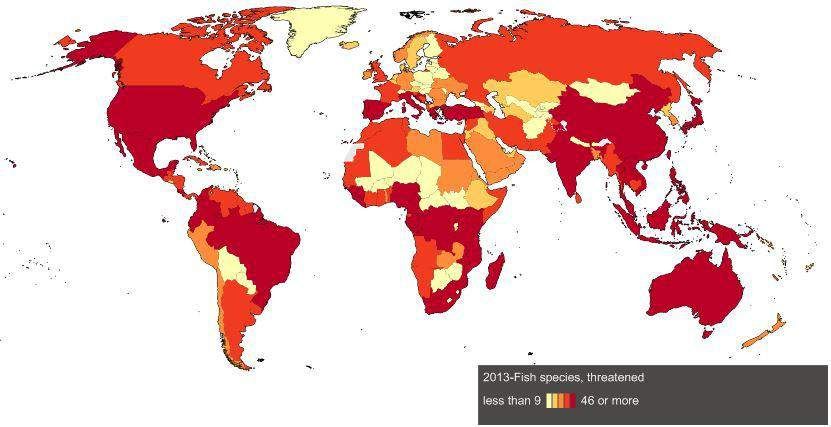
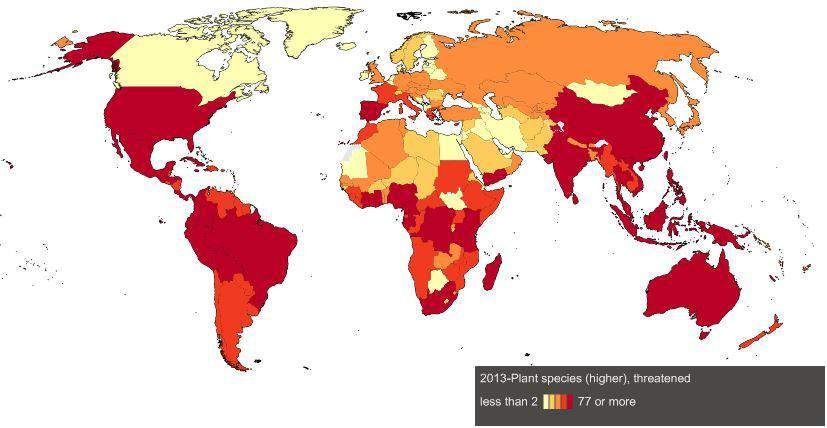
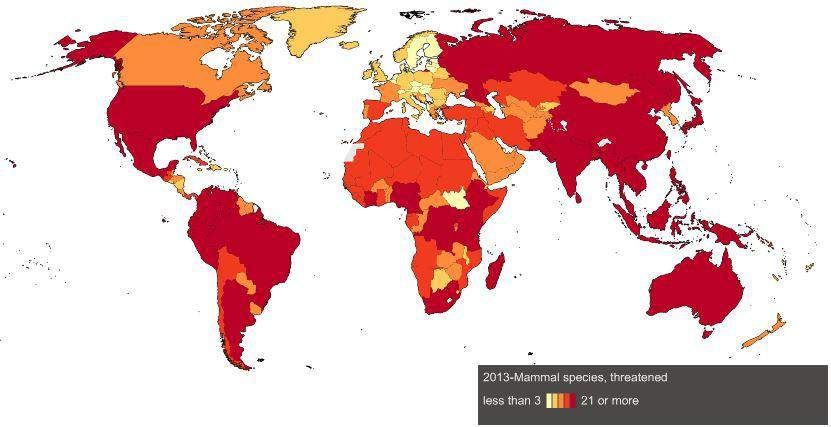
SDG 11: Make cities and human settlements inclusive, safe, resilient and sustainable .................................................................................................................................... 44 Target proposed by the OWG: 11.1 By 2030, ensure access for all to adequate, safe and affordable housing and basic services and upgrade slums ................................................................... 44 Target proposed by the OWG: 11.6 By 2030, reduce the adverse per capita environmental impact of cities, including by paying special attention to air quality and municipal and other waste management ................................................................................................................................................ 45 SDGs 14 and 15: Sustainable use of natural resources and conservation of ecosystems and biodiversity .................................................................................................. 47 Target proposed by the OWG: 15.5 Take urgent and significant action to reduce the degradation of natural habitats, halt the loss of biodiversity and, by 2020, protect and prevent the extinction of threatened species.............................................................................................. 47 Target proposed by the OWG: 15.2 By 2020, promote the implementation of sustainable management of all types of forests, halt deforestation, restore degraded forests and substantially increase afforestation and reforestation globally.......................................................... 50 Target proposed by the OWG: 14.1 By 2025, prevent and significantly reduce marine pollution of all kinds, particularly from land-based activities, including marine debris and nutrient pollution ................................................................................................................................................... 51 Target proposed by the OWG: 14.2 By 2020, sustainably manage and protect marine and coastal ecosystems to avoid significant adverse impacts, including by strengthening their resilience, and take action for their restoration in order to achieve healthy and productive oceans .......................................................................................................................................................................... 51 SDG 16: Promote peaceful and inclusive societies for sustainable development, provide access to justice for all and build effective, accountable and inclusive institutions at all levels ............................................................................................................ 52 TARGETS AND INDICATORS FOR THE PROMOTION OF PEACEFUL AND INCLUSIVE SOCIETIES .................... 52 Target proposed by the OWG: 16.1 Significantly reduce all forms of violence and related death rates everywhere ....................................................................................................................................... 52 Target proposed by the OWG: 16.2 End abuse, exploitation, trafficking, and all forms of violence against and torture of children ....................................................................................................... 52 TARGETS AND INDICATORS FOR THE PROMOTION OF THE RULE OF LAW AND INSTITUTIONAL CAPACITY ............................................................................................................................................................................................. 54 Target proposed by the OWG: 16.6 Develop effective, accountable and transparent institutions at all levels ........................................................................................................................................ 54 Target proposed by the OWG: 16.3 Promote the rule of law at the national and international levels and ensure equal access to justice for all ......................................................................................... 55 Target proposed by the OWG: 16.5 Substantially reduce corruption and bribery in all their forms ............................................................................................................................................................................ 55 Conclusion ..................................................................................................................................... 57 References ..................................................................................................................................... 58 Annexes .......................................................................................................................................... 60
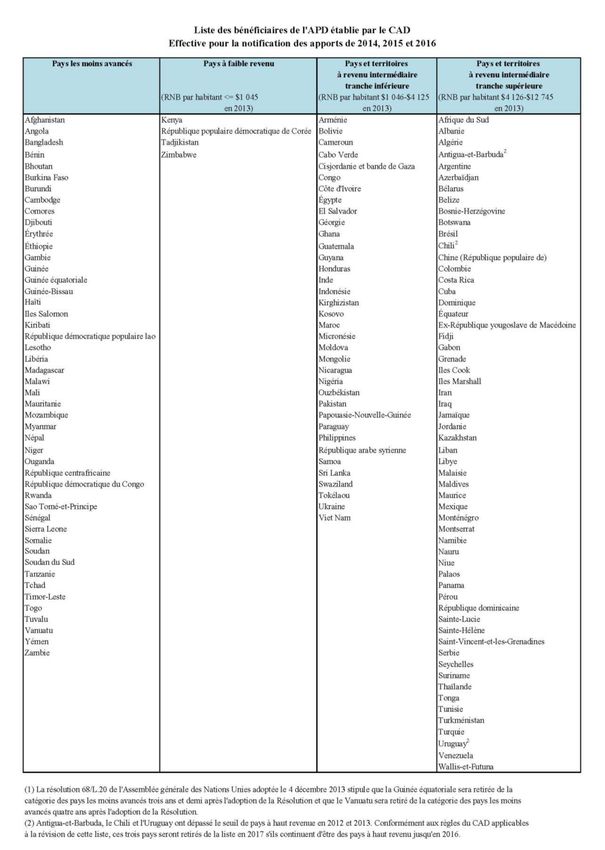
Introduction The General Assembly of United Nations has adopted 17 Sustainable Development Goals (SDGs) during its 70th session. These goals were designed by the United Nations Open Working Group on Sustainable Development Goals (OWG) which presented the results of its work on 19 July 2014. In its proposal, it set out a list of 16 SDGs, broken down into 107 performance targets and 43 means of implementation (MoI), plus a 17th SDG on implementing the post-2015 agenda, accompanied by 19 MoI (Open Working Group on SDG, 2014). Unlike the MDGs, the post-2015 agenda goals will concern all countries. Their universal nature will bring the agenda into line with the need to collectively address what are increasingly becoming global issues. It is for this reason in particular that the development agenda has been broadened to encompass sustainable development, taking a number of dimensions into consideration that were absent from or neglected in the MDGs, such as environmental conservation, biodiversity and climate, and peace and security. The irrefutable need to collectively promote more sustainable and inclusive production methods globally does not, however, mean that we can overlook the fact that not all challenges are universal, not all countries are equally exposed to the collective challenges and not all have the same resources with which to tackle them. Through its goals, the future agenda must be able to combine this universality with the need to consider countries according to their specific needs, particularly their vulnerabilities and the resources they have available for development. In order to highlight some of the specific features that particularly vulnerable countries may exhibit in relation to the new SDGs, this paper provides a statistical assessment of some of the targets being proposed by the UN Open Working Group. It follows on from Ferdi’s P77 working document (Boussichas, Coudert, & Gillot, Atteindre les OMD dans les PMA et autres pays vulnérables : Où en sommes-nous? - Reaching MDGs in LDCs and other vulnerable countries : Where do we stand? , 2013), which compared the MDGs in vulnerable and other developing countries by means of a factual and comparative analysis. This paper continues this approach by comparing the situation of the SDGs in the Least Developed Countries (LDCs), Landlocked Developing Countries (LLDCs) and Small Island Developing States (SIDS), where data is available,1 with that of the SDGs in non-LDC developing countries or, in the absence of more specific data, Middle-Income Countries (MICs), data for which is often found in the World Development Indicators (WDI).2 In this paper, we consider the 16 SDGs (the 17th being an MoI goal), grouping some of them together due to their thematic similarities. The targets chosen are those that we consider most relevant to vulnerable countries and for which data3 is generally available in the WDI database. We 1 There is less data on Small Island Developing States. These countries are sometimes missing from the analysis for this reason. 2 The categories of LDC, LLDC and SIDS are as given in the lists drawn up by UN-OHRLLS. We have only included those LLDCs, SIDS and DCs that are eligible for ODA according to the OECD’s DAC list (see Annex 1, page 62). 3 The production of statistical data that will enable monitoring of the post-2015 agenda is one of the great challenges of this process.
have also prioritized new targets over those already given in the MDGs in order to avoid any overlap with Boussichas & al. (2013).4 Where possible and relevant to the indicators considered here, we have supplemented our analysis with a measure of progress since 2000, bearing in mind the non-linearity generally noted in improvements in bounded variables. For this, we have used the so-called ‘Logit’ method developed in an ongoing working document of Ferdi.5 The aim of this work is not to judge the validity or relevance of the goals and targets adopted by the UNGA. Its added value rather lies in identifying the goals and targets for which vulnerable countries may need to be treated differently, even though the precise values of some targets have yet to be defined and the methods of any possible country differentiation still need to be discussed. 4 The data is given by category of country, as an average, generally weighted for population, unless stated otherwise. Some country category data already given in Boussichas & al. (2013) may differ slightly as their paper occasionally used averages of ratios rather than average ratios. 5 To analyse a change between two points, R0 and R1, one needs to consider this change not only in relation to the initial level R0 (i.e. the rate of growth of Ri) but also in terms of the distance remaining between R1 and the target C. The combined consideration of the distance passed since the initial situation, the distance to be covered up to the target and the non-linearity in the indicator change results in an indicator framed by the Logit difference between the two points R 0 1 0 and R1: ∆ ( ) = [ ] − [ ] − 1 − 0
SDG 1: End poverty in all its forms everywhere Target proposed by the OWG: 1.1 By 2030, eradicate extreme poverty for all people everywhere, currently measured as people living on less than USD 1.25 a day Figure 1 : Poverty headcount ratio at $1.25 a day (PPP) (% of population) ΔLogit LDC 0,73 DC (LDC excluded) 1,22 Source : United Nations, World Bank (WDI & Povcalnet) and authors’ estimates Note : Total proportion by groups. Missing data generated by OLS, more details are available from the authors. Not enough data were available for SIDS The United Nations Open Working Group on Sustainable Development Goals (OWD) proposes an ambitious extension of MDG 1A,6 with the eradication of extreme poverty by 2030. In actual fact, this goal was first mentioned at the 1996 Copenhagen Conference on social development, where MDG 1 was presented by its authors as just one stage in the process of eradicating poverty. (CAD, 1996). As noted in Ferdi’s P77 working document on a statistical assessment of the MDGs in LDCs (Boussichas, Coudert, & Gillot, Atteindre les OMD dans les PMA et autres pays vulnérables : Où en sommes-nous? - Reaching MDGs in LDCs and other vulnerable countries : Where do we stand? , 2013), whilst non-LDC developing countries have now achieved MDG 1A, LDCs are still lagging far behind and are disproportionately more affected by extreme poverty (around 4 in every 10 people in LDCs as opposed to 2 in every 10 for non-LDC developing countries). A linear extension of poverty reduction in the three country categories might lead one to believe that poverty could be eradicated by 2030. However, the marginal progress of a bounded variable often decreases at the outer bounds of its theoretical limit, so any movement in the current poverty curves will probably be of a non-linear nature (logarithmic, for example), as illustrated by Figure 1 Figure 1 above. On this basis, the goal of eradicating poverty by 2030 seems ambitious for the developing countries (DCs), improbable for the landlocked developing countries (LLDCs or landlocked countries) and unachievable for the least developed countries (LDCs). This analysis is backed up by the LDCs’ lower poverty reduction performance (as measured in Logit) when compared to other DCs since 2000; if 6 MDG 1, target A: Halve, between 1990 and 2015, the proportion of people whose income is less than USD 1 a day.
LDCs had performed on a par with other DCs, greater poverty reduction would have been achieved in relation to the baseline levels noted in 2000. Poverty levels are therefore likely to remain significantly higher in LDCs and landlocked countries over the coming 15 years. This specific feature alone argues for vulnerable countries to be considered differentially, both in terms of setting them a more reasonable target and ensuring that the international community targets them with specific funding. Target proposed by the OWG: 1.2 By 2030, reduce at least by half the proportion of men, women and children of all ages living in poverty in all its dimensions according to national definitions Figure 2 : Poverty headcount ratio at national poverty line (% of population) ΔLogit LDC 0,45 DC (LDC excluded) 0,78 Source : United Nations, World Bank (WDI & Povcalnet) and authors’ estimates Note : Total proportion by groups. Missing data generated by OLS, more details are available from the authors. Not enough data were available for SIDS One of the criticisms made of the first MDG was that it targeted poverty using a threshold (USD 1.25/inhabitant per day) that was identical right across the developing world. Given the substantial differences between countries, this is not fair; not only has the category of DCs become more diversified since 2000 but the SDG agenda also now concerns all countries, regardless of their development level. It would therefore be more relevant to measure poverty using a threshold specific to each country. Despite these differences in the methodology used for measuring poverty, the conclusions remain the same, namely the likely impossibility of eradicating poverty by 2030 in LDCs, and the stated need to treat vulnerable countries differently, as noted above.
SDG 2: End hunger, achieve food security and improved nutrition and promote sustainable agriculture The OWG on SDGs proposes devoting a goal to agricultural and food issues. It is important to address these two issues concomitantly. In fact, as noted in the discussion on food security in the post-2015 agenda, organized by Ferdi and the French Ministry of Foreign Affairs on 29 January 2014, guaranteeing food security means taking all four of its dimensions into account: access to food, availability of food (linked to global agricultural production), sustainability and issues of use and quality of nutrition. WDI provides interesting statistical data on people’s access to sufficient food and on agricultural production. TARGETS AND INDICATORS OF ACCESS TO SUFFICIENT FOOD Target proposed by the OWG: 2.1 By 2030, end hunger and ensure access by all people, in particular the poor and people in vulnerable situations, including infants, to safe, nutritious and sufficient food all year round In order to evaluate the availability of adequate food, we have chosen the prevalence of under- nutrition and the extent of the food deficit as our indicators. Boussichas & al. (2013) note Figure 3 : Prevalence of undernourishment (% of population) that, whilst non-LDC developing countries are now near to achieving the goal set by the MDGs of halving the proportion of people suffering from hunger, LDCs are still lagging far behind in this regard (-30% since 1990). Worse still, the number of people suffering from hunger in the LDCs has increased slightly (+27 million between 1990 and 2010). Figure 3 shows that under-nutrition has remained high in LDCs and Source : World Bank (WDI) landlocked countries, at two and a half times the level of other DCs and 50% more than in SIDS. As emphasized by the speakers at the Ferdi-Ministry of Foreign Affairs seminar, it is harder to overcome malnutrition than it is to combat poverty.7 In addition to being insufficient in relation to 7 See the webpage for this event: http://www.ferdi.fr/fr/evenement/la-s%C3%A9curit%C3%A9-alimentaire-dans- l%E2%80%99agenda-post-2015-%E2%80%93-quels-objectifs-pour-quels-effets
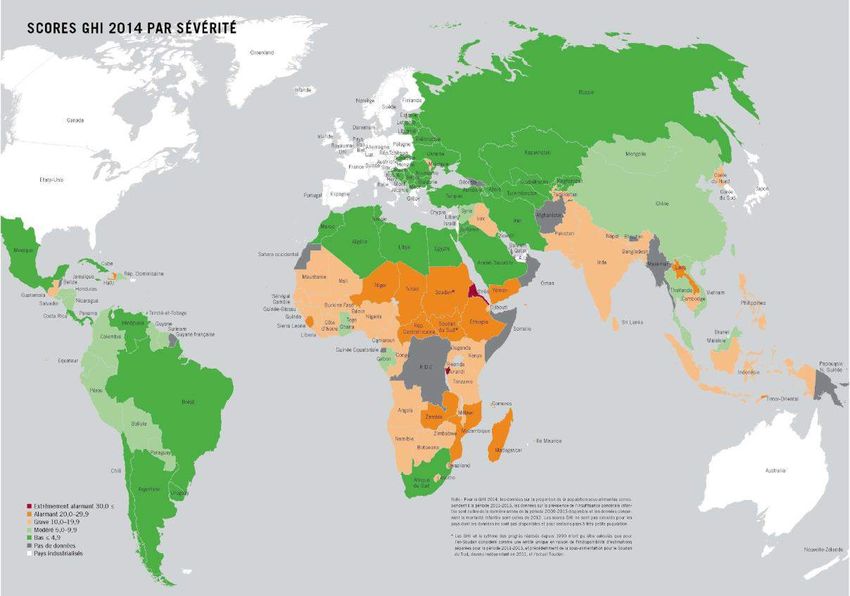
the goals, poverty reduction in vulnerable countries has not been accompanied by a proportional increase in the number of well-nourished individuals. This observation is underscored by a more qualitative analysis of the extent of the food deficit (Figure 4). This indicator bears witness to the severity of malnutrition. Both the level of and trend in this indicator follow those of the proportion of malnourished individuals in the four categories of country. The average minimum daily intake of calories is Figure 4 : Depth of the food deficit (kilocalories per person per day) estimated at 1,800 kilocalories (source: FAO), and so the per capita caloric deficit in 2012 was the equivalent of 12% per LDC inhabitant and 5% per non-LDC developing country inhabitant. The need to distinguish between LDCs and landlocked countries can thus also be seen as important here. Source : World Bank (WDI) Target proposed by the OWG: 2.2 By 2030, end all forms of malnutrition, including achieving, by 2025, the internationally agreed targets on stunting and wasting in children under 5 years of age, and address the nutritional needs of adolescent girls, pregnant and lactating women and older persons The OWG also proposes further monitoring of the food issue by targeting specifically vulnerable groups, in particular children. Unsurprisingly, the LDCs are most affected by child malnutrition, whether this is measured by size or weight (cf. Figure 6 and Figure 5): its prevalence in LDCs is double that of non-LDC developing countries. A decline has been noted in all categories of country, apart from SIDS where child malnutrition has increased since 2000, and the average level of non-LDC developing countries has now been reached. This decline in malnutrition would at first sight seem to have been more rapid in LDCs but an analysis of progress in Logit qualifies this relative performance by revealing a slightly lower performance in these countries than in other DCs (if they had performed equally, LDCs would have seen their child malnutrition fall further).
Figure 6 : Malnutrition prevalence, height for age Figure 5 : Malnutrition prevalence, weight for age (% of children under 5) (% of children under 5) ΔLogit ΔLogit LDC 0,20 LDC 0,32 DC (LDC excluded) 0,34 DC (LDC excluded) 0,44 Source : World Bank (WDI) Source : World Bank (WDI) In its 2014 report on hunger in the world, the International Food Policy Research Institute (IFPRI) describes the situation as ‘alarming’ in 16 countries. Figure 7 below shows the IFPRI’s Global Hunger Index (GHI) map. Figure 7 : Global Hunger Index (GHI) - 2014 Source : IFPRI (2014)
The GHI8 is alarming in Central Africa, the Horn of Africa and some countries of southern Africa, as well as in Sierra Leone, Haiti and Laos. In his speech to the Ferdi-Ministry of Foreign Affairs seminar, Alain de Janvry (Senior Fellow at Ferdi) set out 11 points for overcoming food insecurity: redefine the problem of malnutrition; produce a national strategy for combatting malnutrition; invest more in agriculture; support small- scale agriculture; increase the purchasing power of the poor through income; provide protection from vulnerability to shocks; link humanitarian transfers to asset accumulation; manage the role of behaviour; redefine agro-industrial systems; make food a human right; and seek international coordination. TARGETS AND INDICATORS FOR AGRICULTURAL PRODUCTION Target proposed by the OWG: 2.3 By 2030, double the agricultural productivity and incomes of small-scale food producers, in particular women, indigenous peoples, family farmers, pastoralists and fishers, including through secure and equal access to land, other productive resources and inputs, knowledge, financial services, markets and opportunities for value addition and non-farm employment Cereal crop productivity is an Figure 8 : Cereal yield (kg per hectare) important aspect of food security, and there are significant differences between vulnerable countries and non-LDC developing countries in this regard. Yields in the latter are twice those of LDCs and landlocked countries and 50% higher than those of SIDS. Vulnerable countries do not seem to be benefiting from technical progress or improved productivity. UNCTAD’s 2013 report confirms this: ‘LDCs have Source : World Bank (WDI) been facing persistent constraints on agricultural growth, such as shrinking investment in research and development, missing and imperfect factor markets, and limited access to producer-risk mitigation tools, as well as poor infrastructure. This weakness is not counter-balanced by a greater availability of arable lands, as can be seen from Figure 9 below. 8 The GHI is a composite index produced on the basis of the mortality rate of children under the age of five, the proportion of children under five who are underweight and the proportion of undernourished people.
Target proposed by the OWG: 2.4 By 2030, ensure sustainable food production systems and implement resilient agricultural practices that increase productivity and production, that help maintain ecosystems, that strengthen capacity for adaptation to climate change, extreme weather, drought, flooding and other disasters and that progressively improve land and soil quality The availability of arable lands Figure 9 : Arable land (% of land area) is sluggish in DCs, with the exception of landlocked countries where it has been increasing since 2000, albeit from a lower level. Bearing in mind the increasing population, FAO estimates that the available arable land in DCs is likely to fall from 0.17 ha per head in 2010 to 0.14 ha per head by 2050 (FAO, 2012). FAO also notes that this decline is not necessarily a threat to food Source : World Bank (WDI) security if productivity can be improved to counter-balance it. Figure 8 above illustrates the concern that sufficient productivity gains may not be achieved in LDCs and landlocked countries. However, the FAO qualifies this Malthusian problem by considering that only one-quarter of the arable lands of Sub-Saharan Africa are currently being farmed, as opposed to more than 90% in South Asia.
SDG 3: Ensure healthy lives and promote well-being for all at all ages The OWG has grouped MDGs 4, 5 and 6 - namely the reduction of infant/child mortality, improvements in maternal health and the combatting of HIV and malaria - into just one ‘health’ goal. It proposes adding targets relating to universal health coverage and access to medication. Target proposed by the OWG: 3.1 By 2030, reduce the global maternal mortality ratio to less than 70 per 100,000 live births Target proposed by the OWG: 3.2 By 2030, end preventable deaths of newborns and children under 5 years of age, with all countries aiming to reduce neonatal mortality to at least as low as 12 per 1,000 live births and under-5 mortality to at least as low as 25 per 1,000 live births Boussichas & al. (2013) show that LDCs and landlocked countries are lagging significantly behind other DCs on issues of infant and child mortality, infant measles vaccinations, maternal mortality, birthing conditions and antenatal provision. These indicators have, however, shown a clear improvement over the 1990 to 2010 period.9 This does not mean that the LDCs outperformed other DCs with regard to infant and child mortality. However, their performance, measured in Logit, was comparable to other DCs for child mortality (0.46 for LDCs as opposed to 0.45 for other DCs) and slightly better for infant and child mortality (0.56 as opposed to 0.51). In 2012, 51% of deaths in LDCs were due to transmissible diseases or maternal, antenatal or nutritional problems, as opposed to 47% in landlocked countries, 26% in SIDS and only 19% in non- LDC developing countries.10 Target proposed by the OWG: 3.3 By 2030, end the epidemics of AIDS, tuberculosis, malaria and neglected tropical diseases, and combat hepatitis, water-borne diseases and other communicable diseases Whilst the MDGs were aimed at curbing the spread of HIV, malaria and other major diseases, the OWG focuses on their eradication. According to Michel Sidibé, Executive Director of UNAIDS, ‘It is possible to put an end to the AIDS epidemic’ provided the international community continues its efforts ‘to open for us a tiny window of five years during which we will need to build on the progress already made. The coming five years will determine the following 15.’ (UNAIDS, 2014) The prevalence of HIV and TB has fallen slightly since 2000, although LDCs and landlocked countries exhibit higher levels (Boussichas & al., 2013). A Logit analysis demonstrates that the LDCs were less successful than other DCs in reducing HIV prevalence during the 2000s. 9 The results obtained by weighting these averages by the population of the countries does not change these observations. 10 Source: World Bank - WDI
Progress in TB has been due partly to huge improvements in detection rates (see Figure 10 below) and partly due to a high success rate in its treatment, including in vulnerable countries (see also Boussichas & al. (2013) on this point). Figure 10 : Tuberculosis case detection rate (%, all forms) ΔLogit LDC 0,75 DC (LDC excluded) 0,66 Source : World Bank (WDI) Target proposed by the OWG: 3.8 Achieve universal health coverage, including financial risk protection, access to quality essential health care services, and access to safe, effective, quality, and affordable essential medicines and vaccines for all On 12 December 2012, the United Nations adopted a resolution urging governments to speed up the move towards universal access to high-quality and affordable health care services. This resolution is in line with a growing awareness of this need among the international community, something that was particularly emphasized in the WHO 2010 report on health in the world (OMS, 2010). According to WHO, ‘Every year 100 million people are pushed into poverty because they have to pay for health services directly.’11 Figure 11 shows that the proportion of medical costs that households have to bear has declined slightly since 2000 in DCs but that there has been a stagnation in LDCs since 2006 (at around 50%), thus increasing the gap between them and non-LDC developing countries (45% in 2011). SIDS are notable for having much lower levels (around 25%). By way of comparison, this level is also relatively low in high-income OECD countries, where it has stood at around 16% since 2000. 11 http://www.who.int/features/factfiles/universal_health_coverage/facts/en/
Figure 11 : Out-of-pocket health expenditure (% of total expenditure on health) ΔLogit LDC 0,24 DC (LDC excluded) 0,18 Source : World Bank (WDI) WHO estimates that: ‘Only eight of the world’s 49 poorest countries have any chance of financing a set of basic services with their own domestic resources by 2015.’ It recommends that: ‘Increased external support is vital. Global solidarity is needed to support the poorest countries. If high- income countries were to immediately keep their international commitments for official development assistance, the estimated shortfall in funds to reach the health-related Millennium Development Goals would be virtually eliminated.’12 Coverage of children’s health has improved in all four country categories, as can be seen from the increased rate of measles vaccinations since 1990 (see Boussichas & al., 2013) and the increased rate of diphtheria, tetanus and pertussis (DTP) vaccinations since 2000 (Figure 12 below). Figure 12 : Immunization, DPT (% of children ages 12-23 months) ΔLogit LDC 1,18 DC (LDC excluded) 0,43 Source : World Bank (WDI) Vaccination rates seem to be converging in the four country categories. An analysis of progress in Logit shows that the LDCs have outperformed other DCs in this regard, thus demonstrating an LDC 12 http://www.who.int/features/factfiles/universal_health_coverage/facts/en/
catch-up phenomenon. More than four in every five children are now vaccinated against DTP. By way of comparison, the rates achieved in LDCs in 2011 are in line with vaccination rates in France during the 1980s. Non-LDC developing countries have, however, seen their rates of DTP vaccination plateau since 2009. A study in The Lancet (The Lancet Commission on Investing in Health, 2013) notes that nearly all of the world’s countries could converge towards a comparable level of health by 2035. Development assistance for health must consequently be targeted at poor people in poor countries as a priority. The Lancet emphasizes that fiscal policies form a powerful and under-exploited tool for achieving this point of convergence in all countries. Finally, the post-2015 agenda must not overlook the fact that a population’s state of health is the result of many different factors and that the effects of promoting other goals must also therefore be considered in this regard. By way of example, another study published in The Lancet is also worth noting (Gakidou, Cowling, Lozano, & Murray, Increased educational attainment and its effect on child mortality in 175 countries between 1970 and 2009: a systematic analysis, 2010) as it estimates that just one additional year of education for women of childbearing age would result in a 9.5% reduction in infant mortality in the developing world.
SDG 4: Ensure inclusive and equitable quality education and promote life-long learning opportunities for all The goal of the MDGs was universal primary education and this goal is not far from being achieved. The OWG proposes expanding this goal with targets aimed at measuring the achievement of certain levels of knowledge and a better integration of marginalized groups into the education system. There is, however, little data available at the moment and the information needs to be improved in this regard. Target proposed by the OWG: 4.1 By 2030, ensure that all girls and boys complete free, equitable and quality primary and secondary education leading to relevant and effective learning outcomes With regard to accessing primary education, Boussichas & al. (2013) note a significant catch-up phenomenon among LDCs and landlocked countries, with the gap reducing between these groups and the DCs. Adjusted13 World Bank data confirms this (Figure 13 above). The Logit analysis also shows that LDCs are catching up with other developing countries. Figure 13 : Adjusted net enrollment rate, primary (% of primary school age children) ΔLogit LDC 1,42 DC (LDC excluded) 0,42 Source : World Bank (WDI) Boussichas & al. (2013) also show that ‘the trend in the proportion of school pupils completing primary school is comparable to that of the enrolment rate, thus demonstrating real progress in primary education in all categories of country, above all the most vulnerable’. 13 The net adjusted rate of primary schooling is the ratio of the number of children in the primary school age range who are actually attending primary or secondary school, divided by the total population of this age group. Unlike the non- adjusted rate, the adjusted rate takes into account children in a particular age range who, because of their academic capacity, are being taught with children of a higher age group.
Figure 14 below bears witness to the fact that there are fewer children not attending primary school. There has been remarkable progress in the LDCs. In non-LDC developing countries, the number of children not in school fell between 2002 and 2004, largely due to the Indian policy of guaranteeing a midday meal for every child in primary school (Jayaraman & Simroth, 2011). Figure 14 : Children out of school, primary Source : World Bank (WDI) The rate of primary school completion, however, remains proportionately lower in LDCs, although it has clearly improved since 1990 (Boussichas & al., 2013). Given the school drop-out rate that occurs on completion of primary school, the rate of secondary school enrolment remains significantly lower, particularly in LDCs and landlocked countries (Figure 15). A Logit analysis nonetheless shows that LDCs outperformed other DCs during the 2000s. Figure 15 : School enrollment, secondary (% net) ΔLogit LDC 0,85 DC (LDC excluded) 0,55 Source : World Bank (WDI)
Target proposed by the OWG: 4.5 By 2030, eliminate gender disparities in education & ensure equal access to all levels of education & vocational training for the vulnerable, including persons with disabilities, indigenous peoples & children in vulnerable situations According to Boussichas & al. (2013), gender inequalities in education are low in non-LDC developing countries and have declined significantly in the LDCs since 1990, both in primary (where parity has almost been achieved) and secondary (where the female/male ratio is now 85%) education. Moreover, the female/male ratio in higher education has risen from 36% to 57% in LDCs, demonstrating reduced inequality of access. The ratio has, in fact, reversed to the disadvantage of men in non-LDC developing countries (86% in 1990 as opposed to 127% in 2010). Target proposed by the OWG: 4.6 By 2030 ensure that all youth and at least [x] per cent of adults, both men and women, achieve literacy and numeracy Boussichas & al. (2013) also show that literacy rates among youth and adults have increased substantially since 1990 in all DC categories. This rate has now reached 89% in DCs and 77% in LDCs for young people, and 81% in DCs and 65% in LDCs for adults. A similar analysis can be made of the literacy rate among youth and adults, which shows a widespread improvement in all DCs, and a catch-up phenomenon in LLDCs (where the adult literacy rate increased by 41% over the 1990 to 2010 period) and LDCs (+31%). However, whilst LLDC rates are now nearing parity with other DCs, the LDCs still remain a long way behind. Rates in SIDS remain stable, at around 80%.
SDG 5: Achieve gender equality and empower all women and girls This goal takes up MDG 3 in its title whilst broadening its scope. The target for MDG 3 was to eliminate gender disparity in primary and secondary education, preferably by 2005, and in all levels of education no later than 2015’. The OWG now proposes considering a greater number of gender dimensions, such as violence against women, pay differentials, forced marriage and a number of discriminatory practices to which women are likely to be subjected (see annexed list on page 70). There is still little data available, particularly for developing countries. The main information relates to three indicators that were used to monitor MDG 3, namely the ratio of girls/boys in primary, secondary and higher education, the proportion of salaried women in the non-agricultural sector and the proportion of seats held by women in the national parliament (see Boussichas & al., 2013). Target proposed by the OWG: 5.1 End all forms of discrimination against all women and girls everywhere Target proposed by the OWG: 5.5 Ensure women’s full and effective participation and equal opportunities for leadership at all levels of decision-making in political, economic and public life Women hold a third of jobs in the non-agricultural sector in DCs (32% in LDCs, 37% in other DCs) whereas this figures is close to parity in the developed world (47%) (Boussichas & al., 2013). As the World Bank notes: ‘In most countries, women are less likely than men to participate in the labour market, that is, less likely to be employed or looking actively for a job.’14 This proportion has, however, been increasing since 1990. Nonetheless, across all sectors, the proportion of women holding a job15 is higher in vulnerable countries and developed countries than in non-LDC developing countries (Figure 16). The World Bank explains that ‘women’s participation rates tend to follow a U-shape with respect to countries’ level of development. Female participation in employment is high [...] in many low income countries where women are engaged in unpaid subsistence agriculture, although they are less involved in paid activities outside the household.’ Lower middle-income countries (not shown in Figure 16) exhibit the lowest rate of female participation in the labour market. 14 http://data.worldbank.org/news/women-less-likely-than-men-to-participate-in-labor-market 15 This includes unpaid employment.
Figure 16 : Labor force participation rate, male and female (% of male and female population ages 15-64), in 2012 Source : World Bank (WDI) Each year, the World Bank assesses the policies and institutions of countries eligible for the IDA (International Development Association – the concessional lending arm of the World Bank) using a composite measure based on 16 complementary indicators (Country Policy and Institutional Assessment – CPIA).16 One of these measures is the quality of a country’s gender equality policy (‘the extent to which the country has installed institutions and programs to enforce laws and policies that promote equal access for men and women in education, health, the economy, and protection under law’ – source: World Bank). In 2012, the LDCs obtained an average score of 3.2, less than that of both lower and upper MICs (3.5), thus demonstrating that LDCs are lagging behind with regard to gender policies. This result is, however, qualified by information from the World Economic Forum which each year publishes a report on the gender gap. The 2013 edition classifies 136 countries according to their capacity to close the gender gap in four sectors: health, education, economic opportunities and political participation (World Economic Forum, 2013). The composite index that assesses gender inequality in economic opportunities takes into account differences in salaries and income, seniority of position in companies and government departments (excluding parliament and ministries) and participation in the labour market. Political participation is measured according to the level of women’s representation in parliament and in ministerial office. Figure 17 compares the average level of these two indices for LDCs, MICs and OECD high-income countries. 16 The CPIA measures 16 broad development indicators relating to four areas: i) economic management; ii) structural reform; iii) policies on social integration and equality; and iv) public sector management and institutions. Countries are scored on a scale of 1 (low) to 6 (high) for each indicator.
You can also read