Status of LED-Lighting world market in 2017 - European ...
←
→
Page content transcription
If your browser does not render page correctly, please read the page content below
Status of LED-Lighting world
market in 2017

                   ZISSIS, Georges
                   BERTOLDI, Paolo

                   2018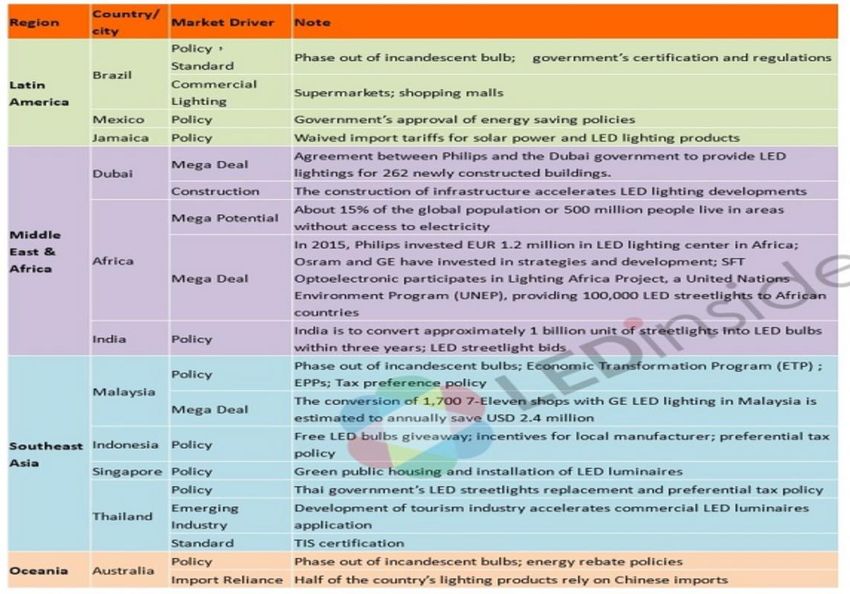
This publication is a Technical report by the Joint Research Centre (JRC), the European Commission’s science
and knowledge service. It aims to provide evidence-based scientific support to the European policymaking
process. The scientific output expressed does not imply a policy position of the European Commission. Neither
the European Commission nor any person acting on behalf of the Commission is responsible for the use that
might be made of this publication.

Contact information
Name: Paolo Bertoldi
Address: Joint Research Centre, Via Enrico Fermi 2749, TP 450, 21027 Ispra (VA), Italy
Email: paolo.bertoldi@ec.europa.eu
Tel.: +39 0332 78 9299

JRC Science Hub
https://ec.europa.eu/jrc

JRCxxxxx

Ispra, European Commission, 2018

© European Union, 2018

The reuse policy of the European Commission is implemented by Commission Decision 2011/833/EU of 12
December 2011 on the reuse of Commission documents (OJ L 330, 14.12.2011, p. 39). Reuse is authorised,
provided the source of the document is acknowledged and its original meaning or message is not distorted. The
European Commission shall not be liable for any consequence stemming from the reuse. For any use or
reproduction of photos or other material that is not owned by the EU, permission must be sought directly from
the copyright holders.

All content © European Union, 2018, except: cover page, ©Silvano Rebai, # 85636606. Source:
stock.adobe.com

How to cite this report: Author(s), Title, Ispra, European Commission, 2018, JRCXXXXXX
Contents
Abstract ............................................................................................................... 1
1 Introduction ...................................................................................................... 2
2 Technology Evolutions ........................................................................................ 5
3 Evolution of the World Lighting Market and LED penetration .................................... 8
4 LED Chain value evolution ................................................................................ 14
   4.1 Upstream ................................................................................................. 14
   4.2 Midstream ................................................................................................ 19
   4.3 Downstream ............................................................................................. 20
5 LED End-use Domains ...................................................................................... 22
6 Regional LED market updates ............................................................................ 28
   6.1 Europe ..................................................................................................... 29
       6.1.1 Russia .............................................................................................. 31
   6.2 North America ........................................................................................... 32
   6.3 Indian subcontinent ................................................................................... 36
   6.4 Asia Pacific................................................................................................ 39
       6.4.1 Japan ............................................................................................... 39
       6.4.2 China ............................................................................................... 40
       6.4.3 Taiwan ............................................................................................. 42
       6.4.4 Korea ............................................................................................... 43
       6.4.5 Australia ........................................................................................... 44
   6.5 Rest of the World ....................................................................................... 45
7 Industrial landscape update .............................................................................. 47
8 Future developments and perspectives ............................................................... 59
9 Conclusions .................................................................................................... 62
References ......................................................................................................... 63
List of abbreviations and definitions ....................................................................... 69
List of figures ...................................................................................................... 72
List of tables ....................................................................................................... 75
Annex – Definitions .............................................................................................. 76

                                                            i
Abstract
Lighting is responsible for about 15% of global electricity consumption. LEDs are a new
technologies introduced in the market over the last 10 years. LED offers a very high
efficiency compared to traditional lamps and higher lighting quality compared to
fluorescent lighting in the non-residential sector. Through technology development and
energy efficiency policies the LED lighting is fast penetrating the lighting market, offering
energy and cost savings and higher lighting quality. This report offers a snapshot of the
latest developments in term of market and technologies for solid state lighting and in
particular for LED in the different markets. It follows a previous study by the JRC carried
out in 2011.

                                             1
1 Introduction
Lighting is undergoing a rapid transformation as Light Emitting Diodes (LED) become the
number one source of light. The LED market evolution is continuing with a steep decline
in cost per unit and a high energy-efficiency improvement.
The global LED lighting market is growing with maturing light culture. The market is
experiencing now a shift from conventional lighting to LED lighting with easy availability
of LEDs in light bulb format, thereby posing a tremendous growth potential for the
market. Year 2014 brought LED lighting mainstream as awareness at all levels is very
high, and LED products are available widely and at different price levels. The major
trends featuring the market includes shifting distribution channel, advancement in LED
technology, demand for interior automobile lighting, and increasing green construction.
Customers of any type and from any country need to understand the offer and have the
confidence in the performance of new technologies. They also need to understand the
benefits of purchasing or specifying products referring to green technologies. As Lauren
Williamson underlines, “many businesses and residents are taking sustainability
seriously. Brands are realigning their brand values to compliment sustainable activities
that can be implemented into their business model. Sustainable motives are more
conscious among consumers, however businesses that are able to compliment these with
pricing and cost motivators will be in a strong position to ride the commercial growth of
sustainable products” [WIL-16]. A 2011 survey conducted by McKinsey on clean
technologies answering the question “Which of the following technologies do you expect
will be commercially viable by 2020?” indicated that 72% of the 4025-people considered
LED lighting as the most probable one (Figure I.1) [MCK-11].

Figure I.1 – Clean Technology survey, answer to the question “Which of the following technologies
                  do you expect will be commercially viable by 2020?” [MCK-11]

In parallel, Global Warming has created a huge need for conserving energy, especially for
lighting which represents roughly 19% of world’s electricity annual consumption. The
Paris Agreement, which was signed by more than 190 countries to commit to limit the
temperature increase to below 2° in order to combat global warming, constitutes a frame
for development of policies supporting energy efficient technologies.
The key factors driving the growth of the LED lighting market includes the rise in global
LED penetration, falling prices of LED lighting, phasing out of conventional lighting, rising
industrial demand for power efficient lighting and favourable government policies. More

                                               2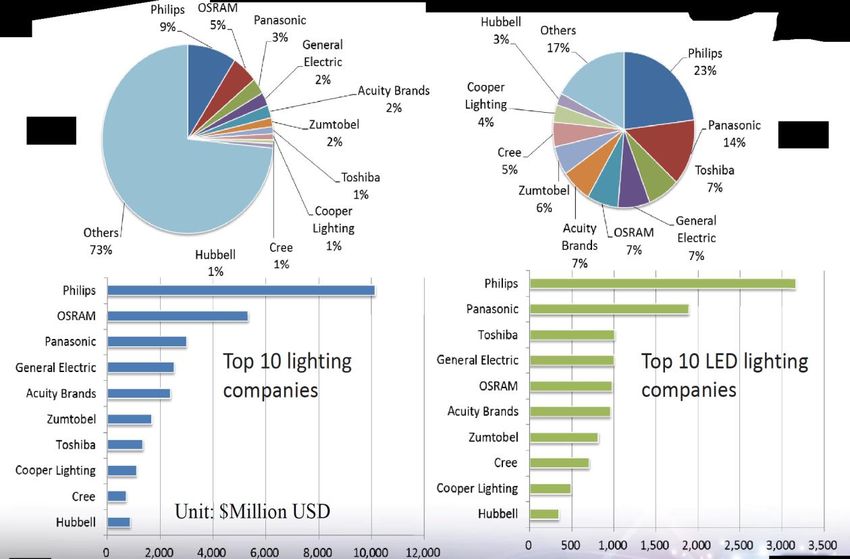
especially, governments around the world are encouraging the use of LEDs in public and
private spaces. Thus today, the main drivers for LED lighting came largely on the back of
government decisions, such as bans of inefficient lighting by the European Union, the
United States, and Canada, and the Chinese government’s decision to adopt LED ahead
of its planned ban. Government initiatives, however, will play a decreasing role during
the next years. Then it expected that the growth will be supported by private initiatives
such as the rebates offered by utilities in the United States.
As more and more countries are getting close to phasing out conventional bulbs, LEDs
are continuing their march to the top of the market. In fact, LED technology is
transforming the lighting industry underpinning rapid market penetration. Declining costs
and efficiency increases are leading to increased adoption of LEDs for general illumination
applications previously dominated by traditional lighting technologies. Market size
estimates vary but all point to significant growth in LED share.
LED lights are already at the forefront of the trend and it has created a billion-dollar
industry that will continue to be driven by social and market forces. Only LED lighting can
be used as a comprehensive replacement for legacy lighting: it is available in both cold
and warm colour, temperature varieties, is colour-tuneable and can be dimmed.
Additionally, solid-state lighting can be applied in any field of lighting. By contrast, other
lighting technologies like HID, CFL and even OLED, have more restrictive applications.
Thus, the LED replacement lamp is the winner in the medium term, as it progressively
replaces traditional technologies around the world. To this end, LED replacement lamps
are already at a price point that successfully challenge traditional technologies and will
take over that market completely by 2020. As shown in Figure I.2, world market analysts
consider that LED lighting entered to the maturity era since 2015-16.

           Figure I.2 – LED lighting entered Phase 3 (maturity) since 2016 [ONS-13]

However, in 2015, LED penetration rate is still low. According to the IHS Lighting
Intelligence Service, the LED lamp penetration rate was below 10% [HIS-16] and Philip
Smallwood (Strategies Unlimited) said “Of the 44 billion sockets used in the world,
penetration of LED products in 2015, just for lamps, is about 5%, so very low” [WRI-
16b]. As LED lamp price reaches parity with CFL, LED penetration expected to increase
quickly, but price erosion is everywhere, it is no longer easy for LED manufacturers to
make money nowadays; however, since the market is still growing, the companies that
survive will eventually have a chance to raise profitability.
In an attempt to differentiate their products and increase margins, a number of
“premium” LED products have been developed, offering more than just illumination. They

                                              3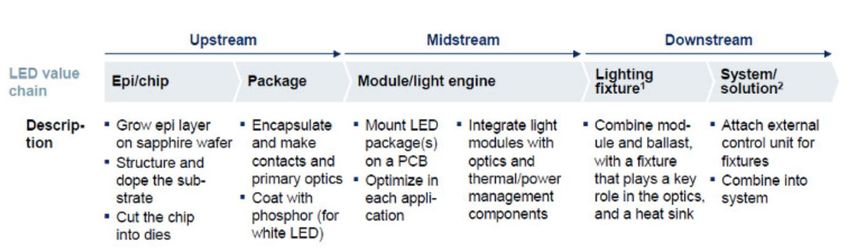
include smart lighting controlled through connected devices, data transmission though
LED frequency modulation, and human-centric lighting (HCL)1.
The shift from luminous efficacy to light quality is a mandatory trend in the LED industry;
in the future competitive lighting products will no doubt shift from low standard level of
luminous efficacy demands to developing high quality lighting products that are beneficial
to health. Luminous efficacy (lm/W) is only a numerical measurement of lumen output,
but light quality emphasizes the quality of the light and the impact of lighting on human
health [LED-16].
Standardisation is a key issue that will need to be solved soon. The success of Zhaga
products might help with compatibility of products from different manufacturers. New
legal requirements and stronger enforcement of laws and standards already in place are
also expected in key regions. Lighting Europe, the industry association, periodically calls
for more control on noncompliant LED imports from Asia [F&S-15].

1
    See JRC Scientific and Policy Reports "Accelerating the Deployment of Solid State Lighting (SSL) in Europe",
      2012, A. de Almeida, G. Zissis, M. Quicheron, P. Bertoldi

                                                        4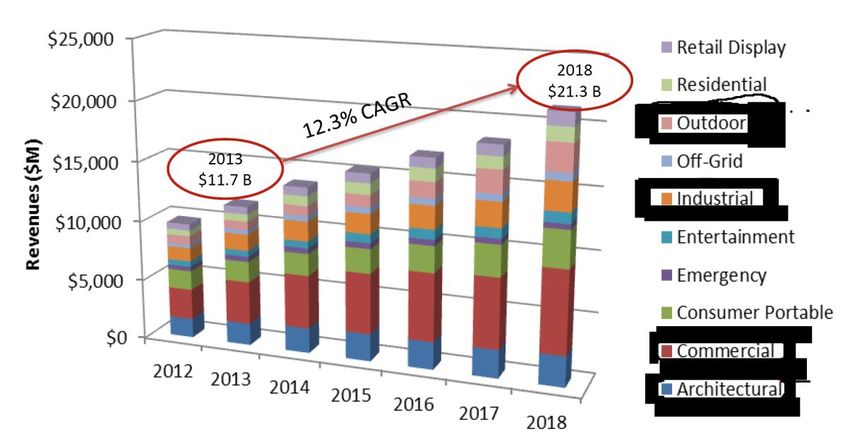
2 Technology Evolutions
In 2017, Cree has announced the XLamp XP-G3 Royal Blue LED that the company claims
to be the highest performing royal blue LED on the market. Cree said that the new LED
delivers wall plug efficiency as high as 81% although the conditions for that
performance level were not specified [WRI-17].
Concerning luminous efficacy evolution for phosphor-converted white LEDs (pc-LED),
the main limit is phosphor conversion efficacy. Today, for a 3000K-CCT, 80-CRI phosphor
the theoretical limit for a broadband phosphor is around 265 lm/W, and the theoretical
limit for a mix of narrower 30-nm-wide phosphor in red and 70-nm-wide phosphor in
green is 310 lm/W. Narrowband phosphor offers a potential 20% performance
improvement and has led to a focus in that area for LED manufacturers. It is expected
that for mid-power LEDs, efficacy will peak at 240 lm/W in 2017, and that high-power
efficacy will peak at 180 lm/W in 2017 - for 4000K-CCT LEDs in both cases. Under-
driving either type of LED could deliver a substantial gain with, say, a high-power LED
achieving the 230 lm/W level. The US Department of Energy's LED performance roadmap
is largely in agreement with these numbers [WRI-15].
A recent innovation in the domain of LED-component (upstream domain) is the Chip
Scale Package (CSP) LED. As the trend towards smaller, lighter and thinner luminaires
continues to gain momentum, LED manufacturers have responded by shrinking the size
of their LED packaging. One result of this trend is the growing popularity of CSP
technology. CSP is done at the wafer-level, eliminating the separate step of having
manufactured LEDs go through a packaging line (packaging can sometimes be 60% of
the total cost). CSP technology eliminates the traditional sub-mount to directly attach the
LED die to the PCB, allowing for overall system cost reductions. As fully functional LED
packages that are equal to or slightly larger than the size of a die, CSPs are increasingly
being implemented in lighting designs. Figure II.1, shows a CSP LED compared to a
classic packaged-LED and a COB-LED.

                Figure II.1 – (a) CSP LED (b) packaged LED and (c) COB-LED

The CSP LEDs have a wider beam angle, more design flexibility, and it can be overdriven.
However, CSP LEDs are not as efficient as high-power LEDs and low yields result in much
higher prices, currently [SMA-16].
Another regain of interest concerns Nanowire LEDs. Nanowire LEDs were first reported
by Harvard University in 2000 and the first patent filled in 2002 by Postech Foundation
for an axial PN junction architecture. Since then, companies have shown growing interest
in nanowire-based LED for improved light extraction and thermal conduction. Nanowires
for LEDs are made up usually of an inner core of gallium nitride (GaN) and a layer of
indium-gallium-nitride (InGaN). Nanowires are very small - about 2 µm high and 10-500
nm in diameter. Figure II.2, shows the LED-nanowire structure

                                            5
Figure II.2 - LED-nanowire structure

Today, nanowire LEDs are still in their infancy, so it is not yet clear whether they can
displace the traditional planar LED through superior performance, lower cost, or a
combination of the two. Evaluating the potential for superior performance forms part of
the activities of European projects involving one of the world’s leading chipmakers,
Osram, while French start-up Aledia is pursuing the opportunity for driving down device
costs.
From 2003 to 2014, 246 patent families were published on nanowires as active layers for
LED applications. Publications increase almost constantly over the past ten years.
Nanowire LEDs regain interest recently as an alternative approach to conventional
phosphor based LEDs, a full-colour LED array consisting of red, green and blue (RGB)
InGaN based nanowire LEDs monolithically integrated on a micro-scale level has been
proposed and fabricated [LPR-16].
In the downstream domain, we should mention the spectacular success of LED filament
lamps. Featuring a classic heritage design, classic filament LED Lamps (Figure II.3)
combine the familiar shapes of classic incandescent bulbs with the benefits of the long-
lasting LED technology. They deliver beautiful, decorative warm-white light while saving
around 90% on energy costs compared with traditional light bulbs. The designs used
several LED filament light producers arranged in the same or similar pattern to that
found in the wires of a standard incandescent bulb.

                             Figure II.3 – LED Filament lamps

Historically, the first LED filament-type design light bulb was produced by Ushio Lighting
(Japan) in 2008 intended to mimic the appearance of a standard light bulb [HAK-09]. By
the mid-2010s, LED filaments were being introduced into the market by several

                                            6
manufacturers. Since 2013, LED lighting manufacturers are actively promoting filament
LED lamps, and the revenue and sales of
this particular product has markedly risen. In 2015, LED filament lamps entered a fast
growth phase [LAED-16a].
The LED “Filament” typically consists of many (sometimes hundreds) of tiny unpackaged
LED chips mounted on a transparent substrate instead of metal substrate. This is
commonly referred to as Chip-On-Glass (COG). These transparent substrates are made
of glass or sapphire materials. This transparency allows the emitted light to disperse
evenly and uniformly without any interference. This enhances the flux geometry of the
lamp. In the absence of a heat sink, LED filament bulbs may use a high thermal
conductivity gas inside the bulb to aid heat dissipation. The LED filament is then
encapsulated in a resin made up of a silicone and phosphor mixture that performs the
usual transformation of the LED chips’ blue light into white light. This innovative design
allows the use both of both blue LEDs as well as red LEDs to modulate the correlated
colour temperature (CCT). Most manufacturers rely solely on the phosphor to set the
CCT. This added degree of control allows the lamp maker to provide a more accurate
level of CCT, and flexibility during the manufacturing process. The downside is that the
CRI performance will not be as consistent when using the combination of both blue LED
and red LED chips [LIN-15]. The large number of LEDs (typically 28 per filament)
simplifies the power supply compared to traditional LEDs. Two filaments with a mix of red
and blue is thus close to 110 V, or four close to 220 V to 240 V. Furthermore, modern
LED filaments have a great potential as they are more efficient than many conventional
LED lamps, and the new lamps provide better flux geometry. Degradation of silicone
binder, and leakage of blue light are design issues in LED filament lights and lifespan of
LED emitters is reduced by high operating temperatures.
The LED filament bulb became popular in the lighting market mainly because major
buyers and consumers in decorative lighting, art lamps, chandeliers and classical
luminaires were gradually replacing conventional light sources, including filament bulbs
and halogen light sources with LED lights. Previously, traditional LED bulbs failed to meet
the aesthetic demands of traditional luminaire manufacturers, which paved the way to
LED filaments emergence on the market [LED-16a].

                                            7
3 Evolution of the World Lighting Market and LED
penetration
Lighting is large and growing addressable market. Traditionally, the global lighting
market can be broken down into the following segments: general lighting, automotive
lighting and backlighting. General lighting splits into service, systems (that includes
electronics), luminaires and lamps. Figure III.1 shows a snapshot of the estimated global
lighting market in 2014 that is used as basis for forecasting the future]. At 2014, the
total revenue of the Global Lighting market is estimated in the order of US$ 122 million
[PET-16].
Figure III.1 – Addressable Global Lighting market snapshot at 2014 [PET-16]
In the backlighting segment, which is out of the scope of this report, revenue growth is
expected to stagnate due to the increased use of organic light emitting diode (OLED)
technologies [STA-17]. The market share of OLEDs in smartphone and television displays
is set to experience accelerated growth at the expense of LED and liquid crystal displays.
In fact, LED backlight market demands fell short of expectations, which caused sliding
ASP of LED chips and LED package. This trend has been markedly observed during
second half of 2015, when LED chip and package prices sharply plunged to the point that
some LED chip and package spec prices are now close to material costs [LED-15b].
Based on the McKinsey’s “2020 Lighting Market Model” [MCK-12], Figure III.2, shows the
projected evolution of the global lighting market for the above-mentioned sectors.
Conventional luminaires and lamps shares are rapidly decreasing thus LED-based
technologies become dominant.
8Figure III.2 - Projection of worldwide lighting marker revenues per sector based on McKinsey’s
2020 Lighting Market Model [PET-16]
Traditionally, the lighting usually industry includes 3 branches: lamps, luminaires and
lighting controls. Figure III.3 shows historical and Forecast market sizes by branch.
Figure III.3 - Historical and forecast market size by traditional industrial branch [F&S-15]
Fixtures (luminaires)2 are always dominant. Projection shows that lamp’s segment would
saturate from 2017-18. This can be explained primarily by the fact that LED technology
has longer lifespan that legacy technologies, this implies that re-lamping frequency is
expected to reduce significantly in the next years. Figure III.4 shows, following
Strategies Unlimited 2016 analysis, the luminaire branch units’ shipments evolution for
different technologies including LED-based products [SMA-16]. If fact, LED luminaire
2 In this report, the terms “luminaire” and “fixture” are considered as equivalent
9market is forecasted to grow with ac CAGR 12% to US$ 21,3 billion in 2018 [SMA-14]. In
parallel, average selling prices (ASP) are continuing to drop through this time period:
High-bay luminaires are expected to drop in price about 12% from US$ 400 to US$ 350.
Troffers will decrease about 33% from $120 to $80 [WRI-16b].
Figure III.4 – Evolution of luminaires units shipped by technology [SMA-16]
Control gear (ballast) is the fastest growing branch. The control possibilities that LED
offers will give rise to increasingly complex control gear giving comfort, security and
flexibility to lighting that has thus far only been seen in niche markets. In fact, the
flexibility of LED lighting will provide demand for controls, both in the form of LED drivers
and lighting management systems, offering the full spectrum of personalisation. For sure,
control gear will play a pivotal role with the rise of LED due to the long-term increase on
functionality [F&S-15].
Strategies Unlimited predicts that the overall market for lamps peaking around 2018 to
2019 at around US$ 21 billion, growing from about US$ 16,8 billion in 2014 [WRI-16b].
Smallwood predicts that for lamps the market will decrease beginning around 2018. But
the decrease will impact legacy lamps more so than LED-based products. Subsequent to
the peak, legacy lamps will have a -13% CAGR through 2022. But LED lamps will be
growing at 8% over that same period. So there still will be opportunity in the LED lamps
space [WRI-16b].
Concerning LED-based light sources, Philip Smallwood from Strategies Unlimited tried to
give some estimation on the evulsion of the LED-Lighting downstream market. Figure
III.5a shows that the number of the worldwide installed lamps would not significantly
change for the next few years. However, the LED-based lamps penetration will increase
very rapidly in replacement of legacy technologies [SMA-16]. However, the lamp branch
revenue is expected to shrink as shown in Figure III.5b [SMA-16]
10Figure III.5 – LED-lamps versus legacy technologies market size (a) in number of pieces and (b)
in revenue [SMA-16]
Both IHS and Strategies Unlimited estimate that by the end of 2015, LED lamps
comprised 6% of the global installed lamp base [SMA-16] [IHS-15]. IHS forecasts that
penetration of the global installed base will remain below 40% through 2022 [IHS-15].
LEDs made up less than 4% light of total lumen-hours light in 2014. By 2023 LED share
is expected to reach 84% [GMI-17] and by 2030 will goes up to 88%, accounting for the
majority of lighting installations [BGL-16].
As explained above, LED technology share for General Lighting is experiencing important
growth across several application sectors and will continue to grow throughout the next
decade but year-over-year (YoY) growth rate is expected to shrink. Frost & Sullivan
valuated the 2014 LED market revenue at US$ 32,3 billion [F&S-15]. Figure III.6, shows
both historical and forecasted LED for lighting revenue and YoY growth rate [F&S-15].
Even if revenue is increasing, YoY growth rate is decreasing and tend to stabilization at
around 13% by 2020.
Figure III.6 - historical and forecasted LED for lighting revenue and year-by-year growth rate
evolution [F&S-15]
Years 2013 and 2014 have been the breakthrough years for LED in the professional
market, in Europe, North America and China. More especially, 2014 has seen significant
inroads for LED in the large residential market, which will help LED to increase the
penetration of total lighting sales. In November 2014, LED Inside [LED-14] has projected
11that LED lighting market penetration will reach 31% of the global lighting market in
2015, when Frost & Sullivan, evaluated one year later that LED lighting represents
roughly 40% of the market in value for the same year [F&S-15]; reality is beyond
predictions. Figure III.7 and associated table show the evolution of market sizes for
legacy and LED technologies [JAU-12] [F&S-15].
Figure III.7 - Evolution of market sizes for legacy and LED technologies [JAU-12]; (b) historic and
forecasted LED market penetration [STA-17]
Even if for the next couple of years, the bulk of the projections made by different
analysts seems to be coherent, it should be underlined that the mid- and long-term
forecasts may be diverging. Table III. T1 show an example [PET-16]: the projected
penetration rate for 2022 varies from 67% to 80%. Nonetheless, according to Frost &
Sullivan’s 2017 update the LED lighting market could expand to an US$ 80 billion market
by 2020 and the penetration rate will attain 97% by 2025 with India, Asia-Pacific, Latin
America, and Africa set to record the highest growth rates [F&S-17].
Table III.T1 - Global Market Share of LED Lighting Measured as a Percent of Total Lighting
Revenue [PET-16]
Following Evergreen, the global LED lighting market is expected to be valued at US$
92,40 billion by 2022 and is expected to witness a shipment of 14,01 billion units at the
same year at a CAGR of 13,66% and 21,23%, respectively, between 2016 and 2022
[EVE-17].
Navigant Research estimates that unit shipments of LED lamps worldwide will grow from
68 million pieces in 2013 to 1,28 billion by 2021 [NAV-17]. Although shipments of LED
products will expand at a compound annual growth rate (CAGR) of 44.3% through 2021,
they will not be sufficient to compensate for the overall decline in commercial lighting
12revenue as the industry moves toward much more long-lasting lamps, says the report.
Lamp and luminaire revenue will both grow for the next few years, before beginning an
inexorable decline in 201. More precisely, global lamp revenue is expected to decline
from US$ 23,0 billion in 2017 to US$ 21.5 billion in 2026 [NAV-17]. Furthermore, there
are certain factors hindering the growth of the market like high initial set up cost,
complicated distributed channel, and slow reaction by bulk market consumers [KOA-16].
134 LED Chain value evolution
The LED Lighting value chain is traditionally divided in Upstream, Midstream and
Downstream as shown in Figure IV.1.
Figure IV.1 – LED lighting value chain
4.1 Upstream
Figure IV.2 shows the world’s LED chip production capacity. China is the world leader for
LED components production.
Figure IV.2 - Worldwide LED chip production capacity in 4” wafer equivalent (data: LEDInside and
Semi) [LOU-16]
In 2011, many Chinese manufacturers began to produce LEDs, and the LED TV industry
failed to meet expectations. Figure IV.3, shows the Chinese packaged-LED market
relative value forecast split among end-use domains.
14Figure IV.3 - Chinese packaged-LED market relative value forecast split among end-use domains
[ENE-14a]
(data HIS)
Concerning LED-components, due to the oversupply situation in the LED industry
(estimated to 16-19% [LOU-16]), LEDs ASP prices plunged. Thus, LED component costs
are forecasted to decline with technological advances in manufacturing, as much as 70%
by 2020 according to a US DOE estimate [BGL-16]. LEDinside estimated the global HB-
LED market value in 2015 will increase at an incremental rate of 2% to US$ 14,52 billion.
Even though lighting demands spurred LED usage volume growth, ironically the
increasingly energy efficient LEDs are reducing usage volume. Additionally, LEDs still are
under immense pressure to further lower prices. Based on these observations, LEDinside
projects in the next five years the LED industry Compound Annual Growth Rate (CAGR) is
unlikely to reach more than 10% in the future.
Philip Smallwood (Strategies Unlimited) arrive at the same conclusions for packaged
LED industry: The revenue will grow from US$ 15 565 million (2014) with a CAGR of 7%
to US$ 21,6 billion in 2017 and US$ 22,1 billion a year later (2018) [SMA-16] [WRI-15b].
Figure IV.4 shows the evolution of the market size. It is clear that “historical domains”
(Displays, Mobile applications and Signage) are stagnating. Growth today relies mainly
on General Lighting: the revenue will pass from UD$ 5 263 billion in 2014 to US$ 9 109
in 2019 (12% CAGR in the reference period) [SMA-16]. Figure IV.5 shows the historical
and forecasted packaged LED revenue split among the various general lighting domains
(replacement lamps are considered as separate domain). In the reference period
replacement lamps is the winner [SMA-16].
15Figure IV.4 - Global Revenues for Packaged LEDs 2014 – 2019 according Strategies Unlimited
[SMA-16]
Figure IV.5 – General Lighting Revenues for Packaged LEDs by application domain [SMA-16]
Following Smallwood, COB-LEDs sector is still growing and a CAGR of 15% is expected
within the 2014-20 period (Figure IV.6) [SMA-16].
16Figure IV.6 – Evolution of Revenues for COB LEDs in the period 2014 to 2020 [SMA-16]
Since 2015, backlighting market stagnation implied that many manufacturers have
incurred losses. Even though manufacturers in the LED industry are being pressured to
lower prices in the short term, in the long run there will be limited room for further LED
price cuts. This can be explained by the growing number of manufacturers withdrawing
from the market in the near future, as LED prices is close to manufacturing costs and
reduce companies’ profitability [LED-15b].
Since few years, China has become the world’s largest LED lighting manufacturing.
However, over the last decade, the Chinese government largely supported the local LED
industry through massive financial subsidies, incentives, and resources to improve
domestic LED companies manufacturing capacity. That way, national and regional
governments in China have invested heavily in promoting companies at each level of the
industry, from epitaxy to luminaire assembly. However, local manufacturers are still very
dependent on international manufacturers for certain upstream MOCVD equipment and
materials. Hence, future Chinese policies will encourage innovation, and focus on
upstream raw materials, for example wide bandgap semiconductor development, or
smart lighting applications following the emergence of the Internet of Things (IoT) [LED-
15b]. Furthermore, due to currency fluctuations in 2015, end market demands in
different countries have been much lower than expected. Many SMEs in the LED industry
are facing financial loss pressures, with plenty sinking into negative cash flow cycles.
These developments have ousted smaller manufacturers, due to their broken finances.
[LED-15b].
As a first answer, Chinese LED companies listed on the stock exchange have been
acquiring international manufacturers through issuing shares on the market. That way,
some Chinese manufacturers are targeting major international LED players’ patents and
lighting brands, in hopes of strengthening their patent portfolio and overseas distribution
channels. Additionally, more Chinese LED manufacturers are also transforming their
business models. Some LED manufacturers aiming to leave behind hotly contended red
sea markets are entering other market sectors through mergers and acquisitions [LED-
15b].
In any LED product, the raw material costs around 37% of the total product cost with
value addition accounting to 23,2%. While the cost of raw material in each stage see a
marginal rise, the acquisition cost of the component by a value chain element from its
upstream element almost doubles [F&S-16].
17Concerning substrates, Philips, Osram Opto, and Samsung are all actively exploring GaN
on silicon (GaN-on-Si) technology and Soraa stil works on GaN on GaN substrate [WGR-
14]. GaN-on-Si offers a baseline wafer cost advantage of about UD$ 0,002/mm 2
However, the performance of GaN-on-Si has, over the last four to five years, stayed 10%
behind GaN-on-sapphire [WRI-15]. Thus, bulk production of LED dies continues to be on
6” sapphire substrates. Epistar is working on 200mm sapphire wafer technology.
Producing LEDs on silicon is no longer considered as attractive as it was a few years ago,
and modest profit margins, falling LED prices and other factors mean that larger players
from semiconductor-related industries are now less likely to enter the market. While no
big player is expected to enter the market in 2016, there is a small, but unlikely, chance
that a new company with, a genuinely game-changing technology could enter the market
[HIS-16]. Nano-wire (either GaN or ZnO) LED technology may be attractive but the
technology used by Aledia (France) and GLO AB (Sweden) is still in very early stage.
Figure IV.7, illustrates the 2015 estimate variable cost of LED chip manufacturing for
some of the above sited substrate technologies.
Figure IV.7 - illustrates the 2015 estimate variable cost of LED chip manufacturing (6” SiC is not
yet available and 8” Si is in R&D level) [LOU-16]
The segmentation of the packaged LED market also remains largely consistent with prior
years. The 0,5 W dividing line between the mid- and high-power segments remains. But
that line may create ambiguity in some of the data where applications are dissected
relative to the types of LEDs used. Many LEDs that look like traditional mid-power
devices in plastic packages with no secondary optics can be driven at levels of 1 W and
higher today.
184.2 Midstream
In 2016, Ph. Smallwood estimated the evolution of the two market segments as shown in
Figure IV.8 [SMA-16].
Figure IV.8 – Evolution of market segments for LED-modules and LED-engines [SMA-16]
Following 2016’s Strategies Unlimited analysis, the Figure IV.9a and b show the market
size evolution for LED-modules and LED-engines for use in LED-lamps and in LED-
Luminaires [SMA-16]. It is clear that the luminaire segment is dominant.
Figure IV.9 – Evolution of market segments for LED-modules and LED-engines for (a) lamps and
(b) luminaires [SMA-16]
Yole’s analysts in collaboration with PISEO estimated that the open LED lighting
module market including flexible LED strips will grow from approximately US$ 3 billion in
2015 and to more than US $10 billion by 2020. Yole’s market metrics take into account
mid- and high-power modules, COB and flexible strips sold on the open market [YOL-15]
Pars Mukish said ‘The main benefits to lighting integrators of using LED modules cover
faster product development cycles, less complexity for integration as well as the
19management of high level parameters, which is directly handled by the LED module
supplier” [YOL-15]. Furthermore, LED modules need additional components to give the
light effect desired, such as clamp holders and optics. Complete standardization of LED
sub-systems is still difficult as integration of LED modules must follow specific rules in
areas such as design and electrical insulation. In this context, the Zhaga consortium3 has
been created to develop guidelines for interchangeability of LED light sources made by
different manufacturers. Standardization will further reduce development and
maintenance but will also limit the possibility of differentiation between suppliers.
Most LED lighting module suppliers are packaged LED manufacturers that have used
vertical integration to capture more value within the supply chain. These players have a
strong competitive advantage in terms of mastering the LED binning strategy. However,
some other types of players are also involved in this business. They mainly want to
diversify their activities and/or define new strategies to support the development of their
primary business. They are: LED luminaire, LED driver, optic, connector, heatsink, etc.
manufacturers.
4.3 Downstream
As has been underlined in the previous chapter, according Strategies Unlimited the full
marker size (in number of shipments) for lamps and luminaires will either stagnate or will
grow very slowly from 2017-18. However, The LED-lamp revenue will increase from
US$ 4,8 billion (2013) to 12,2 billion in 2018 corresponding to 21% CAGR [SMA-14].
Figure IV.10 shows the LED-lamp market evolution in revenue.
Figure IV.10 – LED Lamp Market size evolution by lamp type [SMA-14]
LED filament lamps are expected to grow rapidly. Since 2013, LED lighting
manufacturers are actively promoting filament LED lamps, and the revenue and sales of
this particular product has markedly risen. In 2015, LED filament lamps entered a fast
3
http://www.zhagastandard.org
20growth phase, which is expected to boost global shipment volume to over 50 million LED
lamps in 2015. LED filament bulbs resemblance to traditional incandescent bulbs has
made it a very popular product; moreover since it can be directly installed it has made
little impact on European and American consumers’ user habits. These features of LED
filament lamps have spurred demands, and brought filament LED market value to an
estimated US$ 40 million in 2015 [LED-16a].
Furthermore, The LED-based luminaire revenue will increase as shown in Figure IV.11
from US$ 19,8 billion (2014) to UDS 45,5 billion in 2022 [SMA-16].
Figure IV.11 – Evolution of LED-based luminaire revenue by luminaire type [SMA-16]
215 LED End-use Domains
Growth of the LED industry initially came from small display applications and was driven
forward by larger LCDs. Since 2012, most companies have been participating in the
ultimate application for the LED business, general lighting. The acceptance of LED
lighting is escalating in almost all major end uses such as industrial buildings, residential
and commercial buildings, as well as outdoor application areas.
Following Frost & Sullivan, in 2014, the largest applications for LED were residential,
outdoor, architectural, and retail lighting. Except for architectural, which pioneered LED
lighting, the applications have been the winners of the 2013–14 boom. The fastest-
growing applications, in the 2014–19 period, are expected to be industrial, office, and
hospitality. Industrial in particular will grow from a low base, while adoption in the large
office space will increase outside of the headquarters/representative buildings that were
more of the architectural adopters [F&S-15].
According to LEDinside, the residential LED lighting market was expected grow at a 30%
clip from 2014-2016. However, after 2017, the LED residential lighting industry will
plateau as demand slows and growth rates cool. The industry will become more
integrated with a more focused use of resources. Prices will also become more
reasonable. Price is a decisive factor in the residential lighting market. Indeed,
consumer price sensitivity in this market is extremely high. Consumers still hesitate to
purchase products with the highest absolute price. In 2014, in the global light bulb
market, there have been large-scale price cuts owing to government subsidies for
energy-efficient lighting and manufacturers discounting products. The residential lighting
market itself is mature. The distribution model for LED lighting products is similar to
other fast-moving consumer goods (FMCG). The key to success in the FMCG industry is
having excellent retail channels. The residential LED lighting market uses the same retail
channels as traditional lighting: supermarkets, convenience stores and hardware stores.
Only with a mastery of the retail channels can a sales team negotiate favourable prices
with retail operators. [LED-14b]. Forecasts for LED uptake in the residential segment
remain high and are expected to reach over 70 % in 2020 [IMA-17].
In 2013, non-domestic was the foremost application segment accounted for over 80%
of industry share [GMI-17]. More especially, following Strategies Unlimited analysis,
commercial, industrial, outdoor and architectural Lighting domains represent more than
60% of the market size [SMA-14]. Figure V.1 gives the LED luminaire market evolution
by end-use.
Figure V.1 – Luminaire market evolution by end-use [SMA-14]
22More precisely, the global industrial and commercial LED lighting market was valued
at US$ 12 928 million in 2012 and was expected to grow at a CAGR 30,8% during the
forecast period from 2013 to 2019 [TRA-13].
Among all end-uses, commercial domain was the largest and accounted for 52,5% of
the market in 2012. Following Smallwood, the luminaire revenue will increase from US$
3,6 billion in 2013 to 6,8 billion in 2018 (14% CAGR) [SMA-14]. It is expected to
maintain leading position throughout the forecast period owing to increased use of LED
lights in emerging regions namely Asia Pacific and Middle East [TRA-14]. Figure V.2
shows the evolution forecast for the commercial lighting luminaires by world region till
2018; Europe has the largest share [SMA-14].
Figure V.2 – Commercial Lighting Luminaire domain market evolution by world region [SMA-14]
The ongoing improvement of efficacy, competence of SDCM control and colour rendering
index in LEDs accelerate high-end commercial lighting market’s development that
demands higher light quality. High-end commercial lighting market mainly includes
museum, galleries and other exhibition lighting applications that primarily use
downlights, projectors and reflectors. LEDinside reports that the market scale of two
frequently used luminaires for high-end commercial lighting, namely Downlight and
Projectors and Reflectors separately reaches US$ 1,88 billion and US $1,54 billion in
2016. It’s projected that the market scale of Downlight is to reach US$ 2,01 billion and
Projector and Reflectors at US $1.59 billion in 2017. Based on LEDinside’s data, both COB
and DOB LEDs are introduced to high-end commercial lighting market, among most
frequently used downlights and track lights, 40% and 75% of these luminaires use COB
LEDs as its light source. Based on the sets of luminaires, mainly COB that are under
30W. Meanwhile, the percentage of COB used in downlight has 11% of CAGR while track
spotlights reach 6% of CAGR. The majority of the track lighting product makers are
European manufacturers, with product features including optical design and product ID
design, also with DALI dimming system. [LED-16e]
23Architectural segment is the second largest end user segment and is expected to
witness strong growth during the forecast period. Increased use of decorative and
functional architectural lightings in landscapes, signage, statues, columns and other
decorative features have been driving the market. Japan and Europe are the fastest
growing regions fir architectural lighting. [TRA-14]. Strategies Unlimited predicted a 7%
CAGR for the LED luminaire market in this domain going from US$ 1,8 billion in 2013 up
to US$ 2,5 billion in 2018. Figure V.3 shows that the market size tends to a plateau from
2016, but 2018 seems to be decisive [SMA-14]. LED penetration is forecasted to reach
90% by 2020 [IMA-17]
Figure V.3 – Architectural Lighting luminaire domain market evolution by world region [SMA-14]
According to LEDinside analysis, the global LED stage lighting market scale sufficiently
increased by 14% to US$ 745 million in 2017 from US$ 655 million in 2016. The light
source revenue for stage lighting has reached a size of USD 382 million (which is 51% of
the full domain revenue), among which a share of approximately USD 150 million is
contributed by LED light sources, with the LED penetration rate at 39%. The market size
of traditional stage light source has been shrinking in recent years, while LED light
sources surges relatively fast. As the technology of LED lighting gradually takes hold, the
price of LED stage lights keeps dropping. The growth of its market scale in the following
years will slow down while currently it is continuously growing. By 2020, the estimated
market size is likely to surpass US$ 1 billion. In 2016, global LED-filament lamp market
demand was 150 million pieces. In 2017, the market demand is predicted to hit 300
million pcs, up 100% YoY. As for branding development LEDVANCE and Philips Lighting
are the top two LED-filament lamp branding vendors. Moreover, filament OEM supply
majorly comes from Chinese manufacturers. [LED-17].
According to LEDinside, the LED industrial lighting market has enjoyed accelerated
growth in recent years owing to the rising demand worldwide and government subsidies.
Figure V.4 gives an idea of the evolution of the LED luminaire market till 2018 [SMA-14].
The market of LED industrial lighting is forecast to grow from US$ 2,93 billion in 2016 to
US$ 5,20 billion in 2020, representing a CAGR of over 15% during the five-year period.
[LED-16f]. More especially, Taiwan's optoelectronics association forecasted that LED
explosion-proof lighting value to reach US$ 248 million in 2020 when the size was US$
151 million in 2013 [ENE-16].
24Figure V.4 – Industrial Lighting luminaire domain market evolution by world region [SMA-14]
LED technology is no longer exclusive to the lighting industry. The added value of LED
solutions and the benefits they offer at the system level are now well-known. LEDs are
gradually expanding into new speciality market segments: transportation with a special
focus on the automotive sector, medicine, agriculture and more.
The market share of LEDs in street lighting worldwide will grow from 53,3% in 2014 to
93,8% in 2023, as falling prices for LED street lights are spurring a global transition from
older lamp technologies to newer, more efficient, and more controllable LEDs.
Governments and regulatory agencies worldwide encouraged the implementation of LED
lighting in various ways, including: ARRA funding in the US, the 12 th 5-year plan in China,
and the European 20/20/20 initiative. Developed countries as well as emerging
economies installed LED street lights on a large scale. Following Strategies Unlimited,
unit shipments of LED street lights are forecasted to have a CAGR of 31% while revenues
are forecasted to only grow 16% from 2012-2017 as downward pressure on prices
continue due to competition [STU-14]. Furthermore, as LED prices continue to erode (in
North America and Europe alone prices are predicted to decrease on average -20% and -
15% respectively) and the long lifespan of LED lamps results in fewer replacements,
overall revenue from street lighting will begin to fall. Navigant forecasts that global street
lighting revenue will decline from US$ 2,5 billion in 2014 to US$ 2,3 billion in 2023 [NAV-
14]. The Figure V.5 shows the forecasted regional growth for LED street lights. China has
the largest shares in this domain. The demand for more efficient and longer lasting
lighting will only grow as the demand for and price of electricity continue to rise [STU-
14].
25Figure V.5 - Forecasted regional growth for LED street lights [STU-14]
According LEDinside, four LED specialty lighting applications that are attracting
growing interests include horticultural lighting, surgical lighting, marine/harbour
lighting and smart lighting. Figure V.6, shows the market evolution of those 4
application domains. The combined market scale of these four applications is estimated
to grow from US$ 4,36 billion in 2016 to US$ 16,4 billion in 2020, with the CAGR during
this forecast period reaching 30% [LED-16c]
Figure V.6 - Market value for 4 speciality lighting applications, revolution from 2016 (established
values) to 2020 (forecast) [LED-16c]
26Demand for LED products in the surgical lighting application is picking up as LED light
sources continue to improve in terms of luminous efficacy and colour rendering.
According to LEDinside, the scale of the global LED surgical lighting market will expand
from US$ 612 million to US$ 787 million during the 2016-20 period. Major regional
markets for LED surgical lighting include Japan, Europe and North America. LED-16c].
In the marine/harbour lighting market, products are governed by stricter regulatory
standards and thus their average sales prices are also higher compared with general
lighting products. For the LED lighting industry, LED marine/harbour lighting is a
specialty application that provides high margins and a stable source of revenue. The total
value of the global LED marine/harbour lighting market will come to US$ 820 million this
year, based on LEDinside’s projection [LED-16c].
Another niche application market that is worthy of interest is horticultural lighting. The
outlook is also very bright for the LED horticultural lighting market. LEDinside forecasts
that the scale of the LED horticultural lighting market worldwide will grow rapidly from
about US$ 576 million in 2016 to around US$ 1,42 billion in 2020 [LED-16c] and is
expected to reach US$ 5,11 billion by 2022. Note that in 2016 LED revenue represented
23% of the global growth lighting size estimated at US$ 2,5 billion [MAM-17].
Furthermore, plant lighting market benefits from legal medical cannabis cultivation and
recreational marijuana in Colorado and Washington. Entrepreneurs and lighting
manufacturers aiming at the Gold Rush are waiting for action [LED-16b]. The grow lights
market comprises key manufacturers such as Philips (Netherlands), General Electric
Company (US), Osram Licht AG (Germany), Gavita Holland B.V. (Netherlands),
LumiGrow, Inc. (US), Heliospectra AB (Sweden), Transcend Lighting Inc. (US), and
Sunlight Supply Inc. (US); and raw material suppliers such as Beacon Lighting India
(India); end users such as Walters Garden, Inc. (US), Green Sense Farms (US), and
Borst Bloembollen B.V. (Netherlands); and suppliers such as Shenzhen Juson Technology
Co., Ltd. (China).
The automotive exterior lighting market is also forecast to grow in the coming year.
Because there has been less competition in this area, price erosion has not been as
severe as it has been in the lighting sector. Japan, North America and Europe are the
most established regions for automotive production and have made up most of LED sales
to the automotive sector; however, growing markets in South Korea and China are now
becoming increasingly important [HIS-16].
According PISEO, the LED automotive lighting market reached US$ 22,4 billion in 2015
[PIS-16] and it is expected to grow at US$ 27,7 billion in 2021 [YOL-16]. The use of
LEDs has evolved from being a basic, functional feature to a distinctive feature with high-
value potential. LED technology has given manufacturers the opportunity to stand out
through lighting design and additional functionalities. LED automotive lighting
developments have gradually shifted from high class car models to mid to high class car
models. In addition, adaptive driving beam are an emerging trend. Adaptive driving
beam headlights control semiconductor that are incorporated in the LED headlight,
shutting off particular lighting beam area, which prevents glaring issue from oncoming
vehicles. Adaptive driving beam headlights allow both high brightness and security at the
same time, and have become one of the main highlighted developments for each
manufacturer [LED-15b].
276 Regional LED market updates
The developed markets of North America and Europe account for approximately 45 % of
the global lighting market [IMA-17]. Following LEDInside, LED lighting is to account for
23% of total lightings in Europe by 2016, which is the highest across the world. The
second and third highest regions are to be found in North America and China. However,
Asia- Pacific region is to witness fastest growth rate in LED lighting [LED-16b]. North
American & European market is expected to show significant growth in outdoor and
residential application segments. LED lighting market has huge growth opportunity in the
emerging markets of Asia Pacific due to tremendous demand from residential application
segment. The Middle East and Africa is expected to show remarkable growth in coming
years [R&M-17]. Emerging markets, including Asia Pacific, the Middle East, and Latin
America, comprise 28% of the global LED lighting market. Looking ahead to 2015,
growth prospects in these markets are especially promising because of rapid population
growth, favourable government policies and an abundance of private-sector LED lighting
projects [LED-14]. Figure VI.1 shows the 2014 world region market shares and Table
VI.T1 lists the main regional growth drivers.
Figure VI.1 – Base-line: LED Lighting market by region in 2014-15 [LED-14]
28Table VI.T1 - Regional LED market drivers [LED-16b]
6.1 Europe
Geographically Europe was the largest segment and accounted for 33,1% in 2012 owing
to increase in investment by government in efficient lighting technologies. In addition,
countries such as Russia, Germany, Denmark and the UK are focusing on deployment of
efficient lighting to improve lighting quality and to lower overall operational cost, which
will further increase the demand for LED lighting products and solutions [R&M-17]. In
2014 Europe is still the largest LED lighting market. However, market shrinkage started,
it comprises 23% of the global LED lighting market despite of large-scale subsidies for
LED lighting users [LED-14]. The Global Lighting Association (GLA) predicts that LED
luminaires will account for more than 95% of the luminaire market in Europe in 2020
[IMA-17]. Figure VI.2 forecasts for LED lighting penetration against legacy technologies.
Figure VI.2 - LED-lamps versus legacy technologies market size in number of pieces [PRU-15]
29In October 2015, VITO, an independent research organization, prepared a comprehensive
study of the energy saving potential of SSL in the European Union. VITO estimated that
82 million LED lamps were sold in 2013, representing 5% of all lamp sales, and that this
brought the total LED installations to 144 million units and 1n3% of the installed base.
VITO forecasted that LED lamp sales would increase to 375 million units (22% of all
lamps sales) and the penetration of the installed base would rise to around 800 million
units (7%). VITO presented various scenarios for later years, with the LED penetration
rate of the installed base in 2020 ranging from 42 to 46%. [VIT-15].
The recovery of Eurozone boosts the consumer confidence of European consumers as
well as the demands in the lighting market. Due to the depreciation of the euro and
logistics costs, European lighting companies have begun to keep manufacturing in their
countries or outsource it to their eastern neighbours, such as Poland. This “Made in
Europe” trend has also helped the local vendors to expand overseas by spurring their
export sales. On the other hand, the euro’s fall has been squeezing the profits of Asian
OEMs as their European clients demand greater price reduction. Some Asian lighting
manufacturers have started to promote their own brand products in order to offset the
effects of the price cuts and reduce their reliance on overseas orders [LED-15a].
Furthermore, general consumers LED lighting distribution channels are clearly identified.
As example, IKEA announced from 2012 that customers will only be able to buy LED
lamps by 2016, and they intend to install large numbers of LED lamps in their stores and
warehouses4. IKEA plans to sell 500 million LED-lamps by 2020 [BEN-17].
LED replacement lamp retail prices are decreasing rapidly. For instance, in January 2015,
Danish consumers were able to buy LED lamps providing 400 lm of light for only €2,90,
and Philips brand LED lamps with 470 lm for €6,50 and with 806 lm for €13.20 (note:
one year ago, the price for these same lamps was double or more). This development,
coupled with market moves by companies like IKEA, are indicative of the fact that the
LED market is becoming an affordable mass market for European consumers, with
benefits for households, energy security and the environment [CLA-15]. Similar price
reduction as shown above for Denmark can be found around in EU, with such low prices,
the payback for these three LED lamps at current prices is less than 1 year in sockets
operated 3 hours per day, and approximately 2,5 years for sockets operated 1 hour per
day [CLA-15].
In France, RATP, the Paris transportation authority begun in 2013 the generalization of
the equipment of LED lamps (LED tubes), of all its network metropolitan and suburban
networks. By 2017, 369 stations will be re-lamped representing 300 km of corridors and
platforms. This operation represents an investment cost of €11 million and should reduce
its energy consumption by 50% [MON-13]. Furthermore, thanks to the energy transition
law, French government decided in 2016 to buy a large number of LED replacement
lamps from Edison and distribute them to households. Following the family’s revenues,
up to 10 lamps can be received for free or at a minimum cost. The operation is handled
by different intermediates who can recover funds from Energy Savings Certificates
national scheme [EXP-16].
Swedish government decided to fully support transition to LED technology. In that
frame, a new R&D grant programme for lighting has been established for the period
2017-2021. The program has as objective connecting academia and business. Globally
SEK 60 million will be invested.
United Kingdom use 18% of its annual electricity consumption for lighting (58 TWh).
Approximatively, 1700 companies are working in the lighting supply chain [LIA-14]. In
2014, UK LED lighting market size was anticipated to be valued over £400 million at
manufacturers’ selling prices (MSP); this includes all finished products, non-domestic and
domestic used within building and construction sectors [GMI-17]. The UK LED market is
forecast to match LED growth, achieving 15,4% CAGR between 2015 and 2020 passing
4
http://www.ledsmagazine.com/articles/iif/2012/10/ikea-stores-will-only-sell-led-lighting-by-2016.html
30You can also read