Australian Avocado Export Development Plan 2014-2019 - Agnes Barnard & Garry Goucher Oliver and Doam
←
→
Page content transcription
If your browser does not render page correctly, please read the page content below

Australian Avocado Export Development
                       Plan 2014-2019
             Agnes Barnard & Garry Goucher
                           Oliver and Doam
                          Project Number: AV12025
AV12025

This report is published by Horticulture Australia Ltd to pass
on information concerning horticultural research and
development undertaken for the avocado industry.

The research contained in this report was funded by
Horticulture Australia Ltd with the financial support of the
avocado industry.

All expressions of opinion are not to be regarded as
expressing the opinion of Horticulture Australia Ltd or any
authority of the Australian Government.

The Company and the Australian Government accept no
responsibility for any of the opinions or the accuracy of the
information contained in this report and readers should rely
upon their own enquiries in making decisions concerning their
own interests.

ISBN 0 7341 3308 1

Published and distributed by:
Horticulture Australia Ltd
Level 7
179 Elizabeth Street
Sydney NSW 2000
Telephone: (02) 8295 2300
Fax:         (02) 8295 2399

© Copyright 2014
Leading the Path to Progress

Australian Avocado
Export Development Plan
2014-2019
Project AV12025

Agnes Barnard & Garry Goucher
March 2014
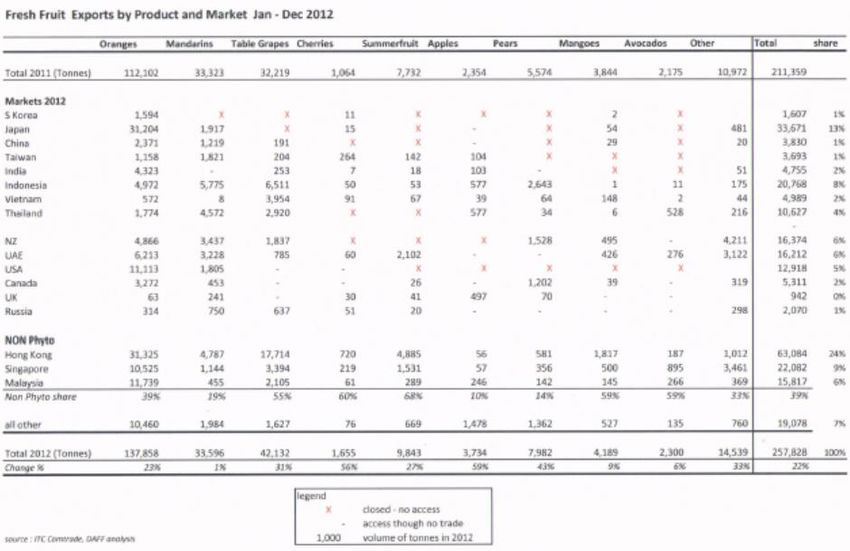
TABLE OF CONTENTS

Executive Summary ................................................................................................................................................ 2
Background ............................................................................................................................................................. 5
Methodology .......................................................................................................................................................... 6
Trade Environment Analysis ................................................................................................................................... 8
   World Production and Trade .............................................................................................................................. 8
   Major Global Competitors .................................................................................................................................. 9
   Major Global Markets ....................................................................................................................................... 15
   Australian Horticulture Trade ........................................................................................................................... 15
   Market Access for Australian Horticulture ....................................................................................................... 18
Industry Situation Analysis ................................................................................................................................... 19
   Domestic Avocado Market Evaluation ............................................................................................................. 19
   Demand Function Estimates For Avocados ...................................................................................................... 22
   Production and Trade ....................................................................................................................................... 26
   Export Supply Chain .......................................................................................................................................... 29
   Market Access for Avocados ............................................................................................................................. 32
Export Market Analysis ......................................................................................................................................... 34
   Existing Key Markets ......................................................................................................................................... 36
   Key Markets with No Access ............................................................................................................................. 40
   Other Markets .................................................................................................................................................. 44
SWOT Analysis ...................................................................................................................................................... 45
Australian Avocado Export Development Paper 2008 – Review .......................................................................... 51
Export Growth Analysis and Export Development ............................................................................................... 61
   Export vs. Domestic Development – A Strategic Perspective ........................................................................... 61
   Drivers of Growth in Exports ............................................................................................................................ 63
   Potential Future Growth Scenarios .................................................................................................................. 64
   Scenarios – Conclusions Drawn ........................................................................................................................ 69
   Recommendations ............................................................................................................................................ 71
Industry Export Plan ............................................................................................................................................. 72
   Export Market Matrix ....................................................................................................................................... 73
   Export Strategies and Action Plan .................................................................................................................... 78
Appendix ............................................................................................................................................................... 89

                                                                                                                                                                         1
EXECUTIVE SUMMARY

World production of avocados is over four million tonnes and consistently continues to grow. Although much
of the major producers of avocados are also major consumers of the product, global trade of avocados
generally keep pace at 25% of production with Mexico as the biggest world exporter, at 50% of global exports.
Chile, Peru and South Africa1 follow far behind. The Australian and New Zealand avocado trade are relatively
more expensive, minimal in export volume but are considered high in product quality.

Avocados are mainly exported into Europe, North America and Japan. Other Asian countries are very small
markets but demonstrate growth in avocado imports.

Over the past 15 years, Australian avocado production has increased at an average of 2,126 tonnes p.a. while
Australian consumption has increased at an average of 2,517 tonnes p.a. The difference, equivalent to 20% of
the increase in consumption has been supplied by imports from New Zealand.

Domestic consumption of avocados in Australia is currently close to 3 Kg/hd of population. This is high by
western standards but less than half that observed in Mexico and other central and South American countries.
Global avocado production, consumption and trade are rising because avocados are a relatively new food
option, with which many consumers are yet to become familiar.

The rate of growth of consumption in Australia shows no sign slowing. Over the last 6 years avocado prices
have grown on average by 3.2% a year in real terms while consumption has grown 6.3% a year. Strong growth
in prices while consumption is also increasing is evidence of strong underlying consumer demand. Further,
‘brand health’ reports prepared by The Nielsen Company show that at most, only ⅓ of households buy
avocados in any 4 week period. The market penetration is not high.

Sufficiently detailed data on promotion of avocados to Australian consumers does not exist, so it is not
possible to determine whether investment in developing export markets will offer a better financial return
than additional investment in marketing and promotion in the domestic market.

Analysis of avocado prices and sales through Woolworths’ supermarkets over a 5 year period estimated the
elasticity of demand for avocados by Australian consumers to be -0.82. This indicates that if 1 % of avocados
were diverted from the domestic market into exports then domestic prices would be expected to increase by
1.22%. This is consistent with the observation that real prices of avocado have been rising while consumption
is also rising strongly.

Anecdotal evidence suggests that growers frequently sell avocados for export at lower prices than could be
achieved on the domestic market. The low elasticity of demand estimated in the analysis indicates that even
when export sales are at lower prices, the industry’s aggregate value of sales would rise as a result of diverting
supplies of avocados from the domestic market into exports.

Although growth in consumption of avocados in Australia is robust and appears to have the capacity to absorb
expected increases in production and imports for the foreseeable future, it would be prudent for the industry
to maintain export markets as alternative outlets for product in the event of unforseen shifts in domestic
demand or increases in imports.

Scenarios are presented to portray possible outcomes from feasible growth patterns for consumption,
production and imports over the next 5 years. From current consumption trends and forecast increases in
production and imports, Australian avocado exports could increase to 4-5% of production by 2017-8.

1
    Spain and the Netherlands mainly trade within Europe.

                                                                                                                 2
New Zealand is currently the only supplier of Australia for imported avocados. Australia is its largest and most
profitable export market. The outlook for Australian avocado exports will be influenced by New Zealand
production outcomes and New Zealand’s ability to grow its market share in Australia. Forecasts obtained from
New Zealand indicate also that the pattern of irregular bearing in New Zealand and the pattern of exports to
Australia may be reversed in 2014-5. This could destabilise the supply of avocados in the summer months in
the Australian market.
Although imports may not displace substantial quantities of locally produced fruit from the domestic market
into exports, they do act to subdue domestic prices through the summer months and facilitate acquisition of
fruit for export.
The following have been considered in developing export strategies for the Australian Avocado industry:
Although the domestic market continues to be strong for the Australian avocado industry, it is prudent to
maintain current export markets as alternative markets.
Avocado imports by Australia’s key alternative markets are growing. Maintaining these markets entails
growth in supplying Australian avocados to them.
Maintaining and improving access to existing export markets is a continuous and long-term task in order
to defend, maintain and strengthen current Australian avocado exports.
Gaining access into new markets will provide the Australian avocado industry opportunities as well as
alternatives in building the Australian avocado business. It is a long-term endeavour and will prepare the
industry for any adverse changes to the current domestic situation i.e. oversupply in the domestic market,
decrease in domestic prices.
The following are the export objectives set forth in this plan to strengthen the export business and prepare the
industry for further growth in the international trade:
1. To continue being the largest supplier of imported avocados in Singapore and Malaysia in the next 5 years
(2012-13 market share levels are at 55% and 52% respectively)
2. To increase trade, in the next five years with:
Hong Kong (greater than 17 tonnes)
At least one new market - in order of priority
Middle East (greater than 79 tonnes)
The rest of Southeast Asia (greater than 69 tonnes)
Russia (greater than 100 kilograms)
3. To maintain annual export volumes of at least 5% of production (current level) for the next 5 years or
3,500 tonnes in 2018-2019 based on industry production forecast
4. To regain commercially viable access into Thailand by 2016 and regain trade with Thailand of at least 529
tonnes on or before 2018-19 (2012 export volume)
5. To gain access into China within the next 6-10 years and maintain access into existing open markets
throughout the next 5 years.
To achieve these objectives, it is recommended that the industry focuses on specific markets and strategies.
The strategies cover the following:
Industry Capability
Branding and Positioning
Market Access
Trade Development
Promotions
3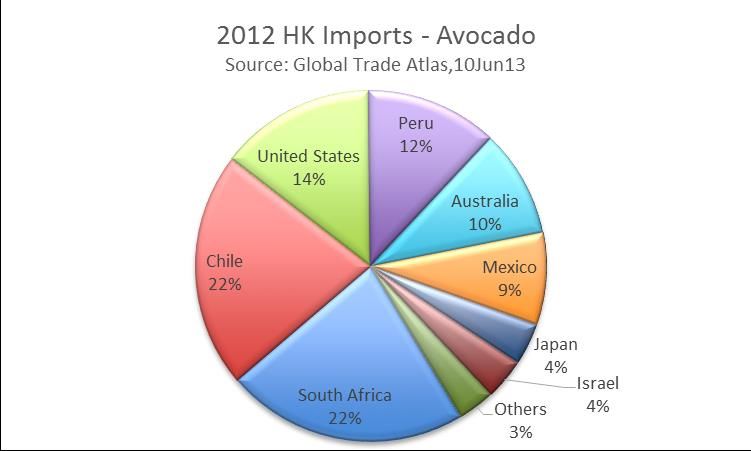
Key markets are categorised as the following:
        Key growth markets
        New Markets
        Lost Access Markets
        Potential Access Markets
Outlined in this plan are the recommended priority markets and strategies with the corresponding action
points, desired outputs and industry outcomes.

Recommended budgets have likewise been provided using levy funds. It is encouraged that the industry seek
additional external funding and share resources with other industries / groups of similar objectives to further
expand the export programme.

It is expected that Avocados Australia Limited (AAL) will have the responsibility of implementing this plan while
coordinating with avocado exporters and other stakeholders, including Horticulture Australia Limited. Note:
No budget was allocated for the additional services required of AAL but it is estimated to require 72 working
days per year or 1.5 days per week for 48 weeks.

As this export development plan is a living document, AAL will need to periodically review this plan and make
revisions, if necessary, to address current industry and market situation. Industry vigilance and flexibility
should be a standard practice as market conditions are dynamic and may easily change. These changes will be
reflected in the Annual Export Operating Plan and Annual Evaluation Report which AAL will develop.

Strengthening the export business for the Australian avocado industry will spread industry risks, provide the
luxury of better market growth options, improve production standards and systems, build industry capability
and consequently lead the path to progress.

                                                                                                                  4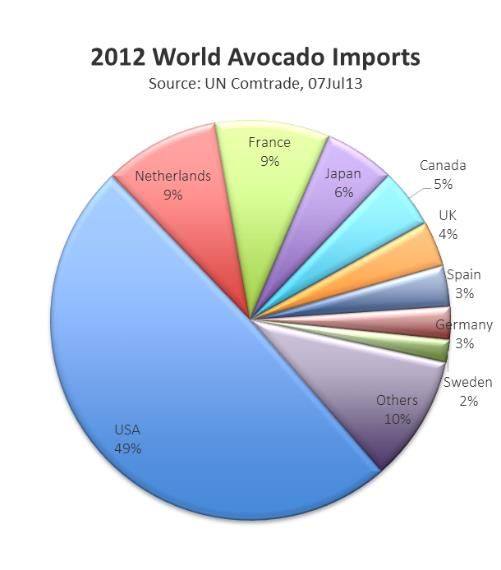
BACKGROUND
Australian avocado production is growing in response to rising domestic demand and as plantings reach full
production. As production rises and imports from New Zealand and other countries become more significant,
there is increasing potential for domestic prices to be depressed especially during periods of high production.
By expanding markets beyond domestic, the industry is able to better spread its risks and further develop the
business. Exports of avocados account for 4 to 5% of domestic production.
A project undertaken in 2008 has assessed opportunities in the avocado export trade and has outlined an
‘export road map’ for the Australian avocado industry which identifies the key requirements for developing
the industry’s export markets.
Horticulture Australia Limited (HAL), in consultation with the Australian avocado industry, has commissioned
project AV12025 to Oliver & Doam as represented by Agnes Barnard and Garry Goucher with the following
objectives:
1. Develop a five-year Australian Avocado Export Development Plan covering the period 2014-2019 that will:
Provide a clear export vision/direction for the industry
Define the key outcomes required to advance the industry’s export performance
Help identify best export investment options for HAL and the industry
Provide a management framework, to avoid “ad-hoc” investments and a clear basis to evaluate
progress
2. Undertake a financial analysis to assess the relative returns from the proposed export development plan
compared to further investment in developing the local domestic avocado market.
Estimate the cost of the proposed export market development strategies over the next 5 years
Calculate a return from investment in those export market development strategies at a range of levels
of export growth
Estimate the return on investment from an equivalent investment in development of the domestic
market
Review of the risks associated with the export and domestic markets and assess in relation to the
relative returns
The new plan aims to provide the industry with specific strategies and actions to build the industry’s export
business. An economic analysis on the costs and benefits of expanding exports provides the industry with
better insight into making an informed decision on the commitments it will place on exports while it continues
to maximise domestic market opportunities.
5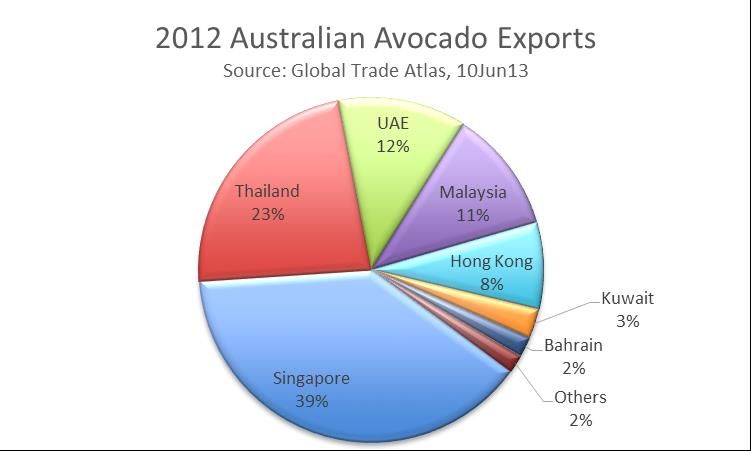
METHODOLOGY

The entire project was conducted as a transparent process in which industry is an active participant and has
input to critical elements of the planning and analysis. This ensures that the project takes full advantage of
industry’s knowledge and experience and facilitates understanding and confidence in the results.

The following describes the methodology that was followed in developing the Export Development Plan:

Data scoping was conducted where all existing industry plans, reports and studies relevant to the project, and
provided by HAL and Avocados Australia Limited (AAL), were assessed and reviewed.

Desktop research was undertaken to gather additional export trade intelligence and insights to map out the
opportunities and threats to the industry. Online data sources included ABARE reports, UN Comtrade, USDA
Foreign Agricultural Services and other research sites. Oliver & Doam directly accessed market intelligence
statistics from Global Trade Atlas from Global Trade Information Services (GTIS).

On-ground contacts verified information and provided additional data i.e. price checks in Japan and Russia

A series of interviews were conducted as part of the consultation process. The following participated in the
interviews:

         John Tyas – Avocados Australia Limited, CEO
         Judy Prosser – Sunfresh, Managing Director
         Mark Johnston – Sunfresh, Marketing and New Business Development Manager
         Daryl Boardman – Sunnyspot / Avocado Export Company (with prior consultation with the AEC Board)
         Wayne and Jennie Franceschi – APM / Avocado Export Company
         Hugh Molloy – Antico
         Chris Langley – OHMA, Market Access Manager
         Michelle Christoe – Australian Horticulture Exporters Association, Executive Director
         Edith Gomez – Queensland Trade & Investment, Senior Trade Officer
         Brett Tucker – Queensland Trade & Investment, Principal Trade & Investment Officer
         Modika Perera – Department of Agriculture and Food WA, Trade Development Manager
         Mark Soccio – Rabobank, Senior Analyst
         Jeff Scott – ATGA CEO
         John Moore – SAL CEO
         Various managers in Austrade and Vic DEPI
All data were analysed and presented in the plan. The existing Export Road Map was likewise reviewed and
evaluated. Based on analysis conducted, objectives and strategies were mapped out.

A planning workshop was conducted by Oliver & Doam to present and guide discussions on the draft of the
export development plan and parameters and assumptions for budget planning and economic analysis.

The planning workshop was attended by a group consisting of industry stakeholders and relevant government
representatives:

         Judy Prosser – Sunfresh, Managing Director
         Mark Johnston – Sunfresh, Marketing and New Business Development Manager
         Daryl Boardman – Sunnyspot / Avocados Australia Limited Director / IAC
         Chris Langley – OHMA, Market Access Manager
         Shaun Woods – CT Freight Brisbane, Export Perishables Manager
         Duncan Sinclair – Horticulture Australia Limited, Marketing Manager
         Tony Walsh – Lamanna/IAC
         John Tyas – Avocados Australia Limited, CEO
         Peter Annand – P.G.G. & M.L. Annand / Avocados Australia Limited Director
         Jennie Franceschi – Advanced Packing and Marketing Services / Avocado Export Company

                                                                                                                 6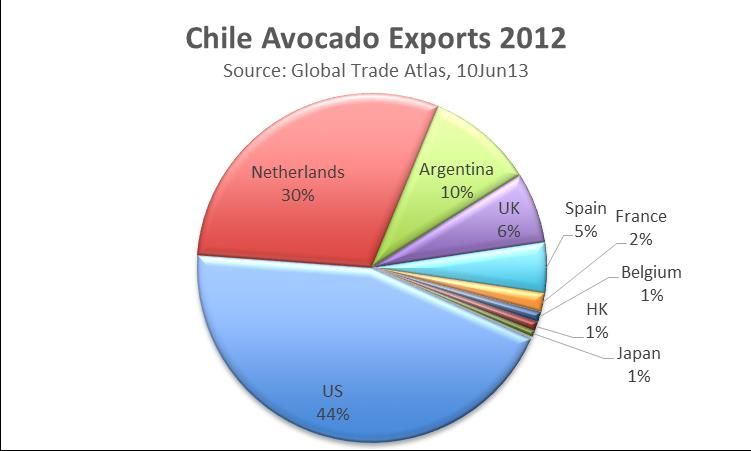
Edith Gomez – Queensland Trade & Investment, Senior Trade Officer
         Brett Tucker – Queensland Trade & Investment, Principal Trade & Investment Officer
         Adam Powell – Queensland Department of Agriculture Plant Division, Assistant Director
         Sean Blondeau – QC Fresh Brisbane, Fresh Export Trader

The economic analysis has been undertaken in two parts:

    1.   Analysis of the domestic avocado industry and domestic consumption
         Estimation of historical growth rates of production, consumption, imports and exports as the basis for
         assessing the potential availability of fruit for export within the planning period. Analysis of detailed
         price and sales volume data to estimate a domestic demand function and the elasticity of demand for
         avocados. Examine data on industry promotion for the purpose of estimating returns to investment
         in avocado promotion.

    2.   Construction of feasible scenarios for growth of production, imports and consumption to facilitate an
         understanding of the drivers of change in the availability of product for export.

The plan underwent a third round of consultation. This plan includes all revisions based on industry
stakeholder comments/inputs and consultancy recommendations as well as a recommended budget for IAC
endorsement.

                                                                                                                 7
TRADE ENVIRONMENT ANALYSIS
WORLD PRODUCTION AND TRADE
World production of avocados has grown from 3.6
million tonnes in 2007 to 4.4 million tonnes in
2011 with Mexico producing half of world
production. The top producing countries have
generally experienced growth in the production of
avocados. Apart from Chile, Mexico and Peru,
much of global growth comes from countries
where supply is mainly consumed in the domestic
market, such as the Dominican Republic,
Indonesia, Columbia, Kenya and Rwanda. Australia
produces less than 1% of global production of
avocados.
25% of production is traded internationally at
about 1 million tonnes worth 2 billion US dollars.
Most of avocados produced are consumed in the
domestic market with the exception of Spain at
80% of production in 2011 and to some extent
South Africa in 2010.
A study by the Secretaria de Economia establishes that there are basically three types of avocado: Antillean,
Mexican and Guatemalan with Hass, Fuerte and Nabal as the most internationally traded varieties. 2
2
“One out of two avocados consumed in the world is Mexican”, Mexican Business Web, Eduardo Hernandez,
22Apr203.
8MAJOR GLOBAL COMPETITORS
Mexico is the largest producer and exporter of avocados in the world
with Chile and Peru trailing a far second and third in exports. 90% of the
avocado international trade is covered by the top 6 exporters: Mexico,
Chile, Peru, Netherlands3, Spain and South Africa. Hass is the main
variety traded internationally.
Australian and New Zealand avocados are two of the most expensive,
actively traded avocados in the world with American avocados coming in
third. South African avocados are traded at much lower prices. As prices
are based on declared FOB4 rates as reported by each country, price
differences may vary.
3
Netherlands re-exports avocados.
4
FOB = Free on Board; excludes shipping costs.
9Australian avocados are counter seasonal with New Zealand and Chile at peak season and directly competes
with Mexico, Peru, South Africa and the US. There are significant increases in production from southern
Australia which will see summer supply increase over time such that strong supply will continue through to
December. In such case, Australian avocadoes will be directly competing with New Zealand and Chile.
Avocado Availability for Export
Country Jan Feb Mar Apr May Jun Jul Aug Sep Oct Nov Dec
Mexico
Peru
Chile
South Africa
United States
New Zealand
Australia
Peak Season
Non-Peak Season
Minimal Trade
No Trade Source: ITC Comtrade, Department of Agriculture Market Co-ordination & Strategy Analysis, 10Dec13.
Mexico
Half of all internationally traded avocados
are from Mexico. It came to nearly
500,000 tonnes valued at US$0.9 billion
in 2012. Mexican avocado exports
increase every year, but the increase
from 2010 to 2011 was quite substantial.
Three quarters of Mexican exports are
directed at their northern neighbour, the
US. In 2012, 370,000 tonnes of Mexican
produce went across their northern
border. Japan imported a lot more
Mexican avocados than previously:
50,000 tonnes. Canada is Mexico’s third largest customer. Mexico exports about 30% of its production. 5 The
main export markets for Mexican avocados are the US, Japan, Canada, France, Costa Rica and El Salvador.
China and Europe are considered potential markets for the future.
Asia is viewed as a “high potential” market for Mexican fresh produce exporters, with both the government
and producer organizations hoping to build on a strong performance in Japan to move into other Asian
markets. The push into Asia forms part of a period of impressive growth for Mexican agricultural exports in
2012-13, with the country demonstrating progress in several Asian countries, alongside Europe, the US and
Latin America. According to figures from the Secretary of Agriculture, Livestock, Rural Development, Fisheries
and Food (SAGARPA), agricultural exports to Japan, including avocados, pork products and beer, increased by
11.8% year-on-year in 2012, while exports to eight other Asian countries also rose by a combined 11%. Japan
5
“Avocado market still growing, Holland plays big role in it”, Fresh Plaza, Fruit & Vegetable Facts, 13Jun13.
10in particular is viewed as a market with high potential for Mexican agricultural exports, with the country
achieving record exports to Japan during 2012 in 10 categories, including avocado. Japan is seen as a potential
destination for Mexican exports to East Asia and will be a launching point for products that have already
achieved success in this market. Mexico is taking a similar strategy to China, Hong Kong, South Korea and
Taiwan.6
Chile
Second largest producer of avocados is Chile which exports 30% of its production to the world, with the USA as
the most important customer, and the Netherlands coming in second. Only 2% of exports go to Asia: Japan
(550 tonnes) and Hong Kong (800 tonnes). In 2012, Chilean avocado exports fell due to lack of water in some
growing regions. Chile exported to Japan only half of 2011 figures. Avocados in Chile come from a total surface
area of 30,000 to 34,000 hectares of which the drought and weather conditions have affected 10,000 to
15,000 hectares that suffered losses or were not in production.
The industry is expected to continue to suffer from problems of drought and weather. Chile is entering its 6 th
year of drought. Although new plantings, in zones with better access to water, are starting to enter
production, it is predicted that Chile will not return to the 300,000 tonne production mark for at least three
years.7
Despite its climate issues, Chile invests more than most counties in promoting
and facilitating exports. They have been doing so for decades and have been
quite successful at it. The various Chilean horticulture industries collaborate
through their Exporters Association: ASOEX8, whose mission is in the areas of
market access, trade development and building industry capability.
Chile has existing trade agreements in force with South Korea (2004), Japan
(2007), China (2006), Malaysia (2012), USA (2004) and Canada (1997). 9 In
2013, Chile entered into a free trade agreement with Thailand.
6
“Mexico makes advances in Japan”. Freshfruitportal.com, 19Jul13.
7
“New avocado plantings set Chilean industry back on track”, Fresh Fruit Portal, 17Sep13.
8
ASOEX: Associacion de Exportadores de Chile A.G.
9
http://www.sice.oas.org, 19Aug13.
11Peru
Peru has been growing in production year on year. Peru
exports 40% of its production, most of it to Europe, with
the Netherlands as their most important customer,
followed by Spain.10 With increased production, there is
greater focus on Peruvian trade and particularly into Asia in
recent years. Hong Kong is a new market for Peruvian
avocados. At a low base of 132 tonnes in 2011, exports to
this market have grown 100% in the following year. A
delegation of Japanese officials were recently hosted to
further pave the way for exports of Peruvian avocados into Japan. Trade missions to China, Japan and Korea
were organised to promote various Peruvian products.
Peru recently announced that they are holding talks with Mexico to evaluate the possibility of establishing
arrangements, specifically with Hass avocado, in developing the North American and Asian markets. 11
Peru has emerged to be a significant fruit and vegetable exporter. Its success is
mainly driven by its ideal climate for horticulture production, relatively cheap
labour, investor-friendly business environment and policy framework, its free or
preferential trade agreements with major importers. 12 Peru has trade agreements
in force with South Korea (2011), Japan (2012), China (2010), Singapore (2009),
Thailand (2011), EU (2013), USA (2009) and Canada (2009).13
Challenges to Peru include its long distance to export markets, shortcomings in its export infrastructure, water
scarcity in coastal areas and unresolved land right issues. 14
10
“Avocado market still growing, Holland plays big role in it”, Fresh Plaza, Fruit & Vegetable Facts, 13Jun13.
11
“Peru and Mexico would jointly export Hass avocado to Asia and the US”, Fresh Plaza, rpp.com.pe, 23Sep13.
12
“Peru: An Emerging Exporter of Fruits and Vegetables”, USDA ERS, By Brigit Meade, Katherine Baldwin, Linda
Calvin, 10Dec.
13
http://www.sice.oas.org, 19Aug13.
14
“Peru: An Emerging Exporter of Fruits and Vegetables”, USDA ERS, By Brigit Meade, Katherine Baldwin, Linda
Calvin, 10Dec.
12South Africa
Europe is the main export market for South African avocados. It exported 34 thousand tonnes to the
Netherlands and 10 thousand tonnes to the UK in 2012. South Africa sees Peru as its main competitor. 15 Asia
is a 450 tonne market for South Africa and this regional market continues to grow. Asian markets mainly
include Hong Kong, Singapore and Malaysia.
The South African fruit industries have had a lot of challenges in export promotions
and like most other competitors like Australia, they continue to struggle in this area.
Most of the promotion efforts have been undertaken by their exporter association but
because of lack of funding, they hardly made a dent in global promotions until the
2010 soccer world cup South African fever. Government provided massive funding for
horticulture for a few years then eventually pulled out. Their challenge as in most cases is: consistency,
funding, support from growers. They have since shifted to focusing mainly on access and have left export
development to the exporters. They started big and fizzled out soon after. What keeps them going is their low
price and high volume.
New Zealand
New Zealand mainly grows the Hass variety of avocados, which comprise 95% of its production. It generally
exports 50% to 60% of its production. Australia is New Zealand’s largest market. In 2012, Australia absorbed
85% of New Zealand avocado exports and 92% in 2010. New Zealand is Australia’s only source of imported
avocados. In 2011/12, New Zealand produced 26% of what Australia produced, but in this same year, it
exported 240% more than Australia. Outside of Australia, the Asian region is its 2nd largest market. Should
they lose market share in Australia, it would be expected that exports to the Asian region will ramp up.
15
“South Africa prepares for major avocado competition from Peru”, Fresh Fruit Portal, 28Feb13.
13New Zealand Exports (in Kg)
Partner Quantity
Country 2007 2008 2009 2010 2011 2012
World 11,847,678 10,307,868 11,662,644 10,286,106 18,679,420 11,076,683
Australia 7,798,764 9,412,208 9,750,305 9,475,862 15,021,401 9,437,342
Japan 1,090,825 649,542 1,247,686 550,124 1,984,994 776,607
Singapore 88,249 69,422 223,304 154,878 400,001 516,782
Korea South 155,253 72,693 98,280 71,148 272,400 202,273
Malaysia 23,836 32,234 11,276 - 42,488 63,846
Netherlands - - - - - 19,360
Taiwan 12,911 11,049 8,300 - 11,623 17,928
Thailand 18,057 21,277 1,183 8,245 23,150 16,359
New Caledonia 510 - 3,043 7,899 7,557 12,892
United States 2,582,685 20,528 258,286 197 753,672 8,015
Fiji 2,264 515 674 1,216 2,916 3,883
Others 74,324 18,400 60,307 16,537 159,218 1,396
Source: Global Trade Atlas, 10Jun13
New Zealand established a statutory authority in 2005, New Zealand Horticulture Export Authority (HEA). Its
primary function is to promote the effective export marketing of horticulture products. It has an Export
Marketing Strategy (EMS) which defines the product group’s vision for the industry and rules for exporting to
achieve its stated goals. It also established an export licensing system where anyone wanting to export the
product must obtain a license and is required to meet specified criteria. Product groups come under the HEA
exporting model on a voluntary basis and is funded by and represents 5,000 commercial fruit and vegetable
growers. The organisation acts as an advocate on national industry-wide issues. Product groups, comprising
producers, packers and exporters include: Avocados, Buttercup Squash, Pipfruit, Kiwifruit, Persimmon,
Summerfruit, Onions, etc. There are approximately 22 product groups, 11 of which export under the HEA
framework.
Others
Israel is a relatively small producer, but almost the entire harvest (90%) is sold abroad. After a big drop in
export in 2011, 2012 saw an increase in export, namely 60,000 tonnes. France, the Netherlands and Russia are
important customers. The Dutch (re)export is mainly aimed at Germany, but Sweden also buys a lot. France,
Denmark and Norway are also important customers for the Dutch trade. 16
16
“Avocado market still growing, Holland plays big role in it”, Fresh Plaza, Fruit & Vegetable Facts, 13Jun13.
14MAJOR GLOBAL MARKETS
The United States are by far the biggest avocado importers. The 500,000
tonne mark was passed in 2012. The majority comes from neighbouring
Mexico. The Netherlands are the world's second largest import market.
Import statistics show that it came to 96,000 tonnes valued at 190 million
dollars in 2012. South Africa, Chile and Peru each supplied just under 20,000
tonnes last year. The South African import shows quite a few fluctuations
from year to year. Chile and Peru provide more each year. According to
South African and Peruvian export statistics more is shipped to the
Netherlands than (Dutch) import statistics show. This is partially explained
by trade going to the Netherlands through other countries, such as France,
Spain and Germany. As an importer, France is almost as important as the
Netherlands. This country imported 95,000 tonnes in 2012. Spain is their
most important supplier, followed by Peru and Israel.17
AUSTRALIAN HORTICULTURE TRADE
Australian fruit and vegetable production is on the increase. Consequently, oversupply and fiercer competition
across commodities are currently on-going and are expected to worsen in the domestic market. The increase
of imports and duopoly of the supermarket industry add to the pressures in the domestic market.
More Australian industries are extending resources to build their export business for market expansion and to
ease pressure on the domestic market. The strong value of the Australian dollar, high cost of production and
phytosanitary issues, particularly related to fruit fly, pose big challenges for the fresh produce industry in
export markets.
The value of Australian horticulture exports has increased
since 2010-11 by 30% to $1.2 billion18. Avocado exports
are valued at $8 million a year. Australian fruit & nut
exports accounted for the increase in dollar exports at an
average of 60% with export value of vegetables and plant
life on the decline.
Citrus and Grapes account for 72% of Australian fruit export value while Avocados are 2% of the half billion
dollar Australian fruit export business.
17
Ibid.
18
Excludes legumes
15Similar to Pears, Avocado exports account for 3-4% of production and is 2% of total Australian fruit exports in
value terms. Fruit industries that have been actively developing their export trade are: Citrus, Grapes,
Summerfruit, Cherries, Pears and Apples.
Commodity Production Exports
2012-13 In Tonnes % of Prod’n
Citrus 550,000 40%
Grapes 130,000 55%
Summerfruit 110,000 10%
Cherries 15,000 20%
Avocados 50,000 *4%
Pears 130,000 3%
Apples 250,000 1.5%
Source: HAL MT12009, SHAFFE AGM 2013 Australia Report, Wayne
Prowse (* corrected based on Avocado statistics)
Apart from its Chief Executive Officer (CEO) and Market Development Manager, the citrus industry has
recently created a Market Access Manager position to actively pursue their market access interests. This team
of 3 has been generally working independently of other Australian industries.
Grapes, summerfruits, cherries, apples and pears have been working closely together in developing their
export business. Their CEO’s are actively involved in market access and development. The cherry industry
chairman is also involved. Apples and Pears have their own Export Market Development Manager and another
person designated to Market Access. They have recently had a change in CEO.
Asia is the largest export region for Australian fruits with Hong Kong19 as the largest market with the largest
growth trend. The ASEAN and the Middle East regions are also growth markets for Australian fruit exports.
Recognising that Australian fruit exports cannot compare in size to other competing countries, Australia re-
launched Australia Fresh as an export development program for horticulture, providing a vehicle for Australian
industries to work together as a team in developing markets through building in-market relationships
19
Includes secondary trade to China.
16(government and trade) and promoting their individual products through a consistent and unified message.
They are able to share resources and build a larger presence in the markets as a group. Membership is
voluntary. 6 industries are currently on board with this program with the lychee industry being the newest
member.
Over the medium term to 2017–18, the gross value of production of the Australian fruit industry is projected to
increase to around $3.6 billion (in 2012–13 dollars). Australian fruit exports are projected to rise, increasing to
around $577 million (in 2012–13 dollars) by 2017–18. In the past few years Australian fresh fruit imports have
increased and the value has nearly overtaken the value of fresh Australian exports. Fresh avocados from New
Zealand are the largest fruit import, valued at around $64 million in 2011–12.20
20
Agriculture Commodities March 2013, ABARE Report.
17MARKET ACCESS FOR AUSTRALIAN HORTICULTURE
Market access is a significant challenge to the Australian fresh produce industry. Phytosanitary issues have
been a major stumbling block to developing the export trade. The table below gives a snapshot of the access
& trade situation for the Australian fruit trade in 2012.21
Market access covers new or improved entry for products into markets where terms and conditions of access
need to be negotiated on an inter-governmental basis with those authorities responsible for the control of
import, health and safety regimes. Market access covers phytosanitary (quarantine), sanitary (contaminants
e.g. pesticides) and non-quarantine (e.g. exclusion, duties, quotas, tariffs, licenses) requirements which need
to be addressed through the established channels for authorising or improving access. 22
Australia has seven Free Trade Agreements (FTAs) currently in force with New Zealand, Singapore, Thailand,
US, Chile, the Association of South East Asian Nations (ASEAN) (with New Zealand) and Malaysia. Australia is
currently engaged in nine FTA negotiations - five bilateral FTA negotiations: China, Japan, Korea, India and
Indonesia; and four multi–lateral FTA negotiations: the Trans–Pacific Partnership Agreement (TPP), the Gulf
Cooperation Council (GCC), the Pacific Trade and Economic Agreement (PACER Plus), and the Regional
Comprehensive Economic Partnership Agreement (RCEP). 23
The Office of Horticulture Market Access (OHMA) was established in 2009 to provide advice to government on
market access issues. It sets priorities for horticulture in market access. The OHMA committee is composed of
10 horticulture industry representatives with Horticulture Australia Limited (HAL), Department of Agriculture,
Fisheries and Forestry (DAFF) and the Department of Foreign Affairs and Trade (DFAT) as observers. The
Australian avocado industry is represented in the OHMA committee.
21
Data provided by Wayne Prowse, DAFF and presented by Chris Langley, OHMA Manager, Export Symposium,
September 2013.
22
Horticulture Australia Limited, www.horticulture.com.au.
23
http://www.dfat.gov.au/fta/.
18INDUSTRY SITUATION ANALYSIS
Domestic Avocado Market Evaluation
Growth in Domestic Consumption of Avocados
The following table shows consumption of avocados in Australia, estimated as production less net
international trade. On this basis, domestic consumption of avocados has increased year–on–year at an
average of 2,517 tonnes per annum over the period from 1997-8 to 2012-13. Over this period Australia’s
population has increased and to obtain a measure of ‘market penetration’ it is common to express
consumption on a per capita basis, to remove the contribution to demand made by population increase and
provide a measure that can be used for international comparison. Consumption measured per head of
population has grown from around 1.4 Kg per head per annum in the 1990s to close to 3 Kg per head per
annum. This is consumption rate is high by global standards, other than in Central and South American
countries. Consumption per head has increased year–on–year at an average of 0.09 Kg per head per annum
from 1997-8 to 2012-13.
Year Consumption Population Consumption
(tonnes) (kg/person)
1997-98 23,282 18,516,612 1.26
1998-99 29,315 18,711,113 1.57
1999-00 26,868 18,923,534 1.42
2000-01 32,508 19,151,002 1.70
2001-02 32,929 19,388,468 1.70
2002-03 32,706 19,609,728 1.67
2003-04 33,781 19,830,355 1.70
2004-05 37,521 20,054,254 1.87
2005-06 46,103 20,317,077 2.27
2006-07 40,408 20,637,985 1.96
2007-08 49,078 21,031,905 2.33
2008-09 51,914 21,478,444 2.42
2009-10 48,505 21,869,877 2.22
2010-11 56,562 22,182,879 2.55
2011-12 65,705 22,522,583 2.92
2012-13 58,278 22,905,379 2.54
Australian Consumption of avocados.
Appendix A shows estimated per head consumption of avocados over the years 2008 to 2010 calculated from
FAO statistics on avocado production, trade and population. From this data, the highest consumption rates are
found among the Caribbean islands (e.g. Dominican Republic 20.9 Kg/hd, Grenada 14.0 Kg/hd, Haiti 4.7kg/hd),
South America (e.g. Chile 12.5 Kg/hd, Columbia 4.2 Kg/hd, Peru 3.7 Kg/hd) and Central America (e.g. Mexico
7.7 kg/hd, Costa Rica 6.8 Kg/hd, Guatemala 6.8 Kg/hd). In the English speaking world, Australia has the highest
per head consumption (2.2 Kg/hd), ahead of New Zealand (2.0 Kg/hd) and the United States of America (1.7
Kg/hd). In Europe the highest consumption occurs in Portugal (1.6 Kg/ha), Denmark (1.6 Kg/hd), Sweden (1.3
Kg/hd), France (1.2 Kg/hd) and Spain (1.2 Kg/hd).
Nielsen ‘Brand Health Reports’
Data extracted from periodic ‘Brand Health Reports’ on avocados prepared for HAL by The Nielsen Company,
indicate that in the year to July 2013, 66% of Australian households bought avocados at least once during the
year. As the data in the table shows, the market penetration of avocados measured by the percentage of
households that purchase the fruit during a year has increased from about 62% in 2009 to 66% in the last year.
19In 2011 about 15% of households that purchased avocados made only one purchase during the preceding year.
If these occasional purchasers are removed from the measure, the proportion of households that purchase
avocados more than once a year is likely to be about 45-50%.
Further information from the brand health reports indicates that in any four–week period the market
penetration by avocados ranged from about 20% of households purchasing the fruit, to as high as 34%. The
penetration rate fluctuates from season to season, generally being highest in the summer months and lowest
in the winter.
Since 2009, the average annual expenditure on avocados has increased from slightly less than $22 per annum
to almost $24 in the most recent 12 months.
12/8/09 19/2/10 11/6/10 12/8/10 19/2/11 11/6/11 7/7/11 29/12/11 7/7/12 13/7/12 29/12/12 13/7/13
Penetration (%) 62.1 62.6 63.3 62.5 65.2 66.4 66.4 66.9 67.7 67.8 66.1 64.4
Average An. Purchase ($) $21.90 $22.50 $22.00 $20.50 $22.30 $22.30 $22.50 $22.50 $21.80 $21.80 $23.70 $26.50
% one time buyers 18.3 14.5 16.5
Penetration
by demographic (%)
Start–up families 69.2 71.1 72.0 70.9 73.3 77.0 76.7 75.8 78.7 78.5 78.4 77.7
Small–scale families 66.4 70.1 66.1 66.1 68.7 68.6 68.8 69.3 69.0 69.2 69.2 65.2
Bustling families 64.8 65.6 66.8 65.9 68.1 66.9 68.0 68.8 69.8 70.0 67.7 67.7
Young transitionals 67.5 63.8 65.5 64.1 65.7 66.4 65.7 65.9 67.4 68.0 67.9 67.8
Independent singles 52.7 50.8 52.5 51.5 56.3 57.7 58.0 58.0 58.6 58.7 56.6 53.3
Established couples 63.0 61.8 62.6 61.9 65.3 66.7 66.7 67.4 67.6 67.4 65.6 65.6
Senior couples 61.5 68.0 68.4 68.2 68.5 71.6 71.0 72.3 73.6 73.2 70.5 67.4
Nielsen ‘Brand Health Report’ data on avocado consumption
The table also shows the market penetration by demographic groups defined by Nielsen in their reports. This
data indicates that the penetration is relatively even across the different demographic groups, that
penetration in most of the demographic groups has increased over the period spanned by the reports and that
rises and falls in penetration are moderately well correlated between the demographic groups.
Consumer Expenditure on Avocados
Analysis of the value of avocados consumed in Australia is constrained by the availability of consistent, long–
run data on prices of avocados in the domestic market and the volume of sales. Since 2007, AAL has
maintained a series of retail prices collected on a weekly basis from a range of retail outlets in Brisbane,
Melbourne, Sydney and Perth. The series provides average per unit price of avocados throughout the year.
The information can be used to estimate the value of consumption of avocados but, for analytical purposes, is
difficult to match precisely to consumer purchase volumes.
The graph below depicts the increase in total real value of consumption and real value of per capita
consumption over the period from 2006-7 to 2012-13 expressed in 2012-13 dollar values. Over the period,
total real value of consumption increased on average by 9.7% per annum. Over the same period, real value of
per–capita consumption increased by 7.8% per annum.
20Real per–capita expenditure and total value of consumption (2012-13 $ values)
Investment in Promotion
Promotion of avocados takes place at a number of levels; by retailers, sometimes in conjunction with industry;
by packers and wholesalers; by food service industry businesses; and by industry organisations. There is no
comprehensive data on the amount of money invested in marketing and promotion by these industry
participants. This limits the capacity for analysis to shed light on the financial returns derived from these
investments.
The annual, Avocado Industry Report published by HAL set out the investment of industry marketing levies
through marketing ‘levy programs’. While these programs represent only a portion of the total industry
investment in marketing and promotion, they report the expenditure on industry funded marketing which
forms a substantial part of the generic promotion of avocados across Australia. The table shows the
investment through HAL in levy funded marketing programs for the avocado industry.
Expenditure on
marketing 'Levy
Year Programs'
2003/4 $952,745
2004/5 $491,575
2005/6 $898,172
2006/7 $990,674
2007/8 $1,572,707
2008/9 $1,905,162
2009/10 $1,837,262
2010/11 $1,692,422
2011/12 $1,887,093
2012/13 $2,477,098*
* Budgeted amount
Annual expenditure on levy funded avocado marketing programs
21DEMAND FUNCTION ESTI MATES FOR AVOCADOS
In this section we analyse the relationships between factors effecting demand for avocados in Australia and
the quantity of the product purchased in the domestic market. Estimation of the demand function for
avocados is an important analytical tool. Although estimation of the demand relationships is not the central
purpose of this project, the estimates are important in assisting the industry to make a judgement on whether
investment in developing export markets will offer a better financial return than additional investment in
marketing and promotion in the domestic market and the impact on the domestic market of diverting fruit
from the domestic market into exports.
The analysis seeks to answer two questions:
What is the relationship between price of avocados and the quantity purchased by consumers in
Australia?
To what extent does advertising and promotion influence demand for avocados in the Australian
market?
Estimating the response of avocado demand to expenditure on promotion would enable us to estimate the
return from investment in marketing and promotion by the industry. This would provide a benchmark against
which to compare the expected returns from investment in export market development.
The relationship between price of avocados and the quantity purchased sheds light on the outlook for avocado
producers as more supply comes on–line from currently immature trees, as well as to estimate the likely
impact on the domestic market of developing and supplying export markets. Increased supply of fruit to the
domestic market will, in the absence of other changes, cause the price of avocados to fall. If product is
diverted from the domestic market into exports, this will apply upward pressure on the price in the domestic
market (subject to complementary increases in imports from New Zealand or other markets). Understanding
this relationship is important to estimating the benefits from export market development. The impact of
exports on the domestic price of avocados, in effect, spreads the benefit of the export market development
across the domestic industry, even to growers and others who are not directly engaged in the export market.
This price response is a significant contributor to the overall return from diversifying the sales of avocados into
export markets. Later analysis will endeavour to estimate this effect.
Response to Promotion
At this time we have insufficient information to make a conclusive finding about the relationship between
industry promotion of avocados and aggregate consumption. A detailed database of activity or expenditure on
advertising and promotion does not exist. Distinctions between retail advertising, point of sale promotion,
wholesale promotion and industry promotion are difficult to define, at least at the margins, and the effects can
be complementary. Industry promotion through HAL commenced in 2003/4, but the extent to which this
supplemented promotion by other industry participants, or replaced or added to pre–existing industry
advertising and promotion, is not clear. Further, records of the HAL promotion programs are also not
sufficiently detailed to identify the nature, location and timing of the impact of the programs on consumers.
Without information of this type, it is not possible to estimate the relationship between spending within these
programs and shifts in domestic avocado consumption. It is also likely that there are complex lags between
promotion programs and the consumption response which need to be evaluated over a relatively long period
in order to obtain sufficient observations from which to calculate statistically significant estimates of the
relationships.
22Estimating the Effect of Exports on Domestic Prices
When avocados are exported there is less fruit available for the domestic market which will cause domestic
prices for avocados to increase. To assess the net impact that exports have on the avocado industry, we must
add the effect of an increase in domestic prices to the gross value earned from export sales. To assess the
increase in value of domestic sales when avocados are exported instead of sold domestically, we must
estimate how domestic prices respond to changes in the supply of avocados. In economics this relationship
between the quantity of a product sold and its price is called the price elasticity of demand (ED). The (ED) is
defined as:
ED = Change in quantity sold
Change in price
The ED for avocados can be estimated by analysing how prices have responded to changes in the availability of
avocados over a period of time, after isolating the impact of other factors that might influence consumer
demand for the fruit such as the changing seasons and increases in population.
Fragmented availability of data on avocado prices and quantities sold effect the ability to calculate a reliable
estimate the ED for avocados in Australia. Data from two sources were tested to determine whether a
satisfactory estimate of the ED could be calculated. These were supermarket sales data obtained from HAL
and product dispatches and average retail prices collected by AAL. The analysis of the data from these two
sources is discussed below.
AAL dispatch and retail price data
AAL provided data for the period from 2008 to 2013 on product dispatches, imports, and exports and average
capital city retail prices. Estimates of total quantity of avocados sold domestically were made by subtracting
from total dispatches by Australian producers the quantity sold for export and adding imports.
These consumption estimates were analysed against the monthly retail price trend estimates prepared by AAL,
which are an average of Brisbane, Melbourne, Perth and Sydney retail prices collected in a weekly survey of a
range of retail outlets.
An adjustment was made to the data for the lag between dispatch of product from packing sheds and retail
sale. A seasonal variable was introduced to reflect the shift in demand between seasons, and avocado prices
were adjusted to remove the effects of inflation. Notwithstanding these adjustments, a sufficiently reliable
estimate of the demand relationship could not be calculated. Retail prices and seasonal shifts in demand
explained only around 40% of the variation in the quantity sold from month to month. It is likely that a
monthly average price is not sufficiently flexible to capture the adjustments to market prices that occur in
response to factors such as weather and the continuous rise and fall in the volume of fruit dispatched from
packing sheds on a daily basis.
Supermarket scan data
Two sets of supermarket sales scan data compiled by The Nielsen Company were obtained from HAL. These
data sets, one for the period 2008 to 2010 and the other from 2011 to 2013, are not contiguous and are
compiled on different bases. The scan data is a series of weekly records of average avocado prices charged by
Woolworths’ supermarkets and the total number of fruit sold by the Woolworths group across Australia.
Nielsen report that Woolworths’ share of retail avocado sales is currently around 23% of total, fresh, whole,
fruit sales (This market share has fallen from around 30% in 2011). A sample of this magnitude and geographic
distribution is sufficiently robust to reasonably represent consumer behaviour the aggregate relationship
between avocado prices and sales volume. To isolate the relationship between price and quantity sold we
23must also account for the impact of other factors that influence avocado sales, such as seasonality, population
increase, changes to household income and expenses that influence food buying patterns and inflation. The
extent to which each of these factors influence purchases can be expressed as a mathematical equation
usually called a demand function.
The demand function which we estimated can be written as:
Quantity sold = Constant + ƒ real price + ƒ population + ƒ real household food expenditure + ƒ season,
where ƒ is the coefficient of each variable in the equation. From this equation we can isolate the relationship
between price and quantity sold and use this to estimate the effect which exports have on the aggregate value
of domestic avocado sales.
The reported prices were inflated by the Consumer Price Index (all groups, all capital cities) so that all prices
are expressed in constant (2013) value terms. A seasonal variable was introduced to reflect the shift in
consumption patterns through the year. Estimates of national household expenditure on food, derived by the
Australian Bureau of Statistics (ABS), were used as measure of movements in the average household food
budget, within which consumers make decisions whether to purchase avocados. The ABS estimate of the
increase in Australia’s population was used to capture the impact of rising population on consumption of
avocados. The two series available to us (2008-10 and 2011-13) were analysed both separately and as a
combined series comprising 212 observations. No statistical difference was found between the series
indicating that the joint analysis would not bias the results of the analysis.
An annual variable was tested to determine the impact of changes in quality, origin, type and underlying
demand for avocados from year to year. The annual variable was found to be not significant in explaining
changes on consumption of avocados.
Aspects of these data series limit their ability to explain movements in avocado purchases by consumers. The
frequencies of the observations are not uniform—the price and quantity series are weekly observations, while
the CPI, population and household food expenditure series are quarterly observations. The original prices
supplied by Woolworths’ are averages that do not account for specials, local competition or differences in fruit
size quality or origin. While Woolworths’ have a substantial market share in supply of fruit and vegetable, the
volumes sold at any given price may not be representative of the retail market as a whole and there is likely to
have been movements in Woolworths’ market share of avocado sales during the period under observation.
Statistical estimation of the above demand function was moderately successful in describing the variation from
week to week in the quantity of avocados sold. The coefficient of each of the variables was statistically
significant, indicating that each variable contributes to explaining changes in consumption of avocados.
However, only 65% of the variation in sales is explained by the terms of this demand function. The remaining,
unexplained variation is due to the deficiencies of the data outlined above, random variation in consumer
demand and other variables for which we do have appropriate data.
The table below contains the coefficient of each of the variables calculated in the regression analysis. The sign
of each coefficient is as would be expected—the price coefficient is negative (if price is increased, sales
quantity falls), the coefficients of population and food expenditure are positive (as population and household
food expenditure increase, sales of avocados increase), each of the season coefficients are negative (demand
at any given price is less in Autumn, Winter and Spring than in Summer).
24You can also read