RENAL SERVICES AT ST HELIER AND ST GEORGE'S HOSPITALS - PRE-CONSULTATION BUSINESS CASE
←
→
Page content transcription
If your browser does not render page correctly, please read the page content below
RENAL SERVICES AT ST HELIER
AND ST GEORGE’S HOSPITALS
PRE-CONSULTATION BUSINESS CASE
NHS South West London Clinical Commissioning Group
3rd Floor
120 The Broadway
London SW19 1RH
https://swlondonccg.nhs.uk                                                                             Error! No text of specified style in document.

Renal services at St Helier and St George’s Hospitals Error! No text of specified style in document.
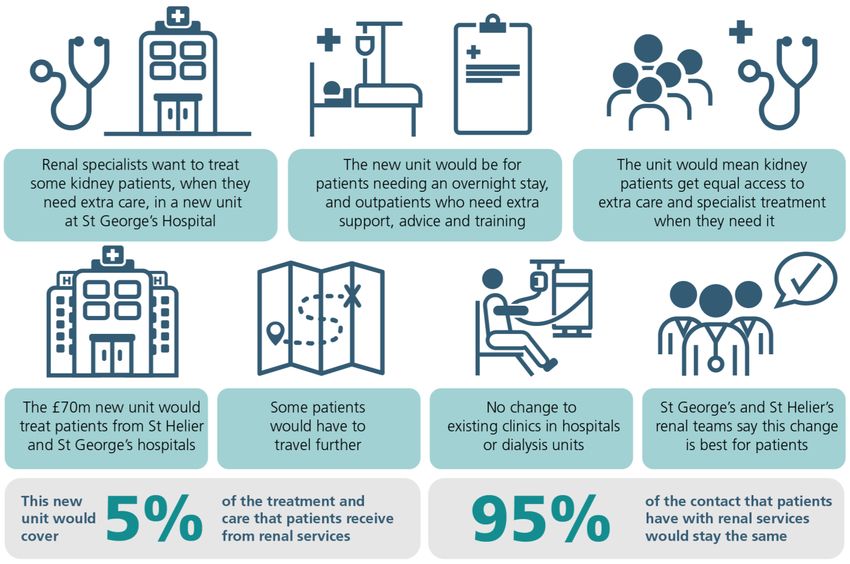
Executive summary
The NHS is making a proposal to improve care for the patients with renal (kidney) conditions that they currently
treat at St Helier Hospital (run by Epsom and St Helier University Hospitals NHS Trust) and St George’s Hospital
(run by St George’s University Hospitals NHS Foundation Trust). The South West London Clinical Commissioning
Group (CCG) is leading this proposal on behalf of the local NHS through the CCG’s role as the statutory body,
providing the appropriate support, governance and oversight.
Renal clinicians recommended this change in 2020 during the Improving Healthcare Together (IHT) consultation for
the new specialist emergency care hospital which will open in Sutton later this decade. Under the IHT plan, some
renal care currently provided at St Helier hospital would move to the new hospital in Sutton. This proposal’s
preferred option is that instead, this renal care would take place in a brand-new specialist unit at St George’s as
part of a consolidated service with the current St George’s unit.
This proposal mostly affects admissions for planned or unplanned overnight care (inpatients). A small number of
outpatient appointments, and some dialysis training services, are also affected. In total this affects less than 5% of
contacts with renal patients provided by the two units.
Inpatient examples of the services affected include patients needing:
• Renal and vascular access surgery
• Transplants
• Stabilisation and treatment following an acute kidney injury
Outpatient examples include:
• Additional support in early stages of dialysis care
• Additional advice and training to support home therapy
Inpatient care would take place in a new purpose-built renal unit at St George’s Hospital in Tooting with over 70
beds, 14 day care beds and 24 dialysis stations. The new unit will also have access to around 15 dedicated theatre
sessions within St George’s Hospital. All regular outpatient appointments will continue in local hospitals or at
St Helier or St George’s hospitals. Dialysis will continue to be provided in local clinics or at home.
The renal clinicians believe the St George’s option offers better care for patients; the same access to top-quality
care regardless of where patients live; and makes the best use of new investment in buildings, technology and
equipment.
The purpose of this pre-consultation business case (PCBC) is to:
1. Set out the aims of the proposal alongside the current geographical spread and demography of renal patients,
   and the services and care they receive via St Helier and St George’s teams
2. Explain the clinical case for change including a range of challenges facing the renal service and, importantly, the
   lessons of providing effective planned and unplanned care during COVID-19
3. Provide information on how the clinical model has been developed, which includes activity and financial
   modelling, refining options, engagement to date and the impact assessment, including travel and transport and
   the impact upon people with protected characteristics
4. Describe our approach to engagement with patients, public, partners and stakeholders to date and in the future
5. Detail the clinical model including the overall vision for renal services, expected benefits for patients and the
   identified risks and dependencies of the model
6. Illustrate the numerous stages and considerations taken during the options appraisal to move from a long list to
   a short-list through to the preferred option
7. Show the detailed financial appraisal including affordability for providers, the wider system and commissioners
8. Explain the approval process including governance, scrutiny and regulatory requirements
9. Set out the next steps and recommendations.
As the PCBC makes clear, our clinicians’ preferred option, which is to consolidate the two renal units, would see no
change for 95 percent of the services’ contacts with renal patients, with all regular outpatient appointments
continuing to take place in local hospitals and dialysis provided in local clinics or at home.
Given the scope of the changes, it is important that subsequent engagement is clearly focused at reaching, and
hearing from, existing renal patients, their families and carers. We also plan, as is set out in the engagement
section, to follow best practice and make sure NHS colleagues and partners, stakeholders, wider communities and
representative groups all have the opportunity to share their views.

Renal services at St Helier and St George’s Hospitals Error! No text of specified style in document.
Contents
Executive summary                                                                                      3

1                  Introduction and background                                                         7

1.1                Aims of the pre-consultation business case                                           7

1.2                Geography and demographics of the region                                             8

1.3                Strategic priorities                                                                10

1.4                Current service provision                                                           12

2                  Case for change                                                                     14

2.1                Epidemiology and public health challenges                                           15

2.2                Clinical challenge                                                                  18

2.3                Workforce challenges                                                                19

2.4                Estates challenges                                                                  19

3                  Developing the clinical model                                                       21

3.1                Process to develop clinical model                                                   21

3.2                Process to develop finance and activity model                                       22

3.3                Process for options development                                                     23

3.4                Process to refine options and evaluate short list                                   24

3.5                Pre-consultation engagement                                                         25

3.6                Impact assessment                                                                   25

3.7                Decision-making process                                                             30

4                  Clinical model                                                                      31

4.1                Scope and vision                                                                    31

4.2                Overview of proposed clinical model                                                 31

4.3                Outreach                                                                            32

4.4                Vascular access                                                                     33

5                  Appraisal of options to deliver clinical model                                      34

5.1                Long-listed options and appraisal against the CSFs                                  34

5.2                Short-listed options                                                                38

5.3                Appraisal of the short list                                                         38

Renal services at St Helier and St George’s Hospitals Error! No text of specified style in document.
                                                                                                        4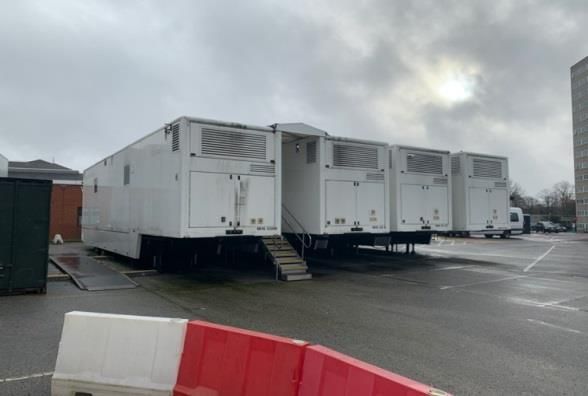
5.4                Qualitative benefits appraisal                                                               38

5.5                Economic appraisal                                                                           42

5.6                Clinical benefits of the preferred option                                                    46

5.7                Research                                                                                     51

5.8                Conclusion                                                                                   52

6                  Engagement                                                                                   54

6.1                Our approach to public and patient participation                                             54

6.2                Identifying stakeholders                                                                     54

6.3                Engagement tools                                                                             55

6.4                Engagement undertaken                                                                        55

6.5                Key themes from engagement                                                                   56

6.6                Planned future engagement                                                                    56

7                  Implementing the preferred option                                                            57

7.1                Delivery model for the preferred option                                                      57

7.2                Strategic risks, constraints and dependencies                                                59

7.3                Impact of COVID-19                                                                           61

8                  Financial appraisal                                                                          62

8.1                System/commissioner affordability                                                            62

8.2                Provider affordability (summarised from BYFH OBC)                                            64

9                  Approval process                                                                             68

9.1                Governance and decision-making                                                               68

9.2                Regulatory tests                                                                             70

9.3                Clinical senate review                                                                       71

9.4                Overview and scrutiny                                                                        78

10                 Next steps and recommendation                                                                79

Appendix 1 - Summary of current sites providing renal treatment, care and support related to St Helier and St
George’s hospitals

Renal services at St Helier and St George’s Hospitals Error! No text of specified style in document.
                                                                                                                 5
Document control
Document information
 Property

 Owner

 Status              Draft

Revision history
 Version             Date                    Description

 0.1–0.4             05/04/2021              Initial versions

 0.5                 06/04/2021              Initial draft shared for feedback

 0.6                 08/04/2021              Responding to initial feedback

 0.7                 09/04/2021              Initial review by JB ahead of CSG and RRDG review

 0.8                 10/04/2021              Executive summary from SW and feedback and edits from ML

 0.9                 13/04/2021              Responding to feedback from JB, ML and RM

 0.10                14/04/2021              Feedback and edits from CG and FT

 0.11                14/04/2021              Restructuring of some top-level sections; edits to S3.6

 0.12                15/04/2021              Draft for provision to Clinical Senate

 0.13                18/04/2021              SRO review pre Clinical Senate

 0.14                21/05/2021              Addition of S8.1 on system/commissioner affordability

 0.15–0.21           07/06/2021 –            Amendments following Clinical Senate review
                     10/06/2021

 Draft               11/06/2021              JB review in advance of CSG
 Final

 Final               16/06/2021              Final comments from CSG and CiC convenor

Document sign-off
 Approver/governance body                                                                               Date

Renal services at St Helier and St George’s Hospitals Error! No text of specified style in document.
                                                                                                               6
1        Introduction and background

 This pre-consultation business case (PCBC) builds on the Improving Healthcare Together decision-making
 business case (July 2020) and the outline business case developed by Epsom and St Helier University Hospitals
 NHS Trust and St George’s University Hospitals NHS Foundation Trust for a new facility for renal services
 (December 2020).
 The decision to relocate renal services currently provided at St Helier Hospital to Sutton was taken by
 commissioners as part of IHT. This PCBC re-examines the location of future services and proposes a
 consolidated service at St George’s Hospital to provide a better quality service with better outcomes.
 In this section, we:
 •    Describe the aims of this PCBC
 •    Show how it builds on previous work
 •    Describe the geography and demographics of the main population served
 •    Outline the strategic priorities for renal services for the population
 •    Set out how services are currently provided

1.1 Aims of the pre-consultation business case
This pre-consultation business case (PCBC) has been prepared on behalf of NHS South West London CCG, NHS
Surrey Heartlands CCG, NHS Frimley CCG and NHS England Specialised Commissioning. It relates to renal
services provided by Epsom and St Helier University Hospitals NHS Trust (ESTH) and St George’s University
Hospitals NHS Foundation Trust (SGUH).
The work on this PCBC has been undertaken by the Renal Reconfiguration Delivery Group, which comprises
members of staff from the lead commissioner and providers involved.
Figure 1: Governance bodies

The PCBC has been developed following a previous PCBC and consultation prepared by the Improving Healthcare
Together (IHT) programme. This programme was initiated to address sustainability challenges in six acute hospital
services operated by Epsom and St Helier University Hospitals NHS Trust. As part of the consultation on proposals
to address these challenges, a further potentially beneficial change in relation to renal services was identified. This
PCBC explores this potential change in greater detail.
The geography in scope is South West London and Surrey, particularly Surrey Heartlands and Frimley, see Figure
2 below.

Renal services at St Helier and St George’s Hospitals Error! No text of specified style in document.
                                                                                                                      7
Services in scope are:
• Inpatient renal services currently provided at St Helier Hospital including vascular access
• Related outpatient services (only those provided at St Helier Hospital)
• Services provided to St Helier renal unit patients at St George’s Hospital (for example transplantation)
• Home haemodialysis training provided at St George’s Hospital
Services that are out of scope (on the basis that these remain unchanged in all options):
• Renal outpatient services provided at District General Hospitals
• Renal dialysis services
• Provision at Frimley Hospital
1.1.1 Building on previous work
Improving Healthcare Together 2020–2030 programme
The IHT PCBC concluded that the preferred option to address sustainability challenges at ESTH was to build a
new specialist emergency care hospital (SECH) at the Sutton Hospital site, whilst retaining district hospital services
at Epsom and St Helier hospitals. This proposal was put to consultation as a preferred option, and subsequently
became the recommendation for a decision-making business case (DMBC) which was presented to and agreed by
South West London CCG and Surrey Heartlands CCG at a Committee-in-Common meeting in July 2020.
It was agreed that renal inpatient services provided by ESTH would move from St Helier to Sutton,
alongside other acute hospital inpatient services.
The clinical leadership of ESTH and SGUH’s renal services submitted a formal response to the IHT programme
proposing that some renal services across the geography should be brought together onto one site. In their letter,
the divisional medical directors and divisional director of nursing at Epsom and St Helier, and the care group lead,
surgical lead, head of nursing and clinical director at St George’s, made a statement of support for a joint renal unit:
“We have been recently appointed by both trusts as the lead clinicians for renal services and as the newly
appointed clinical leaders we are firmly convinced that we could make a further step change in improving the
care we offer if we could formally combine forces and locate all our tertiary renal medical and surgical practice in
one new purpose built facility… We are of the view that the right place for a combined renal service should be at
St George’s.”
ESTH and SGUH outline business case
Following the IHT consultation, local commissioners requested that the trusts specifically undertake a further
appraisal of the options for renal services between ESTH and SGUH. The trusts examined the options in an outline
business case, which was then included in the overall ‘Building Your Future Hospitals’ OBC submitted to national
regulators in December 2020.
In line with the statement made by clinical leaders during the IHT consultation, the trusts have in the OBC
considered centralising core acute renal activity (inpatient and day case activity) at St George’s, whilst continuing to
provide the more regularly accessed chronic outpatient and haemodialysis services from a range of locations
closer to patients’ homes. This has been endorsed by the trusts’ boards and commissioners are now considering
this proposal, the first stage of which is this pre-consultation business case.
1.2 Geography and demographics of the region
Epsom and St Helier University Hospitals NHS Trust (ESTH) and St George’s University Hospitals NHS Foundation
Trust (SGUH) provide two sub-regional renal services, covering a combined population of c 2.7 million across
South West London and Surrey. Services are provided more widely to people living in other parts of the South of
England, but predominantly Berkshire and Sussex, and we consider the patients currently attending the two trusts
in the PCBC Impact Analysis, summarised in Section 3.6.
Renal services at St Helier and St George’s Hospitals Error! No text of specified style in document.
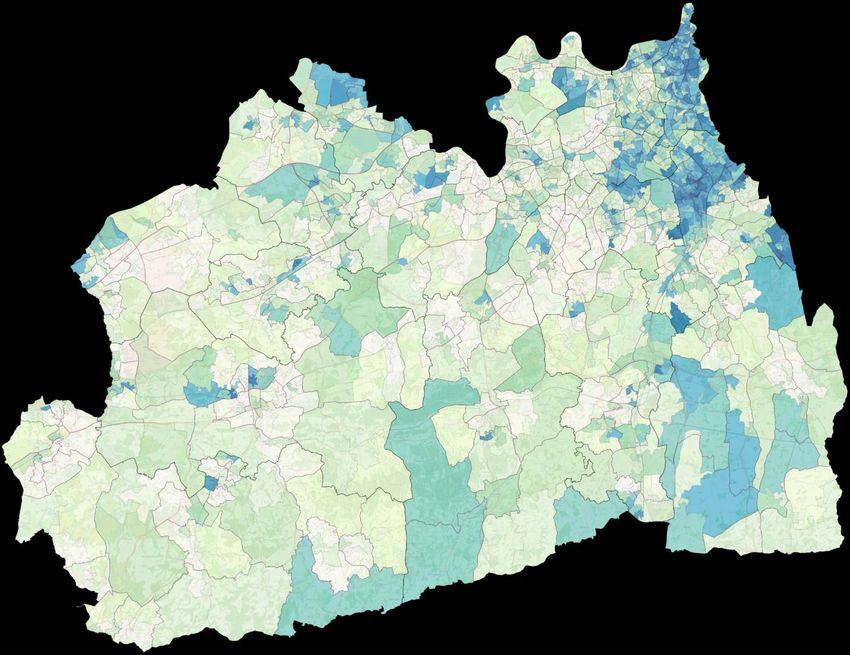
8Figure 2: Geography in scope, showing main hospitals deciles of deprivation (source: IMD Explorer 2019 1)
Key: deciles of deprivation Guy’s and St Thomas’
Royal Marsden
King’s College
Queen Mary’s
⚫ St George’s
Kingston
St Helier
Ashford and St Peter’s Croydon
⚫ Sutton
Epsom
Frimley Park
Royal Surrey
Surrey and Sussex
1.2.1 Population growth and older age
The population of England is growing at the fastest rate since the 1960s, increasing by an average by 0.5% each
year. The age group growing the fastest is people aged 85 years and older, who represent 2% of the population
compared to just over 1% in 1982.2 The Office for National Statistics (ONS) calculates that all regions in England
are projected to see growth in people aged 65 and over by mid-2028.3
Table 1 shows the total growth and growth in population aged 65 and over between 2020 and 20304 for South
West London and Surrey. To maintain consistency with the BYFH OBC demand and capacity modelling, the future
date shown is 2030.
Table 1: Estimated population growth per LA 2020–2030
Local authority 2020 2030 Growth 2020– 2020 % of 2030 %
population population 2030 (%) population population
estimate estimate over 65 years over 65 years
Croydon 387,684 395,236 1.9% 14.1% 17.9%
Sutton 206,866 214,055 3.5% 15.4% 17.7%
Merton 206,431 206,979 0.3% 12.9% 15.8%
Richmond upon Thames 198,843 204,086 2.6% 16.1% 19.9%
1 IMD Explorer 2019, Ministry of Housing, Communities and Local Government
2 Aging and mortality in the UK, Dunnell, Popul Trends, Winter 2008;(134):6-23
3 Subnational population projections for England: 2018-based, Office for National Statistics, 24 March 2020
4 UK population pyramid interactive and Population projections for local authorities: Table 2, Office for National
Statistics
Renal services at St Helier and St George’s Hospitals Error! No text of specified style in document.
9Local authority 2020 2030 Growth 2020– 2020 % of 2030 %
population population 2030 (%) population population
estimate estimate over 65 years over 65 years
Kingston upon Thames 177,731 183,724 3.4% 14.1% 16.8%
Reigate and Banstead 149,936 157,050 4.7% 18.3% 21.0%
Guildford 148,940 149,232 0.2% 16.8% 19.4%
Elmbridge 137,027 137,164 0.1% 18.8% 22.8%
Waverley 126,137 127,749 1.3% 22.3% 25.6%
Crawley 113,531 116,411 2.5% 13.7% 16.7%
Spelthorne 99,813 100,809 1.0% 18.7% 21.5%
Runneymede 89,096 91,980 3.2% 16.9% 18.8%
Tandridge 88,285 91,427 3.6% 20.1% 24.0%
Surrey Heath 88,983 88,384 -0.7% 20.1% 23.7%
Mole Valley 87,095 87,101 0.0% 23.9% 28.4%
Epsom and Ewell 80,555 82,756 2.7% 18.5% 20.8%
1.3 Strategic priorities
1.3.1 Local strategic context
Over the last decade, commissioners and speciality leaders have encouraged collaboration between renal
services.
The South London Renal Clinical Alliance (SLRCA) was established with the aim of driving transformation and
collaboration in kidney care in South London and Surrey. The RCA comprises:
• Guy’s and St Thomas’ NHS Foundation Trust
• King’s College Hospital NHS Foundation Trust
• Epsom and St Helier University Hospitals NHS Trust
• St George’s University Hospitals NHS Foundation Trust
• Commissioning bodies – CCGs and NHS England/Improvement
• KQuIP
SLRCA is collaborating to deliver a high-quality, sustainable renal system in South London and Surrey – prioritising
areas such as growth in renal transplant, vascular access and supportive care. This follows an approach, which
has been successful in other areas in England, of substantially increasing collaboration and consolidating services,
designing new clinical models that deliver the highest quality acute and specialist renal care centrally, with
enhanced outreach renal services supporting primary and community care.
There has been increasingly closer collaboration between the ESTH and SGUH renal units. The consultant teams
from both trusts also work closely together, including holding joint management meetings. As outlined above, the
two trusts work together to deliver surgical services at St Helier Hospital, and transplant nurses from both trusts are
already working closely together.
There are now further drivers for deeper collaboration between ESTH and SGUH
ESTH and SGUH are increasingly collaborating across a range of clinical and non-clinical services, including via
the SWL Acute Provider Collaborative. The two organisations now have a chair in common, which both see as an
opportunity to deepen the partnership between the two organisations further in order to deliver better clinical
quality, outcomes and patient experience for our local population
Both trusts see collaboration as strategically important. One of the four pillars of SGUH’s strategy, published in
April 2019, is ‘closer collaboration’ with other parts of the health system. Additionally, ESTH have identified closer
collaboration with SGUH as a key part of their five-year trust strategy published in September 2020.
Renal services at St Helier and St George’s Hospitals Error! No text of specified style in document.
10With the development of the IHT/BYFH programme, now is the opportunity to consider how renal services
should be best delivered to patients in SWL and Surrey
The decision to consolidate inpatient services at the Specialist Emergency Care Hospital has already been taken.
This is a once in a generation change in clinical services and presents a unique opportunity to ensure that renal
services across South West London and Surrey are configured to best meet patient need. By assessing the options
for the future provision of inpatient renal units, we can make sure that capital is deployed in the most effective way
to ensure renal services are sustainable and high quality into the future.
The proposal is also consistent with messages from previous patient engagement undertaken in South London,
though further patient engagement would be required to progress the proposal. For instance, in 2017, NHS
England held a patient engagement event on the future of renal services in South London, and found support for
the principle of consolidating vascular access surgery services, with patients prepared to travel for what is generally
a ‘one-off’ event if outcomes are improved5 This investment will centralise vascular access surgery on a single site.
It is also an opportunity to not just address the significant estates challenges at ESTH, but to also address the
estates challenges at SGUH, including services that are delivered from temporary facilities, or from sites that are
over 60 years old.
1.3.2 Strategic objectives
Strategic objectives were agreed by commissioners and the trusts’ boards for use both for agreeing the clinical
model and in evaluating the options to deliver it in the trusts’ strategic outline case and outline business case.
Table 2: Strategic objectives
Strategic objective
1. To improve patient care, experience and safety, by:
Improving the estate and environment from which acute renal services are currently provided
Bringing together the strengths of both services, reducing health inequalities that result from patients living in
the catchment area of one provider rather than the other
Co-locating both acute inpatient and day case services with key associated acute services such as 24/7
interventional radiology and cardiology
Improving patient flow by creating a larger and more efficient unit
Improving patient experience by providing co-located facilities improving accessibility and supporting a
seamless pathway
Providing dedicated space for home therapies
2. To deliver a more financially sustainable service, by achieving economies of scale both in the utilisation of the
estate and the provision of services. This will include medical, nursing and managerial workforce efficiencies.
3. To increase opportunities for research and education/training with the new centre benefiting from a
concentration of patients and diversification of case mix.
4. To create a sustainable workforce by removing silo/isolated working resulting from services being spread
across more than one location (SG); and increasing opportunities for nurse training with the new centre
benefiting from close proximity to St George’s, University of London, ultimately improving staff wellbeing,
recruitment and retention.
5Renal services patient workshop 26 June 2017 key notes, South London Specialised Services Transformation
Programme, NHS England
Renal services at St Helier and St George’s Hospitals Error! No text of specified style in document.
111.4 Current service provision
The IHT DMBC determined that inpatient renal services currently provided at St Helier Hospital would be
relocated to a future facility at Sutton. Therefore, from the perspective of this PCBC, Sutton is the baseline
or “current” location. We summarise below the existing services and facilities.
The current provision of renal services is outlined in Table 3 below:
Table 3: Summary of service provision and facilities at the two hospitals
Trust Service provision Facilities
St George’s • Inpatient nephrology • 18 inpatient nephrology beds, with an additional 5 beds of
Hospital (including acute activity to account for outliers and 85% occupancy
haemodialysis, acute • 5 acute dialysis beds within the renal ward and next to the
kidney injury, vascular inpatient beds
access surgery and • 6 dialysis stations within a trailer, separated from the renal ward
transplantation) • No day care beds
• Home haemodialysis • Surgical theatres – not dedicated; access to c.4–5 regular
and peritoneal dialysis theatre sessions per week and use of the CEPOD emergency
• Outpatient acute and theatre list as required
chronic haemodialysis • 1 procedure room
• Outpatient clinics • Multiple outpatient consultations rooms
• 5 rooms/stations for PD and HD patients training and
assessment
• Renal technicians’ workshop
• Multiple administration offices (consultants, junior doctors,
specialist nursing, support staff, admin and management)
• Use of c.3–4 interventional radiology sessions per week
St Helier • Inpatient nephrology • 45 inpatient nephrology beds (also used for acute dialysis)
Hospital (including acute • 9 day case beds
haemodialysis, acute • Surgical theatres – not dedicated to renal, and typically using
kidney injury and c.4–5 theatre sessions per week
vascular access surgery) • 1 procedure room
• Home haemodialysis • 7 outpatient consultations rooms
and peritoneal dialysis • 11 rooms/stations for PD and HD patients training and
• Outpatient acute and assessment
chronic haemodialysis • Administration offices (consultants, junior doctors, specialist
• Outpatient clinics nursing, support staff, admin and management)
• Renal technicians’ workshop
• The renal research institute,
• Use of c.3 interventional radiology sessions per week
ESTH does not provide any surgical services for renal except those provided in conjunction with SGUH, such as
vascular access surgery which is provided by SGUH clinicians at St Helier Hospital. In 2018 ESTH opened an
inpatient ward at Frimley Park Hospital which provides a consultant-led service for inpatient nephrology and acute
dialysis. Both ESTH and SGUH also provide a number of other services away from St Helier and St George’s
Hospitals in local hospital and community settings. These include outpatient clinics, dialysis satellites for chronic
dialysis patients and nephrology support to other hospitals treating renal patients.
The activity provided by both trusts within hospital inpatient renal services is outlined below. Note, this excludes
activity within the community (e.g. dialysis satellites) delivered by each ESTH and activity carried out at/by other
providers, which is out of scope for this business case and not changed by this investment. The in-scope column
indicates the activity that is in scope of the new renal unit and would therefore need to be provided for in the new
unit.
Renal services at St Helier and St George’s Hospitals Error! No text of specified style in document.
12Table 4: Summary of activity
ESTH SGUH
Activity Activity
Total Activity Total Activity
in scope in scope
PODs TFC renal in scope renal in scope
for new for new
activity (%) activity (%)
unit unit
Adult day case dialysis 167,546 7,487 4% 73,652 7,729 10%
Adult day case other 2,445 2,445 100% 1,096 204 19%
EL adult inpatient 512 509 99% 292 292 100%
Nephrology
NEL adult inpatient 1,076 1,068 99% 500 500 100%
Outpatient first 2,589 237 9% 973 973 100%
Outpatient follow-up 32,485 8,284 26% 4,523 4,523 100%
Outpatient first – virtual 595 0 0% 0 0 NA
Outpatient follow-up – virtual 564 0 0% 12 12 100%
Adult day case other 132 112 85% 121 121 100%
Transplantation
EL adult inpatient 153 151 99% 147 147 100%
NEL adult inpatient 0 0 160 160 100%
Outpatient first 1 1 100% 452 452 100%
Outpatient follow-up 1,249 1,249 100% 3,694 3,694 100%
TOTAL 209,345 21,544 85,622 18,807
Of the total ESTH renal activity likely to be affected, approximately 39% is commissioned by SWL CCG, 31% is
commissioned by Surrey Heartlands CCG, 14% is commissioned by NHSE Specialist Commissioning with the
remaining number commissioned by other CCGs. Table 5 provides a breakdown of activity by commissioner6:
Table 5: Split of ESTH inpatient renal activity by commissioner (2019/20 commissioner configuration)
Commissioner % activity % income
NHS Sutton CCG 13.5% 13.3%
NHS Merton CCG 4.4% 4.7%
NHS Croydon CCG 18.7% 19.1%
NHS Wandsworth CCG 0.2% 0.2%
NHS Kingston CCG 2.2% 1.7%
NHS Richmond CCG 0.1% 0.1%
Sub-total: NHS South West London CCG 39.1% 39.3%
NHS Surrey Downs CCG 9.2% 8.6%
NHS East Surrey CCG 5.2% 6.4%
NHS North West Surrey CCG 11.2% 11.2%
NHS Guildford and Waverley CCG 5.7% 4.7%
Sub-total: NHS Surrey Heartlands CCG 31.3% 31.0%
NHSE Specialised Commissioning 14.2% 14.9%
NHS North East Hampshire and Farnham CCG 3.9% 2.5%
NHS Crawley CCG 3.8% 5.0%
Others 7.7% 7.2%
Total 100% 100%
6NHS South West London CCG and NHS Surrey Heartlands CCG were both created from mergers of previous CCGs in April
2020; NHS North East Hampshire and Farnham CCG became part of Frimley CCG and merged with Surrey Heath and East
Berkshire in April 2021. North East Hants became part of Frimley CCG (merged with NHS Surrey Heath CCG and NHS East
Berkshire CCG) in April 2021. Crawley CCG became part of West Sussex CCG in April 2020.
Renal services at St Helier and St George’s Hospitals Error! No text of specified style in document.
132 Case for change
This section of the PCBC describes the case for change, why the change is needed, and the challenges
associated with the change. It also describes the challenges facing current renal care that the proposed
relocation will help address. The challenges are broken down as follows:
• Epidemiology and public health challenges: The national prevalence of chronic kidney disease has been
estimated at 5,167/100,000 population, a growth of 11.4% between 1990 and 2017. Around 630,000 people
in the UK are being treated for end stage CKD with 40–45,000 premature deaths per year. CKD is five times
more likely to affect black, Asian and minority ethnic communities. Major risk factors are uncontrolled
diabetes and hypertension.
• Clinical challenge: Patients from various parts of the region have unacceptable varying inequalities in their
treatment due to the differences between St Helier and St George’s hospital. This ranges from differences in
interventional radiology and vascular access, access to surgical input, out of hours cover, access to other
acute services,
• Workforce challenges: Neither service is as efficient as it could be, and as a result there is significant
opportunity to provide better services to patients. Neither hospital is big enough to be fully efficient meaning
there are inefficiencies staffing and rota planning, access to theatre, clinical research and training of staff
which would be address with a co-location.
• Estates challenges: The estate of both services has suffered from long term under investment, and as a
result the buildings are not fit for purpose and both services lack sufficient capacity for growth. The renal
services at St Helier Hospital are contain in portacabins which are over 30 years old and are beyond
economic repair. Whilst at St Georges Hospital the renal facilities are split over different wings of the hospital
as a temporary measure for historical reasons which is not operationally preferable and is unsustainable.
As outlined above, acute and specialist renal services provided by the two trusts are provided to the population of
South West London and Surrey, a geography spanning c.40 miles East to West and c.25 miles North to South, The
two hospitals are four miles apart. While there is close collaboration between the two units, there are three
significant reasons to explore how acute and specialist renal services could be delivered better:
1. Patients from different parts of the region experience variation in their NHS treatment
2. The estate of both services has suffered from exceeded its natural life and is of poor quality, and as a result
the buildings are not fit for purpose.
3. Neither service is as efficient as it could be, and as a result there is significant opportunity to provide better
services to patients
In addition to the local context, this business case has been informed by regional and national priorities for renal
services. These include:
• Service frameworks produced by the Department for Health and Social Care
• National service specifications and incentives (such as the best practice tariffs) incorporated into national
service specifications produced by NHSEI
• The Renal Association guidelines and best practice
• The priorities of the South London Renal Clinical Alliance
• The Getting It Right First Time (GIRFT) reports for each trust
In particular, these have highlighted two longstanding priorities that must be explored and delivered through a new
clinical model. These are:
1. Vascular Access: There is a national drive to increase the proportion of patients who receive dialysis treatment
via definitive access (either arteriovenous fistula (AVF) or arteriovenous graft (AVG)) to 85% 7. This is supported
by a Best Practice Tariff (BPT) whereby providers receive an increase tariff for dialysis treatment when they
achieve a rate of 80% of patients receiving dialysis via a functioning AVF or AVG 8. Currently both ESTH and
SGUH achieve 47% so there is significant opportunity for improvement. While nationally, the ability to achieve a
vascular access programme that meets these targets has proved difficult for almost all units, the intention of
both trusts is to be comparable to the best performing renal units.
2. Transplantation Surgery: There is a national drive to increase transplantation numbers by improving access to
transplant and where possible pre-emptive transplant, significantly reducing premature mortality from end stage
kidney disease and reliance on haemodialysis.
7Clinical practice guideline: vascular access for haemodialysis (6th edition) Renal Association, 2015
82019/20 National Tariff Payment System – a consultation notice: Annex DtD, NHS England and NHS
Improvement, January 2019
Renal services at St Helier and St George’s Hospitals Error! No text of specified style in document.
142.1 Epidemiology and public health challenges
2.1.1 Risk factors for kidney disease
The two key risk factors for chronic kidney disease (CKD) are diabetes and hypertension. GP-recorded prevalence
of each for the relevant area is as follows:
Table 6: Risk factors for chronic kidney disease
Area/CCG Diabetes Hypertension
mellitus
England 7.08% 14.10%
South West London 5.66% 10.57%
Surrey Heartlands 5.77% 13.22%
Frimley 6.78% 13.58%
Rates of diagnosis of diabetes – particularly T2 diabetes – are rising rapidly, with a high association with later-stage
CKD. T2 diabetes prevalence is also particularly associated with health inequalities and rates are higher in less
affluent, more deprived communities. All of the ICSs impacted by this proposed change have developed strategies
to prevent, identify and more effectively manage Type 2 diabetes in community settings and identify probable
complications such as CKD.
2.1.2 Chronic kidney disease
The national prevalence of chronic kidney disease (CKD) has been estimated at 5,167/100,000 population, a
growth of 11.4% between 1990 and 20179. Around 630,000 people in the UK are being treated for end stage CKD
with 40–45,000 premature deaths per year. CKD is five times more likely to affect black, Asian and minority ethnic
communities. Major risk factors are uncontrolled diabetes and hypertension. A study published in 2020 identified
that 44% of people with CKD may be undiagnosed10. In 2019/20, population prevalence of CKD (at stages 3–5) as
identified via the GP Quality and Outcomes Framework across South West London, Surrey Heartlands and Frimley
was as follows for the affected areas:
Table 7: Prevalence of chronic kidney disease in London and the South East
Area/CCG Prevalence
England 4.05%
London 2.41%
• South West London 2.34%
South East 3.93%
• Surrey Heartlands 3.75%
• Surrey Heath 3.00%
• North East Hants and Farnham 3.59%
• East Berkshire 3.50%
Although no recent studies are available, public health projections from 2014 suggested that CKD stages 3–5
would increase by c.1 million patients nationally (31%) between 2021 and 2026. Whilst this will not directly
translate into hospital activity, it does support the requirement for additional acute capacity to be put in place over
the coming years.
9 Global, regional, and national burden of chronic kidney disease, 1990–2017: a systematic analysis for the Global
Burden of Disease Study 2017, Lancet, February 2020
10 Prevalence of chronic kidney disease in the community using data from OxRen: a UK population-based cohort
study, BJGP 2020
Renal services at St Helier and St George’s Hospitals Error! No text of specified style in document.
152.1.3 The pathway into hospital-based renal care
NICE guideline CG182 (published in 2014) sets out the detailed clinical guidelines for the management of adult
chronic kidney disease. More recently, NICE have published interactive pathways 11 setting out the key factors to
consider in the identification, management and referral to specialist care for patients with CKD. Although it is not
possible to include these pathways in full here, the chart below summarises some of the key aspects of the NICE
advice.
Figure 3: Assessment and monitoring of chronic kidney disease
One of the key aims of the South London Renal Clinical Alliance is to develop virtual clinic models, which would
allow a patient to be managed proactively across the interface between primary and secondary care services
without repeated attendance at hospital-based clinics.
2.1.4 Renal replacement therapy
The proposal must consider the capacity of the renal services to accommodate the expected increase in demand
on the services due to the expected increase in people over 65 years old.
Chronic kidney disease (CKD) is associated with old age, 12 and according to John Hopkins University people over
60 are more likely to develop CKD than not.13 The UK Renal Registry (UKRR) for acute kidney injury (AKI) in
England for 201814 shows that of all the acute kidney injury episodes, 67% of them were in adults over the age of
65. Likewise, the Renal Association in their 22nd Annual Report of 2018 15 also showed the following regarding age
and renal care:
• Median age of renal replacement therapy patients was 64 years
• Median age of kidney transplant patients was 55.2 years
• Median age of in centre haemodialysis patients was 67.4 years
• Median age of patients on peritoneal dialysis was 64.3 years
• Median age of patients on home haemodialysis was 56 years
11 Assessment and monitoring of chronic kidney disease, National Institute for Health and Care Excellence
12 Kidney Health inequalities in the UK – An agenda for change, Kidney Research UK, 2018
13 Aging and kidney disease, National Kidney Foundation
14 Acute kidney injury in England, UK Renal Registry, 2018
15 22nd Annual Report: Data to 31/12/2018, UK Renal Registry, 2018
Renal services at St Helier and St George’s Hospitals Error! No text of specified style in document.
16Figure 4 (reproduced from work by NHS England 16) shows the trends in numbers of patients new to therapy
(incidence) and numbers of existing patients (prevalence) on renal replacement therapy (RRT) as at 31 December
of each year 2013–2017 (source: UK Renal Registry). The pool of prevalent patients will be affected by incidence,
mortality (or survival), withdrawal from treatment or patients moving to a different provider.
Overall, for both London and England, rates of increase for patients new to treatment (incidence) are the same as
rates of increase for existing patients (prevalence) indicating that patients are leaving the prevalent pool at the
same rate as numbers joining. Note that this is for all RRT (dialysis and transplant combined).
Figure 4: Patients on renal replacement therapy: Time trends in numbers and rates, London compared to England
Trends in Prevalent patients on RRT Trends in Incident patients on RRT
London and England London and England
1,300 160
1,200 140
120
1,100
100
1,000
80
900
60
800
Average annual change: 40 Average annual change:
London: 4%
700 London: 4%
England: 3% 20
England: 3%
600
-
2013 2014 2015 2016 2017
2013 2014 2015 2016 2017
London England
London England
Figure 5 (reproduced from work by NHS England16) shows existing patients on renal dialysis (all modalities) as at
31 December of each year 2012–2017. For South London as a whole, numbers of patients on dialysis are
increasing by an average of 3% per year. The prevalence rates are produced using the estimated catchment
populations for each provider as stated in the UKRR report. These catchment populations have not been updated
year to year so these rates do not capture the effects of underlying population changes. However, they are shown
here to be able to compare treatment rates per provider as well as absolute numbers. These show the trends in
renal dialysis growth are consistent between ESTH and SGUH units at c. 2% per year.
Figure 5: Patients on dialysis by provider: time trends in numbers and rates (UKRR 2018 report)
Trends in prevalent number of dialysis patients Trend in dialysis rates
By Provider and Year Prevalent patients per million population
UKRR Report 2018 By Provider and Year
1,200 UKRR 2018 report
Number of patients on dialysis as at 31st December
700
1,000
600
800
500
600
400
400
300
Catchment population (UKRR): Average annual change:
200 Guys: 1.13m Guys: 3%
Kings: 1.23m Kings: 3%
200 St George’s: 0.84m St George’s: 2%
0 ESH: 2m ESH: 2%
Guys Kings St.G ESH
South London: 3%
Average annual change: 100
Guys: 3%
2013 2014 2015 2016 2017 Kings: 3%
St George’s: 2% -
ESH: 2% 2013 2014 2015 2016 2017
South London: 3% Guys Kings St.G ESH S London
16 Predicting future numbers of dialysis patients in London, Croucher, NHS England, 2 October 2019
Renal services at St Helier and St George’s Hospitals Error! No text of specified style in document.
172.1.5 People living in deprivation
There is growing evidence to suggest that living in deprivation has an impact on developing CKD. Kidney Research
UK said in their 2018 report17 that the reason for this is because people living at the lower end of the social-
deprivation spectrum are more likely to:
• Develop CKD due to being exposed to the risks of developing CKD such as obesity, diabetes, and hypertension
• Progress faster through the stages of the condition leading to dying earlier of kidney failure
• Be diagnosed at a later stage of the disease due to lack of health literacy
• Receive worse outcomes as people in deprivation have worse survival rates related due to the lack of adequate
housing and space
In addition:
• Children born with a low weight are more likely to develop CKD later in life; more children are born with low
weight in socially deprived areas
• Kidney patients are more likely to slip into deprivation
Within the catchment area, local authorities with greater deprivation (shown in Figure 2 as lower index of multiple
deprivation deciles) – and therefore likely to have greater need of renal services are:
• Croydon
• Sutton
• Merton
• Crawley
However, within each of these areas the relative levels of deprivation are not uniform. For example, in Croydon, the
majority of very deprived areas are to the north of the borough (and closer to SGUH) with a further pocket on the
eastern edge. In Sutton, deprived communities are generally to the north of the borough but with some in the south
also. Both SGUH and ESTH units currently have areas of both significant affluence, and significant deprivation,
within their catchment, and given that there is scope to improve clinical provision at both units, any positive
developments in clinical care would positively benefit deprived communities across the combined footprint.
2.2 Clinical challenge
Patients from different parts of the region experience unacceptable inequalities in their NHS treatment.
GIRFT data/reports from 2018 showed significant unwarranted variation between the two units. Whilst there have
since been improvements across both services, it remains the case that both services have examples of excellent
practice, which could be shared across the two. Equally, both have areas of challenge that could be addressed
through collaboration with the other: Epsom and St Helier patients experience worse access to surgeon input, out
of hours IR and other specialist services and St George’s patients see significant barriers to accessing best
practice care in vascular access and provision to support home therapies.
2.2.1 Interventional radiology and vascular access
Currently 75% of acutely unwell inpatients (those at St Helier Hospital) have no on-site access to interventional
radiology or access to a renal surgeon out of hours. On several occasions patients have required immediate
intervention and therefore needed transfer at night from St Helier to St George’s, e.g. for bleeding from an
abdominal aneurysm caused by vasculitis, rupture of an arterio-venous fistula and acute infection and bleeding of a
haematoma around a transplant. In all cases transfer was difficult to organise and delayed intervention. This
negatively impacts the vascular access service provision and the related patient outcomes and experience.
Although this may not only affect renal patients, it is more likely to affect renal patients than the general inpatient
population treated at St Helier, and the future SECH.
2.2.2 Access to surgical input
With renal surgeons based from SGUH, ESTH patients have less access to surgical opinions, outpatients and
assessment clinics for both Vascular Access and transplant. This disparity was highlighted by GIRFT.
GIRFT also highlighted that SGUH has a relatively low proportion of patients that are pre-emptively listed while
ESTH is close to the national average with some room for improvement.
2.2.3 Other acute specialties
Currently, patients at St Helier Hospital do not have access to the same range of acute specialties as those at
St George’s Hospital. A particular example is acute cardiovascular services. The pathology of renal failure results in
renal patients frequently having cardiovascular problems but their simultaneous need for dialysis means they need
to be treated in a centre offering both services. Currently St Helier patients waiting for coronary angiography at
17 Kidney Health inequalities in the UK – An agenda for change, Kidney Research UK, 2018
Renal services at St Helier and St George’s Hospitals Error! No text of specified style in document.
18St George’s can wait for transfer for a number of days and may end up being discharged rather than having the
procedure as an inpatient, further increasing their risk.
The national service specification makes clear the importance of co-locating key associated services:
“Haemodialysis patients are dependent on the maintenance of ‘vascular access’ to allow repeated connection to
the HD machine. The need to maintain a satisfactory vascular access coupled with a high susceptibility to
cardiovascular disease, dialysis patients present some of the most serious challenges encountered by vascular
surgeons and interventional radiologists. A significant proportion of these interventions are required to be
delivered urgently or as an emergency. The safety of dialysis patients while hospitalised with vascular
complications of their disease requires special consideration.”
NHSE service specification, ICHD
“Providers shall ensure that haemodialysis patients are managed in a safe environment when hospitalised.
There should be 24/7 and urgent on-site cover available from vascular surgeons, interventional radiologists,
nephrologists and acute dialysis team. Patients should not be transported to another hospital for their regular
maintenance dialysis or for ‘acute’ dialysis during a period of hospitalisation unless under exceptional
circumstances.”
NHSE service specification, ICHD
2.2.4 Out of hours cover
Currently, both services provide junior doctor cover over night including non-resident registrar cover. Bringing the
two services together will ensure this service is more sustainable, resilient and efficient.
2.2.5 Home therapies
Currently there is disparity in uptake of home therapies offered between the hospitals. Additionally, SGUH do not
have an assisted PD programme and no dedicated training area for home HD.
2.3 Workforce challenges
Neither service is as efficient as it could be, and as a result there is significant opportunity to provide
better services to patients.
2.3.1 Staffing and rotas
Neither service is quite big enough to enable an optimal medical rota that provides sufficient, on-site cover at all
times. This is outlined above, where SGUH are often not able to provide middle grade medical cover over-night.
Staffing within the renal dialysis trailers at SGUH needs to be maintained at 1:3 because the staff and patients are
isolated from the rest of the renal service on the St George’s site. This is inefficient and sub-optimal.
These staffing challenges are in the context of significant workforce challenges in specialist renal staffing across
the UK.
2.3.2 Access to theatres and interventional radiology
Neither service, on its own, has sufficient activity to justify dedicated theatre sessions all week for renal patients. As
a result, emergency activity is often delayed as there are not available theatre sessions. This limits both services
ability to provide best practice care, such as providing increased rates of vascular access surgery.
2.3.3 Clinical research
Currently there is a stand-alone research unit at the St Helier site whereas the university and medical school are at
St George’s. While St Helier Hospital has a greater number of patients available for clinical trials, it does not have
the same facilities and resources available to it as a large teaching hospital, such as St George’s, does.
St George’s on the other hand does not have the scale of patient cohort or clinical service to fully capitalise on the
potential of being collocated with the University.
2.3.4 Staff training
Both services have to go elsewhere for some staff training and education programmes as they do not have the
capacity to provide this in house, more efficiently.
2.4 Estates challenges
The estate of both services has suffered from long term under investment, and as a result the buildings are
not fit for purpose and both services lack sufficient capacity for growth.
Renal services at St Helier and St George’s Hospitals Error! No text of specified style in document.
19Figure 6: Renal dialysis trailers at SGUH Figure 7: Renal facilities at ESTH
2.4.1 St Helier
The St Helier service is largely provided from portacabins that have long outlived their intended useful life. The
St Helier service cannot be refurbished at the current location as the portacabins are 30 years old, they are
subsiding and far beyond economical repair. Splitting the elements of the service will increase risk to patients, as it
will increase the distance between the majority of consultants and their patients and would introduce inefficiency
into the model of care and therefore is not a viable option.
2.4.2 St George’s
During 2016 the CQC mandated that SGUH relocated renal services from Knightsbridge Wing as the clinical
environment was deemed unsafe. The trust had no option but to urgently relocate the services to alternative
accommodation. At this time, given the urgency and limited space, mobile units were procured to allow business
continuity for haemodialysis on-site at the hospital. The trust could no longer continue to provide the full
complement of 30–33 dialysis stations on-site. The service responded to deal with this by increasing to 24 stations
with the outsourced dialysis stations private provider Fresenius, as well as re-providing 6–7 dialysis stations in
rented trailers on-site. The trust envisaged the rental arrangement to be a temporary situation and expected a
capital investment to resolve the situation in the long term. However, these units remain in place and this is not a
sustainable solution.
Additionally, the existing layout of services is split over several different wings and sub-optimal estate; should a
patient suffer a cardiac arrest within the Courtyard Clinic or the dialysis trailers they could only be transported to an
inpatient area by calling 999. While this is a low frequency occurrence and has been risk assessed to mitigate
risks, it is not an optimal pathway.
2.4.3 Capacity
Lastly, both ESTH and SGUH operate renal services well above the best practice bed occupancy rates.
Additionally, SGUH operate with a regular number of outliers (renal patients in other parts of the hospital). The
inpatient bed capacity is not sufficient for current demand, which is forecast to grow over the next 10 years.
Renal services at St Helier and St George’s Hospitals Error! No text of specified style in document.
203 Developing the clinical model
The Improving Healthcare Together DMBC included a clinical model that relocated most specialised services
currently provided at St Helier Hospital, including inpatient renal services, to a new facility at Sutton. This model
was agreed in July 2020 as part of the wider reconfiguration of services in South West London.
The clinical model for renal services was revisited later in the year when ESTH and SGUH developed the BYFH
OBC. Clinical leaders considered in detail how the trusts would provide modern renal services that addressed
their respective challenges to deliver the best outcome for patients. This model was refined over several
workshops throughout 2020 until agreed by both trusts.
Commissioners and trusts have adopted the HM Treasury Green Book approach to developing a long list of
options, using the ‘options framework’. This has enabled a standard approach to identifying potential solutions to
address the case for change and deliver the clinical model. By identifying the spending objectives and the
desired critical success factors a short list of options was devised which withy be further subjected to a full
economic appraisal by bringing together the cost, benefits, and risks for each option in an objective way.
To understand the impact on current patients an Impact Assessment (IA) was undertaken to quantify the number
of patients impacted by the change and to estimate the impact on them. The impact on people with protected
characteristics was examined through an equalities impact assessment. The IA showed that the number of
journeys affected is small (4.4%) but most will take longer, whether by patient transport services, public
transport, or private vehicle. The IA identified some additional mitigating actions for consideration.
As part of the IHT process, CCGs in South West London and Surrey Heartlands convened a Committees in
Common (CiC) to consider and make decisions in relation to key parts of the process. South West London CCG
and Surrey Heartlands CCG have made formal delegations to this CiC which permit decision-making on behalf
of the entire board. Using the same terms of reference, a renal CiC has been convened, with amendments to the
membership to include Frimley CCG and NHS England Specialised Commissioning.
3.1 Process to develop clinical model
To address the challenges outlined in the case for change, a joint project to consider how renal services could be
best delivered for our population. The project established a Renal Clinical Advisory Group that included clinical
leaders from ESTH and SGUH. The group was tasked with developing a new clinical model for acute renal services
that meets the needs of the combined populations based on clinical standards and evidenced based best practice.
The approach to developing the clinical model was through three phases.
3.1.1 Phase 1: Development of the emerging clinical model
Through a series of workshops held in 2020, the clinical leaders developed a new model of care for renal services.
The considered all the different services provided to renal patients, the critical co-dependencies and adjacencies
required for renal services, and how the trusts would provide modern renal services that addressed their respective
challenges and delivered the best outcomes for patients.
Through a series of facilitated workshops, the clinical model was refined and subsequently agreed by both trusts as
the most suitable approach to providing renal services for the combined populations.
The overall process for developing the clinical model in phase one involved:
1. Initial development of the high-level clinical vision, patient pathways and critical questions
Establishing clinical standards and best practice guidance
Creation of high-level clinical vision and initial patient pathways
2. Developing, iterating, agreeing clinical models and pathways
Agreement of clinical standards and best practice pathways guidance
Agreement of the clinical case for change
Agreement of the ‘as-is’ and ‘to-be’ patient pathway and associated issues
Testing critical issues arising from agreed ‘as-is’ and ‘to-be’ clinical model/pathways
Consideration of interdependencies with other subgroups.
3. Finalisation of the emerging clinical model
Finalisation and agreement of the ‘to-be’ clinical model both in its totality and at pathway levels
Confirmation of relevant assumptions for finance, activity and estates modelling
Interdependencies and necessary protocols for the overall clinical model
Renal services at St Helier and St George’s Hospitals Error! No text of specified style in document.
21You can also read