Tax Credit Review: 2021 Session - RESEARCH REPORT #2-21 (Pursuant to 2013 HB 2002) - Oregon State Legislature
←
→
Page content transcription
If your browser does not render page correctly, please read the page content below
Tax Credit Review: 2021 Session
 (Pursuant to 2013 HB 2002)

 RESEARCH REPORT #2-21

 January 28, 2021

 Legislative Revenue Office
 State Capitol Building
 900 Court Street NE, Room 160
 Salem, Oregon 97301
 (503) 986-1266

 https://www.oregonlegislature.gov/lro
Table of Contents
Introduction .................................................................................................................................................. 3
Concept of Tax Expenditures ........................................................................................................................ 4
Tax Credit Review Process ............................................................................................................................ 5
Tax Credits for Review in 2019 ..................................................................................................................... 8
 Rural Medical Providers .......................................................................................................................... 10
 Oregon Veterans’ Home Physician ......................................................................................................... 22
 Working Family Household and Dependent Care................................................................................... 24
 Individual Development Account Contributions..................................................................................... 34
 Office of Child Care Contributions .......................................................................................................... 43
 Child with a Disability.............................................................................................................................. 47
 Severe Disability ...................................................................................................................................... 49
 Public University Venture Development Fund........................................................................................ 52
 Bovine Manure for Biofuel ...................................................................................................................... 59
 Employee Training in a Qualifying County .............................................................................................. 64
 Oregon Life and Health IGA Assessments ............................................................................................... 68
 Appendix A: Legislative History............................................................................................................... 70
 Appendix B: HB 3542 Tax Credit List ....................................................................................................... 73
Works Cited ................................................................................................................................................. 74
January 2021

 Legislative Revenue Office
 160 State Capitol Building, Salem, Oregon 97301 | 503.986.1266

 Report on Expiring Tax Credits

Introduction
With the creation of the first comprehensive Tax Expenditure Report (TER) in 1996, the state of Oregon
has had a single source that identifies existing tax expenditures (e.g. exemptions, deductions, and credits)
for the major taxes imposed in Oregon. The TER has been a companion document released with the
Governor’s Recommended Budget since the 1997-99 biennium.

This report on tax credits is required by ORS 315.051. It contains three sections: an overview of tax
expenditures, a summary of the tax credit review process and an analysis of eleven tax credits scheduled
to sunset in the upcoming biennium. The tax expenditure overview provides a brief concept discussion of
tax expenditures in general and some specific context for the tax credits that are the primary focus of this
report. The second section describes the Legislature’s review process for expiring tax credits, which was
first established in 2011. While the exact process for 2021 is currently unknown, expectations are that it
will be of a similar structure. The third and primary section of the report is the analysis of the expiring tax
credits to be reviewed during the 2021 legislative session.

LRO 1/28/21 3 Research Report #2-21
Concept of Tax Expenditures
The concept of tax expenditures has been part of the public finance lexicon since 1967 when the U.S.
Treasury first created a list of tax preferences and concessions as part of a broader discussion and debate
about tax reform. In its simplest form, tax expenditures are provisions of law that represent a departure
from a normative tax structure. The concept of “normative” refers to a general set of principles that leads
to a collective understanding of the appropriate tax base, in the case here the income tax. Disagreement
exists about whether specific provisions in law are tax expenditures or simply not part of the “base”
system. A portion of the debate on the topic revolves around the interpretation of “normative.” A federal
“tax expenditure budget” has been produced since the 1970s and most states now report on tax
expenditures in some form.

Kleinbard (2010) has described three kinds of federal tax expenditures contained within the Internal
Revenue Code. First, fixed-dollar subsidies are tax expenditures that have a dollar cap per fiscal year.
These provisions are legislatively structured to spend no more than a statutory dollar amount. Once that
cap is reached, no additional subsidies are granted. The other two types are temporary and permanent
uncapped subsidies. These are provisions of tax law that are structured such that if a taxpayer meets the
statutory qualifications, they are able to benefit from the subsidy. The amount claimed in a given year is
not limited by law. The only difference between the latter two is those that have statutory sunsets and
those that don’t.

This same taxonomy can also be applied to Oregon tax expenditures with one additional caveat. Oregon-
specific tax expenditures are those that are written into the Oregon Revised Statutes and can be
categorized in the manner described above. The caveat is that Oregon’s income tax is tied to federal tax
law, specifically the definition of Federal Taxable Income (FTI). The policy choice of connecting to federal
law implicitly adopts many federal income tax expenditures. For example, a federal deduction reduces
the FTI for taxpayers. Because the Oregon income tax calculation begins with FTI, the deduction is already
included.

The result is that there is a broader perspective when referring to Oregon tax expenditures. They consist
of two groups – tax expenditures specified in federal law and those specified in Oregon law. Any analysis
of those specified in federal law eventually incorporates the myriad advantages and disadvantages of
connecting to federal income tax law.

When tax policy analysis intersects with budget analysis the result often leads to a review of tax
expenditures using one of two common approaches. The first is to focus on specific policies embodied
within specific tax expenditures. The intricacies of that policy are explored, analyzed, and possible
modifications are debated. The second approach is to make proportional changes to all or groups of tax
expenditures.

LRO 1/28/21 4 Research Report #2-21
Tax Credit Review Process
In 2009, the Legislature passed, and the Governor signed HB 2067. This bill organized the active credits
into three groups according to broad policy goals and placed a sunset date on all but three tax credits.1
The three groups were scheduled to sunset on January 1 of 2012, 2014, or 2016, so that an organized
review could occur during the legislative session just prior to their scheduled sunset. The 2011 Legislature
conducted the first such review, which encompassed twenty tax credits.

Building on this work, the Legislature passed, and the Governor signed into law, HB 2002 in 2013 which
requires a detailed report on sunsetting tax credits (this document is that required report.) For reference
purposes, the table below contains a summary of recent tax legislation focusing on tax credit policy work.
Collectively, this legislation is the basis of what some researchers have described as ‘framework
legislation’ for the policy analysis and review of indirect spending (Kleinbard, 2010). These bills have
culminated in a process to understand and evaluate part of what has become known as Oregon’s tax
expenditure budget. Theoretically, such a process could include all tax expenditures, but Oregon is
currently and has been primarily focused on state income tax credits.

 Session Bill Description
 Created or modified nine tax credits; paid for by phasing-
 2007 HB 3201
 down the personal exemption tax credit
 Organized tax credits into three groups with distinct sunset
 2009 HB 2067
 dates to facilitate their future review
 Made significant policy changes to the Business Energy Tax
 2010 HB 3680
 Credit

 Tax credit omnibus bill: nine tax credits extended and/or
 modified; one tax credit divided into three tax credits; one tax
 2011 HB 3672
 credit sunset date accelerated; and nine tax credits allowed
 to sunset
 Tax credit omnibus bill: seven credits extended without
 2013 HB 3367 modification; two credits extended with modifications; four
 credits allowed to sunset
 2013 HB 2002 Requires biennial report on sunsetting tax credits.
 Tax credit omnibus bill: two credits extended without
 modification; five credits extended with modifications; two
 HB 2171 credits merged into a single credit; modified one tax credit
 without changing the sunset date; accelerated the sunset
 2015
 date for one tax credit
 Requires a statement of purpose for each proposed tax credit
 HB 3542 along with the review of estimated revenue impacts of tax
 credits

1
 The three credits without a sunset date are the personal exemption credit, the credit for taxes paid to another state,
and the claim of right income credit. These tax credits were considered part of the normative tax base.
LRO 1/28/21 5 Research Report #2-21
Moved sunset date for University Venture Development Fund
 HB 4072
 from January 1, 2016 to January 1, 2022
 Increased EITC from 8% to 11% of federal credit for taxpayers
 2016 HB 4110
 with dependent < 3
 Omnibus tax credit bill, technical changes and policy changes
 SB 1507
 to 2 credits
 Extends or modifies five tax credits and creates a new tax
 HB 2066
 2017 credit for qualified employer training costs
 SB 162 Technical changes to Working Family Dependent Care Credit
 HB 4028 Omnibus tax expenditure measure, changes to four credits
 2018
 SB 1528 Created credit for Opportunity Grant contributions
 Established procedures and uniform requirements of tax
 HB 2141
 credit transfer and certification
 Extended and/or modified eleven tax credits, established
 2019 HB 2164 short line railroad credit, and replaced 529 subtraction
 (education & ABLE) with 529 credit (education & ABLE)
 Expanded list of hospitals, whose medial staff may qualify for
 HB 2847
 rural medical provider credit

In each legislative session the tax credit review process has varied to some degree. In a broad sense,
however, the process has consisted of three stages: (1) the interim process; (2) the policy committee
process; and (3) the Joint Tax Credit Committee process. The interim process involves updating
information on the tax credits that are scheduled for the formal review process during the legislative
session. It also includes a review of credits with a later sunset date if they meet criteria for early
consideration. This stage ends with the pre-session filing of bills extending the sunset date by six years –
a default time period intended as a placeholder. These bills are intended to set the stage for legislative
discussions and have no direct policy implications.

The second stage begins with legislative leadership assigning the tax credit bills to relevant policy
committees with subsequent referrals to the Joint Committee on Tax Expenditures. There are two such
extension bills (House and Senate versions) for each credit that simply extend the sunset date.2 The intent
is that each committee reviews the purpose of each credit and evaluates its effectiveness in achieving that
purpose. Sample questions have typically been provided to promote discussion. Possible committee
actions include: allowing the credit to sunset by simply taking no action on the bill, extending the sunset
date without policy changes, extending the sunset date with other policy changes, or replacing the credit
with a more effective policy. All but the first option would result in a recommendation to the Joint
Committee on Tax Expenditures. The objective is that each policy committee provides some degree of
policy guidance to the Joint Committee for any continuation of desired tax credits.

Upon receiving tax credit bills referred from policy committees, the work of the Joint Committee on Tax
Expenditures is intended to mirror the Ways & Means budget process. The “base” spending level may be
the amount of spending presented in the Governor’s recommended budget, an amount set by legislative
leadership, or some combination thereof. One example is that this base could be the estimated credit
revenue base – the revenue impact of straight credit extensions – within the overall revenue and budget

2
 Proponents of a given policy may have a version drafted that includes modifications.
LRO 1/28/21 6 Research Report #2-21
situation. Consultation among legislative leadership, the Ways & Means Co-chairs, and the House and
Senate Revenue Chairs may result in a tax credit budget for the upcoming biennium.

The Joint Committee evaluates credits based on policy committee input, recommendations, and
prioritization, while considering general tax policy criteria. The Committee collectively considers all bills
affecting the existing tax credits as well as any new credits proposed during the session. Some may be
allowed to sunset as scheduled; some could have their sunset date accelerated; and others could be
extended and/or modified. Examples of potential modifications include: separating a single tax credit into
multiple tax credits, merging multiple tax credits into a single tax credit, adding some form of means-
testing, and sunsetting a tax credit early to raise revenue that can then be redirected to a different
program.

LRO 1/28/21 7 Research Report #2-21
Tax Credits for Review in 2019
This is the primary section of the report, containing detailed information on each tax credit scheduled to
be reviewed in 2021. In total, there are eleven such tax credits. To provide some context, the table below
shows the cost to extend the tax credits for the current and following two biennia. These estimates are
for current law, meaning the cost to extend reflects the estimated cost of extending the credit sunset date
without otherwise modifying the credit. The cost to extend amount in 2021-23 is roughly half the cost in
2023-25. This is due to the credits sunsetting midway through the 2021-23 biennium.

 Estimated Cost of Extending Tax Credits
 $ Millions
 Sunset --------Biennium--------
 Tax Expenditure Report Number and Credit name ORS Date 2021-23 2023-25 2025-27

Scheduled for Review by the 2021 Legislature
1.404 Employee Training in Eligible Counties 315.523 2023 < 50K < 50K < 50K
1.407 Child with a Disability 316.099 2022 $4.9 $10.2 $10.6
1.408 Rural Medical Providers 315.613-619 2022 $1.2 $4.4 $6.1
1.410 Severe Disability 316.752-771 2022 $4.8 $9.7 $9.7
1.422 Public University Venture Development Fund 315.640 2022 $0.3 $0.5 $0.4
1.425 Working Family Household and Dependent Care 315.264 2022 $31.9 $63.8 $63.8
1.426 Contributions to the Office of Child Care 315.213 (318.031) 2022 < 50K < 50K < 50K
1.427 Individual Development Account Contributions 315.271 2022 $6.6 $13.6 $13.9
1.430 Bovine Manure for Biofuel 315.176 2022 $3.3 $5.5 $5.8
1.445 Oregon Life and Health IGA Assessments 734.835 2022 $0.7 $0.9 $0.5
1.449 Oregon Veterans' Home Physician 315.624 2022 < 50K < 50K < 50K
 SUBTOTAL $53.6 $108.6 $110.8

The remainder of the report consists of separate reviews for each tax credit. Each review consists of
subsections related to the credit’s policy purpose, description, policy analysis, similar incentives available
in Oregon, and discussion of related credits available in other states. The policy purpose of a credit is
generally not stated in statute. The purpose identified in this report is based on documentation from
implementing or modifying legislation and related committee discussions. Generally, the purposes are
inferred from historical records. When Oregon statute provides a clear statement of the policy intent,
such policy purpose is cited in this report. The description provides detail on how the tax credit works
under current law. The policy analysis describes academic research on relevant incentives if available,
provides some discussion of the credit’ history, and an analysis of available data. Often the primary
sources of data are certifications and tax returns. The review also includes a summary of similar incentives
in Oregon (direct spending program information is generally provided by the Legislative Fiscal Office).

Statute requires this report to provide information on the public policy purpose or goal of each tax credit.
The most basic of this information is simply the stated public policy purpose. Also required is information
on the expected timeline for achieving that purpose, the best means of measuring its achievement, and
whether or not the use of a tax credit is an effective and efficient way to achieve that goal. However,
Oregon statute does not generally contain policy purposes or goals for tax credits. Consequently, statute
does not generally identify timelines or metrics related to such goals. In the few cases where statute does
provide a purpose or a goal, it is included in this report. The more common approach has been to rely on
bill documentation and written testimony for the implementing legislation. This information is the basis
for the purpose statements included in this report.

LRO 1/28/21 8 Research Report #2-21
Statute requires that this report contain, among other things, an analysis of each credit regarding the
extent to which each is an effective and efficient way to achieve the desired policy goals. Ideally, the best
analytical approach would be to identify metrics for each desired outcome, measure them over time, and
then estimate the degree to which each credit contributes to the success of obtaining those goals.
However, a lack of clearly stated purposes presents several challenges to ultimately measuring or
estimating their effectiveness. The information provided in this report is intended to be a step toward a
more comprehensive analysis. To improve the effectiveness of this report, clarified policy objectives for
each credit represents a critical step.

The importance of a clear objective is that it effectively provides direction for the framework of policy
analysis. While many of Oregon’s tax credits do constitute an incentive to encourage a certain kind of
behavior, many tax credits intend to alleviate or provide support for specified individuals. The analytical
framework for non-incentive tax credits is fundamentally different from those credits that are incentives.
Many of the tax credits have different characteristics that may lend themselves to more, or less, analytical
review. This report attempts to describe those frameworks in the discussions on policy analysis and/or
credit effectiveness and efficiency.

LRO 1/28/21 9 Research Report #2-21
Rural Medical Providers
ORS 315.613, 315.616 Year Enacted: 1989 Transferable: No
ORS 315.619 Length: 1-year Means Tested: Yes
 Refundable: No Carryforward: None
TER 1.408 Kind of cap: Taxpayer Inflation Adjusted: No

Policy Purpose
Bill documentation for the implementing legislation (1989 SB 438) states that the primary issue discussed
was the “[f]light of physicians, physician’s assistants and nurse practitioners from areas served by rural
hospitals and the difficulty in finding replacements.” This language suggests that the policy purpose is a
combination of the retention and recruitment of certain medical professionals in rural areas. One of the
major points discussed was how to limit the eligibility of the tax credit to communities that were having
or were expected to have problems with the adequate provision of medical care.

Bill documentation describes a “three-pronged attack” to address the problems and shortages of medical
care in rural communities. Along with the tax credit, SB 438 implemented a loan repayment program with
the State Scholarship Commission for practitioners who agreed to operate a practice in a rural area. The
third piece of the policy was financial assistance for rural hospitals by requiring that they receive the same
level of Medicaid reimbursement even if they weren’t considered remote.

The 2015 Legislature extended the sunset of the credit to 1/1/2022 with certain modifications enacted.
The cumulative purpose of the modifications is to more efficiently expend (through the tax system)
limited funds aimed at retaining specified medical providers in rural areas. The 2015 revenue impact
statement stated the policy purpose of the credit as “to improve access to certain health care providers
in rural areas”. 3

Description
Certain medical providers are allowed a non-refundable tax credit equal to Distance Credit
either $3,000, $4,000 or $5,000 against their personal income taxes. 10-20 miles
 4
 $3,000
Eligible providers include physicians, dentists, podiatrists, optometrists, 20-50 miles $4,000
physician assistants, nurse practitioners and certified registered nurse 50 or more miles $5,000
anesthetists. The value of the tax credit depends on a medical provider’s distance from a community with
a population of 40,000 or more. The credit is also limited to providers with adjusted gross income up to
$300,000. 5 There are three exceptions to the limit: physicians who practice as a general surgeon,
physicians who specialize in obstetrics, or physicians who specialize in family or general practice and
provide obstetrical services. The requirements for eligibility vary by type of provider.

To receive the credit the provider must work a minimum of 20 hours per week, averaged over the month,
in a qualifying rural area. They must also be willing to serve a Medicare and medical assistance (Medicaid)
base equal to their county’s population of such patients up to 20 percent for Medicare and 15 percent for
medical assistance patients. For this program, rural is defined as any area at least ten miles from a
population center of 40,000 or more. Currently, there are six such population centers: the Portland
Metropolitan Statistical Area (MSA), Salem, Eugene/Springfield, Medford, Bend, and Corvallis/Albany. In

3
 HB 2171-A (2015)
4
 The total credit amount can reach $10,000 if both taxpayers on a joint return qualify.
5
 Adjusted gross income limit of $300,000 is applicable to both single and joint filers.
LRO 1/28/21 10 Research Report #2-21
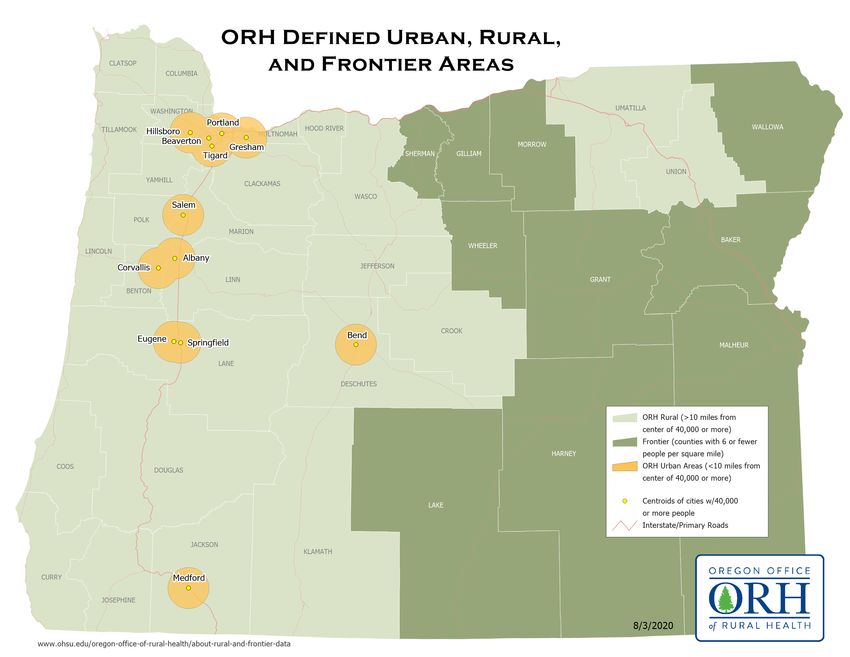
addition, physicians on staff at a hospital in an MSA are not eligible, with the exception of those working
in Florence in Lane County and Dallas in Polk County. A qualifying taxpayer may claim both this credit and
the Oregon Veterans’ Home Physician credit.

Despite the current sunset of January 1, 2022, there is a grandfather clause allowing taxpayers that meet
the eligibility requirements for tax year 2021 to continue using the credit for any tax year through 2031.
Additionally, there is a ten-year lifetime limit on using the credit though the ten-year limit only applies to
tax years beginning on or after 2018. 6

Below is a map from the Office of Rural Health (ORH) that shows the geographic areas covered by the tax
credit. The areas that are considered urban fall within 10 miles of the Portland MSA, Salem,
Corvallis/Albany, Eugene/Springfield, Bend, and Medford. All other parts of the state are places where
medical professionals are eligible for the tax credit.

6
 For example, a taxpayer who had used the credit for 12 years prior to tax year 2018 would be eligible to use the
credit for ten years beginning with 2018.
LRO 1/28/21 11 Research Report #2-21
The following map is also from the Office of Rural Health and displays through a series of concentric circles
the areas of the state where the credit is available and at what amount. The innermost circle displays the
urban areas of the state where the credit is unavailable. The first annulus displays areas where the credit
is equal to $3,000. The credit in areas within the second annulus is equal to $4,000 and the credit is equal
to $5,000 in areas outside all the concentric circles.

 Rural Medical Providers Credit Value

 (Office of Rural Health, 2020)

LRO 1/28/21 12 Research Report #2-21
Policy Analysis
Two recent policy changes influenced the amount of the credit being used annually. Beginning with tax
year 2016, the amount of the credit was modified to be equal to be $3,000 to $5,000 depending on
distance from a major population center. This allowed for a total reduction in amount of credit claimed
while number of taxpayers claiming the credit continued to increase. Applicable beginning in tax year
2018 and with some exceptions (see credit description prior), taxpayers with an adjusted gross income in
excess of $300,000 no longer qualify for the credit. This change reduced the overall number of taxpayers
claiming the credit.

The chart below shows credit claimed and used amount since 2009. The red dashed line displays the credit
amount claimed on tax returns whereas the blue line displays the amount used to actually reduce tax
liability. The amount used averaged about 96 percent of the amount claimed. Between 2009 and 2018,
the amount claimed on tax returns declined by 16.4 percent, from $8.7 million to $7.2 million. Over the
same period the number of taxpayers claiming the credit grew by 4.5 percent, from 1,761 to 1,841. For
years 2016 through 2018, about 150 tax returns each year were joint returns where both taxpayers were
eligible for the tax credit.

 Cost of Rural Medical Providers Tax Credit
 $12
 $10
 Claimed

 $8
 $ Millions

 Used
 $6
 $4
 $2
 $0
 2009 2010 2011 2012 2013 2014 2015 2016 2017 2018
 Tax Year
 N= 1,761 1,834 1,798 1,859 1,896 1,896 2,078 2,094 2,102 1,841

As previously described in the policy purpose section, the purpose of recent policy modifications to the
credit was to more efficiently expend limited funds aimed at retaining specified medical providers in rural
areas. To that end, an exploration of recent tax credit return and certification data is warranted. The intent
is to examine whether recent policy changes affected the retaining of specified medical providers in rural
areas.

As is often the case, estimating the impacts of individual policies is challenging. There are several factors
that influence the decision-making process of medical professionals regarding where to practice, including
wage level, quality of life, and access to certain amenities. In addition, this tax credit is not the only
incentive currently in place designed to improve access to health care for rural Oregonians. The analytical
challenge is to untangle each of these effects. Given current data restrictions, the goal here is to examine
potential identifiable impacts resulting from recent policy changes made to the credit (change to credit
amount and AGI limit).

LRO 1/28/21 13 Research Report #2-21
The chart to the right displays the
 Number Claiming Credit by AGI Group & Year
number of Oregon resident
 2,000
taxpayers claiming the credit AGI Category
 1,800
categorized by taxpayer’s All
 1,600
adjusted gross income (AGI). As 1,400 < 300
displayed, the total number of 1,200
 100-200
taxpayers claiming the credit 1,000
declined in 2018 aligning with the 800 200-300
AGI qualification limit that became 600
 300+
effective the same year. As 400

displayed, the decline was driven 200
The chart to the right displays the change in overall share of certifications by provider type. As shown, the
share of certifications has shifted
following the 2018 initiation of the Share of Certifications by Licensure, 2017 & 2019
$300K AGI limitation. Compared 50%
with 2017, the overall share of 45%
 40%
MDs and DOs declined whereas 35%
the share of NPs, PAs and CRNAs 30%
all increased. 25%
 20%
The chart below displays the 15%
number of new providers being 10%
 5%
certified for the credit each year 0%
along with the number of MD NP PA DO CRNA DMD DDS DPM OD
providers not renewing their 2017 2019
credit certification (the “churn” in
the credit). A new provider certification refers to a provider first being certified for the tax credit whereas
 the providers labeled “not
 Certification of Rural Medical Providers renewing” is a computed number
 600 based on the number of providers
 500 certified the previous year (both
 400
 new and renewing providers)
 minus the number of providers
 300
 renewing in the current year. As
 200 displayed, for years 2008-2016 the
 100
 number of new provider
 certifications slightly outpaced the
 0
 2008 2009 2010 2011 2012 2013 2014 2015 2016 2017 2018 2019 number of no renewals causing an
 overall increase in the number of
 New No Renewal
 certified providers each year.
Beginning in 2018, the number of non-renewals increased reflective of the AGI limitation first effective in
2018. As the $300,000 AGI limitation is not indexed to inflation, the limitation is expected to affect more
providers each year that would otherwise qualify for the credit.

An examination of tax return data provides a way in which to examine potential change in age of tax credit
claimants. The charts on the following page display the age of the return filer 9 at time of return filing by
both number of returns and percentage of overall returns filed. Again, the overall reduction that occurred
in 2018 due to the AGI limitation is visible in the left chart. As displayed, most age groups saw a decline in
overall claims for the credit with the exception of the under 30 category where an increase occurred (70+
was largely flat). Looking at the overall share (right chart) it can be seen that the change in credit claimants
decreased in the 50-60 group while increasing in the less than 30 and 30-40 age groups. It is perhaps

9
 For joint returns, this is the individual’s whose name is reported first on the return. As such, the age reported here
may not match the provider’s age as it could be the provider’s spouse.

LRO 1/28/21 15 Research Report #2-21
unsurprising that the AGI limit would tend to affect younger taxpayers less than those in their prime
 working age.

 Number of Full-Year Filers by Age Category Percentage of Full-Year Filers by Age
 Age Category
 600 Category 30%
 Less than
 500 30 25%

 Percent of Returns
 30-40
Number of Returns

 400 20%
 40-50
 15%
 300
 50-60
 10%
 200
 60-70 5%
 100
 70+ 0%
 0 2015 2016 2017 2018
 2015 2016 2017 2018 Tax Year
 Tax Year

 Recent changes to credit amount and AGI qualification limit
 The recent changes to the tax credit provide an opportunity to examine the credit’s influence on rural
 medical provider behavior. Of course, a medical provider’s decision to begin or continue practicing in a
 rural area can be influenced by multiple factors and incentive programs other than the tax credit. As
 changes to the credit are relatively recent, existing data can only begin to look for potential behavioral
 changes in the retention and recruitment of providers. Having said that, an examination of the number of
 providers in rural areas following the recent credit changes can provide some insight into the credit’s
 potential impact on retaining and/or recruiting providers to rural areas. For context, a brief examination
 of a survey of rural medical providers receiving the credit prefaces the examination of the number of rural
 providers.

 In 2013, the Office of Rural Health surveyed providers receiving the tax credit.10 About 70% of respondents
 were licensed MDs and about two-thirds of providers surveyed were not employed by a hospital. About
 85% of respondents identified the tax credit as “important” or “very important” in the provider’s initial
 decision to practice in rural Oregon whereas about 95% identified the credit as “important” or “very
 important” in their decision to remain in practice in rural Oregon. When asked what impact capping the
 credit at $250,000 annually would have, nearly 11% of respondents stated they “would leave my
 community as soon as possible”, 30% would “begin looking for other opportunities” and 33% would
 “consider leaving”. About 25% stated capping the credit would have little impact or no impact on their
 decision to continue practicing in their rural community. The survey results should be viewed in
 consideration of the survey’s reliance on self-reporting and associated potential response bias.
 Nonetheless, the survey results indicate a potential noticeable impact on rural providers could occur if
 the credit (as it existed in 2013 at time of the survey) was modified.

 The first recent change to the credit was the modification to credit amount. Beginning with tax year (TY)
 2016, the credit amount went from a flat value of $5,000 to a value of $3,000, $4,000 or $5,000. The
 average credit amount claimed in TY 2016 was about 87% of the TY 2015 average amount indicating that

 10
 Survey results provided by Office of Rural Health (Office of Rural Health, 2013).

 LRO 1/28/21 16 Research Report #2-21
credit recipients were affected by the change in credit value. 11 The chart below displays the number of
taxpayers claiming the credit in each year where the taxpayer had AGI less than $300,000. 12 No clear
discernable reduction appears to
 Number Claiming Credit by AGI Group & Year
have occurred following changes
in credit amount. Unfortunately, 1,600 AGI Category
data availability does not allow for 1,400 < 300
an in-depth comparison between 1,200
taxpayers qualifying for the full 1,000
 100-200
$5,000 and those qualifying for a 800
lesser amount. Nonetheless, early 600 200-300
tax return information does not
 400
indicate mass exodus by providers
 200
Oregon’s Health Care Workforce Reporting Program (WRP) administered by the Oregon Health
Authority’s (OHA) Office of Health Analytics provides an informal way of examining whether a change in
the number of rural medical providers occurred during the period in which changes to the credit became
effective. 14 The WRP data tracks the health license renewal of various health licenses. OHA’s website
cautions against statewide license comparisons between years though data from specific occupations may
be compared, with caution. Examination of WRP data performed for this report is based on data
downloaded from OHA website in fall of 2020. Analysis of occupation data was done only for occupations
in which data was available in all three years examined. This examination of underlying data is not
definitive though it does provide the basis for an informal analysis. Data is available at the county level
which allows for an examination by county but to bifurcate data by urban and rural, an entire county must
be assigned as either urban or rural. 15

The two tables below display the number of licenses renewed by occupation and year, for counties
identified as rural and urban. The chart below displays number of license renewals in rural counties only
over years 2016, 2018 and 2020. In both rural and urban counties, the number of licenses renewed
increased in each year reported. While the number of physicians in rural counties increased between 2016
and 2020, the number from 2018 to 2020 decreased. Upon closer examination, the decrease in the

 Number Renewing License by Occupation - Rural Number of License Renewals in Rural
 Number Renewing by Year
 Counties by Occupation
Occupation 2016 2018 2020 2,500
 Physicians
Nurse Anesthetists 137 102 113
Dentists 485 498 493 2,000
 Nurse
Nurse Practitioners 579 631 716 Practitioners
Physician Assistants 270 316 353 1,500 Dentists
Physicians 1,845 2,039 1,963
Podiatrists 32 44 43 1,000 Physician
 Assistants
 Total 3,348 3,630 3,681
 Nurse
Number Renewing License by Occupation - Urban 500 Anesthetists
 Number Renewing by Year Podiatrists
Occupation 2016 2018 2020 0
Nurse Anesthetists 389 340 353 2016 2018 2020
Dentists 2,434 2,465 2,540 (Oregon Health Authority, 2020)
Nurse Practitioners 2,471 2,588 3,025
Physician Assistants 1,226 1,538 1,780 number of renewed licensed physicians was relatively
Physicians 10,736 11,974 12,438 widespread in counties identified as rural. By contrast, the
Podiatrists 137 145 153 increase between 2018 and 2020 in urban counties was
 Total 17,393 19,050 20,289
 also widespread amongst the urban counties. This
examination is an initial look at the data following recent tax changes. Other factors are undoubtedly
affecting rural providers and refinement of data analysis is an ongoing effort.

14
 See https://www.oregon.gov/oha/hpa/analytics/Pages/Health-Care-Workforce-Reporting.aspx
15
 The following ten counties were labeled as urban reflective of county classification for credit purposes: Benton,
Clackamas, Deschutes, Jackson, Lane, Linn, Marion, Multnomah, Polk and Washington.

LRO 1/28/21 18 Research Report #2-21
Examining the license renewals on a per capita basis provides another way in which to view recent changes
and examine differences between counties and the urban/rural distinction. The left chart below displays
the number of providers per 1,000 in county population delineated between urban and rural counties. As
displayed, both urban and rural counties experienced increases on a per capita basis since 2016 though
urban counties increased at a faster pace than rural
counties. The chart to the right displays the number of Number of Practioners per 1,000 in
providers per 1,000 population by county in 2020 Population - 2020
(urban counties identified in green). As displayed,
 Multnomah
individual counties vary in the number of providers per Hood River
 Deschutes
capita. When focusing only on the physician category, Jackson
per capita numbers followed the trend in overall Benton
 Malheur
counts where physicians per 1,000 of population Wasco
increased in rural counties from 2.020 in 2016 to 2.211 Clatsop
in 2018. In 2020, physicians per 1,000 of population Washington Baker
decreased to 2.104. This still represents a net increase Lane
 Union
from 2016 but is a metric to continue tracking as the Marion
2020 decline corresponded with the AGI credit limit Wallowa
 Clackamas
that became effective with the 2018 tax year. Coos
 Curry
 Klamath
 Douglas
 Select Providers Practicing per 1,000 of Josephine
 Population Umatilla
 Lincoln
 7 Tillamook
 Urban Yamhill
 6
 Per 1,000 Population

 Harney
 Grant
 5
 Linn
 Rural Lake
 4
 Sherman
 3 Jefferson
 Polk
 2 Crook
 Gilliam
 1
 Wheeler
 0 Columbia
 2016 2018 2020 Morrow
 0 2 4 6 8 10
 (Oregon Health Authority, 2020)

General analysis and further considerations
The policy discussion at the time the tax credit was adopted focused on the loss of certain medical
professionals from rural areas. The tax credit was part of a larger policy goal of mitigating that loss, which
also included a direct subsidy (i.e. loan repayment) and an attempt to increase the Medicaid income (via
reimbursement) for rural hospitals. Given such a focused goal, examining the number of such
professionals before and after the implementation of the policies would be a next step in evaluating the
policy’s degree of success or failure. As the credit has been in place for over thirty years, such before and
after analysis is no longer relevant. Continued examination of medical providers practicing in rural areas
continues to provide a way in which to measure availability of such services to rural residents.

LRO 1/28/21 19 Research Report #2-21
In an attempt to evaluate the optimal structure of the tax credit, it’s important to acknowledge that this
is an incentive where the beneficiaries of the tax credit (the medical providers) are distinct from the
beneficiaries of the health policy (the rural Oregonians seeking health care services). The tax credit is a de
facto increase in the wages paid to its recipients, thereby increasing the returns to labor with the hope of
increasing the supply of labor for medical services. If the intent of the policy is more (or better) medical
services provided to rural Oregonians, then measuring and evaluating that additional health care would
be at the core of the policy analysis. Certainly, the cost of that additional health care would be of interest
to stakeholders. And the analysis could include all aspects of those additional costs. For the sake of clarity,
it’s important to keep such distinctions clear.

Proponents of the credit may contend that allowing the credit to sunset would make it marginally more
difficult to retain and/or attract qualified medical professionals to rural areas. If providers were practicing
in an area as a direct result of the credit, then it is likely that some number of them will cease to do so if
the credit were to sunset. However, this effect may be moderated by a certain level of inertia that comes
from being invested in the life of a community, as a result of a brick and mortar business location or a
residence. In addition, any exit by professionals is likely to happen gradually over time and be difficult to
quantify outside of other influencing factors.

One option to better understand the impact of the tax credit would be to examine the ability of medical
systems to retain and attract medical providers. For example, examining length of time to fill open
positions could indicate whether difficulty exists in ability to attract qualified providers to rural areas.
Survey work could also aid in the understanding of why providers chose to locate in a rural area or exit
surveys could seek to understand why providers left rural areas to continue practicing in an urban setting.
Surveys of officials who are involved with the recruitment of medical professionals to rural areas, and who
may collect information regarding decisions about where to practice and/or reside could also be helpful.

Other States
Policymakers and other stakeholders are often interested in how other states address these policy issues.
Several other states were identified as currently having a tax credit for rural medical providers (some are
limited only to physicians). The states are: Alabama, Georgia, Louisiana, Maine (limited to 10 providers),
and New Mexico. When analyzed collectively, the information below summarizes the policy options used
by these states in designing their specific credits. Other states have also proposed larger one-time credits
available to medical providers establishing a new practice in rural areas.

 Key characteristics of other states
 • Amount of credit generally ranges from $3,000 to $5,000
 • Non-refundable or refundable
 • Carryforward or carryback allowed/disallowed
 • Some variance by specialty, with larger credit for certain practitioners
 • Contingent upon number of hours worked
 • Includes limit on the number of years eligible to claim
 • Requires connection to a small or rural hospital
 • Varying definitions of rural
 o Community, county, or area
 o Number of people or people per square mile
 o Distance to a hospital or city of a certain size

LRO 1/28/21 20 Research Report #2-21
Similar Incentives Available in Oregon
The Legislative Fiscal Office identified two direct spending programs that shared some level of policy
relationship to the credit. The two spending programs along with each program’s 2019-21 legislatively
adopted budget amount is detailed in the following table.

 2019-21 Legislatively
 Adopted Budget ($M)
 Direct Spending Program General Fund Other Funds
 Healthcare Provider Incentive Fund $17.7 $10.0
 Area Health Education Centers $4.5

The Healthcare Provider Incentive Fund supports access to care for rural and other underserved
communities by offering various incentives to both students and health care providers who commit to
serving patients in underserved areas of the state. These incentives include the following: student loan
repayment, primary care loan forgiveness, subsidies for rural medical practitioner insurance, and
scholarships. The Oregon Health Authority administers the program in partnership with the Oregon Office
of Rural Health.

Area Health Education Centers work to improve healthcare for rural and underserved populations by
educating current and potential rural health care students, and the Office of Rural Health coordinates the
statewide effort to provide healthcare in rural Oregon. The Office of Rural Health works with rural practice
sites to recruit and retain providers and manages provider incentive programs.

Administrative Costs
The administrative and compliance costs of this credit are born by the ORH, the DOR, and taxpayers. There
is an annual $45 fee that claimants must pay the ORH, which provides the office with roughly $175,000
per biennium for its budget. The cost to the taxpayer is $45 per year ($90 if a joint return with two eligible
taxpayers) plus the marginal cost of maintaining the certification paperwork in case of a tax audit. The
cost to the DOR appears to be minimal. The largest share of the cost is likely born by ORH because they
are required to process tax credit applications each year.

LRO 1/28/21 21 Research Report #2-21
Oregon Veterans’ Home Physician
ORS 315.624 Year Enacted: 2007 Transferable: No
 Length: 1 Means Tested: No
 Refundable: No Carryfoward: None
TER 1.449 Kind of cap: Credit Amount Inflation Adjusted: No

Policy Purpose
Testimony for the 2007 implementing legislation (HB 3201) suggests that the policy purpose of the tax
credit is to increase the number of health care professionals providing long-term care to Oregon
veterans, thereby increasing the number of veterans receiving such care. The credit effectively increases
the after-tax take-home pay for physicians providing the qualifying care. This may entice some physicians
to provide these services who otherwise would not.

Description
Physicians who provide medical care to residents of an Oregon Veterans’ Home are allowed a credit
against personal income taxes. The credit is $1,000 for every eight residents to whom the physician
provides care, up to $5,000. To qualify for the credit, a physician cannot miss more than five percent of
scheduled visits with residents as verified by a letter from the Oregon Veterans’ Home. The letter must
be submitted with the corresponding tax return. A qualifying taxpayer may claim both this credit and the
rural medical practitioner tax credit.

The chart below shows that the cost of this credit has varied between $10,000 and $30,000 per year
between 2009 and 2018. On average, use of this tax credit has equaled about 85 percent of amount
claimed meaning some taxpayers are not receiving the full available credit benefit. A second Veterans’
Home opened in 2014 in Lebanon causing a slight uptick in credit use. On average, about 15 taxpayers per
year have claimed the credit since the opening of the second Veterans’ Home.

 Cost of Veterans' Home Physician Tax Credit
 $0.035
 $0.030
 Claimed
 $0.025
 $ Millions

 $0.020
 $0.015
 $0.010
 Used
 $0.005
 $0.000
 2009 2010 2011 2012 2013 2014 2015 2016 2017 2018
 Tax Year
 N= 10 11 7 11 11 11 15 19 14 12

Policy Analysis
Given the policy discussions at the time this tax credit was created, the key issue is whether the tax credit
increases the number of medical providers offering their services to patients in an Oregon Veterans’
Home. Communication with The Dalles Oregon Veterans’ Home described difficulty in attracting

LRO 1/28/21 22 Research Report #2-21
physicians to follow patients of the home, though the greater community also has a shortage of physicians
(Maitland, 2020).

In 1995 the Legislature authorized the creation of two long-term care facilities for Oregon veterans. The
first home opened in The Dalles in 1997. The Home can care for as many as 151 residents who need long-
term care in a care facility that provides skilled nursing, Alzheimer’s and dementia-related care, and
inpatient and outpatient rehabilitative care to veterans, their spouses and parents who have lost a child
to war-time service .

A second home (OVH-Lebanon) opened in Lebanon in 2014 that can house up to 154 residents. Per OVH-
Lebanon’s website the Home is...
 Organized around the idea of an intentional community or neighborhood, this new veterans' home offers
 residents a way to maximize normal living environments and routines, provides autonomy, a sense of
 community, and quality of life. The campus consists of four neighborhoods, up to three houses per
 neighborhood, and each house accommodates up to 14 eligible residents (Oregon Veterans' Home
 Lebanon, 2020).
Legislation in 2011 enabled a third home to be built in Roseburg though the facility has yet to break ground
due to funding issues.

No other state is known to offer a similar tax credit.

Similar Incentives Available in Oregon
The table below details the direct funding legislatively appropriated to the Oregon Veterans’ Homes for
the 2019-21 biennium. Home operations are funded by Other Funds, consisting primarily of resident-
related income, including federal VA payments, Medicare, Medicaid, insurance, and private payments.
Other Funds revenues from the sale of veteran’s license plates and donations from the charitable checkoff
income tax program also support the Veterans’ Homes. The Oregon Department of Veteran Affairs
received federal Coronavirus Aid, Relief and Economic Security (CARES) Act Provider Relief Fund general
and targeted distributions in 2019-21 for Oregon Veterans’ Homes healthcare-related expenses and lost
revenues attributable to COVID-19. General Fund is appropriated for debt service on general obligation
bonds issued in 2019 for capital improvements to the Homes.

 2019-21 Legislatively Adopted Budget ($M)
 Direct Spending Program General Fund Other Funds Federal Funds
 Oregon Veterans' Home $0.4 $87.1 $1.7

Other Issues
The administrative costs of this tax credit are born by the DOR, the Oregon Veterans’ Home (tracking
services) and medical providers. The marginal cost to DOR is likely to be minimal and the cost to taxpayers
pertains to maintaining tax records in the event they are subject to an audit.

LRO 1/28/21 23 Research Report #2-21
Working Family Household and Dependent Care
ORS 315.264 Year Enacted: 2015 Transferable: No
 Length: 1 Means Tested: Yes
 Refundable: Yes Carryforward: No
TER 1.425 Kind of cap: Taxpayer Inflation Adjusted: Partially

Policy Purpose
The Working Family Household and Dependent Care (WFHDC) credit was created in 2015 via the
combining of two credits that were reviewed by the 2015 Legislature. The House Committee on Housing
and Human Services (HHS) led the credit review. The policy decision of the committee was to take no
action regarding the sunset extensions for the Child and Dependent Care and Working Family Child Care
credits. Rather, the committee chose to create the WFHDC credit which incorporated many underlying
policies of the two credits allowed to sunset. According to testimony provided by Representative Keny-
Guyer, 16 the policy purpose of the WFHDC credit is:
 To enable low-income working families to care for young children and disabled dependents by
 offsetting care costs so that they may be gainfully employed or attending school full-time. The
 desired effect...is to provide additional tools to help these families climb out of poverty. (Keny-
 Guyer, 2015)
The stated policy purpose and the structure of the credit are designed to adjust the credit’s monetary
benefit to respective taxpayers depending on the taxpayer’s income relative to federal poverty level and
age of youngest qualifying individual associated with the taxpayer. During committee meetings discussing
legislation enacting the credit, intent of the credit and/or desired outcomes resulting from the credit were
discussed. Topics discussed included designing a policy that encourages, does not discourage, or enables
people to return and/or enter the workforce, especially when accounting for government transfer
payments and potential barriers to households. From a perspective of providing additional tools to help
families climb out of poverty, it is helpful to view the credit as it exists and interacts with other transfer
payments and tax credits.

In HHS committee discussions, multiple policy rationales were presented in support of combining the two
sunsetting tax credits into a single tax credit. Rationales included: simplifying the process for many
taxpayers that qualify for both credits, extending more benefit to lower income taxpayers through a single
refundable credit, 17 and that directing the benefits of a single credit can be easier than directing two.

Description
The WFHDC credit is a refundable personal income tax credit available to low and middle income
households with employment related dependent care expenses. Credit amount is determined by applying
a credit percentage multiplied by the amount of qualified employment related expenses.

 = % ∗

16
 In 2015, Rep. Keny-Guyer was chair of the House Committee on Human Services & Housing and submitted to the
Joint Committee on Tax Credits testimony responding to various tax credit policy related questions.
17
 The Child and Dependent Care credit was not refundable though a 5-year carryforward was available, whereas the
Working Family Child Care credit was refundable.

LRO 1/28/21 24 Research Report #2-21
The credit percentage is based on a taxpayer’s adjusted gross income (AGI) as a percentage of federal
poverty level (FPL) and the age of the youngest qualifying dependent individual. Once a taxpayer’s AGI as
a percentage of FPL equals more than 300%, the taxpayer no longer qualifies for the credit.

FPL is determined by household size and adjusted to inflation. Respective limits for tax year 2020
qualification are displayed in the table below. The chart below displays the credit percentages by
respective age of youngest qualifying individual. As displayed, credit percentage increases as AGI as
percent of FPL reaches 100%, then the credit percentage plateaus, followed by a decreasing period,
secondary plateau, and finally decreased until credit is fully phased-out when AGI as a percentage of FPL
becomes greater than 300%.

 Credit Percentage
 80%
 TY 2020 AGI Limits
 Household AGI at 300%
 60% Size of FPL
 2 $51,720
 Credit %

 40% 3 $65,160
 4 $78,600
 20% 5 $92,040
 6 $105,480
 0% 7 $118,920
 0% 50% 100% 150% 200% 250% 300% 8 or more $132,360
 AGI as % of Federal Poverty Level
 Age < 3 years 3 ≤ Age < 6
 6 ≤ Age < 13 | 13 ≤ Age < 18 (Di sabled) Age ≥ 18 (i f disabled)

Qualified expenses are expenses paid by the taxpayer for household services and/or care of a qualifying
individual that allow the taxpayer to work, seek work, or attend school on a full-time or part-time basis
(part-time only applicable to an unmarried taxpayer). 18 Qualified expenses include childcare expenses and
household services such as a cook, babysitter or housekeeper. Qualified expenses are limited to the least
of:
 • $12,000 for 1 qualifying individual or $24,000 for 2 or more (reduced for any amount excluded
 from income via an employer dependent care assistance program)
 • Earned income taxable by Oregon
 • Lesser amount of earned income taxable by Oregon earned by each spouse.

A qualifying individual is defined in three ways:
 1) A child under the age of 13 claimed as a dependent by the taxpayer
 2) A disabled spouse who isn’t physically or mentally able to care for themself and lived with tax filer
 for more than half the year

18
 Care includes the cost of services for the qualifying individual’s well-being and protection. It doesn’t include the
cost of food, lodging, education, clothing, or entertainment. (Oregon Department of Revenue, 2019)

LRO 1/28/21 25 Research Report #2-21
3) Any disabled person who isn’t physically or mentally able to care for themself and lived with the
 taxpayer for more than half the year.

For taxpayers filing jointly, if either taxpayer is enrolled as a full-time student then an income amount is
imputed for the student equal to $250 per month or $500 per month (if two of more qualifying individuals
are cared for). As qualified expenses are limited to the least of either spouse’s earned income, the imputed
income allows taxpayers to receive credit benefit in instances where a spouse is a full-time student with
little to no earned income (the imputed income is treated as an earned income floor for credit calculation
purposes). Non-married taxpayers who attend school full or part-time may qualify for the credit, but no
imputed income is included as earned income.

Policy Analysis
The provision of child care and care for individuals with disabilities is a sizeable policy subject that is too
expansive to be addressed in a comprehensive way in a single section in this report. Rather, this report
section provides supplemental information to the larger discussion through an analysis of Oregon’s
WFHDC credit. Oregon’s WFHDC is but one component in the larger provision of support provided to
households where care is required for younger household members or disabled household members, in
order to allow other household members to be employed, seek employment or attend school.

This policy analysis is laid out in five sections. The first section provides some background and context on
the provision of child care in Oregon. The second section discusses the confluence of programmatic
support for households of low to moderate income. The third section provides background on Oregon’s
Employment Related Day Care program. The fourth section lists budgetary expense of similar programs
in Oregon and the final section concludes with background on taxpayers claiming the WFHDC credit.

The chart below displays the cost of the credit since inception in tax year 2016. The average annual cost
of the credit for years 2016-2018 is about $33 million which is the same as the annual average cost (years
2011-2015) of the two credits from which the WFHDC credit was formed.

 Cost of Working Family Dependent Care Tax Credit
 $38
 $36
 $ Millions

 $34
 $32
 $30
 $28
 2016 2017 2018
 Tax Year
 N (000s)= 34.5 32.2 29.8

Background and Context
The definition of “child care” can sometimes vary depending on the context in which the term is used. In
some instances child care may be in reference to paid child care whereas in others the term is used more
broadly to represent all forms of child care regardless of whether the child is receiving such care in say a
day care center setting or from a parent or grandparent. For purposes of the WFHDC credit, qualified

LRO 1/28/21 26 Research Report #2-21
You can also read