South East Coast Ambulance Service NHS Trust Integrated Business Plan 2010 2015
←
→
Page content transcription
If your browser does not render page correctly, please read the page content below
South East Coast Ambulance Service NHS Trust

Integrated Business Plan

2010 – 2015

                                              Page | 1
                IBP2010-15_Summary_20100325
FOREWORD

       Foreword from the Chairman and Chief Executive
The ambulance service is on a journey of transformation; we have changed from a service that
transported patients to treatment, to a service that is now bringing more treatment to patients.
Demand continues to increase for our service – by roughly five percent each year – and the
spectrum of patient need that we are now seeing is broader than ever before, ranging from
critically ill and injured patients suffering from conditions such as trauma, stroke and coronary
heart disease, to patients at the other end of the spectrum with less serious healthcare needs
such as minor injuries and illnesses.
We fully recognise that we must change and adapt in order to meet the changing needs of all of
our patients – no matter what their condition or healthcare need – and deliver continuous
improvements in patient care. South East Coast Ambulance Service NHS Trust (SECAmb) is
committed to driving that change in order to deliver the best possible care, and therefore
outcomes, for patients across Surrey, Sussex and Kent.
Delivering world class outcomes for patients is what we aspire to do – we want to be the best
ambulance service; our patients deserve and expect nothing less. We are confident we will
achieve this goal and becoming a foundation trust will help us. Foundation Trust status will give
us the financial and operating freedoms needed to make the improvements that our patients
need and expect at a much quicker pace, meaning higher quality care for all our patients.

               Martin Kitchen                                Paul Sutton
               Chairman                                      Chief Executive

                                                                                           Page | 2
                                IBP2010-15_Summary_20100325
CONTENTS

         Table of Contents
Foreword from the Chairman and Chief Executive ................................ 2
Table of Contents ..................................................................................... 3
List of Figures ........................................................................................... 5
List of Tables............................................................................................. 6
1.       Executive Summary ......................................................................... 7
  1.1.     Vision and Strategy ................................................................................................... 7
  1.2.     Rationale for NHS Foundation Trust status ............................................................. 7
  1.3.     Market assessment .................................................................................................... 8
  1.4.     Performance overview ............................................................................................... 8
  1.5.     Summary SWOT analysis ......................................................................................... 9
  1.6.     Leadership and Management ...................................................................................10
2.       Trust Profile .................................................................................... 11
  2.1.     Overview ....................................................................................................................11
  2.2.     Range of services .....................................................................................................12
  2.3.     Performance ..............................................................................................................16
  2.4.     Contractual information ...........................................................................................18
3.       Strategy ........................................................................................... 21
  3.1.     Trust vision ...............................................................................................................21
  3.2.     Strategy .....................................................................................................................21
  3.3.     Measuring achievement of our Strategy .................................................................24
  3.4.     Aim for NHS Foundation Trust status .....................................................................24
  3.5.     Consultation process ...............................................................................................25
4.       Market Assessment ........................................................................ 28
  4.1.     Description of local health economy .......................................................................28
  4.2.     Key factors driving demand .....................................................................................31
  4.3.     Objectives of the local health economy ..................................................................34
  4.4.     PEST analysis ...........................................................................................................36
  4.5.     Trust performance ....................................................................................................40
5.       Service Development Plans ........................................................... 44
  5.1.     Overview ....................................................................................................................44

                                                                                                                              Page | 3
                                           IBP2010-15_Summary_20100325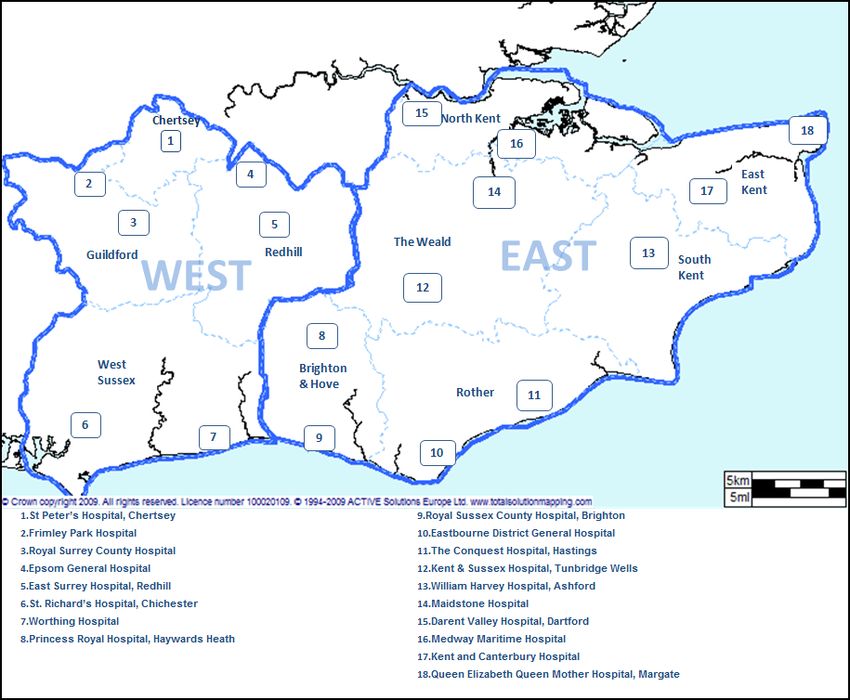
CONTENTS

  5.2.     Our Trust’s Strengths, Weaknesses, Opportunities and Threats ..........................44
  5.3.     Commentary on SWOT analysis ..............................................................................46
  5.4.     Key service developments .......................................................................................48
6.       Leadership and Workforce ............................................................ 52
  6.1      Management arrangements .....................................................................................52
  6.2      Workforce key performance indicators ...................................................................60
  6.3      Agency and recruitment arrangements ...................................................................62
  6.4      Workforce and organisational development ...........................................................62
  6.5      Human Resources Strategy .....................................................................................64
7.       Governance Arrangements ............................................................ 66
  7.1      Stakeholder interests ...............................................................................................66
  7.2      Corporate governance and management ................................................................68
  7.3      Internal control ..........................................................................................................71
  7.4      Risk management .....................................................................................................71
  7.5      Performance management reporting framework ....................................................72
  7.6      Financial controls and reporting .............................................................................73
  7.7      Audit arrangements ..................................................................................................73
  7.8      Compliance Framework............................................................................................74
  7.9      IT systems .................................................................................................................75
List of acronyms ..................................................................................... 77
Glossary of terms ................................................................................... 81

                                                                                                                            Page | 4
                                          IBP2010-15_Summary_20100325
CONTENTS

          List of Figures
Figure 1.1 - Summary SWOT analysis .................................................................................... 9
Figure 2.1 - Operational Dispatch Areas and Hospital Locations ........................................12
Figure 2.2 - Management of 999 calls ....................................................................................14
Figure 3.1 - Strategy Focus ....................................................................................................23
Figure 3.2 - Stakeholder analysis...........................................................................................27
Figure 4.1 - Emergency calls by month for 2007-09 .............................................................29
Figure 4.2 - Emergency responses by month for 2007-09....................................................29
Figure 4.3 - Number of emergency ambulance calls / conveyances 1998 - 2009 ...............31
Figure 4.4 - Calls by MPDS code 2007/08 and 2008/09 .........................................................32
Figure 4.5 - PEST analysis......................................................................................................37
Figure 4.7 - Return of Spontaneous Circulation (ROSC) on arrival at hospital ..................41
Figure 4.8 - Care bundle provided for STEMI ........................................................................42
Figure 4.9 - MORI Survey: Satisfaction with SECAmb compared with wider NHS .............43
Figure 5.1 - SWOT analysis ....................................................................................................45
Figure 8.1 - Board and Team of Directors .............................................................................53
Figure 9.1 - Trust Board and Committee structure ...............................................................69

                                                                                                                      Page | 5
                                         IBP2010-15_Summary_20100325
CONTENTS

          List of Tables
Table 1.1 - Historic Annual Health Check performance......................................................... 8
Table 2.1 - Proportion of income............................................................................................13
Table 2.2 - A&E activity (by incidents) ...................................................................................14
Table 2.3 - PTS activity (number of journeys) .......................................................................15
Table 2.4 - Annual Health Check ratings ...............................................................................16
Table 2.5 - Annual Health Check: Quality of Services performance 2008/09 ......................17
Table 2.6 - National Performance Targets: Existing Commitments .....................................18
Table 2.7 - Annual Health Check: Quality of Financial Management 2008 – 2009 ..............18
Table 3.1 - Background of respondents ................................................................................25
Table 3.2 - Issues identified during public consultation and Trust response .....................26
Table 4.1 - Population breakdown by PCT area ....................................................................30
Table 6.1 - Workforce ..............................................................................................................60
Table 7.1 - Proposed governors .............................................................................................68
Table 7.2 - Committee roles....................................................................................................70

                                                                                                                          Page | 6
                                           IBP2010-15_Summary_20100325
CHAPTER 1 | EXECUTIVE SUMMARY
1. Executive Summary
This section:
Outlines our vision and strategy and how we will achieve this
Explains why we want to become a Foundation Trust and the benefits we believe this
will bring
Summarises the key elements from our Integrated Business Plan
The key points from this section are:
The Trust has a clear vision and strategy
The Trust has the appropriate supporting mechanisms in place to deliver this vision
and strategy
1.1. Vision and Strategy
Our vision is to match and exceed international clinical excellence through embracing
innovation and putting the patient at the heart of everything we do.
Our strategy to achieve this is to strengthen and extend our core activities
To implement our strategy, we have identified six
strategic objectives underpinned by business
implementation measures and key service The concept of high
developments. Our six strategic objectives are: performance is based on four
Improve on the Trust‟s performance standards co-dependent “pillars” that
and reduce variation focus on reducing waste by
Deliver excellence in leadership and maximising efficiency. This
development supports the delivery of high
Improve access and outcomes to match quality, clinically focussed
international best practice services for our patients and
Improve satisfaction and experience for all the local population.
stakeholders
Be an organisation that people seek to join and
are proud to be a part of
Convert all available pounds / resources to maximise patient benefit
1.2. Rationale for NHS Foundation Trust status
Foundation Trust status is a mechanism that enables us to deliver the system and cultural
change required to become a world class provider of emergency and urgent care. There are
many benefits to us becoming an FT – for patients, local people and for our staff. Our key
reasons for becoming a Foundation Trust are:
Structural change – Increased local ownership and accountability;
Investment in innovation – Ability to reinvest funds to innovate to improve patient care;
Commercial opportunities – Ability to react promptly to opportunities within the
marketplace.
Page | 7
IBP2010-15_Summary_20100325
CHAPTER 1 | EXECUTIVE SUMMARY

  1.3. Market assessment
We cover a geographical area of 3,600 square miles, providing Accident & Emergency
(A&E) services to the population of Brighton & Hove, East Sussex, Kent, Medway, Surrey
and West Sussex and to selected geographic areas within Berkshire and North East
Hampshire on the Surrey County boundary. We serve a resident population of c. 4.3 million
people, however, on an annual basis there are approximately 15 million visitors who stay for
one night or more, and 96 million day visitor, who may also call on our services. In 2008/09
we responded to more than 500,000 emergency calls; approximately a call every minute.
In addition, we provide non-emergency patient transport services in parts of East Sussex,
Kent and West Sussex. Our Commercial Services Department provides training, paramedic
cover and a private ambulance service to outside organisations. We provide a portfolio of
products that cover three distinct markets; Emergency care, Unscheduled Urgent Care and
Non-Emergency Care.

  1.4. Performance overview
We have a history of strong financial performance since the Trust was formed in 2006. In
2008/09 we generated a surplus of £0.7m on a £149m budget.
In 2008/09 we achieved a rating of “Good” for Quality of Financial Management and “Fair”
for Quality of Services in the Care Quality Commission‟s Annual Health Check ratings. Our
aim is to improve on this for 2009/10, by achieving a “Good” assessment for both
components. Historic performance against the Annual Health Check rating is shown in
Table 1.1.
Table 1.1 - Historic Annual Health Check performance
                                         2006/07           2007/08            2008/09
Quality of Services                      Fair              Good               Fair
Quality of Financial Management          Fair              Good               Good

We are working to develop our Quality Account that will become mandatory from 2010/11.
This is a mechanism by which the Board can assess quality and address its improvement,
and by which all NHS healthcare providers can be held accountable for the quality of care
provided by commissioners, patients and the public.

                                                                                     Page | 8
                             IBP2010-15_Summary_20100325
CHAPTER 1 | EXECUTIVE SUMMARY

  1.5. Summary SWOT analysis
Figure 1.1 - Summary SWOT analysis

                 Strengths                                     Weaknesses
 Available 24 hours a day, seven days a        Higher than average costs
 week                                          Uni-professional workforce (limited skill
 Strong reputation and positive public         mix of staff)
 image                                         Staff satisfaction
 History of innovation
                                               Environmental impact
 Mobile healthcare provider
 Historic performance of category A and
 call taking standards
 Responsive to clinical change
 Robust, tested business continuity plans

               Opportunities                                        Threats
 Urgent, unscheduled care provision            Payment by Results could result in a
                                               disincentivisation to “do the right thing” for
 Improving outcomes and experience
                                               patients
 Diagnostic technology
                                               Competition from alternative providers
 Managing demand in the whole health
                                               Resistance/ difficulty delivering large scale
 economy
                                               cost improvement programmes
 Releasing cost improvements in the whole
 health economy
 Foundation Trust status will increase local
 ownership amongst patients, public and
 staff
 Community cohesion
 General health Management

                                                                                   Page | 9
                              IBP2010-15_Summary_20100325
CHAPTER 1 | EXECUTIVE SUMMARY

  1.6. Leadership and Management
We have a strong commitment to education, with an increasing focus on the
professionalisation of the workforce. Our vision for leadership development aims to develop
our staff to lead improvements through others and this is supported by a series of
organisational development programmes, targeted at different groups of staff throughout the
Trust.

                                                                                  Page | 10
                            IBP2010-15_Summary_20100325
CHAPTER 2 | TRUST PROFILE
2. Trust Profile
This section:
Provides an overview of how the Trust operates
Sets out the services the Trust provides
Indicates the levels and trends of activities within the Trust
The key points from this section are:
The Trust is an innovative, patient focused organisation
The organisation‟s portfolio covers three distinct markets
2.1. Overview
South East Coast Ambulance Service NHS Trust is an innovative, patient focused organisation
providing emergency, unscheduled urgent and non-emergency care. We respond to 999 calls
from the public, urgent calls from healthcare professionals and, in Kent and Sussex, provide
non-emergency patient transport services (pre-booked patient journeys to and from healthcare
facilities).
We currently provide services in Kent, Surrey and Sussex, and also to a small geographic area
within North East Hampshire and in Berkshire. The Trust was formed in July 2006, following the
merger of Kent Ambulance Service NHS Trust, Surrey Ambulance Service NHS Trust and
Sussex Ambulance Service NHS Trust.
We have a strong track record of improving patient services through the adoption and
implementation of innovative clinical practices and equipment, the development of specialist
clinical roles and the roll out of new technologies and systems; all aimed at improving patient
outcomes, experience and safety, improving the quality of care for the patients we treat.
We employ 3,138 members of staff, of which 83.5% are operational, either as front-line
members of staff, or within our Emergency Dispatch Centres, with the remaining 16.5%
providing support services and management functions. The Trust operates from 65 sites.
Operationally, the services are divided into two divisions, East and West, and further into ten
Operational Dispatch Areas (ODAs), which are served by three Emergency Dispatch Centres
(EDCs). These divisions are based on patient flows into acute hospitals (see Figure 2.1).
Page | 11
IBP2010-15_Summary_20100325CHAPTER 2 | TRUST PROFILE
Figure 2.1 - Operational Dispatch Areas and Hospital Locations
2.2. Range of services
We provide a range of services to ensure that we best meet the needs of patients within the
communities we serve. These are grouped as Accident and Emergency Services, Patient
Transport Services, Commercial Services and Emergency Preparedness. The income
generated from each of these, as well as the proportion this represents in relation to our overall
turnover of £156 million in 2009/10 is shown in Table 2.1.
Page | 12
IBP2010-15_Summary_20100325CHAPTER 2 | TRUST PROFILE
Table 2.1 - Proportion of income
Income Proportion of
£ million turnover
Accident & Emergency service 139 89%
Patient Transport Service 11 7%
Commercial Services and other non-NHS income 6 4%
2.2.1. Accident and Emergency Service
Patients range from the critically ill and injured, to those with Our innovative
minor healthcare needs that can be treated at home or in the approach to
community. Calls are received in our Emergency Dispatch infection control,
Centre via the 999 system, and triaged in accordance with the “Make Ready” won
Advanced Medical Priority Dispatch System (AMPDS), to
the 2009 Regional
determine the most appropriate response based on clinical need.
Calls are categorised as follows:
Best of Health
Awards for patient
Category A – Life threatening conditions where speed of safety
response may be critical in saving life or improving outcome for
the patient e.g. heart attack or serious bleeding
Category B – Conditions which need to be attended quickly, but which are not immediately life-
threatening
Category C – Non life-threatening conditions that may be appropriate for referral to an
alternative care pathway
Figure 2.2 provides an illustrative example of the management of 999 calls through our
systems.
We currently provide four different products within our A&E service:
999 Call-taking
The function undertaken within our Emergency Dispatch Centre of answering and initial triage
(via AMPDS) of the call.
Hear & Treat
Those situations, generally Category C calls, where advice is provided directly to the patient
over the phone by a clinically trained member of staff within the Emergency Dispatch Centre.
This may include identification of an alternative care pathway.
See & Treat
Where a clinician attends and provides treatment to the patient, but there is no requirement to
transport the patient to hospital (or other healthcare facility).
See, Treat & Convey
As with See & Treat, the clinician attends and provides treatment to the patient, however there
is the need to transport the patient to hospital (or other healthcare facility) for further treatment.
Page | 13
IBP2010-15_Summary_20100325CHAPTER 2 | TRUST PROFILE
Figure 2.2 - Management of 999 calls
999 call or call from a healthcare professional received by the Emergency Dispatch Centre
Call Taker uses the Advanced Medical Priority System (AMPDS) to triage the call and
determine the condition of the patient
Dispatcher allocates the most Clinical Desk (clinically trained
appropriate response, based on clinical staff) use PSIAM software to
need manage Category C calls
effectively
Clinician(s) receives information
electronically and vehicle is mobilised
Clinician(s) arrives on scene
Clinical treatment is Clinical treatment is Patient is referred to an
provided to the patient; no provided and the patient is alternative care pathway
requirement for hospital transported to hospital or e.g. community nurse / GP
treatment specialist unit
In line with national trends, A&E activity is increasing year on year (NHS Information Centre,
2009). Analysis of trends relating to population, epidemiology and healthcare confirm that
demand for ambulance services is likely to continue to rise in line with historical trends. Table
2.2 highlights increasing demand for our A&E service. We attended 532,893 incidents in
2008/09, an increase of 5.8% increase on 2007/08 activity.
Table 2.2 - A&E activity (by incidents)
2006/07 2007/08 2008/09 Projected
2009/10
A&E activity 483,360 503,700 532,893 559,538
Growth N/A 4.21% 5.80% 5.00%
Page | 14
IBP2010-15_Summary_20100325CHAPTER 2 | TRUST PROFILE
2.2.2. Patient Transport Service (PTS)
Non-emergency patient transport services for the movement of patients to and from NHS
facilities includes the transportation of ambulant, wheelchair bound and stretcher patients, plus
infectious cases. The types of journeys undertaken include inpatient admissions, out-patients
and day patients from the patient‟s place of residence, including nursing homes, to NHS
facilities and non urgent transfers between hospitals and discharges from hospitals to home.
We employ Ambulance Care Assistants (ACAs), who operate either single or double crewed
vehicles to transport these patients.
Additionally, a volunteer-operated ambulance car service supports the Patient Transport
Service.
Within our Patient Transport Service, we provide two different products:
High Acuity PTS
The patient may require some degree of clinical care during transportation.
Low Acuity PTS
The patient does not require clinical care during transportation.
Table 2.3 shows that demand for PTS services continues to decrease over time. However,
evidence suggests that the level of acuity of the patients using these services is increasing.
Table 2.3 - PTS activity (number of journeys)
2006/07 2007/08 2008/09 2009/10 2010/11 2011/12
PTS activity 455,602 451,634 438,220 433,837 429,498 425,202
Growth N/A -0.88% -2.97% -1.00% -1.00% -1.00%
2.2.3. Commercial Services
In addition to the provision of front-line clinical services, we have developed a number of areas
of expertise for commercial development opportunities. These include event work, insurance
work, training, education and workshops. This work is currently co-ordinated by our
Commercial Services department.
The Private Ambulance Service (PAS) currently provides First Aid, clinical and pre hospital
emergency cover to a range of public events across Surrey, Sussex and Kent and further afield,
with the capability to provide HSE approved
First Aiders, Paramedics and Technician
crews, registered nurses, paramedic We are currently developing our
practitioners and the paramedic Cycle first ever community education
Response Unit. By attending events we are programme which will see
able to deal with injuries and illnesses on frontline staff educating the
scene and ensure patients are discharged to public about how to identify
appropriate follow-on care, preventing acute potentially life threatening
services becoming overwhelmed as a result conditions and what actions to
of large public gatherings. take to save lives
PAS undertakes both private and NHS patient
transfer work. In 2008/09 we undertook over
Page | 15
IBP2010-15_Summary_20100325CHAPTER 2 | TRUST PROFILE
400 patient transfers commissioned by local PCTs, other NHS Trusts and private hospitals and
patients.
As part of our commercial training department we provide accredited First Aid at Work courses
to a number of external clients, with the capacity to run bespoke courses for AED, oxygen and
entonox and first aid emergency care training for specific needs such as cave rescue and fire
and rescue.
We are commissioned by Surrey Police to provide a 24/7 service for urgent and emergency
care needs for detained patients located in the four custody suites across Surrey, which
provides a source of non-NHS income. This model of care is considered best practice by both
the Home Office and local mental health teams. In line with the current contract, we provide two
response cars that can be deployed at any time to custody suites across Surrey, staffed by
paramedics.
2.2.4. Emergency Preparedness
We are a Category 1 responder under the terms of the Civil Contingencies Act 2004, and as
such we have six statutory duties:
Assess local risks and use this to inform emergency planning;
Put in place emergency plans;
Put in place Business Continuity arrangements;
Put in place arrangements to make information available to the public about civil
protection matters and maintain arrangements to warn, inform and advise the public in
the event of an emergency;
Share information with other local responders to enhance co-ordination;
Co-operate with other local responders to enhance co-ordination and efficiency.
The Patient Transport Service (PTS) is integral to the resilience of the Trust in terms of
providing flexibility in the event of either a Major or Business Continuity Incident. PTS allows an
additional pool of vehicles and staff to be available to support the core A&E activity in the event
of a crisis.
2.3. Performance
The Annual Health Check conducted by the Care Quality Commission assesses performance
on two criteria; Quality of Services and Quality of Financial Management. Our performance
against these two components is shown in Table 2.4. A detailed breakdown of our performance
against the Quality of Services component is provided in Table 2.5.
Table 2.4 - Annual Health Check ratings
2006/07 2007/08 2008/09
Quality of Services Fair Good Fair
Quality of Financial Management Fair Good Good
Page | 16
IBP2010-15_Summary_20100325CHAPTER 2 | TRUST PROFILE
Table 2.5 - Annual Health Check: Quality of Services performance 2008/09
Quality of Services Fair
Existing Commitments Almost met
75% of Category A calls meeting 8 minute standard 75.2% (achieved)
95% of Category A calls meeting 19 minute standard 96.9% (achieved)
95% of Category B calls meeting 19 minute standard 94.6%
(underachieved)
Time to reperfusion for patients who have had a heart attack Achieved
National priorities Fair
Experience of patients / users Achieved
Management of acute myocardial infarction Underachieved
Management of asthma Achieved
Management of hypoglycaemic attacks Failed
Management of patients with cardiac arrest Achieved
Management of stroke and transient ischaemic attacks Achieved
NHS staff satisfaction Underachieved
Core standards assessment Fully met
42 core standards apply to ambulance trusts in 2008 – 2009 Full compliance
declared
We were disappointed in the deterioration in our performance for the “Quality of Services”
criteria, although this mirrored the trend across the ambulance sector, identifying some need for
improvement in data analysis and reporting at a national level. We aim to improve on our rating
in 2009/10, by focussing on the following areas:
Existing commitments – Category B performance: Work is ongoing to improve delivery of
the Category B target. Analysis of the Category B incident level is reviewed daily as part
of the operations management processes.
National priorities – Clinical indicators (including Management of acute myocardial
infarction and Management of hypoglycaemic attacks): Work is underway at a national
level to influence the approach used for analysis of the Clinical Performance indicators,
and we are involved with these discussions with other ambulance trusts and
representatives from the CQC. In addition, we are introducing a new Patient Clinical
Record (PCR) to facilitate data capture relating to clinical outcomes. Our performance
on the clinical performance indicator (CPI) relating to Return of Spontaneous Circulation
(ROSC) shows that the Trust is performing significantly above any other trusts nationally
(see Figure 4.6).
National priorities – staff satisfaction: We have established a working group to address
areas of weakness within the staff survey, including staff satisfaction.
The Trust has a good history of sustaining and improving performance against standards, as
evidenced in Table 2.6. National performance targets are also monitored by the Trust at PCT
level.
Page | 17
IBP2010-15_Summary_20100325CHAPTER 2 | TRUST PROFILE
Table 2.6 - National Performance Targets: Existing Commitments
Standard Target 2006/07 2007/08 2008/09
75% of Category A calls meeting 8 minute standard 75% 75.1% * 77.2% 75.2%
95% of Category A calls meeting 19 minute standard 95% 97.6% 97.6% 96.9%
95% of Category B calls meeting 19 minute standard 95% 93.8% 95.2% 94.6%
* The 2006/07 figure for Category A performance uses a different method for measurement
Table 2.7 - Annual Health Check: Quality of Financial Management 2008 – 2009
Quality of Financial Management 2007/08 2008/09
Financial Reporting Level 3 Level 4
Financial Management Level 3 Level 3
Financial Standing Level 3 Level 4
Internal Control Level 3 Level 3
Value for Money Level 3 Level 3
2.4. Contractual information
A&E services are commissioned on a consortium basis from the eight PCTs in the South East
Coast region, along with Hampshire PCT and Berkshire East PCT for a small geographic area
within Berkshire and North East Hampshire on
the Surrey County boundary.
The PCTs have financial and risk sharing In line with our workforce
arrangements in place, which are overseen by and fleet strategies, last
the Specialist Commissioning Group (SCG) year we recruited more than
Board, which has senior representation from all 200 new frontline
the commissioners. Day to day management of operational staff as well as
the contract is via a lead commissioner, which is
additional Emergency
hosted by West Kent PCT. The contract is
managed through monthly meetings between the
Dispatch Centre staff,
trust and representatives from all the including emergency call
commissioning bodies. We also work with takers. We also deployed
individual commissioners on a number of local 37 new ambulances and 26
initiatives and developments which reflect new rapid response
individual commissioning priorities. vehicles – more staff and
A Commissioning Strategy for Ambulance more vehicles responding
Services 2008-12 has been developed and was to local patients
signed off by the SCG in December 2007.
Alongside this strategic document there is an
annual commissioning plan, linked to the PCTs Local Delivery Plans. This defines the activity
and specific changes required for the service to enable a contract to be agreed by the lead
commissioner (NHS West Kent), through the SCG Board on behalf of all parties.
PTS has historically been commissioned by other health service providers such as acute,
mental health and community trusts. From April 2009 responsibility for the commissioning of
Page | 18
IBP2010-15_Summary_20100325CHAPTER 2 | TRUST PROFILE
PTS moved to PCTs and is aligned with the introduction of a national contract for both A&E and
PTS services.
There are no plans for ambulance services to become subject to tariff arrangements at the
present time. We are working with commissioners to develop the framework that will allow the
introduction of variations to price paid based on type of patient, clinical outcome and
appropriateness of the response.
With PCT Commissioners taking over the funding for PTS from hospital trusts from April 2010, it
is expected that PTS contract management will be placed higher on commissioning agendas.
Commissioners have committed to continue to fund PTS until March 2010 and PTS is likely to
be put out to tender during 2010.
The trust engages with a range of stakeholders to develop services that meet the needs of
patients, and support government and commissioners priorities. We are uniquely placed as a
provider which, on a daily basis, interfaces with all elements of health and social care.
Commissioners are placing greater emphasis on our role in leading change across the
healthcare system. This can be on specific issues, such as the development of new patient
pathways for dealing with conditions such as cardiac, stroke and trauma, and also on leading
the health services response in emergency planning and preparedness. Alongside these
specific issues, it is increasingly recognised that the trust has a pivotal role in developing and
supporting wider-ranging strategies that will change the provision of urgent healthcare.
Other procurement arrangements
In our procurement activities we take advantage of collaborative procurement through the Office
of Government Commerce (OGC), national and local procurement hubs, and other collaborative
framework contracts to achieve best value for money.
Payroll and pension services from the three legacy ambulance trusts have been merged
following market testing, and this has been outsourced to Equiniti ICS, who hold a strong market
position and provide services to many NHS organisations.
NHS Shared Business Services is a 50:50 joint venture partnership between the Department of
Health and Xansa, a leading provider of shared financial and accounting services from the
private sector. NHS SBS combines knowledge and experience of the NHS with best practice
processes and experience of world class technology from the private sector. This combination
enables operational processes to be delivered more cost-effectively, thereby enabling the Trust
to save money over the true cost of its in-house operations.
Joint venture information
The Trust currently has no formal joint venture agreements but active partnership working is an
important feature of the Trust‟s way of working.
Meeting peaks in demand
In order to support peaks in demand that cannot be resourced appropriately from regular front-
line resources we have arrangements in place with the Voluntary Aid Societies including British
Red Cross and St John Ambulance. Their services can be flexed to support PTS provision,
transfer of pre-assessed patients to hospital and front-line emergency responses. Formal
arrangements are in place to ensure that clinical governance standards are met for all
partnership arrangements.
Capacity Management System (CMS)
The Capacity Management System is a service that is hosted by SECAmb, and provided to
NHS partners. This is funded by Service Level Agreements and each organisation funds this on
Page | 19
IBP2010-15_Summary_20100325CHAPTER 2 | TRUST PROFILE
a capitation basis, with a total annual turnover of £794,627 for 2009/10. It is governed by a
strategic board, which is constituted of five Executive Directors from the 11 ambulance trusts.
This board reports to the National Ambulance Trust Chief Executive‟s Board. There is a
consortium agreement to ensure that the risks to SECAmb are minimised.
Page | 20
IBP2010-15_Summary_20100325CHAPTER 3 | STRATEGY
3. Strategy
This section:
Articulates our vision and strategy
Outlines the systems we have in place in the Trust to deliver our strategy
Explains why we want to become a Foundation Trust and how this will effect how we
operate
Describes the outcomes of our FT consultation process
The key points from this section are:
We have a robust strategy to support delivery of our vision
Our strategy is to strengthen and extend our core activities
The principles of high performance are understood and embedded in the
organisation
We have undertaken a comprehensive public consultation, and now have a public
membership of 2,800
3.1. Trust vision
Our vision is to match and exceed international clinical excellence through embracing innovation
and putting the patient at the heart of everything we do.
Match and exceed international clinical excellence
Patient outcomes for life threatening conditions such as stroke, trauma and heart disease are
not as good as they could be in this country when we compare to centres of international clinical
excellence. This is unacceptable for our patients. We therefore aspire to compete with the best
healthcare organisations worldwide to deliver world class outcomes for our patients.
Embracing innovation
Matching and exceeding international clinical excellence means changing the way we work now.
We need to embrace innovation; learn from the best, adapt it to make it better, be the best.
Putting the patient at the heart of everything we do
We exist to serve our patients; everything we do must have them at the core.
In five years time, we will be:
The first point of contact for the majority of patients seeking unscheduled urgent
healthcare advice or treatment;
Changing the way services are commissioned with an emphasis on payment for results;
A key player in the delivery of whole health economy savings by reducing the duplication
of healthcare offered.
3.2. Strategy
Our strategy to achieve our vision is to strengthen and extend our core activities.
Page | 21
IBP2010-15_Summary_20100325CHAPTER 3 | STRATEGY
92% of our income funds A&E activity and the three services that we provide in this area; Hear
and Treat, See and Treat and See, Treat and Convey are our core activities. Our strategy is to
strengthen these services by adopting the principles of high performance:
Response time reliability – responding to the patient quickly
Clinical effectiveness – providing them with the right advice, making them better, or taking
them to someone who can
Customer satisfaction – providing them with a
service that is easily accessible, treating patients Due to Make Ready Depots
with dignity and respect A&E staff are no longer
Economic efficiency – achieving all of this whilst required to clean, stock and
delivering whole health economy savings by refuel their vehicles at the
reducing duplication of effort start of every shift – it is
To implement our strategy, we have identified six estimated that this takes 72
strategic objectives underpinned by key service minutes per shift. This has a
developments. Figure 3.1 details the relationship massive impact on UHU and
between our vision, strategy, strategic objectives, drives our cost efficiency
and service developments. programme.
Page | 22
IBP2010-15_Summary_20100325CHAPTER 3 | STRATEGY
Figure 3.1 - Strategy Focus
Strategy: Our strategy is to strengthen and extend our core activities
Response time Clinical Customer Economic
reliability effectiveness satisfaction efficiency
Improve on the Deliver Improve Improve Be an Convert all
Trust‟s excellence in access and satisfaction and organisation available
Strategic
performance leadership and outcomes to experience for that people pounds /
Objectives
standards and development match all stakeholders seek to join resources to
reduce international and are proud maximise
variation best practice to be a part of patient benefit
Service Developments
Improving IT systems
Make Ready
Development of Hear & Treat
Implementation of the Front-Loaded Service
Model
Page | 23
IBP2010-15_Summary_20100325CHAPTER 3 | STRATEGY
3.3. Measuring achievement of our Strategy
The concept of high performance is based on the principles of Total Quality Management, and
focuses on converting the public‟s expectations into something that is tangible to manage and
deliver.
High performance seeks to create a system
that delivers efficiency and simultaneously We measure efficiency in the
enables quality to be improved. To implement system by looking at unit hour
high performance for our provision of A&E utilisation (UHU). By utilising the
services, we apply the concept of Unit Hour hours better ie responding or
Utilisation (UHU). This is a complex economic
conveying for as many hours in
model that is used to calculate productivity,
resource utilisation and cost, and enables us
a shift as possible, we are able
to accurately manage the resources required to save money thus generating
to deliver our services efficiently. The UHU savings without sacrificing on
provides an efficiency measure, calculated by quality of service
considering the number of resourced hours,
and the amount of activity undertaken within
the resourced hours. Based on extensive examination and monitoring of historical activity data,
we are able to identify the factors that impact on the UHU, and consider how these can be best
controlled and managed in order to maximise efficiency and provide value for money.
Demand for emergency services is surprisingly predictable, both temporally and geographically.
We can very accurately predict the time and general area of calls, and the challenge is to
ensure the right amount of resource is on duty at the right time and in the right place to meet
this. UHU informs us, for any given operational area, what the utilisation needs to be to deliver
the required response times. The UHU is used to establish the resources required to match the
ever changing fluctuations in demand, ensuring neither too many (money wasted) nor too few
(response performance compromised) are available to respond to patients when they are
required. Unit Hour Utilisation allows us to operate within defined tolerances to deliver
operational and financial performance; we have therefore set the UHU levels we plan to deliver
over the next five years to ensure that we are a high performing Trust.
Implementation of high performance within the organisation will be delivered through a process
of continuous improvement. This will include, but is not limited to, using IT enablers; a
comprehensive estates review, including identification of appropriate locations for response
posts; evaluation of the configuration of single and double-manned vehicles.
3.4. Aim for NHS Foundation Trust status
Foundation Trust status is a mechanism that enables us to deliver the system and cultural
change required to become a world class provider of emergency and urgent care. This is
because the benefits that can only be realised as a Foundation Trust are key enablers to
achieving our vision and strategic objectives. These are:
Greater autonomy from central control – enabling us to fast-track innovations into
practice at a more rapid pace;
Ability to retain surpluses, allowing increased investment in key service developments to
achieve cultural and system transformation;
Greater involvement and ownership for local communities, staff and stakeholders – a
structure designed to be first and foremost responsive to the needs of local patients;
Page | 24
IBP2010-15_Summary_20100325CHAPTER 3 | STRATEGY
Long-term financial and business planning – future-proofing the organisation and our
vision in an austere financial climate;
Greater flexibility to respond quickly and competitively to commercial opportunities e.g.
geographic expansion or market growth;
Development of a representative membership will provide a significantly larger pool of
engaged local people wanting to be involved with their local ambulance service thus
increasing involvement in the development of future services. A representative
membership will also provide us with a greater insight into the varied needs of our local
communities;
The creation of a Council of Governors that will ensure that the Trust is held to account
for meeting the needs of local people through the delivery of our plans that members
have helped to shape.
3.5. Consultation process
We undertook our consultation from 25 July to 16 October 2009 inclusive. Throughout the 12
weeks we engaged and consulted patients, members of the public, staff, community groups
including seldom heard groups, NHS partner organisations, councils, Health Overview &
Scrutiny Committees (HOSCs) and local authorities.
809 responses were received in total, 779 using the feedback pro forma (hardcopy, online or
electronic voting) and 30 via emails / letters.
Table 3.1 details the breakdown of respondents by background.
Table 3.1 - Background of respondents
Background of respondent Number of respondents % of total number of
from this background respondents
Member of the public / patient 256 32%
Representative of an NHS organisation 46 6%
Employee of SECAmb 311 38%
Volunteer of SECAmb 29 4%
HOSC / Local authority member 45 6%
LINk member 45 6%
Representative of another organisation 53 7%
Overall the response was generally positive, with the majority of respondents in favour of all the
proposals put forward. Most questions received a 70-90% positive response rate, however, for
the questions about the minimum age for members or governors, the positive response rate
dropped to around 60%. See Appendix 4 for a more detailed breakdown of responses. Table
3.2 details the key issues identified during the consultation and the Trust‟s response.
Page | 25
IBP2010-15_Summary_20100325CHAPTER 3 | STRATEGY
Table 3.2 - Issues identified during public consultation and Trust response
Key issues identified Trust response
No minimum age for members: The majority of respondents (59%) were There will be no
in favour of no minimum age for membership; however a considerable minimum age for
proportion (32%) felt there should be a minimum age limit. membership, but
The arguments centred on the level of contribution that younger children members must be
would be able to make, and how children and young people could be 16 years of age to
engaged. For those who believed that there should be a prescribed age vote in governor
limit, opinion on what the age limit should be varied, with most in favour elections.
of age 16 or 18.
Minimum age of governor should be 16: The majority of respondents The minimum age
(63%) were in favour of the minimum age for governors being 16, with for a member to
31% opposing this view, and suggesting it should be 18 or 21 instead. stand as a governor
The rationale for increasing the age limit from 16 was around the is 16 years of age.
experience of individuals to take on the governor role, as well as
commitment from young people still in full time education.
Representation on Council of Governors: The majority of respondents There is no
(70%) were in favour of the proposals for the Council of Governors. increased
Amongst those opposing (16%) the main concern was around the representation on
representation of appointed governors and whether one governor could the Council of
adequately represent all the local authorities in the area or similarly all Governors from the
the PCTs or voluntary sector. There was a strong feeling that the proposed structure.
Council needs to ensure accountability, transparency and openness.
Membership analysis
We have set a target of recruiting 4,500 public members by 31 March 2010. This represents
0.13% of the eligible population that we serve. As at 1 March 2010, we had recruited 3,133
members.
We currently have a broadly representative membership in terms of ethnicity. However,
members of Bangladeshi and Chinese ethnic groups are under-represented.
There is an over-representation of women, whilst under 18s are under-represented.
The Trust has commissioned a database to mange member information which we use on a
regular basis to monitor the representativeness the Trusts membership. There is a robust action
plan which details plans to address underrepresented groups.
Stakeholder analysis
The Trust employs a Stakeholder Relations Manager within the Communications and
Engagement department. Figure 3.2 shows an external stakeholder map developed using the
influence / interest model (What to do when stakeholders matter: A guide to stakeholder
identification and analysis techniques, John M.Bryson, 2003). This analysis informs SECAmb‟s
overarching communications and engagement strategy.
Page | 26
IBP2010-15_Summary_20100325CHAPTER 3 | STRATEGY
Figure 3.2 - Stakeholder analysis
High
National media NHS South East Coast Specialist
Commissioning Group
Acute trusts
PCTs
Police force
Unions
Local Authority CEOs
HOSCs
Councillors
Local media
DH Leadership team
CQC
Audit Commission
MPs
Influence
Ambulance Service Network
Fire & Rescue Service Patient & public representatives
Social Services Community responders
Mental health trusts Voluntary organisations
General public Other ambulance trusts
Professional bodies
Seldom heard groups
Low
Low High
Interest
Page | 27
IBP2010-15_Summary_20100325CHAPTER 4 | MARKET ASSESSSMENT
4. Market Assessment
This section:
Describes the market within which the Trust operates
Recognises the influencing factors that impact on the environment in which we
operate
Outlines how our strategy contributes to the overall objectives of the health economy
Provides analysis of our key competitors
Indicates the market share we hold in the markets in which we operate
The key points from this section are:
The Trust has a good understanding of the market and competitive influences that will
affect it
Demand for healthcare services is causing growth in all markets; this is most
significant in the unscheduled urgent care market
4.1. Description of local health economy
We provide services to the South East Coast (SEC) health economy, incorporating the counties
of Kent, Surrey, Sussex and part of north east Hampshire on the Surrey County boundary.
Within the region there are eight PCTs,12 acute trusts (four are FTs) and four mental health and
specialist trusts (two are FTs). We are coterminous with NHS South East Coast. See section 4.3
for information about local health economy objectives.
The region breaks down into 80% rural and 20% urban (www.southeastcoast.nhs.uk, 2009.)
This impacts upon where demand is generated. In planning volume and location of unit hours,
rurality is considered to ensure consistent compliance with response time targets.
Within the region there are some of the busiest stretches of motorway in the country (e.g. M25)
as well as major transport links (e.g. Gatwick airport, Channel Tunnel) and as such we are
active members of both local and regional resilience forums – alliances consisting of category
one responders (police, fire and ambulance) as well as other agencies including the Coast
Guard, Highways Agency and Health Protection Agency – to ensure robust preparedness in the
event of a major incident.
We serve a resident population of c4.3 million people (Office for National Statistics (ONS) mid
2008 population figures, www.ons.gov.uk, 2009) which swells during the summer months due to
tourism in coastal areas; this results in an activity increase during these months (see Figure 4.1
and Figure 4.2) which we manage through deploying additional hours as with any busy period.
SECAmb values diversity, equal access for patients and equality of opportunity for staff. We aim
to create the best possible quality of life for those we serve by delivering a high quality service
to all members of our community.
Page | 28
IBP2010-15_Summary_20100325CHAPTER 4 | MARKET ASSESSSMENT
Figure 4.1 - Emergency calls by month for 2007-09
60,000
58,000
56,000
54,000
52,000
50,000
48,000 2007
46,000 2008
44,000
42,000
40,000
Source: info.secamb.nhs.uk
Figure 4.2 - Emergency responses by month for 2007-09
55,000
53,000
51,000
49,000
47,000
45,000
43,000 2007
2008
41,000
39,000
37,000
35,000
Source: info.secamb.nhs.uk
Page | 29
IBP2010-15_Summary_20100325CHAPTER 4 | MARKET ASSESSSMENT
Population in the SEC health economy is increasing and this trend is set to continue as
regeneration projects come on stream during the next 20 years including the construction of
circa 58,000 new homes in West Sussex by 2026 and the development of the North Thames
Gateway in North West Kent and Medway in the next 15 years (Healthier people, excellent care,
NHS South East Coast, 2008). Population increase will directly impact upon demand for our
services. Table 4.1 sets out the current population breakdown by PCT area.
Table 4.1 - Population breakdown by PCT area
PCT area All ages Children Working age Older people
(mid (0-15 years) (16 – (65M/60F and
2008) 64M/59F) over)
Brighton and Hove City 256.6 41.1 173.2 42.4
East Sussex Downs and Weald 332.3 59.0 184.4 88.8
Eastern and Coastal Kent 732.0 138.0 431.5 162.5
Hastings and Rother 177.6 31.7 98.4 47.6
Medway 253.5 51.7 159.6 42.2
Surrey 1,097.7 211.6 671.1 215.0
West Kent 674.6 134.6 407.3 132.6
West Sussex 781.5 144.0 450.3 187.2
TOTAL 4,317.8 813.2 2,584.8 919.8
Source: Mid-2008 Primary Care Organisations for England, Office of National Statistics, 1
October 2009
The SEC health economy has an above average population of older people with 21.3% of the
overall population being over 65(M)/60(F), the average is 19.36% (Mid-2008 Primary Care
Organisations for England, Office of National Statistics (ONS), 1 October 2009). The national
trend signifies an ageing population; this will impact upon demand for our services; see Section
4.2 for more detail.
The health economy performs comparatively well in terms of key public health issues such as
obesity, smoking and healthy eating. However, more than one in five adults in the region are
smokers and a similar proportion of adults in some areas are binge drinkers; nearly one in five
adults living in the health economy are obese (Healthier People, excellent care, NHS South
East Coast, 2008). This has implications for the types of conditions that present to us in
particular for life threatening episodes linked to unhealthy lifestyles, long term cardiovascular or
pulmonary diseases and for accidents and incidents related to the overconsumption of alcohol.
There is inequality across the region in terms of access to GP services. In 2008 GPs had an
average patient list of 1,680, however, GPs are not evenly distributed across the region which
can result in frustrated access (Healthier People, excellent care, NHS South East Coast, 2008).
This presents an opportunity for us; by providing a solution to commissioners in the form of
paramedic practitioners who can work alongside GPs and support them by conducting home
visits freeing up GPs to conduct surgeries. This is cost effective for the health economy whilst
providing a more timely service to local patients thereby improving care and experience.
Page | 30
IBP2010-15_Summary_20100325You can also read