How economic factors influence innovative rural mobility solutions
←
→
Page content transcription
If your browser does not render page correctly, please read the page content below
How economic factors influence innovative rural
mobility solutions
WP 2, GoA 2.5

Authors: Agita Līviņa, Sarmīte Rozentāle, Sandra Brigsa and Jānis Bikše
Vidzeme University of Applied Sciences
Editors: Hunter Reinhardt, Hakan Uraz (REM Consult) and Linda Randall (Nordregio)

Published: May 2020

How economic factors influence innovative rural mobility solutions

By Agita Līviņa, Sarmīte Rozentāle, Sandra Brigsa and Jānis Bikše

Copyright: Reproduction of this publication in whole or in part must include the customary bibliographic
citation, including author attribution, report title, etc.

Published by: MAMBA

MAMBA – Maximising Mobility and Accessibility in Regions Affected by Demographic Change is a project funded by the
European Regional Development Fund under the Interreg Baltic Sea Region Programme 2013-2020. The content of the report
reflects the author’s/partner’s views and the EU Commission and the Managing Authority/Joint Secretariat are not liable for any
use that may be made of the information contained therein. All images are copyrighted and property of their respective owners.
Contents

Introduction ............................................................................................................................................. 1
Aim and scope ......................................................................................................................................... 2
1. Methodology ........................................................................................................................................ 3
2. Socio-economic profiles of the MAMBA partner regions ..................................................................... 6
       Finland – South Ostrobothnia........................................................................................................ 6
       Finland – North Karelia ................................................................................................................... 7
       Germany – County Plön ................................................................................................................. 8
       Germany – County Cuxhaven......................................................................................................... 9
       Germany – Hallig Hooge (North Frisia) ......................................................................................... 10
       Poland – Bielsko County ............................................................................................................... 11
       Sweden – Trelleborg Municipality ................................................................................................ 12
       Denmark – Vejle Municipality ....................................................................................................... 13
       Latvia – Vidzeme Region............................................................................................................... 14
3. Economic framework.......................................................................................................................... 15
   3.1. External factors impacting the economic viability of mobility solutions ....................................... 15
   3.2. Internal factors impacting the economic viability of mobility solutions ........................................24
3. Economic implications of different mobility solutions ....................................................................... 29
       3.1. Transport on demand (ToD) .................................................................................................. 29
       3.2. Car-sharing ............................................................................................................................. 32
       3.3. Ridesharing ............................................................................................................................. 33
       3.5. Service-to-people ................................................................................................................... 36
       3.6. Mobility as a service (MaaS) ................................................................................................... 38
4. Risks and economic potential for rural mobility solutions ................................................................... 41
Conclusions ............................................................................................................................................ 47
References ............................................................................................................................................ 49
Annex 1. List of partners .........................................................................................................................54
Figures and tables Figure 1. Circle of declining rural areas .................................................................................................... .1 Figure 2. Authors' adapted resource and result model for mobility solutions by Pollitt & Bouckaert, 2011 ................................................................................................................................................................ 4 Figure 3. Population Density by NUTS III region (pop/km2), 2017 ........................................................... 18 Figure 4. GDP per capita at current market prices by NUTS 3 regions, thousand €, 2016 ........................22 Table 1. Age Group Structure in Partner Regions ................................................................................... 17 Table 2.Population changes 2014-2018, by NUTS 3 regions ................................................................... 19 Table 3.Employment (thousand persons) by NUTS 3 regions .................................................................20 Table 4.Types of mobility flows. ............................................................................................................. 23
WP2 / GoA2.5 / How economic factors influence May 2020
innovative rural mobility solutions
Introduction
Accessibility to services is crucial for the wellbeing of rural residents and the social and economic
resilience of rural communities (ENRD, 2017). Ensuring this accessibility can be challenging, as the long
distances and low population densities that characterise most rural areas are not conducive to the
provision of services or infrastructure. Large distances between communities and households present
logistical challenges, while the lack of critical mass means that investments are often large relative to the
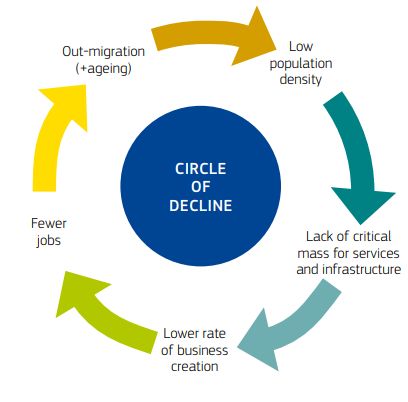
number of people served. The resulting lack of accessibility can have a negative impact on economic
activity and quality of life. This, in turn, may lead to the outmigration of the working-age population,
intensifying the effect of population ageing and ultimately resulting in economic and social stagnation.
Improving mobility and accessibility to services in rural areas is central to breaking this ‘circle of decline’
(OECD, 2010) (see Figure 1).
In the literature, access to transport is
emphasised as a vital factor in increasing the
competitiveness, sustainability and
attractiveness of rural and remote areas by
providing access to employment, education,
healthcare and leisure activities (Codatu, 2016).
In contrast to urban areas, where transport
initiatives generally focus on environmental
concerns, rural transport initiatives tend to
have accessibility as the primary focus
(OECD, 2009). As such, a key challenge for
rural areas is finding cost-effective ways to
increase accessibility and mobility for all
residents regardless their socio-economic
and health status.
Accessibility challenges in rural areas are by no Figure 1. Circle of declining rural areas. Source: OECD 2010
means a new phenomenon. These challenges
have been exacerbated in recent years, however, by cuts to public budgets, centralisation of public
services and demographic change. Demographic trends such as population ageing have increased the
demand for certain services, while at the same time, cuts to public service budgets have made them more
difficult to provide. Thus, it is not only a question of meeting the increasing demand for existing services,
there is also a need for innovative approaches that address accessibility challenges in new ways (Copus
et al., 2016).
1WP2 / GoA2.5 / How economic factors influence May 2020
innovative rural mobility solutions
The emerging solutions for rural mobility are a combination of both social, digital and institutional
innovations and are generally focused on novel and flexible forms of mobility and shifting a paradigm
from car ownership to vehicle usage (e.g. car and ride sharing). Innovations are also emerging in the form
of “service-to-people” initiatives. Local people and non-profit organisations are at the forefront of these
innovative approaches, often acting as providers of solutions in the absence of state or market
alternatives (ENRD, 2017). This study describes the economic determinants that may influence the
development and uptake of innovative mobility solutions in rural areas.
Aim and scope
This study is an output of the MAMBA project (Maximising mobility and accessibility of services in rural
areas of the Baltic Sea Region), funded by the Interreg BSR Programme 2014-2020. MAMBA project
included a consortium of fifteen partners from six countries, and resulted in the implementation of a
range of innovative rural mobility solutions in remote regions, towns and villages throughout the Baltic
Sea Region. The study was originally published in July 2018 as a “pre-study”, with the aim of supporting
the MAMBA project partners to develop and implement innovative rural mobility solutions in rural
locations around the Baltic Sea Region. At this time, the study was designed to highlight the economic
deteminants that may influence the success of the innovative rural mobility solutions planned by the
project partners. It addressed the key aspects for consideration in the context of the different solutions
they were planning to implement. This revision includes much of the original material along with
examples throughout that highlight the ways in which economic determinants acted as enablers and/or
barriers in the implementation of the rural mobility solutions piloted through the MAMBA project. Where
relevant, the revision also incorporates newly published material from other projects and research.
The study consists of four chapters. Chapter 1 gives a brief description of data collection and analysis
methods. Chapter 2 describes socio-economic situations and mobility needs for MAMBA regions, using
different economic indicators. Chapter 3 provides a short account of the characteristics of mobility
solutions used in MAMBA: objective and primary users, administrative, financial, and infrastructure
considerations. The chapter ends with some learnings from MAMBA. Chapter 4 highlights the main
economic risks, as well as providing some hints about risk preventive measures. It also describes the
economic potential for each mobility solution used in the MAMBA project. Conclusions summarize the
main issues in the context of an economic analysis framework which should be taken into account in
implementing any of these innovative mobile solutions.
2WP2 / GoA2.5 / How economic factors influence May 2020
innovative rural mobility solutions
1. Methodology
Data collection methods
To develop socio-economic profiles of the nine MAMBA partner regions — South Ostrobothnia and
North Karelia in Finland; County of Plön, Cuxhaven and the remote island of Hallig Hooge in Germany;
Bielsko County in Poland; Trelleborg Municipality in Sweden; Vejle Municipality in Denmark; and
Vidzeme Region in Latvia — desk research, expert interviews, and input from MAMBA workshops were
used for data collection.
The desk review was used for the following data sources:
● 30 scientific articles on mobility solutions;
● Reports on mobility issues by other ongoing and completed EU projects;
● The MAMBA “Inventory of Innovative Mobility Solutions” (70 case studies);
● Eurostat databases (Regional demographic statistics (reg_dem), Regional economic accounts -
ESA 2010 (reg_eco10), Regional business demography (reg_bd).
Semi-structured interviews were carried out with experts from the transport industry in local
municipalities, and regional transport specialists: Aldis Kušķis, former member of the Tourism and
Transportation Commission of the European Parliament; Brendan Finn, Senior Consultant at ETTS Ltd;
Bruno van Zeebroeck, Senior Researcher at Transport & Mobility Leuven, Belgium; and Angela Jain,
Nexus Institute for Cooperation Management and Interdisciplinary Research, Germany. Interviews with
experts have been carried out with their consent, for inclusion in the report. Answers were obtained
during face-to-face interviews and electronically.
Moreover, notes from a Cost-Benefit Analysis Workshop at the International Transport Forum (25-26
April 2018, Stockholm, Sweden) were used in addition to findings obtained from discussions with
partners during a “world café” session (MAMBA internal partner meeting in Joensuu, Finland, on 22
March 2018).
Data analysis methods
The data analysis for this study focused on identifying factors that can be used to clearly demonstrate
the benefits of a given solution from an economic perspective. In other words, understanding the impact
on the local situation, with or without the intervention. For this purpose, the so-called “results models”
can be used. Several different types of results models have been developed, including the resource-result
model, result-based accountability, the logic model, logical frameworks or log frames (Pollitt &
Bouckaert, 2011). An adapted version of the Bouckaert input-output model has been deemed optimal for
3WP2 / GoA2.5 / How economic factors influence May 2020
innovative rural mobility solutions
understanding the economic context with regard to innovative rural mobility solutions. This model is
shown in Figure 2.
Figure 2. Authors' adapted resource and result model for mobility solutions by Pollitt & Bouckaert, 2011
The sequence and interaction of the elements presented in the model above can be applied to the
MAMBA context as follows:
● Socio-economic situation needs: The analysis of the socio-economic environment identifies
problems, from which the goal of the mobility solution is formulated. A comparative analysis of the
economic conditions in the MAMBA regions will then be conducted, including the following
indicators: population size, population density, population structure, area, GDP per capita, main
industrial sectors, and infrastructure. To ensure the comparability of the partner regions, the
economic indicators are selected at the Eurostat NUTS3 level (see Annex 1). See Chapter 2 for a more
detailed description.
● Objectives: Objectives are defined by the stakeholders implementing and designing mobility
solutions. Objectives, in general, highlight the direction of activities required to reach the goal of the
mobility solution project.
● Risk analysis: The economic potentials and risks of different innovative rural mobility solutions are
assessed based on the project partner’s business model canvases and socio-economic profiles, as
4WP2 / GoA2.5 / How economic factors influence May 2020
innovative rural mobility solutions
well as cases from an internal MAMBA inventory of good practice. The results of the analysis are
provided in Chapter 4 of this report.
● In the context of this study, inputs are the human, financial, material, and information resources
required to realise a mobility solution through planned targeted activities. Inputs can be mapped
using the business model canvas, or other planning tools.
● Activities: These are measures carried out by Mobility Centres and the actors responsible for
implementing mobility solutions. At this stage, it is crucial to record successes and difficulties
encountered throughout the implementation process, with the purpose of creating a knowledge base
for future decision-making. This includes activities such as the development of a strategy to
communicate with the community and local government, marketing, and the choice of a digital
solution or the selection of potential providers.
● Outputs: These are immediate results of the activities performed, characterised by different output
indicators, such as the number of passengers. The economic efficiency of the achieved output is
described by the input/output ratio. The optimal solution is to provide the required level of services, or
the amount of goods, with the lowest quantity of inputs.
● Outcome: This is a result that has been achieved in the medium- or long-term, and shows changes in
opinions, beliefs or behaviour in society. Outcome indicators describe the degree of achievement of
the goal as a result of project implementation. The degree to which they are achieved is influenced
both by the output of the project and the external (political, social, economic, fiscal, etc.)
environment.
● Impact: The impact indicators show the extent to which the original goal has been achieved. In other
words, how the project has affected the external environment, or socio- economic situation, in the
region.
5WP2 / GoA2.5 / How economic factors influence May 2020
innovative rural mobility solutions
2. Socio-economic profiles of the MAMBA partner regions
Through the MAMBA project, several new and innovative mobility solutions will be implemented in the
project partner areas. This chapter provides a brief description of the associated partner regions, in order
to gain an insight into their economic framework and understand how the impact of economic factors
influenced the choice of specific mobility solution in that area. Eurostat and open access data are used
to describe the regions quantitatively.
A list of partner regions and planned pilots is attached (see Annex 1). Further details on these activities
are also available on the MAMBA website.
Finland – South Ostrobothnia
Situated on the west coast of Finland, South Ostrobothnia
Total area 13,400 km2
(Finnish: Etelä-Pohjanmaa) is part of the Western Finland
Population 190,000 Province (Finnish: Länsi-Suomi). The regional centre and largest
city, Seinäjoki, is located about 313 km north of Helsinki, and is
Population 14.4 per km2
density home to more than 40% of the region’s population.
Urban‐rural Economically, the food industry (agriculture, hunting, and
Intermediate
typology ancillary food production), and the textile, clothing and leather
region1
industry are of particular importance to the region, contributing
significantly to the nation’s economic output in these fields.
According to the region’s Chamber of Commerce, technological manufacturing for the metal industry
and wood processing are also important staples in the region, and business services also benefit from a
healthy presence of SMEs (South Ostrobothnia Chamber of Commerce, 2019).
The most densely populated areas lie along the Kyrönjoki and Lapuanjoki rivers. However, even here, the
region is very thinly populated, being among the lowest-density of all the MAMBA partner regions.
Planning for South Ostrobothnia’s developmental is largely focused on closer internal cooperation in the
region. Intraregional accessibility is generally good, and both industrial and demographic mobility
benefits from major highways, interregional railroads, and good access to ports.
However, road quality and infrastructure were identified as weaknesses, both by the Regional Council of
South Ostrobothnia’s regional development plan (2015) and through surveys conducted as part of the
1
For the purposes of regional profiling, the following typology was utilised in assigning urban-rural typologies:
Predominantly rural region: rural population is 50% or more of the total population.
Intermediate region: rural population is between 20 % and 50 % of total population.
Predominantly urban region: rural population is less than 20% of the total population.
6WP2 / GoA2.5 / How economic factors influence May 2020
innovative rural mobility solutions
MAMBA project. Furthermore, the sparseness of the population means that the lack of services is felt
particularly strongly outside the region’s small cities (see MAMBA Regional Profile, Facilities map).
Demographically, the region is characterised by a high youth dependency ratio 2; one which far exceeds
national, EU, and even MAMBA partner region averages, as well as an above-average elderly dependency
ratio.
According to the South Ostrobothnia Business, Transport and Environment Centre’s Road Management
and Transport Plan, 2018-2022, a present aim for the region is to increase demand for public transport in
the urban areas of Kokkola, Seinäjoki and Vaasa. Connections in less concentrated areas often remain
less developed, however, and rural parts of the region maintain only basic connections for morning and
afternoon commutes.
With the ageing of regional populations, there is an increasing need for social and health services. Under
the current administrative set-up, these services are currently provided at the municipal level in Finland.
In line with the Regional Government, Health and Social Services Reform that was set to take place in
Finland by 2020, the Regional Council of South Ostrobothnia set out to increase access to services by
coordinating the disperate range of transport activities taking place within the social and health care
sector in municipalities across the region. The regional reform was cancelled in 2019 however the
Regional Council of South Ostrobothnia intends to continue with this work.
Finland – North Karelia
Total area 21,584 km2 Bordering Russia, the region of North Karelia (Finnish:
Pohjois-Karjala) is an expansive region of Eastern Finland, and
Population 164,755 the largest of the MAMBA partner regions. Joensuu, the
Population 7.6 per km2 regional centre and largest city of North Karelia, was
density established in the late 19th century as a commercial centre,
Urban‐rural Predominantly and remains an important forestry, education, ICT and
typology rural region business centre.
There is also a significant student population of over 15,000,
which is significant in the context of the city’s total population
2
Per the MAMBA Regional Profile Reports: “The dependency ratio is a measure of the population structure. It
specifies the ratio of the population not in the labour force (“the dependent part”, ages 0 to 14, and 65 and
more) and the population typically in the labour force (ages 15 to 64). The two age dependency ratios are
commonly used to measure the pressure on a productive population.”
7WP2 / GoA2.5 / How economic factors influence May 2020
innovative rural mobility solutions
of around 76,000. Forestry and the bioeconomy are of chief importance to the region’s economy. North
Karelia is a predominantly rural region, being one of only two MAMBA partner regions identified as such.
Although North Karelia has passable public transport accessibility (see Regional Profile, proximity map)
and a variety of commercial public transport options, the lack of appropriate density in most parts of the
region — a necessary component for the economic viability of public transport — means that most are
unprofitable, have ageing fleets, or have very low passenger numbers (Regional Council of North Karelia,
2010). This is particularly problematic in conjunction with an above-average elderly dependency ratio,
and a generally low service proximity (see Regional Profile).
According to Finnish national law, elderly residents and those with disabilities are guaranteed a certain
number of monthly trips. However, because of the inherent unprofitability of such a scheme in a region
as vast and sparsely populated as North Karelia, the only way to maintain existing services is through
improving cost-effectiveness. This leaves the door open to demand-responsive mobility paradigms,
including a combination of trips for those groups in need alongside regular passengers. The North
Karelian Transport Combination Centre, for instance, has existed since 2009, and provides call-based
services to populations in peripheral areas.
The mobility solution being implemented in North Karelia most closely resembles Mobility as a Service
(MaaS), though, importantly, it does not include a common payment system at this stage. Instead it
provides one platform thorugh which all mobility solutions on offer can be accessed through a single
platform. The platform combines different mobility solutions in a single trip, giving the user easy access
to information that can help them determine the best route.
Germany – County Plön
Total area 1,083 km2 County (German: Kreis) Plön is a district in Schleswig-Holstein,
Germany, and an attractive holiday destination. Located only 30
Population 128,304 km from the state’s capital, Kiel, and 50 km from its second-largest
Population 118.0 per km2 city, Lübeck, the eponymous district seat of around 9,000 people is
density regionally connected by a single East-West rail line. The county also
Predominantly borders Neumünster (with a population of almost 80,000) and is
Urban‐
urban region within commuting distance of Hamburg, 100 km south-west of
rural
typology Plön.
While the tourism industry is important to the district, which is
dotted with lakes and attractive scenery, the district seat is also
home to some notable service-oriented enterprises. For instance, the Fielmann optical company opened
a non-profit optician training centre in Plön Castle in 2006, and the Bundeswehr (the German military) is
8WP2 / GoA2.5 / How economic factors influence May 2020
innovative rural mobility solutions
the largest employer in the city. There is hardly any manufacturing industry in County Plön, and the area
is dominated by farmland.
This is despite its predominantly urban typology, which is due to its relative density and the concentration
of population in a few small cities and townships. The general density of the county’s population ensures
relatively good public transport and service accessibility relative to the other MAMBA partner regions.
Kreis Plön is also one of the last counties in Schleswig-Holstein to own its own transport company. While
many publicly-owned public transport companies are still active in Germany, especially in the east of the
country, the operation of such services is often carried out by a private operator – one which receives a
concession through a public tendering process (Van Zeebroeck & Florizoone, 2019).
Despite the district’s relative density, however, buses do not run very frequently outside of the area’s few
cities, and then mostly only to suit school hours. This is particularly problematic in light of the county’s high
level of elderly dependency, which stands out as the highest among the MAMBA partner regions and exceeds
national and EU averages.
Among its key points, the Kreis Plön Regional Transport Plan (Regionalen Nahverkehrsplanes des Kreises
Plön, 2018) identifies the development of transport on-demand as being complementary to more traditional
public transport (e.g. buses). Since a particular mobility challenge within the area is lack of public transport at
weekends and in evenings, the mobility solution being implemented is a Transport on demand (ToD)
service, combined with taxis and coordinated with major bus lines.
Germany – County Cuxhaven
Total area 2,058 km2 Kreis Cuxhaven, located in Lower Saxony, is a rural county with a
largely maritime history. Cuxhaven, the county seat, is one of the
Population 198,103 largest fishing ports in the nation, and both the county and its seat
Population are shaped by the port logistics, food production, fishing, (blue)
96.0 per km2
density energy and tourism sectors.
Urban‐ Intermediate Although the area has a degree of economically sustainable
rural region independence, thanks to its strong SME base, it is also caught up in
typology the gravity well of Hamburg’s metropolitan influence. The district is,
for instance, involved in the “Creation of an Integrated, Cross-Traffic
Mobility Concept” project of the Metropolitan Region of Hamburg.
Although the city of Cuxhaven is its own transit authority, Cuxhaven County — together with seven other
districts of the Metropolitan Region — also founded Nord-Ost-Niedersachsen mbH (VNO), which acts as
the district’s planning and management company in operational, traffic and organisational issues.
9WP2 / GoA2.5 / How economic factors influence May 2020
innovative rural mobility solutions
While public transport and service accessibility are relatively consistent throughout Kreis Cuxhaven, the
district is notably subject to something many rural areas in Germany and abroad suffer from: namely, the
effects of demographic change through depopulation and ageing. Because traditional public transport
relies on sustainable demand generated by population density, declining passenger numbers means
areas that undergoing demographic change need to adapt. In the county’s transport plan, demographic
change is therefore a recurring theme. While the elderly dependency ratio is above average in the area,
equally notable is its far-below average youth dependency. Indeed, as school transport is often the
backbone of public transport in rural areas, the local transport plan places particular emphasis on the
declining school population. A student body in numerical decline may lead to the merging of schools,
concentrating them into fewer locations. A consequent reduction in the number of schools may mean
that more students will need more transport and, moreover, that additional means of transport will have
to be provided (Nahverkehrsplan des Landkreises Cuxhaven, 2019, pp. 21-22). This decline in the number
of pupils is therefore not only a challenge to the economic viability of public transport, but also to the
morphology of the area.
Cuxhaven implemented the mobility solution rural car-sharing (village car). This is an association- or
cooperative-based form of car-sharing. It features a voluntary shuttle service to increase access to and
from rural areas with a decreasing population density.
Germany – Hallig Hooge (North Frisia)
Total area 2,083 km2 Hallig Hooge is a small island in the Wadden Sea. It measures 5.78 km2
and has a population of around 100, making it is by far the smallest of
Population 165,462
the MAMBA partner areas. The island is a part of the Schleswig-Holstein
Population Wadden Sea National Park, which is a popular tourist destination in
80.5 per km2
density summer. It has little by way of social infrastructure. A new MarktTreff
supermarket franchise in the centre of the island, operating beyond its
Urban‐ Intermediate
rural
primary purpose as a grocery store, serves as both a meeting place and as
region a medical centre. Public transport is, understandably, non-existent on the
typology
tiny island, which often floods. What little economic activity exists on
Hooge almost exclusively comprises of tourism and agriculture.
The area lies in North Frisia (German: Kreis Nordfriesland), a county of Schleswig-Holstein and a
predominantly rural area which has struggled to combat demographic change and depopulation in
recent decades. Wind energy and agriculture comprise the large majority of the region’s economy, but
past decades have seen the same trend towards an ageing population which has largely come to shape
rural Germany. The morphological rurality of the region means that mobility planning is often based
around school commuting, which is another already-identified problem, in the light of a declining youth
10WP2 / GoA2.5 / How economic factors influence May 2020
innovative rural mobility solutions
populations. The geography of the district, however, makes effective administration of public
transportation extremely difficult. The marshy conditions of polders and coastal areas are particularly
poorly supplied. As a result of the settlement structures, there are no noteworthy concentrations of
service provision, and a lack of local amenities is endemic in the coastal rural communities.
The mobility solution chosen for implementation is therefore the service-to-people approach. The aim
is to improve the quality of life for Hallig inhabitants, providing them with the opportunity to receive
counselling services, especially for elderly people who want to be able to grow old in the surroundings
they are used to.
Poland – Bielsko County
Total area 2,354 km2 Bielsko County is an administrative district in southern Poland, near
the borders of both Czechia and Slovakia. It consists of 10
Population 162.926 municipalities, all designated rural, with the exception of three small
Population cities – Czechowice-Dziedzice (population 43,000), Szczyrk
355 per km2
density (population 5,450), and Wilamowice (population 14,200). The
Intermediate district’s geography is dominated by the county’s seat and regional
Urban‐rural
region centre, Bielsko-Biała, which serves as the area’s economic and
typology
political hub. The city itself, however, is administered as a separate
county. Bielsko’s political boundaries are consequently wrapped
around the city, severing it (in statistical terms) from the population centre. The county has by far the
highest population density of all the MAMBA partner regions, as well as the highest population overall.
Nevertheless, it is marked by a largely rural character.
Perhaps the most prominent feature of the Bielsko district economy is its geographic bipolarity, shaped
by two poles with distinct economic characteristics. In the north of the district, the town of Czechowice-
Dziedzice and its neighbouring municipalities form an industrial centre, which is rooted in the region’s
centuries-old industrial history. In the south, the town of Szczyrk and its neighbouring municipalities —
Buczkowice, Wilkowice, Kozy, Porabka, and Jaworze — form a tourist centre. Most strategic
development in the region is concentrated on economic and demographic growth in Bielsko-Biała,
seeking to capitalise on the city-region’s already rather impressive industrial and business profile.
As set out in the MAMBA Regional Profile, both public transport and service accessibility are relatively
good, and there are few contiguous areas of low density population. However, dependence on private
transport remains high, as the attractiveness of public transport is not enough to supersede private
automobile transport. Moreover, the strong influence of the regional centre has led to progressive
marginalisation in relation to the central city’s urban agglomeration, which includes part of Bielsko
11WP2 / GoA2.5 / How economic factors influence May 2020
innovative rural mobility solutions
County (chiefly, Czechowice-Dziedzice). The presence of a mid-sized, economically developed city
within the region is a key characteristic that is particular to Bielsko among the MAMBA partner regions.
The mobility solution selected here was a Transport on demand service. This mobility solution was
chosen in order to be able to provide regular transport services from places where public transport does
not provide sufficient coverage.
Sweden – Trelleborg Municipality
Total area 1,175.03 km2 Trelleborg Municipality is the southernmost municipality of Sweden,
in Skåne County, and is composed of the City of Trelleborg and five
Population 43,359 surrounding rural municipalities. Trelleborg’s port is dominant in the
Population 126.8 per km2 municipality’s economy, being the largest roll-on-roll-off facility in
density Sweden, and the city has been industrial since the 19th century. The
Intermediate impact of the municipality’s economic geography on the county is
Urban‐
region overshadowed regionally, however, by Malmö — the third-largest
rural
typology city in Sweden, only 25 km to the north — and by Helsingborg in the
north of Skåne.
In the region’s development strategy, the polycentric layout of the
county (distinctive to Sweden, whose cities are usually spread out and morphologically monocentric) is
capitalised upon through its tailored transport infrastructure, as well as its nurturing of growth engines
and regional hubs. Although the percentage of joint financing for infrastructure among the regions and
municipalities is highest in Skåne, the Swedish Transport Administration has detailed some striking
weaknesses in the region through its capacity study. According to the regional development strategy,
Skåne’s two labour market regions — Malmö/Lund/Helsingborg and Hässleholm/Kristianstad — have
poor mobility both within and between them (The Open Skåne 2030, 2014). Trelleborg, though proximal
to the former region, is caught in the economic orbit of neither. Although service provision and
transportation accessibility are relatively high in the area, large parts of the municipality are contiguously
low-density, and “reaching distant areas with lower population density” (mini-survey response in the
MAMBA Regional Profile) remains problematic.
In Sweden, municipalities have a high level of political independence. This political independence does
not necessarily correlate with a consolidated or streamlined approach to administration. Many rural (and
urban) areas in the country suffer from the lack of a single system by which to manage all the different
forms and modalities of transport, resulting in separately planned and somewhat balkanized operational
frameworks (Beecroft et al., 2019). Consolidating the competencies of the various responsible bodies,
and establishing a more coherent regulatory framework for public transport and special passenger
12WP2 / GoA2.5 / How economic factors influence May 2020
innovative rural mobility solutions
transport services, could offer means of improving coordination and increasing the accessibility and
efficiency of public transport.
The mobility solution being trialed in Trelleborg Municipality is a service that increases social
opportunities for older people by offering day trips on the weekend. The trips allow older residents to
visit destinations that are quite hard to get to with existing public transport and are also designed to
increase the confidence of elderly residents in using public transport. Trelleborg Municipality will also
trial a service-to-people approach in the form of a coworking space.
Denmark – Vejle Municipality
Total area 8,777 km2 Vejle Kommune is a rural municipality located in the south-eastern
Jutland Peninsula. Its county seat, Vejle has a population of almost
Population 111,743 55,000, making it Denmark’s ninth largest urban area. It is also the main
Population 105.6 per km2 town in the Region of Southern Denmark. The city has been historically
density defined by its industrial development, earning the epithet “the
Manchester of Denmark”. The municipality is a key part of the so-called
Urban‐ Intermediate “triangle region” (formed initially by Vejle and the neighbouring
rural region
typology municipalities Kolding and Fredericia, but now composed of seven
municipalities). Historically, this grew out of the industrial and
economic cooperation between the founding municipalities. Although
this strongly industrial background has shaped the municipality’s morphology historically, its character
has remained largely rural, and the central city’s economy has in the past decades been shifting from an
industrial to a service-based one.
Despite the recent transition to a service and retail economy, however, economic growth remains slow
in Southern Denmark. The region’s development is focused on key industries (economic growth and
productivity being the main indicators for this), and in its development plan, reference to rural areas is
focused exclusively on “growth opportunities and potentials” (Region of Southern Denmark, 2012). The
same plan makes little or no reference to infrastructure or mobility, let alone making them a strategic
focus. Vejle, as a regional centre, is well-serviced and well connected. However, as the Regional Profile
maps indicate, large patches of contiguous low-density areas are prevalent through the region, and it is
readily apparent that there is both a relatively poor local transport service and a particularly pronounced
lack of accessibility to that service.
In order to help solve the transport issues in Smidstrup/Skærup, the mobility solution chosen for
implementation is a ride-sharing application.
13WP2 / GoA2.5 / How economic factors influence May 2020
innovative rural mobility solutions
Latvia – Vidzeme Region
Total area 15,245 km2 The Vidzeme region lies in the northeast of Latvia and covers nearly a
quarter of the nation, making it the largest region by area in the
Population 195,998 country. Its regional centre and largest city is Valmiera, with a small
Population population of around 25,000 people. Typologically, it is one of only two
12.9 per km2
density predominantly rural areas among the MAMBA regions. Vidzeme’s
economy is largely emblematic of rural regions in general, being
Urban‐ Predominantly composed in large part of food processing, wood processing, industrial
rural rural region
typology equipment, construction, agriculture, forestry and fisheries.
Historic developments in the past thirty years have had a drastic
impact on rural Latvia. The post-socialist experience of many European
countries — as well as its integration into the European Union’s economic space, increased globalisation,
and a consequent increase in mobility — have left the nation and its periphery profoundly changed. A
concomitant depopulation of that periphery, fuelled by rural-urban migration, has meant that in a
regional development context, an area’s proximity to Riga is now becoming more important than
regional differences (Zobena, 2015). As a result, mobility and accessibility paradigms are changing. As
populations thin out, public transport becomes less financially viable, and the organisation of service
provision needs to adapt.
As is set out in the MAMBA Vidzeme Regional Profile, transport and service accessibility remain
significant challenges. This is due in no small part to the region’s geography as a particularly large, rural
area, second among the MAMBA partner regions only to North Karelia, in Finland, in terms of population
density. The Vidzeme Planning Region Development Strategy through to 2030 (published in 2016) sets
out six long-term priorities, one of which is to become an “accessible region”. That is, to increase service
accessibility for rural areas. In this, innovative mobility service solutions will need to complement the
public transport system. Although all public transport providers in the country are private, the Latvian
institutional framework has often stymied innovation in transport and mobility, as public transport
services are required to be organised both hierarchically and as a network. Outside Riga and the other
large cities (which organise their own public transport systems), public transport service operators are
awarded exclusive Public Service Obligation (PSO) contracts, requiring them to provide public transport
on specified terms within their jurisdiction. To date, no demand-responsive transport services exist in
Latvia. However, the relevant legislation has recently been amended to allow app-based ridesharing,
with the intention of sparking innovation in the field (Finn, 2019).
Transport-on-demand was therefore implemented, in order to provide older people with access to a
variety of services in places where public transport is unavailable.
14WP2 / GoA2.5 / How economic factors influence May 2020
innovative rural mobility solutions
3. Economic framework
The economic framework describes the external and internal factors by which stakeholders are
positioned. These conditions may impact the objectives, as well as implementation process of the
mobility solution, in both directions – positive and negative. Understanding how the economic
framework affects the intended (or already implemented) innovative mobility solution in a particular
rural area is essential for effective decision-making. It begins with understanding the essence of internal
and external factors:
● External factors are the macroeconomic conditions in a given context; for example,
demography, population change, economic structure and legal requirements. Those factors are
ones that, most likely, mobility solution implementers cannot change. At the same time, they
should be taken into account when stakeholders are considering the optimal mobility solution
for a given area.
● Internal factors are the aspects that can be selected and influenced by the decision-maker or
project implementer: choice of financing, business models and processes (including
technological solutions), customers, stakeholders, marketing and communications.
According to the scientific articles and previous project reports reviewed for this study, the most
established economic factors influencing mobility solutions are population density, population structure
and economic development level. More recently, lifestyle and habits has also been identified, in the
behavioural economy literature, as having an increased impact on economic processes, including
mobility practices (Pankratz, 2017; Keeton, 2018). For a detailed description of the impact of lifestyle
factors on innovative rural mobility solutions, please refer to the MAMBA Pre-study on sociocultural
factors (2018).
Together, these broad external factors establish the general context in which the proposed mobility
solutions have been, or are being, established. Further, the internal qualities of relevant stakeholders,
and consequently the structure and objectives of the proposals in question, influence the impact,
effectiveness and sustainability of implementing new mobility schemes in rural contexts. The following
sections will explore these factors in relation to the project regions.
3.1. External factors impacting the economic viability of mobility solutions
External factors affecting the economic viability of mobility solutions are population structure and
population density; labour market provision (few large enterprises or many small enterprises, seasonality
of jobs) (Litman, 2010); structure of the economy (ibid.); and lifestyle (estimation of time savings from
new mobility solutions) (Keeton, 2018). Spatial-land patterns can be determined as a specific group of
15WP2 / GoA2.5 / How economic factors influence May 2020
innovative rural mobility solutions
external factors and include topography, climate, infrastructure and the placement of settlements (Rural
Transport Handbook, 2004).
In the following, several external factors that influence the efficiency of newly introduced mobility
solutions will be presented. In order to compare the partner regions, the macroeconomic situation of the
MAMBA regions is analysed using the Eurostat NUTS 3 level (see Table 1). This must be accompanied
with the caveat, however, that some of the regions do not precisely reflect the actual area of intervention
statistically. Specifically, the following exceptions must be made:
● Trelleborg Municipality (composed of five combined municipalities and the city of Trelleborg) is
a district at the southern extremity of Skåne county, the statistical profile of which is drastically
weighted by the larger urban areas of Malmö (with a metropolitan population of almost 730,000)
and Helsingborg (with a population of 108,334).
● Vejle Municipality is similarly a smaller sub-unit of the region in total. Its population of 110,000
is small in the context of the NUTS3 (South Jutland) region’s 720,000.
● Bielsko County does not include the urban centre of Bielsko-Biała (population of 170,000) in its
administrative district, where the mobility solution will be applied; the governing NUTS3 region,
however, does.
● Hallig Hooge is only a very small island in the North Frisia region, with a population that does
not exceed 150.
In all of these cases, the regional statistics allow for a relative comparison across the MAMBA regions, as
they are in most cases emblematic of the region as a whole. They must also be analysed, however, with
these caveats in mind.
16WP2 / GoA2.5 / How economic factors influence May 2020
innovative rural mobility solutions
Table 1. Age Group Structure in Partner Regions (NUTS III level – 2018)
Total Less than From 15 to 65 years
Population 15 years 64 years or over
EU Average 512,379,225 16% 65% 20%
Bielsko* 660,324 16% 67% 17%
Cuxhaven 198,100 13% 62% 25%
Hooge (North Frisia)* 165,462 13% 63% 24%
North Karelia 162,986 14% 61% 25%
Plön 128,842 13% 61% 26%
South Ostrobothnia 190,910 17% 59% 24%
Trelleborg (Skåne)* 1,344,689 18% 62% 20%
Vejle (South Jutland)* 724,520 17% 62% 21%
Vidzeme 188,494 15% 64% 21%
* These areas are those subject to the conditions/exceptions described in the introductory paragraph, 2.1
Population structure and population density
The demand for different types of mobility is affected by the population structure in rural areas, including
migratory movements away from (or towards) rural areas, ex-urban residential dispersion, and the types
and patterns of settlement. The importance of these factors is particularly emphasised by South
Ostrobothnia being among the lowest-density MAMBA partner regions.
During the mobility planning phase (the “Input” element in the Bouckaert model), the socio-cultural
characterisation and population statistics become an integral element of the economic framework, since
forecasts — such as distance, direction, route, time of day, mode and brand of transport, and number of
drivers — can be made on that basis. It can be assumed that the structure of a population, as well as the
ability to pay for the service provided, affects the purpose, regularity and the timing of mobility. In most
cases, the grouping of passenger types and modalities can result in a lower cost per kilometre for a
passenger. For example, Flextraffic in Denmark is an option used by older people. Accordingly, prices can
be adjusted to take into account their ability to pay.
The number of school-aged children in a region influences mobility needs and goals, such as travel to and
from educational facilities during weekdays and leisure mobility on weekends. This is particularly felt in
rural regions, which often rely on school populations as the backbone for scheduling and passenger
17WP2 / GoA2.5 / How economic factors influence May 2020
innovative rural mobility solutions
numbers, but suffer from disproportionately ageing populations (Regional Council of North Karelia,
2010). For this audience, it is vital to provide mobility services to larger centres; ones with cultural and
additional opportunities unavailable in the local community (Farugia, 2016; Gabriel, 2004; Corbett, 2007).
This is the case in the Vidzeme region, for example, where transport on-demand is used by elderly people
to attend cultural events. Passengers surveyed acknowledged that new mobility solutions allowed for
more frequent attendance at cultural events at weekends and in evenings when public transport does
not provide adequate coverage. In the long term, this creates a higher demand for cultural services, which
has a positive impact on the development of the region, increases choice overall, and improves the
quality of life.
Another example is the Trelleborg municipality, which uses the bus on weekends to offer opportunities
for the elderly to join day trips and excursions. This enables the elderly, disabled people, and other groups
suffering from transport poverty to socialise.
Overall, MAMBA project regions are characterised by ageing populations, with the 65+ population being
up to 5% larger than the EU average in several of those regions.
The average population density in all MAMBA project regions is 90 per km2; with the highest in Bielsko
County (Poland), at 355 pop./km2, and the lowest in North Karelia (Finland) at 7,6 pop./km2 (see Figure 3).
EU Average 117.7
Bielsko 285.9
Cuxhaven 96.0
North Frisia* 80.5
North Karelia 7.6
Plön 118.0
South Ostrobothnia 13.8
Trelleborg 121.7
Vejle 84.4
Vidzeme 12.6
50 100 150 200 250 300 350
Figure 3. Population Density by NUTS III region (pop/km2), 2017. Source: Eurostat, 2019
The lower the density of the population, the more expensive it is to maintain the transport infrastructure.
The availability and frequency of mobility services will therefore generally be limited in areas with a
sparse population. Since 2000, five of the nine MAMBA regions have experienced population decline.
18WP2 / GoA2.5 / How economic factors influence May 2020
innovative rural mobility solutions
One of these, Vidzeme, has experienced the most extreme decline, losing almost a quarter of its
population since 2004 (see Table 2).
Table 2.Population changes 2014-2018, by NUTS 3 regions. Source: Eurostat, 2019
2000 2004 2008 2012 2016 2018 % Change
‘00-‘18
Bielsko* 640,131 644,631 649,695 655,883 658,613 660,324 +3%
Cuxhaven 203,833 206,545 202,933 198,115 198,103 198,100 - 3%
South Ostrobothnia 196,795 193,954 193,815 193,735 192,586 190,910 - 3%
Hooge (North Frisia)* 163,974 166,342 166,727 163,029 163,960 165,462 +1%
Plön 131,960 135,038 135,422 127,212 128,304 128,842 - 2%
North Karelia 172,551 169,129 166,744 165,906 164,755 162,986 - 6%
Trelleborg (Skåne)* 1,123,786 1,152,697 1,199,357 1,252,933 1,303,627 1,344,689 +20%3
Vejle (South Jutland)* - - 712,249 716,152 720,296 724,520 +2%†
Vidzeme - 243,342 228,424 208,728 195,998 188,494 - 23%†
* These areas are those subject to the conditions/exceptions described in the introductory paragraph, 2.1.
† Percent change from year of earliest recorded data in this set.
There is some correlation between age, mobility, and employment. Regions with an ageing population
generally experience decreased employment. Demographic changes influence the purpose of mobility,
the traffic load, and the pattern of transport usage. An ageing population may have an increased demand
for social and health care service provision, which may cause changes in routes and the timing of
transport services.
Increases in the working population, on the other hand, will have a correspondingly positive impact on
the demand for mobility. Bielsko and Skåne stand out statistically in this regard. However, it should be
noted that both these regions have large urban areas that tip the scales in terms of both employment
and density, and thus the economic sustainability of mobility solutions (see Table 3).
With the exception of some worrying indicators about a decrease in employment since 2010, there is a
steady increase in employment in the Plön and Vidzeme regions overall in recent years, which indicates
3
This anomalous number is a result of Skåne län’s inclusion of Malmö—+70,920 pop. (+27.5%) in the same time
frame (Eurostat, 2019) — and other urban regions in its statistical boundaries.
19WP2 / GoA2.5 / How economic factors influence May 2020
innovative rural mobility solutions
the potential for stability of mobility flow demand. Between 2014 and 2016, only the Finnish regions
experienced a decline in employment. In both cases this began in 2010.
Table 3.Employment (thousand persons) by NUTS 3 regions. Source: Eurostat (2019)
2010 2012 2014 2016 % Change '10-'16
EU Average 225,624 225,04 226,796. 232,22 +3%
.7 8 6 8
Bielsko* 255.7 276.1 270.8 285.3 +12%
Cuxhaven 68.5 70.6 71.5 71.6 +4%
Hallig Hooge (North 111.8 112.5 112.5 114.4 +2%
Frisia)*
North Karelia 67.7 68.7 65.7 64.5 - 5%
Plön 43.1 42.3 42.4 43.5 +1%
Southern Ostrobothnia 87.9 90.1 87.5 85.8 - 2%
Trelleborg (Skåne)* 559.0 572.0 587.0 607.0 +9%
Vejle (South Jutland)* 358.0 352.0 355.0 363.0 +1%
Vidzeme 83.8 82.2 74.8 77.5 - 8%
Improved access to transport solutions (including through lower cost) may also give more people the
opportunity to enter the labour market (Laird et al., 2013). Litman (2010) indicates that “lower-income
workers often benefit most if they can minimise vehicle expenses by sharing vehicles and rides, and using
alternative modes when possible” (p. 51). Therefore, it is essential to analyse employment in a particular
region not only generally, but also in terms of wage levels.
Sometimes manufacturing companies provide transport to the workforce in surrounding settlements
themselves. Alternatively, employees will occasionally organise themselves and utilise ridesharing, thus
reducing transport costs and providing mobility to those workers who do not have a vehicle of their own.
Transport on demand (ToD), implemented by several partners in the MAMBA project, is likely to be more
appropriate for regions with a lower population density, with its typical population ageing, and with
micro and small businesses in the region. On the other hand, in areas with many medium-sized and large
companies, Mobility as a service (MaaS) — the use of multimodal full-service mobile applications for
public transport, shared mobility, and ridesharing private vehicles, in combination — may be a more
suitable solution.
20You can also read