THAILAND ECONOMIC MONITOR - PRODUCTIVITY FOR PROSPERITY January 2020 - World Bank Document
←
→
Page content transcription
If your browser does not render page correctly, please read the page content below

Public Disclosure Authorized   Public Disclosure Authorized   Public Disclosure Authorized                    Public Disclosure Authorized

                                                                              January 2020
                                                                                             PRODUCTIVITY
                                                                                             FOR PROSPERITY
                                                                                                          THAILAND
                                                                                                          ECONOMIC MONITOR
PREFACE
    The Thailand Economic Monitor (TEM) reports on key
    developments in Thailand’s economy over the past six months,
    situates these changes in the context of global trends and
    Thailand’s longer-term economic trajectory, and updates
    Thailand’s economic and social welfare outlook. Each edition
    of the TEM also provides an in-depth examination of selected                Part 2 of the report was conducted jointly with Nakarin
    economic and policy issues and an analysis of Thailand’s                    Amarase, Montalee Kapilakanchana, Nuntanid Thongsri, at
    medium-term development challenges. The TEM is intended                     the Monetary Policy Department, Bank of Thailand. Part 1 of
    for a wide audience, including policymakers, business leaders,              the report benefited from productive discussions with staff at
    financial-market participants, and the community of analysts                the Public Debt Management Office and the Fiscal Policy Office
    and professionals engaged in Thailand’s evolving economy.                   at the Ministry of Finance, the Bank of Thailand, the National
                                                                                Economic and Social Development Council, the Budget
    The TEM is produced by the staff of the World Bank’s Bangkok                Bureau, the Ministry of Commerce, the Tourism Authority of
    office, consisting of Kiatipong Ariyapruchya, Arvind Nair,                  Thailand, the Thailand Development Research Institute as
    Ralph van Doorn, (task team leaders), Mahama Samir Bandaogo,                well as financial and rating institutions.
    Dilaka Lathapipat, Massimiliano Cali, Seidu Dauda, Aufa
    Doarest, Tania Priscilla Begazo Gomez, Harry Edmund Moroz,                  The findings, interpretations, and conclusions expressed in
    Graciela Miralles Murciego, Melanie Simone Trost, Judy Yang,                this report do not necessarily reflect the views of the Executive
    and Phonthanat Uruhamanon. Mara Warwick, Birgit Hansl,                      Directors of the World Bank or the governments they
    Ndiame Diop, and Souleymane Coulibaly provided overall guidance.            represent. The latest data that inform this report date from
    The team is grateful to Andrew Mason, Aaditya Mattoo, Ekaterine             November 18, 2019, and the World Bank does not guarantee
    Vashakmadze, Ergys Islamaj, William Maloney, Norman Loayza                  the accuracy of the data presented in the TEM. The boundaries,
    and Lay Lian Chuah for their constructive input. Clarissa                   colors, denominations, and other information shown on any
    Crisostomo David, Kanitha Kongrukgreatiyos and Buntarika                    map in this work do not imply any judgment on the part of the
    Sangarun are responsible for external communications related                World Bank concerning the legal status of any territory or the
    to the TEM, as well as the production and design of this edition.           endorsement or acceptance of such boundaries.

    Photographs are copyright of World Bank. All rights reserved.               For information about the World Bank and its activities in
                                                                                Thailand, please visit:
    This and other reports are available for download via:
    worldbank.org/tem                                                                     wbg.org/thailand

    Previous editions of the TEM:                                                         twitter.com/WB_AsiaPacific, follow hashtag #wbtem

    •   July 2019: Harnessing Fintech for Financial Inclusion
                                                                                          facebook.com/WorldBankThailand
    •   January 2019: Inequality, opportunity and human capital
    •   April 2018: Beyond the innovation paradox                                         instagram.com/worldbank
    •   August 2017: Digital transformation
                                                                                          linkedin.com/company/the-world-bank
    To receive the TEM and related publications by email, please
    e m a il bunt ari ka@wo r l d b a n k.o rg . Fo r q u e s t i o n s a n d
    comments, please contact Kiatipong Ariyapruchya
    (kariyapruchya@worldbank.org).

                                                                                                      THAILAND ECONOMIC MONITOR
                                                                                                                    JANUARY 2020
I
ABBREVIATIONS
AFC     Asian Financial Crisis                      MOC     Ministry of Commerce

ASEAN   Association of Southeast Asian Nations      MOF     Ministry of Finance

BOI     Board of Investment                         MTFF    Medium-Term Fiscal Framework

BOT     Bank of Thailand                            NEER    Nominal Effective Exchange Rate

CBFI    Community-Based Financial Institutions      NESDC   Office of the National Economic and Social
                                                            Development Council
CLMV    Cambodia - Lao PDR - Myanmar – Viet Nam
                                                    NPL     Non-Performing Loans
DFS     Digital Financial Services
                                                    OBEC    Office of the Basic Education Commission
EIA     Environmental Impact Assessment
                                                    OIC     Office of Insurance Commission
EAP     East Asia and Pacific
                                                    OLS     Ordinary Least Squares
EEC     Eastern Economic Corridor
                                                    PDMO    Public Debt Management Office
EMDEs   Emerging Markets and Developing Economies
                                                    QR      Quick Response
FDI     Foreign Direct Investment
                                                    REER    Real Effective Exchange Rate
FRA     Fiscal Responsibility Act
                                                    SET     The Stock Exchange of Thailand
FSAP    Financial Sector Assessment Program
                                                    SEZ     Special Economic Zone
FTA     Free Trade Agreement
                                                    SFIs    Specialized Financial Institutions (SFIs)
FX      Foreign exchange
                                                    SME     Small and Medium Enterprises
FY      Fiscal Year
                                                    SOE     State-Owned Enterprise
GDP     Gross Domestic Product
                                                    TFP     Total Factor Productivity
GFC     Global Financial Crisis
                                                    UMIC    Upper Middle-Income Country
GMM     Generalized Method of Moments
                                                    WDI     World Development Indicators
GSB     Government Savings Bank
                                                    yoy     year-on-year
LTGM    Long-Term Growth Model

THAILAND ECONOMIC MONITOR
                                                                                                         II

JANUARY 2020
TABLE OF CONTENTS
      ABBREVIATIONS                                                                                    II
      EXECUTIVE SUMMARY                                                                               IV
      PART 1: RECENT ECONOMIC DEVELOPMENTS AND OUTLOOK: REVIVING SHORT-TERM GROWTH                     1
        1. RECENT ECONOMIC DEVELOPMENTS: A CYCLICAL SLOWDOWN                                           1
        2. OUTLOOK, RISKS, AND POLICY RECOMMENDATIONS                                                 24
      PART 2. BOOSTING PRODUCTIVITY                                                                   29
        1. BOOSTING PRODUCTIVITY IS CRITICAL TO ACHIEVING HIGH-INCOME STATUS BY 2037, ALONG

         WITH INCREASED INVESTMENTS                                                                   30
        2. DRIVERS AND CONSTRAINTS TO PRODUCTIVITY OF MANUFACTURING FIRMS                             37
        3. POLICY AGENDA TO BOOST PRODUCTIVITY OF FIRMS                                               43
      REFERENCES                                                                                      47
      ANNEX                                                                                           48
        ANNEX 1: ESTIMATING FIRM PRODUCTIVITY                                                         48
        ANNEX 2: FIRM REGRESSION                                                                      49

      TABLE
      TABLE 1: EXPORTS TO MOST DESTINATIONS HAVE DECLINED, EXCEPT FOR THE UNITED STATES                4
      TABLE 2: PRIVATE INVESTMENT INDEX GROWTH BECAME NEGATIVE ACROSS ALL SUB-CATEGORIES IN Q3 2019    5
      TABLE 3: PRIVATE CONSUMPTION INDEX GROWTH DECLINED FOR ALL SUB-CATEGORIES IN Q3 2019             6
      TABLE 4: THE CURRENT ACCOUNT, FINANCIAL ACCOUNT, AND FOREIGN-EXCHANGE RESERVES                  12
      TABLE 5: FISCAL OPERATIONS AT THE CENTRAL AND GENERAL GOVERNMENT LEVELS                         14
      TABLE 6: SUMMARY OF KEY FINDINGS AND RELATED POLICIES                                           43

      BOXES
      BOX 1: ECONOMIC CYCLES: HAS THAILAND ENTERED A DOWNTURN?                                         7
      BOX 2: UNDERSTANDING THE SOURCES OF RECENT CHANGES IN POVERTY REDUCTION                         18
      BOX 3: SOCIAL PROTECTION IN A TRANSFORMING AND AGING THAILAND                                   20
      BOX 4: AFFORDING AND IMPLEMENTING AN EFFECTIVE FISCAL STIMULUS                                  27
      BOX 5: PADDY PLEDGING, FARMERS AND STRUCTURAL TRANSFORMATION                                    36
      BOX 6: TECHNICAL NOTE ON FIRM PRODUCTIVITY ESTIMATION                                           46

                                                                               THAILAND ECONOMIC MONITOR
III

                                                                                             JANUARY 2020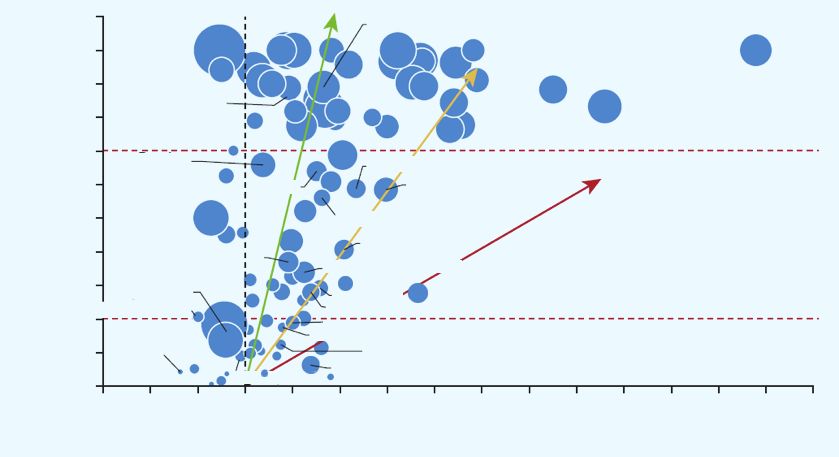
EXECUTIVE SUMMARY
Thailand’s economic growth slowed to 2.4 percent in Q3            On the supply side, GDP growth was mainly supported by
2019, driven by cyclical factors, notably weak external           the services sector while manufacturing contracted due to
demand and heightened global uncertainty. The downturn            lower export demand. The services sector grew by 3.8 percent
has also exposed structural constraints, which is reflected       in Q3, driven by accommodation and food service activities
in the sluggish growth of public and private investments. The     and, to a lesser extent, retail and wholesale trade and
Government has responded swiftly to the growth slowdown,          transportation. The expansion in tourism has been a key
through accommodative monetary policies and                       underlying driver for these activities, with the number of tourists
countercyclical fiscal stimulus. Going forward, additional        picking up to 9.7 million in Q3 2019 (7.3 percent increase).2 In the
policies to enhance the effectiveness of the stimulus, with a     manufacturing sector, the slight contraction in Q2 2019
focus on implementing major public investment projects and        continued in Q3 (-1.5 percent) due to a sharp decline in the
improving the efficiency of public investment management          production of export-oriented industries (-7 percent year
could maximize the growth impact. In the long term,               to date). The contraction was broad-based, including raw
structural reforms such as enhancing competition in the           material industries but also capital and technology industries,
domestic economy, increasing openness, and promoting an           particularly motor vehicle, computer and electronic parts.
eco-system for firm innovation in order can boost productivity.   Agricultural output contracted in Q2 2019 by 1.3 percent,
                                                                  driven by the worst drought conditions in several decades
   i. Growth has slowed driven by external and
                                                                  afflicting the north and northeastern parts of the country from
      domestic factors
                                                                  May through August.3 The drought had a severe impact on

Following subdued growth in the first half of the year,           the production of food-grains, particularly paddy production,

growth remained weak in the third quarter of 2019, as             which declined by 18 percent in Q2 2019. Higher yields saw

continuously lower external demand weighed on domestic            agricultural output expanding by 1.5 percent in Q3 2019.

demand. GDP growth in Q3 2019 stood at 2.4 percent1, a modest
                                                                  The growing weakness in domestic demand was reflected in a
pick-up from the previous quarter (2.3 percent). Subdued global
                                                                  large contraction of import volumes, and an even larger current
demand conditions and heightened uncertainty, combined
                                                                  account surplus and further appreciation pressures on the
with a weakening of the domestic drivers of growth, continue
                                                                  Thai baht. Despite the decline in exports, the current account
to weigh on the economy so far in 2019. The contraction in
                                                                  surplus grew larger in Q3 2019, due to a larger compression in
exports continued in the third quarter (-1 percent), albeit at
                                                                  imports (-6.8 percent in Q3 2019) as both consumption and
a slower pace than in the previous quarter (-7.9 percent). The
                                                                  investment weakened. In turn, the large current account
persistence of weak export activities is now clearly weighing
                                                                  surplus contributed to an increase in foreign exchange
on private consumption which continued to slow (4.2 percent
                                                                  reserves (US$ 213 billion, around 12 months of imports) and
in Q3 against 4.6 percent in Q2) amid slowing employment
                                                                  sustained exchange rate appreciation pressure since
and wage growth while private investment growth remained
                                                                  end-2018. At the end of November 2019, the exchange rate
subdued. Private investment decelerated from 4.1 percent
                                                                  stood at 30.2 baht/US$, compared to 32.9 baht/US$ at end
in Q1 2019 to 2.4 percent in Q3 2019 across almost all
                                                                  of November 2018, a 8.9 percent appreciation and the strongest
sub-categories of investment including imports of capital
                                                                  the baht has been in six years. While the nominal effective
goods, permitted construction area and domestic machinery
                                                                  exchange rate (NEER) rose by 8.8 percent between November
sales.
                                                                  2018 and November 2019, the real effective exchange rate
                                                                  (REER) increased by 6.2 percent between October 2018 and
                                                                  October 2019 due to Thailand’s low inflation (1 percent)
                                                                  compared to its main trading partners.4

THAILAND ECONOMIC MONITOR
                                                                                                                                         IV

JANUARY 2020
The central government fiscal deficit increased only Accommodative monetary policy continued to
slightly, as expenditure only rose marginally and revenue support growth. On 6 November, the Bank of Thailand cut
collection moderated. The fiscal deficit is estimated at 2.3 its key policy rate for a second time from 1.50 to 1.25 percent
5
percent of GDP for 2019 , compared to 2.0 percent of GDP in following the August rate cut to support the economy.
2018. This is driven by a marginal decline in revenue However, room is limited as the policy rate has remained at
collection as a share of GDP from 17.6 percent of GDP in 2018 1.50 percent for much of 2015-2019. Going forward, the
to 17.2 percent of GDP in 2019, driven by decline in revenues monetary policy committee has indicated that monetary and
from personal income tax and value added taxes due, in part, macroprudential policies will duly consider potential risks such
to a slowdown in economic a c t iv i t y a n d c o n s u mptio n . as (i) search-for-yield behavior in the extended low interest rate
The reve n ue d e c l i n e wa s counterbalanced by a marginal environment (ii) high household and SME debt (iii) the growth
decline in expenditure as a share of GDP from 19.5 percent of in saving cooperatives’ assets and (iv) high leverage by large
G D P i n 2 0 1 8 t o 1 9. 4 p e rc e n t o f G D P i n 2 0 1 9 d u e t o corporations. The broader context is however a well-capitalized
continued challenges in executing the capital budget. The and sound financial sector, with the highest capital adequacy
increased central and general government fiscal deficit is ratio in ASEAN (17.8 percent at the end of Q2 2019).
projected to lead to a moderate pick up in public debt as
iii. Growth is projected to recover gradually
a share of GDP over the medium term, continuing an upward
over the near-term, but with balance of risks
trend from 2018 (41.6 percent debt to GDP) to 2019 (43
tilted to the downside
percent debt to GDP).6 However, public debt will remain well
below the statutory limit of 60 percent of GDP under the Thailand’s GDP growth rate is projected to recover
Fiscal Responsibility Act. g r a d u a l l y o v e r t h e n e a r- t e r m , u n d e r p i n n e d b y a n
expected slight improvement in external demand and
ii. The Government has responded swiftly to
recovery in private consumption as well as a stronger
the slowdown but impact seems limited
focus on public investment implementation. Global
The Government has responded swiftly to the growth growth is indeed projected to pick up moderately to 2.5
slowdown through short-term countercyclical fiscal percent in 2020, as global trade and investment bottom out,
and monetary policies but the impact has been with a modest pick-up in growth projected in Emerging
limited thus far. The Ministry of Finance announced and Market and Developing Economies (World Bank 2019). In China,
implemented a 316 billion baht (US$ 10.2 billion equivalent) growth is expected to slow gradually, from an estimated
economic stimulus package in August 2019 that targets 6.1 percent in 2019, to 5.9 percent in 2020, and to 5.7 percent
farmers, small and medium-sized enterprises (SMEs), by 2022. In the rest of the region, growth is expected to stabilize
low-income households and the middle class, in the form of at 4.9 percent in 2020, and remain around 5 percent in
cash transfers, postponement of debt repayment and tax 2021-22. Against this backdrop, the Thai economy is projected
7
rebate on specific tourist activities . Additional visa-on-arrival to grow moderately from an estimated 2.5 percent in 2019
fee exemption measures were also extended for tourists from to 2.7 percent in 2020 and 2.8 percent in 2021. This baseline
certain countries such as China and India. However, thus far, projection reflects a bottoming out of export contraction, in
the impact has been limited as the fiscal deficit only ticked up line with global growth and trade, a recovery in private
marginally while SME lending has decelerated. consumption as households consolidate their balance sheets
and a focus on investment driven by a pickup in the
implementation of large public infrastructure projects.
1 All percentage changes are reported on a year-on-year (yoy) basis unless stated otherwise.
2 The rise in tourist arrivals reflects the sharp increase in tourists arriving from China (17.3 percent increase in Q3) and from India
(over 25 percent increase in Q3) offsetting a decline in tourist arrivals from Russia, Australia, Middle East and Europe.
3 https://www.bangkokpost.com/thailand/general/1713664/dept-warns-of-worst-drought-in-decade
4 Exports to most destinations have declined with the sharpest decline being in regional exports to CLMV (down 9 percent year to date) and ASEAN
(down 11 percent year to date). The exception is exports to the United States which have picked up, potentially reflecting trade diversion impacts, but these
gains have been insufficient to offset decline in exports to the rest of the world.
5 Thailand’s fiscal year runs from October to September and all fiscal numbers are reported on a fiscal year basis.
6 These debt numbers are expressed as a share of calendar GDP, so they might differ from the Ministry of Finance’s debt figures.
7 Fiscal Policy Office, Ministry of Finance. 2019 "Press release number 085/2562: Economic stimulus package 2562."
THAILAND ECONOMIC MONITOR
V
JANUARY 2020Risks to Thailand’s economic outlook stem from both Priority reforms for Thailand include: 1) developing a
external and domestic sources. The external risks stem from comprehensive multi-year pipeline of public investment
a possible continuation of the US-China trade tension and a projects, particularly projects that are identified as
broadening of protectionist tendencies (e.g. between the US potential PPPs; 2) strengthening guidelines and expediting
and the EU). If they materialize, policy uncertainty will remain project appraisal by line ministries and SOEs; 3) addressing
high and external demand weak, hitting export-oriented weaknesses in Environmental Impact Assessment (EIA)
economies like Thailand. On the upside, Thailand’s exports procedures (agencies take at least 18 months to secure
could benefit if policy uncertainty related to trade tensions approval on EIAs); 4) Furthermore, agencies do not get enough
subside. The domestic short-term risks mainly concern budget allocation for mitigation measures. As a result, affected
policy uncertainty surrounding the delayed FY 2020 communities do not trust mitigation measures and may be
budget process and the cohesiveness of the coalition unwilling to move; 5), government-to-government procurement
government which could impact investor confidence. The should also be more transparent (i.e. cost of borrowing and
19-party coalition government holds a slim majority in the terms of repayment needs to be published); 6), an independent
lower house. If the coalition proves unstable, the approval of appraisal institution is important to validate project appraisals
new large public investment projects not currently in the and increase transparency; and 7) pre-procurement should be
pipeline would be delayed, which would negatively impact allowed so that projects implementation can start immediately
public and private investment spending. A good sign is that after budget approval.9
the FY 2021 budget preparation is advancing according to the
As the government envisages further policy initiatives to
normal budget preparation plan.8
protect vulnerable households, the introduction of better
iv. Policy considerations: maintaining continuity and more targeted social protection could be considered.
in implementing public investments while A priority for Thailand is to build a social protection system
improving social protection to protect that accurately identifies those that are most in need and be
vulnerable households able to react swiftly to support affected households in
times of economic downturns. These systems should meet the
Implementation of major public investments and PPP
needs of the poor and the most vulnerable, while ensuring fiscal
projects could further support growth and investor
sustainability. Policies to support vulnerable households
sentiment in the short and medium-term especially if
are critical, as poverty has recently increased. Official
accompanied by greater efficiency in public investment
poverty estimates in 2018 were more than 2 percentage
management (PIM). After a 3-month long political transition
points higher than estimates from 2015, rising from 7.2
from national elections to government formation, some key
percent in 2015 to 9.9 percent in 2018. All regions in
investment projects in the Eastern Economic Corridor are
Thailand registered higher poverty rates in that period.
making progress toward implementation start. For example,
the northern expansion plan of the overcrowded v. In the long term, Thailand will need to
Suvarnab h u m i ai rp o r t a wa i t s c a b i n e t a p p rova l. The boost productivity growth and investments
high-speed rail PPP linking Suvarnabhumi, Don Mueang and to reach high-income status by 2037
U-Tapao ai rpo rt s h a s p a s s e d e nv i ro n m e nt a l i mp a ct
Thailand has set a target under the 20-year national
assessment and cabinet approval. As a result, the PPP
strategy to transition from upper-middle income to
agreement between the State Railway of Thailand and the
high-income status by 2037. The World Bank’s long-term
winning consortium was signed in October 2019. It is
growth modeling exercise highlights that, under a business
important to think about comprehensive public investment
-as-usual-baseline scenario, with no significant pick-up in
strategies and improve efficiency of PIM to enhance the
investments or productivity growth, Thailand’s long-run
impact of any public investment-led stimulus.
growth rate is projected to remain below 3 percent. As a
8 As per the Cabinet resolution of January 7, 2020 approving the fiscal result, Thailand will remain an Upper Middle-Income Country
aggregates for FY 2021.
9 Box on Pushing Mega Projects Through Fiscal Bottlenecks, Thailand Economic
(UMIC) until past 2050 and fail to achieve the high-income
Monitor June 2016; Thailand Public Finance Management Review Report, target.
World Bank 2012.
THAILAND ECONOMIC MONITOR
VI
JANUARY 2020Thailand will need structural reforms to significantly vi. Boosting productivity, particularly of
increase investment and productivity growth to achieve manufacturing firms, is a critical part of
the growth needed to reach high-income status. The long-term the long-run structural reform agenda.
growth modeling exercise considered alternatives to enable
The second part of this edition of the TEM provides an
Thailand to achieve high-income status by 2037. To achieve
in-depth analysis of recent developments in productivity
the target of becoming a high-income country by 2037, Thailand
growth and discusses policies to boost productivity in
will need to sustain long-run growth rates above 5 percent
the manufacturing sector. 11 Thailand will need to enable
beyond 2025. A key finding is that improving TFP growth and
easier labor movement from the agricultural sector to
raising investments alone will be insufficient to sustain this
hig her-p ro d u ctivity in d u s tr ies , a n d a llow for more
growth rate. Thailand can only sustain this growth by nearly
dynamismin the industrial sector, with less efficient firms
doubling the rate of public and private investments while
being replaced by more efficient firms.
maintaining the same historical TFP trajectory as South Korea
when it was at Thailand’s current GDP per capita level.10
Thailand’s structural transformation remains incomplete.
The recent growth slowdown in 2019 has highlighted Thailand’s economy-wide productivity gains from 1980-96
Thailand’s long-run structural constraints, with slowing were driven mainly by structural transformation, with labor
investments and low productivity growth. The contraction movin g f ro m low p ro d u ctivity a g r icu ltu re to h igh er
of Thailand’s manufacturing exports, which is sharper than productivity manufacturing and services sectors. However,
in the other large ASEAN countries, underscores the need this process has stalled, with productivity growth since
to address the economy’s structural problems. Thailand’s the AFC driven more by gains within sectors than from the
economy grew at an average rate of 7.7 percent from movement of labor between sectors. One sign that structural
1980-96, supported largely by capital accumulation t ra n s fo r m a t i o n s t a l l e d i s t h a t T h a i l a n d ’s s h a re o f
and a manufacturing export-oriented growth model.This period agricultural employment remains significantly higher than
of growth corresponded with a shift of labor from its structural peers at similar levels of GDP per capita. About
agriculture towards manufacturing, higher rapid 30.9% of Thailand’s labor force is still in agriculture compared
convergence with upper middle country comparators and to 11.2% in Malaysia. Raising labor productivity and deepening
gains in reducing extreme poverty. Progress was halted in capital in agriculture can facilitate structural transformation,
1997, when the economy was hit hard by the Asian Financial with some potential measures including increasing efficiency
Crisis (AFC). From 1998-2008, the economy stabilized and and sustainability of irrigation investments, and more and
slowly recovered, growing at an average rate of 4.8 percent. better funding of agricultural research and extension programs.
Post the Global Financial Crisis (GFC) in 2008, the economy
The analysis of drivers and constraints to productivity
has slowed further, growing at an average rate of 3.3 percent
of manufacturing firms using firm-level data highlights
in the last decade. Investments in physical capital halved
some key empirical findings: (i) manufacturing firm
from close to 40 percent of GDP in 1996 to slightly
productivity growth has been higher for industries that
less than 20 percent of GDP in 2018. Total Factor Productivity
export more (ii) firms that receive FDI are more productive;
(TFP) growth has decelerated compared to the earlier
(iii) there are a number of small, productive firms that are
periods – falling from an average of 3.0 percent growth
not growing in size suggesting constraints to firm growth;
between 1999-2008 to 1.4 percent between 2009-2017.
and, finally, (v) firms that use more skilled labor and
invest in R&D are more productive and innovative.
10 South Korea has had the fastest TFP growth in East Asia and Pacific since 2014.
11 This report is based on a joint research paper by the World Bank and the Bank of Thailand. The report benchmarks Thailand’s economy-wide productivity
against its structural peers, and then closely examines productivity of manufacturing firms using data from the Thailand’s Manufacturing Industry
Census covering nearly 50,000 firms and manufacturing plans with data from 2006, 2011 and 2016.
THAILAND ECONOMIC MONITOR
VII
JANUARY 2020The results also highlight that productivity growth driven The findings point towards a productivity agenda that
by exit of unproductive firms and entry of new, productive foc uses on: (i ) i nc reasi ng op enness; (i i ) enha ncing
firms is low, particularly in Thailand’s domestically competition in the domestic economy; and (iii) promoting
oriented industries. Thailand’s legislation such as the a stronger eco-system for firm innovation. Increasing
Fo re i g n B u s i n e s s Ac t o r t h e 1 9 9 9 C o m p e t i t i o n Ac t competition requires enforcement of the recently passed
discouraged new firms, especially foreign firms, from entering competition law and strengthening the competition
the domestic market or markets with state enterprises. Given c o m m i s s i o n . O p e n n e s s c a n b e p ro m o t e d b y e a s i n g
that new firms tend to be more productive, this curbs restrictions on FDI and skilled professionals, particularly in
productivity growth. In addition, enforcement of the the services sector by implementing the ASEAN
competition law has been weak historically. No cases have framework agreement on services.13 Skills will be critical
been successfully prosecuted since the establishment of and, in the short-term, policy considerations include
the Trade Competition Commission (TCC) under the 1999 creating and looking to fill a skilled occupation shortages
12
Competition Act due to its lack of independence. The new list to address skills needs for new, innovative industries. To
2017 Competition Act replaces the 1999 act and is aimed support the R&D ecosystem, Thailand can look to strengthen
at raising competitiveness through greater competition. intellectual property protection and the capacity of the
The act touches on many important aspects such as Department of Intellectual Property.14
governance of the competition agency, merger control
thresholds, anticompetitive agreements, and exemptions.
However, the most important challenge is strengthening
implementation through, for example, legal clarification of
treatment of state-owned enterprises and quasi-fiscal
measures such as price control as well as incentivizing
reporting of cartel behavior.
PART 2: SUMMARY OF KEY FINDINGS AND POLICY OPTIONS
Findings Policy recommendations
Competition and market churning are weak in domestically Implement the new Competition Act with clear critical guidelines
oriented industries. related to state-owned enterprises, price control and cartel
behavior.
Firms that are integrated with the global economy are more Promote openness by relaxing FDI limits and services restrictions as
productive. envisioned in the ASEAN framework agreement on services.
Skilled labor complements R&D investments. Introduce a human capital policy to support the innovation
ecosystem. Consider creating a skilled occupation shortages
list in the short term.
12 See Box on Thailand’s New Competition Act: Does it Deliver? World Bank Thailand Economic Monitor: Beyond the Innovation Paradox, April 2018.
13 See ASEAN Services Integration Report (2015). World Bank and ASEAN.
14See discussion on innovation eco-system in World Bank Thailand Economic Monitor: Beyond the Innovation Paradox, April 2018.
THAILAND ECONOMIC MONITOR
VIII
JANUARY 2020RECENT DEVELOPMENTS IN CHARTS
Figure ES 1: Thailand’s GDP growth rate Figure ES 2: …continuing to lose momentum as
remained below 3 percent in Q3 2019… q-o-q growth rate falls close to zero
(% change, year-on-year) (% change, quarter-on-quarter, seasonally adjusted)
2 1.9
6
1.8
5.0
5 4.7 1.6
4.5
4.2 1.31 .3
4.0 1.4
4 3.5 3.6 1.2
3.13 .1 3.2 1.0 1.0 1.0
2.8 1 0.90 .9
3 0.8
2.3 2.4 0.8
2 0.6
0.4 0.4
0.4
1
0.2 0.1
0.0
0 0
Q3 Q4 Q1 Q2 Q3 Q4 Q1 Q2 Q3 Q4 Q1 Q2 Q3 Q3 Q4 Q1 Q2 Q3 Q4 Q1 Q2 Q3 Q4 Q1 Q2 Q3
2016 2017 2018 2019 2016 2017 2018 2019
Source: NESDC. Source: NESDC.
Figure ES 3: Exports continued to shrink amid Figure ES 4: …and domestic demand contributed
weak external demand… less to GDP growth in recent quarters.
(Percentage-point contribution to real GDP growth, yoy) (Percentage-point contribution to real GDP growth, yoy)
12 15
9.6
10
7.8 7.4 8.0 10
8
6 5
4.1
4 2.1 1.8 2.5
2 0.7 0
0
(2) -5
-0.9 -1.0
(4)
-10
(6) Q3 Q4 Q1 Q2 Q3 Q4 Q1 Q2 Q3 Q4 Q1 Q2 Q3
(8) -6.1
-7.9 2016 2017 2018 2019
(10)
Q3 Q4 Q1 Q2 Q3 Q4 Q1 Q2 Q3 Q4 Q1 Q2 Q3
Private Consumption Public Consumption
2016 2017 2018 2019 Investment Change in Inventories
Exports Imports
Source: NESDC.
Source: NESDC.
THAILAND ECONOMIC MONITOR
IX
JANUARY 2020Figure ES 5: Poverty rates have increased Figure ES 6:…underpinned by stagnant
across Thailand… agricultural income
(Poverty rate, percent) (Average labor wage by industry (baht, monthly)
Source: NESDC. Source: NESDC.
Table ES 1: Macroeconomic Indicators
2017 2018 2019 2020 2021
Real GDP Growth Rate (at constant market prices) 3.9 4.1 2.5 2.7 2.8
Private Consumption 3.2 4.8 4.2 4.4 4.5
Government Consumption 0.5 5.2 1.7 1.2 1.0
Gross Fixed Capital Investment 0.9 4.8 8.4 2.7 2.6
Exports of Goods and Services 5.5 5.9 -5.3 0.2 1.1
Imports of Goods and Services 6.8 7.2 -2.5 1.7 2.5
Real GDP Growth Rate (at constant factor prices) 4.2 4.2 2.5 2.7 2.9
Agriculture 3.7 5.0 2.0 2.2 2.2
Industry 1.8 2.7 2.6 2.7 3.0
Services 5.8 5.1 2.5 2.7 3.0
Inflation (Consumer Price Index) 0.7 1.1 1.1 1.1 1.1
Current Account Balance (% of GDP) 11.0 8.1 5.4 3.9 2.7
Net Foreign Direct Investment (% of GDP) -2.7 -3.0 -0.1 -0.1 -0.2
General Government Fiscal Balance (% of GDP) -0.3 0.3 -0.8 -1.2 -1.3
Public Debt (% of GDP) 41.2 41.6 41.41 43.5 43.9
General Government Primary Balance (% of GDP) 0.6 1.3 0.2 -0.2 -0.4
Nominal GDP growth rate at Market Prices (US$) 10.6 8.3 7.8 2.6 1.9
Source: Office of the National Economic and Social Development Council (NESDC); World Bank staff calculations.
THAILAND ECONOMIC MONITOR
X
JANUARY 2020PART 1: RECENT ECONOMIC DEVELOPMENTS
AND OUTLOOK: REVIVING SHORT-TERM GROWTH
1. Recent Economic Developments: A Cyclical Slowdown
i. Regional and global growth are weakening amid trade tensions
Global growth is projected Global growth slowed to 2.4 percent in 2019 – the slowest pace since the Global Financial
to weaken to 2.4 percent Crisis (GFC) in 2009 – amid weakening global trade and investment (Figure 1). A broad
15
in 2019 and to recover range of countries have been experiencing stagnant growth, with close to 90 percent of
slightly to 2.5 percent
advanced economies and 60 percent of emerging market and developing economies
in 2020.
(EMDEs) decelerating last year. Global trade growth fell to 1.4 percent in 2019 from 4.0
percent in 2018 – by far the weakest since the GFC – on the back of rising trade tensions.
Growth is projected to pick up moderately to 2.5 percent in 2020, but the pick-up is not
expected to be broad-based with about a third of Emerging Market and Developing
Economies (EMDEs) expected to decelerate and growth largely predicated on a rebound in
a small number of large EMDEs.
Risks are tilted to the T h e g l o b a l g row th p ro jectio n s a re s u b ject to co n s id era b le d own s id e r isks. Th e
downside on global baseline scenario of a modest growth pick-up in 2020 assumes no further rise in trade
growth, particularly for tensions among advanced economies and this could be impacted if trade conflicts
international trade.
intensify. Other significant sources of risk include continued policy uncertainty in
advanced economies impacting investment, China growing more slowly than expected
and potential financial stress in large EMDEs. Reflecting a preponderance of downside
risks, the probability that global growth in 2020 will be at least one percentage point
b e l ow b a s e l i n e p ro jectio n s —tha t is , 1. 5 p ercent o r les s , in s tea d of the baseline
forecast of 2.5 percent—is almost 20 percent, well above historical averages.
15 The default measure of growth is on a year-on-year basis, unless otherwise stated.
THAILAND ECONOMIC MONITOR
1
JANUARY 2020East Asia regional Growth in the East Asia and Pacific region is projected to slow from an estimated
growth is also expected 5.8 percent in 2019 to 5.7 percent in 2020, and moderate further to 5.6 percent in
to weaken in line with 2021-22. Easier financing conditions and fiscal policy support will partly mitigate
global conditions.
the negative impact of ongoing trade tensions and associated policy uncertainty. In
China, growth is expected to slow gradually, from an estimated 6.1 percent in 2019,
to 5.9 percent in 2020, and to 5.7 percent by 2022. In the rest of the region, growth
is expected to slightly recover to 4.9 percent in 2020 and firm further to 5 percent in
2021-22. Downside risks to regional growth have intensified. They include a contraction
in global trade due to a further escalation of trade tensions; a sharper-than-expected
slowdown in major economies; and a sudden reversal of capital flows due to an abrupt
deterioration in financing conditions, investor sentiment, or geopolitical relations.
Figure 1: Growth is slowing across the region Figure 2: Thailand’s economic growth continues
amid ongoing trade tensions to lag those of its regional peers
(% change, year-on-year) (Annual GDP growth rate, year-on-year, %)
8 9
7 8
6 7
5 6
4 5
4
3
3
2
2
1
1
0 0
Q3-2017
Q4-2017
Q2-2017
Q3-2018
Q3-2016
Q3-2019
Q1-2017
Q4-2018
Q2-2018
Q4-2016
Q2-2016
Q2-2019
Q1-2018
Q1-2019
Q4-2015
Q1-2016
Q4-2017
Q2-2017
Q3-2018
Q3-2016
Q3-2019
Q1-2017
Q4-2018
Q2-2018
Q4-2016
Q2-2016
Q2-2019
Q3-2015
Q1-2018
Q4-2015
Q1-2016
Q1-2019
Q2-2015
Q4-2014
Q1-2015
Q3-2017
Developing EAP and China China Indonesia Malaysia
China Philippines Thailand Vietnam
Developing EAP
Source: Haver Analytics. Source: Haver Analytics.
ii. A sharp decline in exports has started to impact domestic demand and is driving
a broad-based deceleration
Thailand’s growth has In recent years, Thailand’s economy has expanded at a slower pace than those of its regional
remained below 3 percent comparators (Figure 2). In 2019, an unfavorable regional and global environment has severely
for the third consecutive impacted Thailand’s exports. In the last two quarters, the export slowdown has started to
quarter.
impact domestic private consumption and investment. As a result, GDP growth remained
sluggish at 2.4 percent in Q3 2019 (Figure 3). Economic momentum is not favorable in Thailand,
with quarterly growth declining to close to zero in Q3 2019, on a seasonally adjusted basis
(Figure 4).
THAILAND ECONOMIC MONITOR
2
JANUARY 2020Figure 3: Thailand’s GDP growth rate has remained Figure 4: ...particularly in the last two quarters
below 3 percent for three consecutive quarters
(% change, year-on-year) (% change, quarter-on-quarter, Seasonally Adjusted)
6 2 1.9
5.0 1.8
5 4.7
4.5 1.6
4.2 4.0 1.31 .3
3.6 1.4
4 3.5
3.13 .1 3.2 1.2 1.0 1.0 1.0
2.8 0.90 .9
3 1
2.3 2.4 0.8
0.8
2 0.6 0.4 0.4
0.4
1
0.2 0.1
0.0
0 0
Q3 Q4 Q1 Q2 Q3 Q4 Q1 Q2 Q3 Q4 Q1 Q2 Q3 Q3 Q4 Q1 Q2 Q3 Q4 Q1 Q2 Q3 Q4 Q1 Q2 Q3
2016 2017 2018 2019 2016 2017 2018 2019
Source: NESDC. Source: NESDC.
Declining exports were Deteriorating external and global conditions have severely impacted Thailand’s exports.
the key driver of the Exports contracted by 7.9 percent in Q2 2019 and 1 percent in Q3 2019, in a sharp reversal of
deceleration in growth. trends in the past 3 years (Figure 5). The decline was broad-based, with export value
declining for close to two-thirds of Thai exporting industries in the first three quarters of 2019.
The decline has been particularly sharp for agricultural commodity exports, which declined by
7 percent in the first three quarters of 2019, led by sharp declines in export volumes for major
products such as rice and rubber. Manufacturing exports declined by 6 percent in the same
period with electronics exports hardest hit, declining by 10.5 percent in the first three quarters,
and by over 16 percent in Q3 2019. Slowing exports have contributed negatively and dragged
down overall GDP growth in the last three quarters (Figure 6). Exports to most destinations
have declined (Table 1) with the sharpest decline being in regional exports to CLMV (down 9
percent year to date) and ASEAN (down 11 percent year to date). The exception is exports to the
United States which have picked up, potentially reflecting trade diversion impacts, but these
gains have been insufficient to offset the decline in exports to the rest of the world.
Domestic drivers of Private investment decelerated from 4.1 percent in Q1 2019 to 2.4 percent in
growth are also Q3 2019, consistent with firms using up less of their existing capacity (Figure
weakening, including 7) in the last two quarters. Fast-moving indicators of investment, as measured
private investment.
through the Bank of Thailand’s Private Investment Index, also declined (Figure
8 and Table 2). The decline was broad-based across almost all sub-categories
of investment, particularly in Q3 2019 (Table 2) including construction activity
as measured through permitted construction area (10.1 percent decline year to
date), domestic machinery sales (4.3 percent decline year to date) and imports
of capital goods (0.2 percent decline year to date).
THAILAND ECONOMIC MONITOR
3
JANUARY 2020Figure 5: Exports of goods and services have Figure 6: …dragging down overall GDP growth
contracted in recent quarters
Source: NESDC. Source: World Bank Staff calculations.
Table 1: Exports to Most Destinations Have Declined, Except for the United States
Countries / Economic Territories Share of Exports Percentage Change 2019 Year to Date
CLMV 10.8% -8.4%
ASEAN ex CLMV 14.3% -11.5%
China 11.4% -7.6%
United States 12.7% 11.7%
EU 9.6% -7.7%
Japan 9.9% -2.5%
Others 31.2% -2.5%
Source: Customs Department, World Bank staff calculations.
Figure 7: Capacity utilization is declining… Figure 8: …and the private investment index
is also decelerating
(Base Year 2016 = 100, Seasonally Adjusted) (% change, year-on-year, 3 months moving average)
72 8
70 6
Average: 68.11 4
68
2
66
0
64 64.73 (2) -2.8
62 (4)
(6)
60
OCT 2017 r
OCT 2018 r
OCT 2016 r
JAN 2017 r
APR 2017 r
JUL 2017 r
JAN 2018 r
JAN 2016 r
JAN 2019 r
APR 2018 r
JUL 2018 r
APR 2016 r
JUL 2016 r
APR 2019 r
JUL 2019 r
OCT 2016
JAN 2017
APR 2017
JUL 2017
JAN 2018
JAN 2016
JAN 2019
APR 2018
JUL 2018
APR 2016
JUL 2016
APR 2019
JUL 2019
OCT 2017
OCT 2018
Source: Office of Industrial Economics. Source: Bank of Thailand.
THAILAND ECONOMIC MONITOR
4
JANUARY 2020Table 2: Private Investment Index growth turns negative across all sub-categories in Q3 2019
2018 2019
%yoy
JAN FEB MAR APR MAY JUN JUL AUG SEP OCT NOV DEC JAN FEB MAR APR MAY JUN JUL AUG SEP
Private Investment Index 4.0 4.2 1.0 7.8 3.0 6.4 4.3 5.5 0.4 5.2 3.2 0.0 1.3 -2.4 -1.1 -1.5 -1.8 -6.0 0.2 -6.3 -2.5
Construction Area Permitted 0.9 1.1 2.0 1.2 1.6 -2.7 -3.0 -3.8 -6.2 -7.6 -9.0 -14.3 -12.9 -12.2 -14.1 -12.5 -12.2 -9.0 -8.9 -7.2 -4.1
Construction Material Sales Index -0.5 3.5 1.0 -0.9 2.5 2.2 9.5 10.1 4.0 15.6 6.5 1.0 4.3 0.2 -1.3 3.1 2.0 2.6 -1.6 -8.2 -1.4
Import of Capital Goods 13.9 7.1 -5.7 11.5 -1.3 7.8 -3.1 2.4 0.4 7.6 6.8 -0.9 3.8 -4.9 8.6 6.5 -0.9 -12.0 8.1 -8.4 -2.3
Domestic Machinery Sales 1.3 4.7 4.2 11.8 7.3 11.3 12.5 10.7 2.6 5.7 3.8 -1.2 0.3 -2.0 -4.5 -7.1 -2.4 -6.5 -4.7 -7.8 -4.2
Number of Newly Registered Motor 5.7 -0.2
4.1 13.2 3.8 6.2 13.9 17.9 -10.9 8.1 1.8 11.7 21.7 3.4 -4.1 4.6 -2.5 -6.4 5.5 -8.8 -3.5
Vehicles for Investment Purpose
Remarks: Green indicates positive growth. Darker Green indicates very positive growth. Red indicates negative growth. Darker Red indicates very negative growth.
Note: Construction material sales index includes sales of cement (portland, mixed, and various types), clinkers, ready-mixed concrete, concrete piles, concrete floor
planks, bricks, cement pipes, sanitary fixtures, wall/floor tiles, asbestos cement roman roofing tile, and roofing tile. Total import of capital goods excludes rental and
leasing transportation items and includes computer and information services (imports of services).
Total number of newly registered motor vehicles excludes motorcycles and passenger cars (seven-or-less seaters)
Private consumption is Private consumption growth decelerated from 4.9 percent in Q1 2019 to 4.2 percent in Q3 2019.
also showing signs of The drivers of consumption have begun to show signs of weakness. The farm income index
weakening resilience. declined marginally in Q3 2019 amid flat agricultural prices and slowing agricultural
production, driven by severe drought conditions (Figure 14). Consumer confidence, as measured
through indicators released by the Ministry of Commerce has dropped below 50 since July 2019,
indicating a deterioration in confidence (Figure 9). This is also reflected in the Bank of
Thailand’s index of private consumption, which has decelerated in 2019 (Figure 10) driven
particularly by sales of durables (passenger cars, motorcycles and commercial cars), which
slowed from 8.2 percent growth in 2018 to 1.0 percent growth in 2019 year to date. Looking
at monthly trends (Table 3), durables index growth became negative and even growth of
non-durables consumption slowed in Q3 2019. As highlighted in Box 1 on economic cycles in
Thailand, this is a coincident indicator of a potential downturn.
THAILAND ECONOMIC MONITOR
5
JANUARY 2020Figure 9: Consumer confidence is declining… Figure 10 …and the growth of the private
consumption index has begun to slow
Source: Ministry of Commerce. Source: Bank of Thailand.
Table 3: Private Consumption Index Growth Declined for All Sub-Categories in Q3 2019
%yoy
2018 ! 2019
JAN FEB MAR APR MAY JUN JUL AUG SEP OCT NOV DEC ! JAN FEB MAR APR MAY JUN JUL AUG SEP
Private Consumption Index 5.1 3.8 2.0 7.6 5.7 5.1 6.4 6.4 3.6 6.2 2.9 1.5 ! 4.3 3.8 4.8 1.5 2.8 2.3 1.8 1.3 1.2
Non-durables Index 1.3 2.3 2.0 1.6 1.3 1.3 1.4 0.9 -1.2 2.6 2.7 3.2 $ 3.2 2.6 1.9 2.7 4.5 2.3 2.4 2.0 1.1
Semi-durables Index 3.7 3.0 1.1 2.6 2.4 2.8 2.3 2.0 3.4 5.0 3.4 1.5 $ 2.3 0.5 2.4 1.2 1.0 0.9 1.4 0.3 0.3
Durables Index 8.5 4.0 5.9 8.8 9.7 11.8 9.7 14.1 7.3 9.1 7.0 2.5 $ 6.3 5.3 6.2 3.2 0.1 -2.4 -0.6 -3.0 -6.5
Services Index 8.0 7.8 6.2 7.5 6.6 6.1 6.8 5.5 3.6 5.5 3.0 -1.6 $ 4.0 3.2 3.1 3.0 1.8 1.9 1.8 2.9 3.8
Non-residents expenditure Index 5.6 14.2 18.9 -10.8 -2.7 0.4 -5.8 -9.5 -7.7 -5.0 4.9 -4.7 $ 0.1 -2.9 -8.6 12.1 1.3 -2.1 2.0 6.4 6.2
Remark: Green indicates positive growth. Darker Green indicates very positive growth. Red indicates negative growth. Darker Red indicates very negative growth.
Notes:
• Non-durables Index consists of Nielsen's fast-moving consumer goods index, Household electricity consumption, Sales of fuel consumption, and Sales
of Alcohol and Tobacco.
• Semi-durables Index consists of Retail sales of textile and apparel at constant price, and Import of textile and clothing at constant price
• Durables Index consists of Sales of Passenger cars, Motorcycles and Commercial cars.
• Services Index consists of VAT of hotel and restaurant at constant price, Sales of passenger transportations at constant price.
• The actual net tourist expenditure for personal travel. This index is used to subtract total expenditure to obtain Thai private consumption.
Public investment Public investment growth has gradually picked up, increasing from -0.1 percent in Q1 2019 to
picked up marginally 1.4 percent in Q2 2019 and to 3.7 percent in Q3 2019. This reflects a recent pick-up in public
in the last two quarters. construction activity, which grew by 5.1 percent in Q3 2019, due to acceleration in
mega-projects activity including on Phase II expansion of Suvarnabhumi Airport, Bangkok
water supply improvement projects and water pipeline construction projects. Despite the
acceleration in activity, the increase in public construction still lags public disbursement plans,
as several mega-projects missed their key disbursement milestones.
THAILAND ECONOMIC MONITOR
6
JANUARY 2020Box 1: Economic cycles: has Thailand entered a downturn?
The size and composition of domestic demand plays a key role in driving economic cycles in Thailand. Private
consumption has proven to be the largest contributor to output growth, accounting for roughly 40 percent of output
growth over 2006-2019. In an upturn, private consumption leads output growth, contributing the largest share at
one-third of output growth while in a downturn it helps support aggregate demand, contributing to more than half.
Investment expansion plays a more asymmetric role, contributing to less than one-third of output growth during a
typical upturn but less than 1 percent during a typical down-cycle. In a downturn, both inventory and investment tend
to weigh down output growth with inventory contribution turning negative. The contribution of private investment
last turned negative during the Asian financial crisis (1997-1999).
Recent growth numbers show that the Thai economy clearly entered a downturn in Q1 2019. The contribution of
net exports turned negative as early as Q3 2018 amid global trade tensions. Starting in Q1 2019, the overall growth
momentum slowed as quarterly GDP growth dipped below 3.0 percent amid weakened domestic demand—the
contribution of consumption and private investment growth declined while the contribution of inventory growth
turned negative in Q3 2019. Throughout this period, private consumption has remained consistently supportive.
However, given the considerable household debt burden and risk of deleveraging, there is a possibility that private
consumption may not be able to play as supportive a role as in past downturns.
Figure B1.1: Contributions of components to real GDP growth (2006–2019)
(Percentage-point contribution, year-on-year)
25
20
15
10
5
0
-5
-10
-15
2006 Q1
2006 Q3
2008 Q1
2008 Q3
2009 Q1
2009 Q3
2010 Q1
2010 Q3
2011 Q1
2011 Q3
2012 Q1
2012 Q3
2013 Q1
2013 Q3
2014 Q1
2014 Q3
2015 Q1
2015 Q3
2016 Q1
2016 Q3
2017 Q1
2017 Q3
2018 Q1
2018 Q3
2019 Q1
2019 Q3
2007 Q1
2007 Q3
Private Consumption Public Consumption Investment
Change in Inventories Net Exports GDP Growth
Source: NESDC; World Bank staff calculation.
Note: Shaded background indicate down-cycles defined as periods of GDP growth below average growth of 3.5 percent over 2006-2019 and coincides
with the Global Financial Crisis of 2008, the Great Flood of 2011 and political unrest of 2013.
THAILAND ECONOMIC MONITOR
7
JANUARY 2020Figure B1.2: Contributions to growth during Figure B1.3: Contributions to growth during
economic upturns economic downturns
Source: NESDC; World Bank staff calculations. Source: NESDC; World Bank staff calculations.
Note: Upturns are defined as periods of GDP growth greater Note: Downturns are defined as periods of GDP growth less
than 3.5 percent (average over 2006-2019). than 3.5 percent (average over 2006-2019).
Imports contracted in Imports contracted by 2.6 percent in Q2 2019 and 6.8 percent in Q3 2019. This reflects weaker
the last two quarters, demand for raw materials and intermediate inputs, particularly integrated circuits and
driven by export and computer parts, on account of the slowdown in manufacturing related exports. Imports of
investment weakness.
crude oil and capital goods in machinery and equipment contracted in Q2 2019 and Q3 2019,
reflecting broader deceleration in private investment activity.
iii. Export weakness has hurt the manufacturing sector, while agricultural output has been
impacted by drought-like conditions
On the supply side, The services sector continued to perform strongly, growing at 3.5 percent in Q2 2019
services sector has been and 3.8 percent in Q3 2019, as compared to 4.0 percent in Q1 2019, and continued to
supporting growth amid support overall GDP growth (Figure 11). Accommodation and food service activities
industry and agriculture
and to a lesser extent, retail and wholesale trade and transportation, drove services
weakness.
sector growth. This was, in turn, supported by continued expansion in tourism, with
the number of tourists picking up to 9.7 million in Q3 2019 (7.3 percent increase). The
rise in tourist arrivals reflects the sharp increase in tourists arriving from China (17.3
percent increase in Q3) and from India (over 25 percent increase in Q3) offsetting a
decline in tourist arrivals from Russia, Australia, Middle East and Europe (Figure 12).
While the number of tourists increased, the spending per tourist declined marginally.
So far this year, receipt per tourist declined by 0.3 percent, compared to last year.
THAILAND ECONOMIC MONITOR
8
JANUARY 2020Figure 11: Services sector is supporting growth, Figure 12: ...with a recent pick-up in the number of
amid industry and agriculture weakness tourist arrivals
Source: World Bank staff calculations. Source: Bank of Thailand.
Faced with an unfavorable The manufacturing sector contracted by 0.2 percent in Q2 2019 and 1.5 percent in Q3 2019.
external environment, This reflects particularly the slowdown in exports, with the manufacturing production index for
the manufacturing sector export-oriented industries contracting by 7 percent year to date, while the index for domestic
contracted in the last
industries fell by 1 percent in the same period (Figure 13). The contraction was marked for raw
two quarters.
material industries, particularly rubber, refined petroleum products, paper and basic metals;
and for capital and technology industries, particularly motor vehicle production and production
of computer and electronic parts.
Agricultural production Agricultural output contracted in Q2 2019 by 1.3 percent, driven by the worst drought
was hit by drought, conditions in several decades afflicting the north and northeastern parts of the country from
driving down farm incomes. 16
May through August. The drought had a severe impact on the production of food-grains,
particularly paddy production, which declined by 18 percent in Q2 2019. Due to base effects,
the sector picked up in Q3 2019, growing at 1.5 percent, led by a greater yield for vegetables,
rubber and oil palm, amid continued challenges in food-grains production. Agricultural prices
remained stable during the last two quarters (Figure 14), but overall production declines led to
a moderate decline in the farm income index.
16 https://www.bangkokpost.com/thailand/general/1713664/dept-warns-of-worst-drought-in-decade
THAILAND ECONOMIC MONITOR
9
JANUARY 2020Figure 13: Export-oriented manufacturing Figure 14: Agriculture production declined,
has contracted in the last two quarters while prices remained stable, driving down
farm incomes
(Base Year 2005 = 100, Seasonally Adjusted)
120 220
194.47
200
115
180
110 160 149.20
105 140 130.35
120
100
100
OCT 2017
OCT 2018
OCT 2016
JAN 2017
APR 2017
JUL 2017
JAN 2018
JAN 2019
APR 2018
JUL 2018
JAN 2016
APR 2019
JUL 2019
APR 2016
JUL 2016
95
90
MAR-17
SEP-17
NOV-17
MAR-18
SEP-18
NOV-18
MAR-19
SEP-19
JAN-17
MAY-17
JUL-17
JAN-18
MAY-18
JUL-18
JAN-19
MAY-19
JUL-19 Agricultural Price Index
Agricultural Production Index
Export < 30 Export 30-60 Export > 60 Farm Income Index
Source: Bank of Thailand. Source: Office of Agricultural Economics, Ministry of Agriculture and
Cooperatives.
iv. Inflation remains near the lower bound of the central bank’s target range.
Inflation remained Headline inflation was estimated at 1.01 percent in all three previous quarters. Energy
relatively constant prices fell by 5 percent due to lower global energy prices, causing transportation and
around 1 percent over communication prices to fall. Food prices, on the other hand, rose by almost 5 percent
the previous three
driven by increases in the price of rice, flour and cereal (6.7 percent) and the price of
quarters.
meats, poultry and fish (4 percent). The house rental price has remained marginally
constant so far this year.
v. Despite a weaker external environment, the current account surplus widened, contributing
to a balance of payment surplus
The current account The current account rose to 6.6 percent (of GDP) in Q3 2019 from 5.7 percent (of GDP)
widened in Q3 2019, in Q2 2018. An increase in services and goods surplus and a smaller deficit in primary
compared to the income led to the widening of the current account (see footnote). The smaller deficit
previous quarter due
of 4.1 percent of GDP in the primary income account in Q3 2019 (compared to a deficit
to a larger surplus in
of 4.2 percent of GDP in Q2 2019) was mainly due to an increase in investment income
services and goods
17 from abroad. Services recorded a larger surplus in Q3 2019 (4.5 percent; Q2 2019: 4.4
trade.
percent), driven by an uptick in tourist receipts. In the third quarter, the trade balance
surplus widened to 4.7 percent, from 4 percent in Q2 2019, due to a faster contraction
in merchandise imports compared to exports.
17 The current and financial accounts are measured as a 4-quarter rolling average, expressed as a share of GDP.
THAILAND ECONOMIC MONITOR
10
JANUARY 2020The financial account The net capital outflow stood at 2 percent (of GDP) in Q3 2019, smaller than the
recorded a smaller net 2.3 percent (of GDP) net outflow recorded in Q2 2019. The smaller deficit was
capital outflow in Q3 driven by an uptick in inward FDI, which rose to 2.2 percent of GDP in Q3 2019
2019 mainly due to
(Q2 2019: 1.9 percent). Outbound FDI was 0.4 percent (of GDP) smaller in Q3
FDI inflows.
2019 (3.1 percent), compared to Q2 2019 (3.5 percent). Inward portfolio flows
went from a surplus of 0.9 percent of GDP to a deficit of 0.4 percent of GDP,
and all other investments recorded a smaller deficit in Q3 2019 (0.2 percent of
GDP; Q2 2019: 1 percent of GDP).
Figure 15: The current account surplus Figure 16: FDI inflows have increased
continues to narrow, driven by softening steadily since 2016, but the financial
external demand and the continued growth account presents mixed signals
of the domestic consumer market
Source: Bank of Thailand; World Bank staff calculations. Source: Bank of Thailand; World Bank staff calculations.
The overall balance of In Q3 2019, Thailand’s overall balance of payment was estimated at 6.9 percent of GDP mostly
payment remained in driven by a larger current account surplus. The overall balance of payment was 2.6 percent
surplus, causing foreign of GDP in Q2 2019. The positive balance of payment in the third quarter was reflected in an
exchange reserves to
increase in foreign exchange reserves, which stood at US$220.5 billion at the end of September
increase.
2019. The accumulated reserves are enough to cover 3.5 times the country’s short-term
external debt.
THAILAND ECONOMIC MONITOR
11
JANUARY 2020The Thai baht has At the end of November 2019, the exchange rate stood at 30.1 baht/US$, compared to 32.9
continued to appreciate. baht/US$ at end of November 2018, a 8.9 percent appreciation and the strongest the baht has
been in 6 years. This has prompted the monetary policy committee to express concerns about
the continued appreciation of the currency. The strong currency impacts international
tourism and merchandise exports, which are already struggling from the US-China trade
dispute. Most currencies in the region have depreciated against the US$ in recent months
(Indonesia, Malaysia, China). The nominal effective exchange rate (NEER) rose by 8.8 percent
between November 2018 and November 2019 and the real effective exchange rate (REER)
increased by 6.2 percent between October 2018 and October 2019.
Table 4: The Current Account, Financial Account, and Foreign-Exchange Reserves
(Percent of GDP, unless otherwise indicated)
Countries / Economic Territories Q2 2018 Q3 2018 Q4 2018 Q1 2019 Q2 2019 Q3 2019
Q2 2019 Q3 2019
Current account 3.3 3.1 4.9 9.5 5.1 6.8
Exports of goods 50.5 51.6 48.3 44.9 46.2 46.8
Imports of goods -45.3 -48.4 -44.7 -40.0 -41.8 -40.9
Tourism receipts 13.7 14.9 15.4 17.1 14.4 4.6
Financial account -6.4 -0.9 -1.9 -3.8 -2.5 0.1
Outbound FDI -4.7 -4.7 -3.5 -3.3 -2.7 -2.7
Inbound FDI 1.6 2.6 3.1 0.5 1.5 3.8
Outbound portfolio investment 1.2 -1.0 -0.1 -1.0 -1.1 -2.1
Inbound portfolio investment -4.5 2.1 0.0 -1.0 2.0 -2.3
Reserves, excluding net forward position (US$ billions) 206.8 204.5 205.6 212.2 215.8 220.5
Reserves relative to short-term external debt 3.1 3.1 3.2 3.4 3.5
Source: Bank of Thailand; World Bank staff calculations.
vi. Fiscal deficit ticked up marginally as revenues declined on account of weaker economic activity
Central government Consistent with a downward trend since 2016, revenue as a share of GDP continued to decline
revenue fell marginally in 2019, falling from 17.6 percent of GDP in 2018 to 17.2 percent of GDP in 2019 (Table 5 and
as a share of GDP in 2019 18
Figure 17). Tax revenue declined from 14.8 percent of GDP in 2018 to 14.4 percent of GDP in
compared to 2018.
2019. This was driven by a decline in Value Added Tax collections and weaknesses in Corporate
Income Tax (CIT) and Personal Income Tax (PIT) collections, which reflect the impact of a
slowdown in broader economic activity and consumption. This was offset partly by increased
collections from petroleum income taxes (Figure 18), which enabled revenue collected to exceed
19
target by 4.6 percent.
18 The fiscal year in Thailand runs from October to September. The fiscal numbers reported in this section are divided by calendar-year GDP. As a result,
these numbers are marginally different from Ministry of Finance data on public debt divided interpolated GDP for the fiscal year
19 Government revenue for FY2019 was budgeted at 2,450 billion baht but the amount collected was estimated at 2,563 billion baht in part due a higher tax revenue
from petroleum income. These numbers are drawn from the budget in brief available at http://www.bb.go.th/en/topic-detail.php?id=7262&mid=456&catID=0.
THAILAND ECONOMIC MONITOR
12
JANUARY 2020You can also read


