Centre for Global Finance - Working Paper Series A political economy analysis (PEA) of capital account management (CAM) measures in Ghana
←
→
Page content transcription
If your browser does not render page correctly, please read the page content below
Centre for Global Finance

            Working Paper Series

                   No.2 / 2021

A political economy analysis (PEA) of capital
account management (CAM) measures in
Ghana

By Peter O’Flynn, Stephany Griffith-Jones, and Stephen
Spratt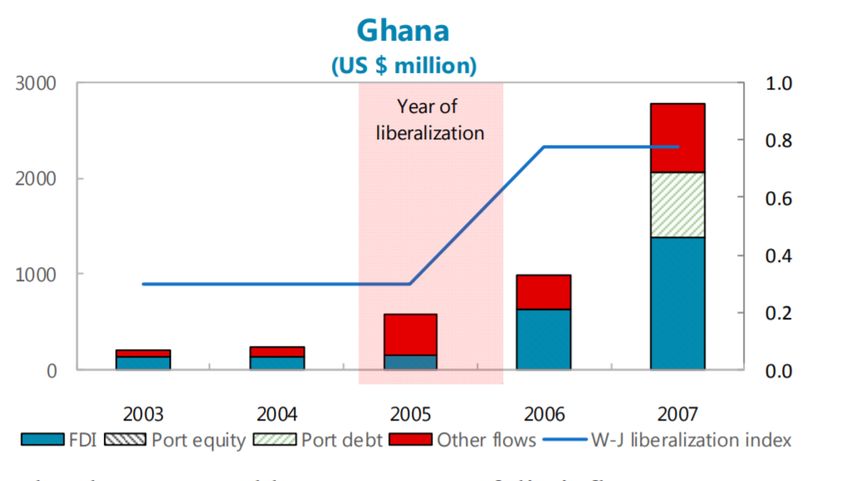
The Centre for Global Finance (CGF) Working Paper Series features recent studies by resident
members of CGF as well as visiting researchers, altogether demonstrating the depth and breadth of
research being undertaken at CGF. The papers are published to facilitate preliminary dissemination
of ongoing research, enhance quality of work and contribute to the advancement of knowledge. We
acknowledge, without implication, financial support from the DEGRP Research Grant
(ES/N013344/2) on “Delivering Inclusive Financial Development and Growth”, funded by the
ESRC and the former UK Department for International Development, which merged with the
Foreign & Commonwealth Office on 2 September 2020 to become the Foreign, Commonwealth &
Development Office (FCDO), the ESRC-NSFC (ES/P005241/1) Research Grant on “Developing
financial systems to support sustainable growth in China – The role of innovation, diversity and
financial regulation”, and the AXA Research Fund.

List of previous Working Papers of CGF:

No.1/2018      Capital, risk and profitability of WAEMU banks: Does cross-border banking
               matter? By Désiré Kanga, Victor Murinde, and Issouf Soumaré

No.2/2018      Capital flows and productivity in Africa: The angel is in the details. By François
               A. B. Bationo, Stephany Griffith-Jones, Victor Murinde, Issouf Soumaré and
               Judith Tyson

No.3/2018      The persistence of bank fragility in Africa: GMM dynamic panel data evidence.
               By Abbi M. Kedir, Syed Faizan Iftikhar, Victor Murinde and Bernadette Kamgnia

No.4/2018      Reflections on central banking. By Victor Murinde and Patrick Njoroge

No.5/2018      Let beholders behold: Can banks see beyond oil booms and mitigate the Dutch
               disease? By Morakinyo O. Adetutu, John E. Ebireri, Victor Murinde and Kayode
               A. Odusanya

No.6/2018      National culture, CEO power and risk-taking by global banks. By Eilnaz Kashefi
               Pour and Victor Murinde

No.7/2018      Corporate investment, financing and payout decisions under financial constraints
               and uncertainty: Evidence from UK firms. By Qingwei Meng, Victor Murinde
               and Ping Wang

No.8/2018      Bank opacity and risk-taking: Evidence from analysts’ forecasts By Samuel Fosu,
               Collins G. Ntim, William Coffie, and Victor Murinde

No.9/2018      Does microcredit increase hope, aspirations and well-being?
               Evidence from Sierra Leone. By Adriana Garcia, Robert Lensink, and Maarten
               Voors

No.10/2018     Lessons from emerging economies for African low income countries on managing
               capital flows. By Stephany Griffith-Jones and José Antonio Ocampo
No.11/2018 Financial inclusion and economic growth: What do we know? By Joshua Y.
Abor, Haruna Issahaku, Mohammed Amidu, and Victor Murinde
No.12/2018 Climate vulnerability and the cost of debt. By Gerhard Kling, Yuen C Lo, Victor
Murinde, and Ulrich Volz
No.13/2018 Pan-African banks on the rise: Does cross-border banking increase firms' Access
to finance in WAEMU? By Désiré Kanga,Victor Murinde, Lemma Senbet, and
Issouf Soumaré
No.14/2018 The peer monitoring role of the interbank market and implications for bank
regulation: Evidence from Kenya. By Victor Murinde, Ye Bai, Christopher J.
Green, Isaya Maana, Samuel Tiriongo, and Kethi Ngoka-Kisinguh
No.1/2019 Central bank independence: What are the key issues? By Désiré Kanga and
Victor Murinde
No.2/2019 Banking services and inclusive development in sub-Saharan Africa. By Haruna
Issahaku, Mohammed Amidu and Aisha Mohammed Sissy
No.3/2019 A survey of literature on financial literacy and financial behaviour: Is there a
gender gap? By Maryam Sholevar and Laurence Harris
No.4/2019 Capital adjustment over the cycle: Evidence from microfinance institutions. By
Issouf Soumaré, Hubert Tchakoute Tchuigoua, and Hélyoth T.S. Hessou
No.5/2019 Provisioning and business cycle: Evidence from microfinance institutions. By
Hélyoth T.S. Hessou, Robert Lensink, Issouf Soumaré, and Hubert Tchakoute
Tchuigoua
No.6/2019 Lending and business cycle: evidence from microfinance institutions. By Hubert
Tchakoute Tchuigoua, Issouf Soumaré, and Hélyoth T.S. Hessou
No.7/2019 Term structure of CDS spreads & risk-based capital of the protection seller:
an extension of the dynamic Nelson-Siegel model with regime switching. By
Standley R. Baron and Issouf Soumaré
No.8/2019 Confidence, financial inclusion and sustainable economic development. By Ayse
Demir, Reinhard Bachmann, Victor Murinde, Laurence Harris, Christine Oughton
and Meng Xie
No.9/2019 The network structure of the Malawi interbank market: implications for liquidity
distribution and contagion around the banking system. By Esmie Koriheya
Kanyumbu
No.10/2019 Aid and Exchange Rates in sub-Saharan Africa: No More Dutch Disease? By
Oliver Morrissey, Lionel Roger and Lars SprengNo.11/2019 Does credit deepening increase financial fragility? By Peng Yiqing, Niels
Hermes, and Robert Lensink
No.12/2019 Does microcredit increase aspirational hope? Evidence from a group lending
scheme in Sierra Leone. By Adriana Garcia, Robert Lensink, and Maarten Voors
No.13/2019 Do better formal institutions promote financial inclusion? By Peng Yiqing, Niels
Hermes, and Robert Lensink
No.14/2019 Do interbank interest rates reflect the financial soundness of borrowing banks?
By Thomas Bwire, Martin Brownbridge, Doreen K. Rubatsimbira and Grace A.
Tinyinondi
No.15/2019 Institutional environment and the microstructure of the interbank market. By
Thomas Bwire, Martin Brownbridge, Doreen K. Rubatsimbira, and Grace A.
Tinyinondi
No.16/2019 Segmentation of the interbank money market in Zambia. By Jonathan M Chipili,
Francis Z Mbao, Alick B Lungu, Shula M Sikaona, Anthony Bwalya, and Cosam
S Chanda
No.1/2020 How has the rise of Pan-African banks impacted bank stability in WAEMU?
By Désiré Kanga, Victor Murinde, and Issouf Soumaré
No.2/2020 Threshold effects of financial inclusion on income inequality. By Ayse Demir,
Vanesa Pesqué-Cela, and Victor Murinde
No.3/2020 FinTech, financial inclusion and income inequality: A quantile regression
approach. By Ayse Demir, Vanesa Pesqué-Cela, Yener Altunbas, Victor Murinde
No.4/2020 Director reputation and earnings management: evidence from the British honours
system. By Tolulola Lawal
No.5/2020 Financial inclusion and the growth-inequality-poverty triangle: New evidence from
Africa. By Ayse Demir and Victor Murinde
No.6/2020 Fellowship amongst peers: A systematic and selective survey of literature on the
analysis of interbank lending networks. By Anosi F. Ikimalo and Victor Murinde
No.7/2020 Exploring the impact of COVID-19 pandemic on Africa’s FinTech space. By
Joshua Yindenaba Abor
No.8/2020 Financial market integration in sub-saharan Africa: How important is contagion?
By Robert Akunga, Ahmad Hassan Ahmad and Simeon Coleman
No.9/2020 Finance and well-being in developing countries: Does access to mobile money
improve household well-being? By Fei Jiang, Christopher J. Green, Ahmad Hassan
Ahmad and Carlos Sakyi-NyarkoNo.10/2020 Mobile money, ICT, financial inclusion and inclusive growth: How different is
Africa? By By Fei Jiang, Christopher J. Green, Ahmad Hassan Ahmad and Victor
Murinde
No.11/2020 Financial inclusion and welfare improvement: Empirical evidence from A
households survey data. By Carlos Sakyi-Nyarko, Ahmad Hassan Ahmad and
Christopher J. Green
No.12/2020 The FinTech revolution: What are the opportunities and risks? By Victor Murinde
and Efthymios Rizopoulos
No.13/2020 The COVID-19 pandemic and its impact on African economies and financial
markets: A review. By Elikplimi Komla Agbloyor and Joshua Yindenaba Abor
No.14/2020 Online data collection for monitoring the impact of COVID-19. By Victor Murinde,
Athina Petropoulou and Meng Xie
No.15/2020 Towards resolving the partner selection problem in venture capital syndication:
new insights from a neural network based study. By Qiong Ji, Xiaoming Ding and
Victor Murinde
No.16/2020 Government policy and financial inclusion: Analysing the impact of the Indian
national mission for financial inclusion. By Rachel Hadar and Ronny Manos
No.1/2021 Forecasting the CBOE VIX with a hybrid LSTM-ARIMA model and sentiment
analysis. By Yossi Shvimer, Victor Murinde and Avi Herbon
Any reproduction, publication and reprint in the form of a different publication, whether printed or
produced electronically, in whole or in part, is permitted only with the explicit written authorisation
of the authors of this paper. The views expressed in the paper are those of the authors and do not
necessarily reflect those of the CGF.
All CGF Working Papers can be downloaded from CGF Website.
Centre for Global Finance
SOAS University of London
10 Thornhaugh Street, Russell Square
London
WC1H 0XG
Email: cgf@soas.ac.uk
Website: https://www.soas.ac.uk/centreforglobalfinance/publications/A Political Economy Analysis (PEA) of Capital Account Management (CAM) measures in
Ghana*
Authors: Peter O’Flynn; Stephany Griffith-Jones; Stephen Spratt
Abstract
The growth of the financial sector is pivotal for all emerging economies. However, the relative success
of reform measures in the financial sector, including those related to their regulation, usually depend
on political factors, which influence reform choice, design and implementation (Spratt, 2017). This
study applies a Political Economy Analysis (PEA), based off an adaption of Moncrieffe & Luttrell
(2005) multi-level framework approach, to understand how Ghana manages its Capital Account and
engages in Capital Account Management (CAM) measures to better regulate financial flows, and meet
the country’s foreign exchange demands.
Keywords: Ghana; Capital Account Management (CAM); Political Economy Analysis (PEA); Capital
Controls
Contents
Contents
List of Figures ......................................................................................................................................... 2
List of Tables .......................................................................................................................................... 2
Acronyms and Abbreviations.................................................................................................................. 2
Introduction ............................................................................................................................................. 3
1. Methodology ................................................................................................................................... 5
1.1. Ghanaian Context....................................................................................................................... 6
1.2. Political Economy Analysis in Ghana ......................................................................................... 7
2. Ghana’s Macroeconomic Outlook (a national level analysis) ......................................................... 8
2.1. Capital Account Management and Ghana................................................................................ 11
2.1.1. Application of CAM policies in Ghana, and policy options available ................................ 14
1.3. Dollarization .............................................................................................................................. 15
2. Stakeholder Mapping (Sector Level Analysis) .............................................................................. 16
3. Core Issues .................................................................................................................................. 20
3.1. Direct Policies to Manage the Capital Account, and the Backlash ....................................... 21
3.2. Sterilisation of the Capital Account ....................................................................................... 25
The Ghana Cocoa Board and the syndicated loan ........................................................................... 26
3.3. Sterilisation and the Eurobond Market ................................................................................. 27
4. Conclusion and Policy Recommendations ................................................................................... 30
Bibliography .......................................................................................................................................... 32
*
We acknowledge, without implication, financial support from the DEGRP Research Grant (ES/N013344/2) on “Delivering
Inclusive Financial Development and Growth”, funded by the ESRC and the former UK Department for International
Development, which merged with the Foreign & Commonwealth Office on 2 September 2020 to become the Foreign,
Commonwealth & Development Office (FCDO).
1Annex 1: List of Interviewees ............................................................................................................... 37
Annex 2: List of Questions from Interviewees ...................................................................................... 37
List of Figures
Figure 1: Ghana’s Growth Trajectory 2014-2022 Projected (Osei-Assibey, 2019) ................................ 9
Figure 2 USD/GHS 2007-2019 Depreciation of the Cedi ..................................................................... 10
Figure 3: Timeline of FDI and other flows into Ghana 2003-2007 Source: Jahan & Wang (2016) ...... 12
Figure 4: Capital and Financial Account 2005-2020 (projected) Source: Bank of Ghana (2016) & IMF
Projections (2018) ................................................................................................................................ 13
Figure 5: Net capital Flows (Capital and Financial Account Balance) Source: Trading Economics/Bank
Of Ghana .............................................................................................................................................. 13
Figure 6: Gross domestic savings (% of GDP) Source: World Bank Indicators ................................... 14
Figure 7 Stylised Relationship Channels between Bank of Ghana and Major Stakeholders on Capital
Account Management .......................................................................................................................... 16
List of Tables
Table 1: Holding Structure of Domestic Debt (GH¢ millions), 2014 – 2017; Source: Osei-Assibey from
Bank of Ghana and Ministry of Finance ................................................................................................. 9
Table 2: External Debt Stock by Creditor Category (in millions of US$) Source: Osei-Assibey (2019)
from Bank of Ghana and Ministry of Finance ....................................................................................... 10
Table 3: Selected External Debt Indicators (US$’ million), Source: Osei-Assibey (2019) from The Bank
of Ghana ............................................................................................................................................... 10
Table 4: Ghana 2018 Taxonomy of Capital Flow Management Measures (CFMs) Souce: IMF 2018b24
Table 5: Eurobond Issuances to-date by the Ministry of Finance, Sources: Ministry of Finance, Bank of
Ghana, Haque et al (2017); Amoah-Darkwah (2019)........................................................................... 28
Acronyms and Abbreviations
BOG Bank of Ghana
CAM Capital Account Management
CARs Capital-Account Regulations
CFMs Capital Flow Measures
ESRC Economic and Social Research Council
DFID Department for International Development
FDI Foreign Direct Investment
FEA Foreign exchange accounts
FINSAP Financial Sector Adjustment Programmes
FOREX Foreign Exchange
FX Foreign Exchange
GDP Gross Domestic Product
IMF International Monetary Fund
LICs Low-Income Countries
MOF Ministry of Finance
NDC New Democratic Congress
NPP New Patriotic Party
NPRA National Pensions Regulatory Authority
ODA Overseas development Assistance
PEA Political Economy Analysis
SDR Special Drawing Rights
SSA Sub-Saharan Africa
2Introduction
The growth of private capital flows to emerging and developing economies has brought significant
questions on their effect on their recipient economies. As noted by Bonizzi (2013) “When considering
emerging markets, the asymmetric nature of the international monetary system must be stressed.” (pp.
3) This means that the rules of the game are different for developed, emerging and low-income
countries.
The impact of liberalising the capital account (and resultant private capital flows) is mixed. Some
studies cite positive impacts on economic growth and FDI Inflows (Massa, 2014), substitution effects
against countries with capital controls (Giordani et al, 2014) and the reverse (Alley; 2017).
Gradually, this debate has become more nuanced, recently Griffith-Jones et al (2018) noted, based on
econometric work, which draws on a unique and original data base, that the impact of capital flows is
dependent on both the nature of flows and sector dependent; for the latter, capital flows to Sub
Saharan Africa into the construction & real estate sector enhancing total factor productivity, while flows
into agriculture and infrastructure sector FDI are, somewhat surprisingly, associated with reduction in
productivity.
What is known is that increased capital inflows and outflows provide significant potential benefits, but
also big challenges. With the positive impact of increased capital flows and investment into the
economy, there also comes increased macroeconomic risks – such as currency fluctuation, which
contribute to changes in current account imbalances, interest rate fluctuation, and inflation risks,
leading to increasing potential for volatility of capital flows, which creates financial stability risks, as
well as risks to sustainable growth (Kawai and Takagi, 2008). Sometimes these risks can lead to
financial and/or banking and/or debt crises. In particular “LICs continue to experience strong pro-
cyclical swings in external financing in terms of availability, maturity, and cost” (Tyson and Beck, 2018
pp. 7), The debate about the role of Capital Account Management (henceforth CAM)1 measures to
stabilise these flows has been prominent amongst academics and policymakers in the wake of the
2008 financial crisis. It will be increasingly important in the framing of sub-Saharan Africa’s rising risk
of a debt crisis (Mustapha & Prizzon, 2018).
Proponents of CAM Measures (Ocampo & Griffith-Jones, 2008; Chowla, 2011; Gallagher et al., 2012;
Ocampo, 2015; ; Griffith-Jones and Ocampo,2018; Tyson & Beck, 2018) note the ability of CAM
measures to promote market stability, and macro-economically sustainable growth, as well as place
automatic stabilisers on capital flows and thus help compensate for pro-cyclical tendency of capital
flows. For instance, Subbaro (2013) notes the ability of CAM measures to stop emerging markets from
adopting financial products that proved “toxic” (pp. 4) in advanced economies. Other, broadly
diminishing, especially after the 2007/2008 financial crisis, proponents see any type of capital account
management measures as a hindrance to the free movement of capital and therefore reducing the
efficiency of the financial system as a whole to move to allocate capital effectively to the right projects
1
Note for those searching for evidence on this literature may also find similar language with regards to
Capital-Account Regulations (CARs), Capital Flow Measures (CFMs)
3(and right countries) (Habermeier et al, 2011; Kitano, 2011). This argument posits that capital controls
run counter to the allocative efficiency of capital, where the rate of return on capital can be maximised,
for society as a whole.
The IMF has been crucial in this debate, particularly because of their influence on the international
monetary system as a whole, including in their position in lower income economies where there is a
push to liberalise the capital account to bring in FDI. Their institutional view has softened significantly
(IMF, 2012), noting that:
“Capital flow liberalization is generally more beneficial and less risky if countries have reached certain
levels or thresholds of financial and institutional development…. liberalization needs to be well
planned, timed, and sequenced in order to ensure that its benefits outweigh the costs, as it could have
significant domestic and multilateral effects. Countries with extensive and long-standing measures to
limit capital flows are likely to benefit from further liberalization in an orderly manner. There is,
however, no presumption that full liberalization is an appropriate goal for all countries at all times.”
(IMF, 2012. PP.1)
Some commentators have argued that this change in guidance has given ‘carte blanche’ (Blundell-
Wignall, 2016) to incorporate some level of CAM measures.
The IMF’s position nowadays reflects that there is a greater role for context to be a major part of the
CAM debate, i.e. “that there should exist country-specific characteristics for capital controls to be
effective. From this simple perspective, this rationalizes why some capital controls were effective and
some were not” (Magud et al, 2011 pp. 1).
This study, funded by the ESRC-DFID Growth Research Programme, specifically looks at the context
of one country, Ghana, a country with democratic stability. A country with strong resource
endowments, and an almost completely liberalised capital account (bar some restrictions on the
minimum maturity length of debt securities held by foreign residents) (Brafu-Insaidoo et al, 2019).
While some scholars (Egbuna et al, 2013; Jahan & Wang, 2016) have found that liberalisation of
Ghana’s Capital Account (starting in 2005/2006) has been beneficial to growth within the country –
something not found more generally in low-income countries, as this IMF study found (Jahan & Wang,
2016), the purpose of this paper is not mainly to evaluate the benefits and costs per se of capital
account liberalisation. Rather, it intends to examine the decision-making process behind decisions
relating to the capital account, and address the ‘discourse space’ for CAM measures in the SSA
context, i.e. whether such CAM measures could even be implemented as part of the policy options
available to governments.
Massa (2016) notes that there is insufficient evidence in this issue, for LICs: “the types of capital
account management tools that have been used in LICs over time, as well as on the effectiveness of
such policy measures, is extremely limited and in some cases it is completely missing. This represents
a severe constraint for policy-makers in LICs who cannot learn from previous capital account
management experiences in peer countries.” We also note the relative success of reform measures in
4the financial sector usually depend on political factors (Spratt, 2017a). Thus, this study intends to
provide a context-heavy, deep dive into the core stakeholders, issues of the day, and determinants of
decision making, by using a Political Economy Analysis (PEA) framework, and based on in-depth
interviews, many carried out in Ghana itself.
The rest of this paper will be as follows. Section 1 outlines the core methodology, as well as provides a
brief introduction to PEA in Ghana. Section 2 focuses on a stylised country level analysis of Ghana,
incorporating some of the most current macroeconomic fundamentals, which is/are key for determining
policy space and whether CAM measures are applicable. Section three provides a sector level
analysis, starting with a stakeholder mapping of the core actors in determining CAM measures, their
linkages and their motivations. Section 4 goes into a series of core issues with regards to CAM,
including CAM measures currently in place; the political economy of sterilising larger capital flows
(primarily the annual syndicated loan for CocoBoard); the backlash against CAM measures placed in
2014 when the Cedi appeared to be in freefall; as well as the role of wider macro-prudential policy
(such as the political economy of the 2018/2019 push to increase the minimum capital requirements of
banks operating in the domestic market).
1. Methodology
The methodology from this report leans heavily on the approach developed by Spratt (2017a). In
developing his framework, Spratt argues that finance is crucial for growth and development but can
also foster instability and crises (see also Griffith-Jones and Gottschalk, 2016). As a result, financial
sector development, needs to have as aims both growth and stability within its own specific context.
However, the potential for finance is not being met as a result of reform attempts not achieved or
fulfilled across these contexts, as well as limitations in finance itself. PEA is a framework that can
address this, in analysing the processes of power; rational choice; cost benefit; and political structures,
so that finance reforms can be appropriately designed and implemented. While this report may only be
looking at one country’s context, a deep understanding of these dynamics, can also help countries
facing some similar challenges, suggesting benefits from collaboration amongst groups working under
similar conditions (for instance in this case, volatility and political dynamics of large financial flows, and
the mechanisms to manage those flows).
Put simply “All PEA tries to understand why people act (and don’t) as they do, and how this is affected
by institutional factors (structure and agency). Precise details of how this is done may be less
important than ensuring it is done consistently and well” (Spratt, 2017b; pp. 12)
In his approach, Spratt argues for a multi-level framework, comprising of the national (understanding
the history and context of institutions and macroeconomic fundamentals), sectoral (comprising of the
understanding of organisations, institutions and actors, with a defined stakeholder mapping exercise),
and most importantly (and most relevant for a deeper understanding of CAM political economy) policy-
level analysis. In this, he builds on frameworks by Moncrieffe & Luttrell (2005), Moore (2001), and
World Bank (2008). This analysis, works with these approaches, but also attempts to simplify further in
ease of reading and analysis, by breaking out the national level analysis to the core features relevant
5for CAM, applying a detailed stakeholder analysis, and then providing the policy/problem level analysis
through a series of core topics related to CAM – to provide sufficient depth into issues of the
management of the capital account in the Ghanaian Context. These steps can be broken into the
following:
1. Determine data sources and methods
2. Undertake country context analysis (i.e. Ghana’s Macroeconomic Outlook), or obtain recent
existing analysis (i.e. for national or non-finance sector PEA)
3. Define sector and stakeholders
4. Specify stakeholders’ role, interests and influences
5. Map relationships between stakeholders
6. Map policymaking process
7. Final stage. In light of the above = design policy (which ‘go with the grain’) and implement
through ‘action framework’:
Adapted from Spratt (2017).
Regarding data sources for this report, a mixture of academic and grey literature has been sought
through a structured process (as per Hagen-Zanker & Mallett 2013). This includes media reporting as
a particularly strong channel in the influencing of public debate. Additionally, 23 core stakeholders
representing a wide range of individuals across the senior policy, academic, banking, and forex arena
were interviewed at length across two weeks of fieldwork in Ghana in January 2019, as well as long
phone interviews after.2
Limitations to the study from this reporting is that we did not get access to some stakeholders during
fieldwork i.e. importers and exporters, who have substantial lobbying power when it comes to
exchange rate controls, as well as some academics and civil society groups engaging with policy
debate with the Bank of Ghana (BOG) and Ministry of Finance (MoF) with regards to CAM.
Furthermore, our structured literature review process has attempted to capture both voices dissenting
and supporting CAM measures in Ghana, however, the analysis has broadly been limited to published
material online, therefore some newspaper reports around CAM measures may be missing. We
recognise this limitation when addressing our core issues and therefore have muted our overall
findings as a result.
1.1. Ghanaian Context
The Republic of Ghana was the first colonial nation in Africa to gain its independence in 1957. It has a
presidential constitutional democracy and a population of 28.1 million (CIA, 2018). Ghana is in
Western Africa and is bordering the Gulf of Guinea, between Cote d'Ivoire and Togo, with Burkina
Faso to the North.
2
A full list of interviewees can be found in Annex 1.
6The country transitioned to a multi-party democratic system in 1992. The current president of Ghana is
Nana Akufo-Addo of the NPP (New Patriotic Party), taking over from incumbent John Mahama of the
NDC (National Democratic Congress party) in 2016 winning by a margin of 9.45%. Ghana uses a first
past the post electoral system, which tends to produce fewer political parties, with the main parties
being the NPP and NDC. Interviewees expressed that in many ways the political parties are similar in
terms of economic policy, however with the NPP being more centre-right, and the NDC being more left
of centre.
Ghana has high levels of freedom of the press, with it ranking the highest rated African countries in the
World Press Freedom Index 2018. As a result, vibrant debate is placed on economic and fiscal policy,
as well as on the decisions and actions of local politicians. The state is split into three branches as per
the 1992 constitution: The Executive, the Legislature and the Judiciary and indicates boundaries for
the performance of their respective powers. Devolvement of power to local authorities to district
assemblies occur frequently (AninverInfraPPP, 2017).
Ghana’s central bank, the BOG is independent and is the supervisory and regulatory authority
regarding all of the country’s financial institutions, as well as defining monetary policy, including
interest rates, typically at a medium-term target of 8% (BOG Website, 2019).
The Cedi is the official currency of Ghana and English is the official language.
1.2. Political Economy Analysis in Ghana
While several reports focussing on Ghana’s political economy have been written, few have focused on
the dynamics of the financial sector. The breakdown of PEAs can be broken down into three
segments. Firstly, looking at a specific stakeholder. For instance, CCD/ODI conducted a series of
policy briefs, focussing on the middle class (Luckham et al, 2005), faith-based organisations (Crook,
2005), traditional institutions (Crook, 2005b). This complements a political economy analysis of civil
society conducted by Tsikata et al (2013). Secondly, there have been those PEAs focussing on
processes; such as drivers of change (Booth, 2005) and corruption (Agbele, 2011). Thirdly, there are
those that have focused on sectors – for instance on the coastal sector (Aninver InfraPPP, 2017),
Fisheries (Eriksen et al, 2018), and Oil (Philips et al, 2015).
The relatively most relevant reference to the political economy in Ghana in relation to capital account
management appear to be those based on both the budgetary process (Killick, 2005), economic
reform (Issahaku, 2000), as well as studies touching on political economy such as Conteh &
Ohemeng’s (2009) comparison of privatization decisions in Botswana and Ghana; and Abdallah
(2015) on the strength of the supervisory and regulatory environment in Ghana.
In these papers, there is a mix of viewpoints that appear. Killick’s (2005) speaks of a “democratic
deficit” in budgetary processes, which highlights a lack of civil society and other actors to engage in
macro-economic issues. After multiple IMF programmes, this seems to have improved significantly,
except around election time according to interviewees. Similarly, Issahaku’s (2000) paper has issues
that it is still based on a previous reality of Ghanaian political economy under the Rawlings regime and
focuses primarily on the structural adjustment programme. However, it does highlight the role that
7multilateral development actors – such as the IMF have had on Ghana’s growth trajectory. Something
that continues to this day under the recent IMF programme.
"The IMF and its sister organization, the World Bank, wield more influences over economic
development and environmental quality than any other single institution on earth. It is seen that IMF
policy prescriptions and the conditionality accompanying these programs aim at assisting a country in
balancing its internal budget and in reducing its balance of payments deficits -this is an impossible
task as long as massive debt relief is not forthcoming. Instead, nothing short of a drastic slashing of
domestic expenditures and the relentless pursuit of exports is what is demanded of Ghana by IMF
policies, with little regard for the social and environmental consequences.” Issahaku (2000; pp. 22).
2. Ghana’s Macroeconomic Outlook (a national level analysis)
Ghana’s relatively strong financial performance (and at times, high capital inflows) is something that
can be viewed as very positive in the marketplace (see below). However, SSA countries have
experienced periods of strong inflows followed by large capital outflows before. Prudent CAM
measures, as well as adequate macro-prudential regulations, and appropriate fiscal policies can be
seen as requirements for either limiting the pace of this flow, or for acting as an automatic stabiliser
when capital flows reverse (as they have a tendency of doing). This has been strongly addressed in
the literature; this literature also stresses that portfolio flows (as well as short-term debt) are more
volatile than other capital flows (Massa, 2013; Griffith-jones and Ocampo, op cit) – and therefore there
is greater risk in the Ghanaian economy.
Macroeconomic Performance
Ghana’s overall macroeconomic position has improved substantially over the past few years, though
there are some concerns. GDP growth rates were up from 2.9% in 2014 to a projected growth rate of
7.6% in 2019, which is mostly oil-driven (see Figure 1). Ghana’s relative political stability, high natural
resource endowment, overall good economic policies and functioning legal system has made it a
relatively attractive investment to foreign investors seeking stable returns, as well as improving its
footing in terms of ease of doing business (World Bank, 2019).
Core to this natural resource endowment is gold and oil, which combined accounted for over 68% of
Ghana’s export values (UN COMTRADE, 2019), this means that Ghana’s fortunes are to an important
extent driven by commodity prices. Notably, while gold output is relatively stable, oil is likely to have
drastic differences in the impact on the capital account, particularly in more recent times when new oil
fields have been found. This is leading to super-natural growth that some commentators do not expect
to last beyond the medium term (Fröhlich, 2019). The services, manufacturing and financial sector are
also top performing sectors in the economy (ibid).
89
8
7
6
5
GDP %
Overall growth
4
non-oil growth
3
2
1
0
2014 2015 2016 2017 2018* 2019* 2020* 2021* 2022*
Figure 1: Ghana’s Growth Trajectory 2014-2022 Projected (Osei-Assibey, 2019)
Inflation has fallen in Ghana to single digits for the first time in recent months (9.47% in May 2019 from
nearly reaching 18% in 2016). Monetary policy is aimed at keeping inflation below 10%, with the
interest rate in January 2019 being 16%.
The 2015-2019 IMF programme arrangement of SDR 664.20 million has reached its conclusion in
March 2019 (IMF, 2019a) and has been perceived to be a success by the Government (according to a
transcript of Ken Ofori-Atta to parliament in March 2019 (Moses, 2019)), with the fiscal position
improving (albeit with substantial deficits corresponding with the 2016 election despite the IMF
programme), foreign exchange reserves rising, consolidation in the banking sector, and sovereign
spread reducing. There are still risks from a fiscal perspective from a revenue standpoint however,
with significant work required (IMF, 2019b).
However, despite the IMF programmes relative success, there are still also questions on the
sustainability of Ghana’s Debt Profile, with domestic debt tripling between 2013 and September 2018,
and external debt going up by a similar ratio (MOF, 2018). The majority of Ghana’s external debt is in
dollars, and therefore has significant implications for debt service in foreign currency and for the
capital account (Jubilee Debt Campaign, 2018). Ghana has become more reliant on foreign investors
in order to service its debt (see Tables 1, 2, and 3), and thus Ghana has higher exposure to changes
in market sentiment alongside exchange rate risk (as well as rollover risk).
Table 1: Holding Structure of Domestic Debt (GH¢ millions), 2014 – 2017; Source: Osei-Assibey (2019b) from
Bank of Ghana and Ministry of Finance
2014 2015 2016 2017
A. Banking system 18,745.5 19,280.4 27,834.4 23,319.2
Bank of Ghana 9,293.5 8,851.2 13,056.2 13,009.3
Deposit Money Banks (DMBs) 9,452.0 10,429.1 14,778.2 10,309.9
B. Non-Bank Sector 9,900.7 12,830.3 13,486.6 17,557.8
SSNIT 1,563.6 1,502.6 1,463.4 1,403.4
Insurance Companies 63.3 80.9 179.0 340.5
Other Holders 8,273.8 11,246.8 11,844.1 15,813.9
Rural Banks 494.1 567.5 633.3 300.7
Firms & Institutions 5,093.3 6,602.3 7,864.1 10,807.8
Individuals 2,686.4 4,077.1 3,346.8 4,705.4
C. Foreign sector (Non-Residents) 5,974.7 6,717.4 11,594.4 25,665.6
TOTAL(A+B+C) 34,620.9 38,828.1 52,915.4 66,542.6
9Table 2: External Debt Stock by Creditor Category (in millions of US$) Source: Osei-Assibey (2019b) from Bank
of Ghana and Ministry of Finance
2013 2014 2015 2016 2017
Total External Debt 11,901.97 13,871.84 15,781.89 16,460.99 17,160.41
Multilateral Creditors 4,557.92 4,900.73 5,379.45 5,547.96 6,436.84
Bilateral Creditors 1,114.91 1,127.81 1,096.32 1,136.47 1,210.67
Export Credit Agencies 1,119.38 1,158.43 1,176.29 1,315.22 1,461.23
Other Concessional 1,750.48 1,883.56 1,811.32 1,730.13 1,769.35
Commercial Creditors 1,828.76 2,270.80 2,788.00 2,782.20 2,403.20
International Capital Market 1,530.51 2,530.51 3,530.51 3,949.01 3,879.12
Table 3: Selected External Debt Indicators (US$’ million), Source: Osei-Assibey (2019b) from The Bank of Ghana
Year 2012 2013 2014 2015 2016 2017
External Debt 9,153.58 11,901.97 13,871.84 15,781.89 16,460.99 17,160.41
(million US$)
External Debt 22.90 26.89 39.13 43.73 41.31 36.80
to GDP ratio
External Debt 54.45 73.44 90.89 152.91 94.58 101.71
to XGS ratio
External Debt 6.66 7.04 10.44 19.08 19.66 23.04
Service to D. R
External debt 1.37 1.41 2.20 3.34 3.44 3.67
service to GDP
NB: D.R= Domestic revenue (narrow); XGS= Export of Goods and Services
The Cedi has declined ever since it was rebased (in 2007) with a rate of 1 Ghana cedi = $1.05, to in
February 2019 1 Ghana cedi = $0.19 (see Figure 2). The cedi depreciated by 11 percent between
January 2018-2019, the slowest in recent years. The strong depreciation of the cedi is usually linked to
Ghana’s declining terms of trade during the last ten years (particularly within major commodities
including cocoa), though there have been improvements in the current and trade accounts of Ghana.
6
5
4
USD/GHS
3
2
1
0
07
08
09
10
11
12
13
14
15
16
17
18
19
n-
n-
n-
n-
n-
n-
n-
n-
n-
n-
n-
n-
n-
Ja
Ja
Ja
Ja
Ja
Ja
Ja
Ja
Ja
Ja
Ja
Ja
Ja
Figure 2 USD/GHS 2007-2019 Depreciation of the Cedi
Naturally, the rise of the dollar’s strength over the past decade is partly behind this, but also Ghana’s
declining terms of trade and repeated balance of payment deficits. Interviewees noted how the
exchange rate in Ghana is very politically charged and influential, and a marker for success through
elections, with for example the decline of the Cedi between 2013-2014 placed firmly at the feet of
President Mahama’s government by the opposition.
10Ghana’s has had some successes in recent years in raising private international finance, introducing
its first Eurobond in 2007, which made Ghana the first African country to borrow from the international
capital markets after South Africa. There have been several since, the most recent in 2019 (Dzawu,
2019), which have been increasing in tenor. The 2019 bond issuance was for 30 years, attempting to
push the yield curve further in West-Africa (FT, 2019). Naturally the spending of such Eurobond
financing is crucially important (i.e. whether spending is on productive investment as opposed to less
productive investment or consumption), as well as the pricing of the bonds themselves. Other actors
have noted that this longer-term debt profile allows for greater fiscal responsibility, as long-term bonds
allow the government greater fiscal space. Ghana’s credit profile has been relatively stable, with
Standard and Poors rating Ghana a B rating since 2010 until 2019, it briefly dropped to a B- from
2014-2017 prior to the IMF loan (Standard and Poors, 2019).
Furthermore, while there was an attempt to provide long-term signals to the market, the African
Financial Markets Initiative notes that out of 6 potential benchmark maturities: 3-month, 6-month, 1, 2,
3 and 5 years, only the three- and six-month tenors serve as real benchmarks to the marketplace, due
to infrequent provision, or issuance sizes being too small (AMFI, ND), though this is expected to have
grown. However, the increasing role of foreign investors in local bond markets (anything above two
years), development of longer-term bonds, (upwards of ten years), and the development of a
secondary market has been seen as part of a positive outlook for Ghana as a whole (and will further
help investors in having a relative baseline to price yield against). At the start of 2017, sovereign
spreads were approximately 600 basis points, reduced to 350 basis points at the end of the year,
which shows the volatility of such spreads (Addison, 2018).
Overall, the picture is quite positive, but as the debt statistics show, excessive borrowing is taking
place in ‘the good times’. As the risk of a ‘debt crisis’ across Africa becomes more likely, and when
other problems arise, CAM measures may be required in order to stop/discourage short-run flows of
capital and constitute part of the policy toolkit available to the central bank. Furthermore, greater
caution in borrowing in “good times” may have been desirable.
2.1. Capital Account Management and Ghana
Ghana has a fairly liberalised capital account, starting back to its structural adjustment programmes in
1986, then further engagements in the Financial Sector Adjustment Programmes (FINSAP) 1 and 2,
as well as the Ghana Investment Promotion act in 1994. A seminal moment, however, was in 2005/6
under the new Foreign Exchange Act (Act 723). This partial liberalisation of the capital account “was a
watershed development. It opened up the longer end of the market to non-resident investors and has
helped accelerate development of Ghana's domestic (particularly bond) capital markets” (Bawumia et
al, 2008; pp. 1).
This is demonstrated in Figure 3 – which demonstrates the important increase in FDI post
liberalisation,
11Figure 3: Timeline of FDI and other flows into Ghana 2003-2007 Source: Jahan & Wang (2016)
The act allowed non-residents to buy government securities of periods three years or greater, with a
minimum holding period of a year (Murinde, 2009). This was in tandem with debt restructuring, and
reforms in the debt and stock markets, and mechanisms to try and promote interbank money systems,
and strengthen regulation in the financial sector. Continued efforts are still there to date, with the
securities and exchange commission being spun out of the BOG in 2016 (Act 929).
Importantly – this 2005/6 legislation set forth the provisions of what would be possible in managing the
capital account in the fact that only temporary imposition of exchange controls to restrict payments for
a period of three months (between residents/non-residents and payment to and from the country alike)
with provisions for power of exemption with the governor and minister (BOG Act 723). This is
essentially a CAM measure, or ‘capital flow management measure’, which is stated as “a temporary
instrument embedded in an overall strategy of financial opening, the organization insists on the
general advantages of financial liberalization, which poses serious limits to emerging economies’
policy space….The [IMF] keeps on stressing a separation of prudential financial regulation, which
should be permanent, and temporary CFMs” (Fritz & Prates, 2014).
Subsequent liberalisation that has taken place, as well as efforts in strengthening both financial
supervision and the domestic capital market, building up the debt and stock market, as well as a
reasonable macroeconomic environment post financial crisis, has seen capital flows into the country
increase, and then plateau (Figure 4). There are those, including a senior official and researcher of the
IMF, who note that it was this liberalisation that “induced fiscal excesses and the subsequent volatility
in the exchange rate” (Ostry et al, 2015); even though such volatility was seen before, it was certainly
not at the same rate.
126,000.00
US$ Million 5,000.00
4,000.00
3,000.00
2,000.00
1,000.00
0.00
d…
05
06
07
08
09
10
11
12
13
14
15
16
17
)
)
ed
ed
te
20
20
20
20
20
20
20
20
20
20
20
20
20
ct
ct
ec
je
je
j
ro
ro
ro
(P
(p
(P
18
19
20
20
20
20
Capital And Financial Account Capital Account
Financial Account Linear (Capital And Financial Account)
Figure 4: Capital and Financial Account 2005-2020 (projected) Source: Bank of Ghana (2016) & IMF Projections (2018)
There were also changes in capital flows – with official inflows having less relevance as a response to
Ghana no longer being a LIC in 2010, and therefore a requirement for greater engagement with the
international capital markets as there was less cheap concessional finance available from multilateral
agencies (at least until the IMF loan). “During the last decade ODA (Official Development Assistance)
support to Ghana has continued to decline, reaching values well below 5% of Net ODA disbursements
as a percentage of Gross Net Income (this ratio peaked in 2004 with 16.5%). Net ODA disbursements
per capita oscillates in the range USD 50-70 per year.” (Aninver InfraPPP, 2017). Other reasons for
this growth of private international finance include, the Global Financial Crisis of 2008, leading to
returns low in advanced economies, capital flows to emerging markets rose. Figure 5 demonstrates
the role of commodity markets and seasonality also having a major role in Ghanaian capital flows each
year (and thus the requirement for sterilisation of capital flows).
Figure 5: Net capital Flows (Capital and Financial Account Balance) USD Million Source: Trading
Economics/Bank Of Ghana
Figure 6 shows that while gross domestic savings have been rising in recent years, and could
potentially be used as a source of finance.
1330
25
20
% of GDP
15
10
5
0
1960
1962
1964
1966
1968
1970
1972
1974
1976
1978
1980
1982
1984
1986
1988
1990
1992
1994
1996
1998
2000
2002
2004
2006
2008
2010
2012
2014
2016
-5
Figure 6: Gross domestic savings (% of GDP) Source: World Bank Indicators
While the uptick in capital flows that occurred was welcomed, there was still the acknowledgement that
these are volatile, and the Bank of Ghana Act (Act 918) set the precedent for the Governor of the BOG
to restrict payments, acquisitions, and the frequency of foreign exchange purchases in the economy.
Some interviewees noted that this act, while generally perceived to be a net positive, ensuring the
independence of the BOG from political influence, also potentially gave too much power with regards
to controlling and limiting capital flows. On the other hand, the IMF recognised volatility of capital
flows, and suggested that in the Ghanaian context, maintaining some form of limited capital controls
may have merit, though suggested that sound macro-prudential regulatory policy was also important
(IMF, 2008).
This underlies the fact that the FX interbank market has deepened in recent years, though the IMF
rightly notes that it remains dominated by BOG’s actions (IMF, 2019a). This is partially due to the
BOGs role in transactions relating to cocoa and oil (to address shortages in the dollar).
Crucially, a counterfactual to Ghana’s capital account liberalisation is not known, what is known from
earlier IMF reports is that “Interestingly, Ghana is the only main recipient of increased private capital
flows to have liberalized its capital account during the recent rise in flows—others either liberalized
earlier but experienced rising inflows later (e.g., Uganda, Zambia) or have received inflows despite
continuing significant restrictions (e.g., Mozambique)” (IMF, 2008 pp. 29).
2.1.1. Application of CAM policies in Ghana, and policy options available
Substantial controls were not really imposed between 2006-2014, the main trend being the further
opening of the capital account, with non-resident investors being able to participate in the issuance of
medium term domestic sovereign bonds. Now this requirement has been reduced so that non-
residents can invest in bond securities with a maturity of greater than three years – this is in order to
limit the flows of “hot” money into the economy. Though yields are relatively high compared to western
markets, however the volatility of the domestic currency remains an issue. The concern of a reversal
of capital flows was noted by interviewees at the BOG and the MOF as a concern, particularly when
US interest rates rose in 2016, but not so much that there was an overwhelming concern as to warrant
14capital controls, with some arguing the possible reputational damage in international markets as a
much worse alleged long-term cost to attracting capital to the country.
Ghana did implement some “soft” controls in 20143 (which are addressed below), as a response
primarily to the currency crisis.
Post-2014 and after joining the IMF programme, Ghana accepted (under IMF Article VIII) to “not
impose restrictions on current payments or discriminatory currency practices, and to maintain the
convertibility of foreign-held balances and furnish information such as data on FX reserves consistent
with IMF requirements.” (Dun & Bradstreet, 2017). This does not refer to CAM, but to current
transactions. In terms of CAM Policies explicitly available in the Ghanaian context, Narh (2015)
separated them into three main functions:
1. Direct Policies
• These include foreign exchange controls to stabilize the cedi in 2014 and discourage
dollarization, the policies (below) were negatively received and mostly reversed in a six-
month period
2. Sterilization of the capital account for significant inflows
• These typically happens for the annual cocoa syndicated loans, where there is a role of
this transaction securing the country’s foreign exchange.
3. Regulatory policies, including macro-prudential policies
• The most prominent of these in recent times has been banking regulation occurring
across 2018, further increasing the minimum capital requirements of the banks, which was
raised to 400 Million Cedis, and which banks were required to meet by the end of
December 2018.
We should note that these features do not explicitly match up with those of Massa (2013),Griffith-
Jones and Ocampo,( 2018) and other international studies, including by the IMF, which note potential
value of i.e. quantity-based capital controls or price-based capital controls. Furthermore, they reflect
the use of a wider policy toolkit, i.e. macro-prudential regulation (as well as fiscal policy, and regulatory
supervision). This highlights the apparent different policy space available in the Ghanaian context,
which also may relate to what Ghanaian policymakers perceive.
1.3. Dollarization
Dollarization (or partial dollarization) of the Ghanaian economy has also been one issue that is hard to
avoid when speaking about foreign exchange measures in Ghana (Laary, 2014; Ablordeppey, 2015).
In Ghana – dollarization is a politically charged issue –with connotations for sovereignty, but also for
future economic performance.
3
The term “soft” capital controls hasn’t been adequately defined in the literature, though its broadly
understood that it is a weaker form of either “market based” capital controls on inflows, controls on
outflows and controls on inflows, in the fact that it doesn’t expressly limit capital leaving an economy,
but increases the difficulty, scope of level of requirement to move capital out or into the economy. In
the case of Ghana in 2014, this measure was in order to limit outflows that would further depreciate
the currency.
15Dollarization is a major issue for managing capital flows in developing economies as it reduces the
ability of monetary policy to influence the economy. Transactions conducted using foreign exchange
(to act as a hedge against inflationary pressures), as seen across major transactions is exacerbated
due to Ghana’s exchange rate liabilities exceeding its foreign exchange assets, this means that the
“balance-sheet effect of changes in the exchange rate is opposite to the effect of changes in relative
prices, and the cumulative effect of the weakening exchange rate on economic growth can be
negative. The systemic risk for the financial system increases, at least for two reasons. First,
financial dollarization reduces the central bank’s capacity as the ultimate lender since it increases
the probability of foreign exchange liquidity deficit in the financial system in stress situations.
Second, since banks extend loans in foreign currencies not only to exporters, financial dollarization
causes foreign exchange inconsistencies that increase credit exposure in foreign currencies,
including by corporates” (Demidenko, 2017; pp.1)
What does this mean for the capital account and capital account management? It means that the
capital account may be undermined, as transactions are taking place in dollars, and not being
converted into cedis, this places further pressure on the cedi.
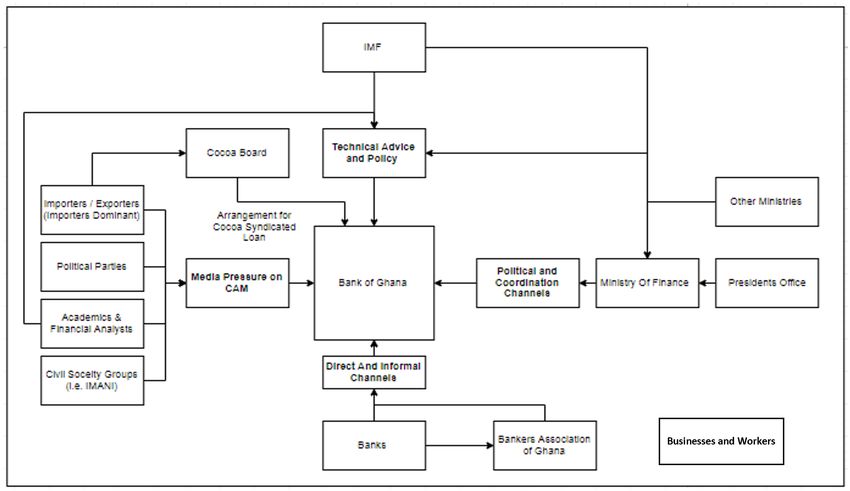
2. Stakeholder Mapping (Sector Level Analysis)
Figure 7 outlines a stylised stakeholder mapping of the core actors in the debates on CAM in Ghana,
and their core mechanisms for influencing policy (in formal and informal manners). These stakeholders
are influenced by, and potentially influential for CAM related issues.
Figure 7 Stylised Relationship Channels between Bank of Ghana and Major Stakeholders on Capital Account
Management
Naturally, key actor in this segment is the Bank of Ghana, particularly in its role (as stated above) in
determining CAM policy, at least through temporary measures at a point in time. The BOG’s power
comes from several core policies, including the Bank of Ghana act (Act 612), and subsequent Acts
16(i.e. 918 & 930)4. It was noted by some interviewees that the central bank is very powerful in certain
arenas, though spinning out the Securities and Exchange Commission (SEC) partially rectified this
silo-ing (SEM, 2018). This policy making authority however is placed under pressure from multiple
angles, from the political left and right, as a source of unelected and technocratic power (Tucker,
2018). The BOG however is influenced by this wide array of actors. Each has a different pressure
gauge on the BOG. Here we will focus on the core actors stated in Figure 7.
Firstly, the Ministry of Finance, where there is a strong rationale for coordination between the central
bank and the Ministry. It is through this channel that most other government departments seek
coordination with the BOG, hence there are political ties as well (particularly from the president’s
office). There is also a supervisory connection, through board representation – which is in one of the
banking acts. While the central bank is independent, this coordination channel, and the nature of the
political economy surrounding the performance of the cedi means that typically when there is a new
president – a new governor of the BOG comes in within six months.
Interviewees noted that the mechanisms for retaining this control, is typically that the MOF do what
they need to do to make the Governors position to stay on untenable i.e. neglecting to invite the
governor to high level meetings for instance. While this happens for the very top positions,
interviewees noted that this does not occur at lower levels in the bank. For instance, Saigal (2016)
notes in an interview with a political risk analyst in Ghana in 2016, when the Mahama government has
some macro-economic fallout, stating “The minister will be easier to remove and replaced by the
president. The central bank governor will be a little more difficult, but by no means impossible" (Ibid),
this came to pass, with the then governor Dr. Kofi Wampah, forced to take an early retirement in early
2016. His successor, Dr. Abdul Nashiru Issahaku only lasted a few months into the Akufo-Addo
administration, after the election in late 2016.
This link between the Central Bank independence and the MOF has also been challenged in the past.
The IMF under the extended credit facility, pushed for a new piece of legislation (i.e The New Public
Financial Management Act, Act 921), in order to increase the Central Bank’s autonomy. This was not
done from a personnel viewpoint, but more from a fiscal perspective, where the previous law allowed
the BOG to finance the government with the amount boing capped at 10% of annual tax revenue.
However, this cap had been breached with some regularity (Economist Intelligence Unit, 2016). In
2012-2014 monetary financing of the deficit grew, further limiting the scope of monetary policy. For
instance, domestic borrowing to total revenue (and grants) reached 42.6% in 2012, and 36.3% in
2013. To note how tied these actors are, a quote from Chief Executive Officer of Dalex Finance,
Kenneth Thompson clearly noted this tie “The BoG is independent, but at the same time it has to
assist government in achieving national objectives” (ibid). It should be stressed that this latter is
common practice in Central Banks, including in developed economies. The Minister of Finance also
previously had the power to elect individuals onto the Monetary policy committee, which has benefits
including the coordination between monetary and fiscal policy, however it does exacerbate political
4
All Acts relating to the Bank of Ghana can be found here: https://www.bog.gov.gh/banking/banking-
acts
17You can also read


