Crypto Wash Trading* - Cowles Foundation for Research in ...
←
→
Page content transcription
If your browser does not render page correctly, please read the page content below
Crypto Wash Trading*

             Lin William Cong                       Xi Li              Ke Tang                Yang Yang

                              First draft: December 2019; current draft: April 2021

                                                        Abstract
We introduce systematic tests exploiting robust statistical and behavioral patterns in trading to detect
fake transactions on 29 cryptocurrency exchanges. Regulated exchanges feature patterns consistently
observed in financial markets and nature; abnormal first-significant-digit distributions, size rounding,
and transaction tail distributions on unregulated exchanges reveal rampant manipulations unlikely
driven by strategy or exchange heterogeneity. We quantify the wash trading on each unregulated
exchange, which averaged over 70% of the reported volume. We further document how these
fabricated volume (trillions of dollars annually) improve exchange ranking, temporarily distort prices,
and relate to exchange characteristics (e.g., age and userbase), market conditions, and regulation.

Keywords: Bitcoin; Cryptocurrency; FinTech; Forensic Finance; Fraud Detection; Regulation
JEL Classification: G18, G23, G29.

  *The authors are especially grateful to Deeksha Gupta, Kose John, Evgeny Lyandres, and Tao Li for repeated discussions and
detailed feedback. We also thank Marlene Amstad, Valeria Ferrar, Angel Hernando-Veciana, Kose John, Andrew Karolyi,
Jiasun Li, Roger Loh, Emmanouil Platanakis, Fahad Saleh, Amin Shams, Rajeev Singhal, Baolian Wang, Shang-jin Wei, Wei
Xiong, Scott Yonker, and seminar and conference participants and reviewers at the Alibaba Group Luohan Academy Webinar,
Australasian Banking and Finance Conference, Behavioral Finance/Corporate Finance/Digital Finance (BF/DF/CF) Seminar
Group, Cornell University, Cowles Foundation for Research In Economics Conference on the Economics of Cryptocurrencies,
11th CSBF Conference (National Taiwan University), 1st Crypto and Blockchain Economics Research Conference; Durham
University Department of Economics and Finance, Econometric Society World Congress (Bocconi University), 2021 Eastern
Finanace Association Annual Meeting, IIF International Research Conference & Award Summit, 13th International Risk
Management Conference, Inaugural Machine Laywering Conference: “Human Sovereignty and Machine Efficiency in the
Law," 18th Paris December Finance Meeting, Paris FinTech and Crypto Webinar, 60th Southwestern Finance Association
Meeting, Sun Yat-sen University, 3rd Toronto FinTech Conference, Tsinghua University PBC School of Finance Seminar, 3rd
UWA Blockchain and Cryptocurrency Conference, 11th Financial Markets and Corporate Governance Conference, Xi’an
Jiaotong University, and the Zhongnan University of Economics and Law for helpful comments. This research was funded in
part by the Ewing Marion Kauffman Foundation and the authors have no affiliation with or research support from any
cryptocurrency exchanges. The contents of this publication are solely the responsibility of the authors. Cong
(will.cong@cornell.edu) is at the Cornell University Samuel Curtis Johnson Graduate School of Management; Li
(xi.li@newcastle.ac.uk) at Newcastle University Business School; Tang (ketang@tsinghua.edu.cn) and Yang
(yangyang_tsu@mail.tsinghua.edu.cn) are at the Institute of Economics, School of Social Sciences, Tsinghua University.

                                                             1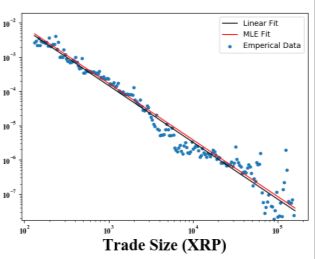
1    Introduction

The market capitalization of all cryptocurrencies exceeded 1.5 trillion USD in Feb 2021 and the total
trading volume is 8.8 trillion USD in the first quarter of 2020 alone (Helms, 2020). Both financial
institutions and retail investors have significant exposure to the cryptocurrency industry (Bogart,
2019; FCA, 2019; Fidelity, 2019; Henry, Huynh, and Nicholls, 2019).1 Meanwhile, crypto exchanges,
arguably the most profitable players in the ecosystem, remain mostly unregulated with less than 1%
transactions taking place on unregulated crypto exchanges in 2019. In the process of vying for
dominance in this lightly regulated market, some exchanges may gain an advantage in ways ethically
and legally questionable (Rodgers (Forbes), 2019; Vigna (WSJ), 2019; BTI, 2019). One salient form of
such market manipulation is Wash trading--- investors simultaneously selling and buying the same
financial assets to create misleading, artificial activity in the marketplace. Wash trading is known to
distort price, volume, and volatility, and reduce investors’ confidence and participation in financial
markets in general (Aggarwal and Wu, 2006; Cumming, Johan, and Li, 2011; Imisiker and Tas, 2018).

Against such a backdrop, we conduct the first academic study of wash trading and misreporting on
cryptocurrency exchanges. By inspecting the distribution of trade size whose first significant digit
should follow Benford’s law, should exhibit clustering at round numbers, and whose tail distribution
is traditionally described by power law (Pareto-Levy law), we find that most unregulated exchanges
wash trade (fabricating trades and acting as the counterparty on both sides to inflate volume).2 We
also estimate that unregulated exchanges on average inflate over 70% of the reported volumes in
our samle. Furthermore, we provide evidence that the misreporting (generically referred to as wash
trading) improves their ranking and prominence within the industry, relates to short-term price
dispersion across exchanges, occurs more on newly established exchanges with smaller userbases,
and has implications for the long-term industrial organization, development, and regulations.

Anecdotal evidence and legal cases concerning specific transactions or exchanges do not scale or
allow us to identify wash trading as a systemic issue for the cryptocurrency market or to derive

1 Surveys reveal that 22% institutional investors have invested in cryptocurrencies (Fidelity, 2019) and by April 2019 9% of
adults have owned Bitcoins in particular (Bogart, 2019). In the UK, 25% consumers could identify “cryptocurrency” and 3%
had bought them (FCA, 2019). Between 2016 and 2018, Bitcoin ownership increased from 3% to 5% (Henry et al., 2019).
2 Wash trading is, according to the U.S. Commodity Exchange Act, “Entering into, or purporting to enter into, transactions

to give the appearance that purchases and sales have been made, without incurring market risk or changing the trader's
market position.” Definition of wash trading from US Commodity Exchange Act can be found at
https://www.cftc.gov/ConsumerProtection/EducationCenter/CFTCGlossary/glossary_wxyz.html
                                                             2
policy recommendations.3 Industry reports are often imprecise, ad hoc, and non-transparent on the
methodology used, not to mention that the findings are driven by individual exchanges. We use
multiple statistical benchmarks and behavioral principles to document, quantify, and analyze, to the
extent feasible, crypto wash trading as an industry-wide phenomenon with surprising economic
magnitudes. Our study not only adds to recent studies on crypto market manipulation (e.g., Li, Shin,
and Wang, 2020), but also is among the earliest to provide suggestive evidence for the efficacy of
regulation in this cryptocurrency industry, which has implications for investor protection and
financial stability. Our findings also likely have consequences for ongoing lawsuits and empirical
research on cryptocurrencies which frequently reference transaction volumes. Finally, they serve as
illustrations of the usefulness of statistical and behavioral principles for forensic finance, with
regulatory implications for FinTech and beyond.
Wash trading on crypto exchanges warrants our attention for several reasons. First, crypto
exchanges play essential roles in the industry (e.g., Amiram, Lyandres, and Rabetti, 2020), providing
liquidity and facilitating price discovery just like traditional exchanges. Many crypto exchanges have
expanded into upstream (e.g., mining) and downstream (e.g., payment) sectors, consequently
wielding great influence as a complex of trading platforms, custodians, banks, and clearinghouses.
Naturally, crypto exchanges constitute an anchoring point for understanding the ecosystem from
academic, industrial, and regulatory perspectives. Second, because liquidity begets liquidity, crypto
exchanges have strong economic incentives to inflate trading volumes to increase brand awareness
and ranks on third party aggregator websites or media (e.g., CoinMarketCap, CoinGecko, Bitcointalk,
and Reddit), which in turn increases the exchanges’ profits from transaction fees. Third, wash trading
is illegal and harmful, and is largely prohibited in most financial markets and developed economies
(IOSCO, 2000). But with limited regulatory oversight, cryptocurrencies are particularly prone to wash
trading that, according to existing literature, likely misguides market participants, hinders price
discovery, and causes bad exchanges to crowd out compliant ones.
We collect cryptocurrency transaction information on 29 major exchanges from the proprietary
database maintained by TokenInsight (www.tokeninsight.com), a data provider who offers
consulting, rating, and research reports for the cryptocurrency-related business. TokenInsight chose
3
For example, Ontario Securities Commission’s recently allegation that Coinsquare's CEO Cole Diamond directed his staff
to wash trade, founder Virgile Rostand designed and implemented the codes, and chief compliance officer Felix Mazer
failed to take steps he should have taken to stop the actions (Sinclair, 2020). As part of the settlement agreement reached
on July 22, 2020, Coinsquare admitted that around 840,000 illicit wash trades were conducted on the platform, amounting
to a total value of around 590,000 bitcoins (BTCs). In general, exchanges rarely fake trades by reporting trades without the
actual orders, since doing so can be easily detected when someone compares the orders with reported transactions.
3the 29 exchanges based on their publicity (rank on third-party websites), representativeness, and
API compatibility, and the coverage includes well-known exchanges such as Binance, Coinbase, and
Huobi, as well as many obscure ones.4 Our data cover the period from 00:00 July 09th, 2019 (when
TokenInsight started to collect transaction information from these exchanges) to 23:59 November
03rd, 2019 (the time we wrote the first draft). Our data also contain variables including aggregate
trading volume, reputation metrics, and exchange characteristics such as exchange age.
We adopt the definition of regulated exchanges from the state of New York, which has one of the
earliest regulatory frameworks in the world.5 For each exchange, we focus on the trading of four
most widely recognized and heavily traded cryptocurrencies against US dollars (USD) — Bitcoin (BTC),
Ethereum (ETH), Litecoin (LTC), and Ripple (XRP). We use web traffic ranking as a proxy for brand
awareness and reputation to further categorize unregulated exchanges for easy reference: “Tier-1”
for exchanges ranking in the top 700 in the finance/investment section of SimilarWeb.com and
“Tier-2” for the rest unregulated exchanges on our data (all ranking outside top 960).
Our first key finding is that wash trading broadly exists on unregulated exchanges but is absent on
regulated exchanges. We are fully aware of the challenges of forensic finance and employ multiple
approaches that are not ad hoc and have been successfully applied in numerous fields in sciences
and social sciences and are shown to be unlikely affected by dispersed traders’ strategies, exchange
characteristics, or specificities of the asset class.
To start, we examine the first significant digit for each transaction and check its frequency
distribution on each exchange against Benford’s law — the well-known statistical benchmark in
natural sciences and social sciences and widely used to detect frauds in macroeconomic, accounting
and engineering fields (e.g., Durtschi, Hillison, and Pacini, 2004; Li, Cong, and Wang, 2004). We next
exploit a classical behavioral regularity in trading: clustering at certain transaction sizes. Round
numbers are routinely used as cognitive reference points in individuals’ decision-making (e.g.,
multiples of 10 as cognitive reference points in the decimal system, Rosch, 1975). Rounding is
4 One is understandably concerned about the potential bias that our data over represent exchanges that wash trade more.
However, the data cover a wide range of ranks (1-300 among crypto exchanges) and as we show later, lower-ranked
exchanges also have high incentives to wash trade. Moreover, TokenInsight does consider representativeness beyond
ranks in choosing the exchanges.
5 Regulated exchanges are issued BitLicenses and are regulated by the New York State Department of Financial Services.
Bitlicence carries some of the most stringent requirements. Our main results are robust to alternative classifications of
regulated exchanges. As of June 2020, NYDFS has issued licenses to 25 regulated entities, six of which provide crypto
exchange service. They are Itbit, Coinbase, Bitstamp, Bitflyer, Gemini, and Bakkt (futures and options only). Further
information can be found at: https://www.dfs.ny.gov/apps_and_licensing/virtual_currency_businesses/regulated_entities.
(Last accessed: July 3, 2020)
4commonly observed in finance (Chen, 2018; Kandel, Sarig, and Wohl, 2001; Kuo, Lin, and Zhao, 2015;
Mitchell, 2001), including analysts’ forecasts (Clarkson, Nekrasov, Simon, and Tutticci, 2015; Roger,
Roger, and Schatt, 2018) or LIBOR submissions (Hernando-Veciana and Tröge, 2020). Most
cryptocurrencies are traded at some base units of mental accounts, we thus expect that trades
concentrate around multiples of 100, 500, 1000, 5000 and 10000 base units---a natural clustering
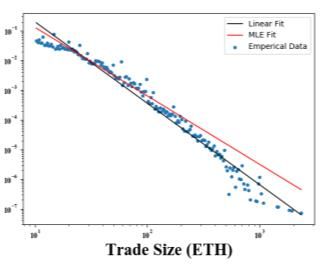
effect at round sizes. Our third test explores whether the distributions of observed trade size have
fat tails characterized by the power law as seen in traditional financial markets and other economic
settings (e.g., Gabaix, Gopikrishnan, Plerou, and Stanley, 2003a). We fit a power-law distribution and
estimate the exponent parameters in addition to graphically inspecting the tail distributions on a log-
log scale. We consistently find anomalous trading patterns only on unregulated exchanges, with Tier-
1 exchanges failing more than 20% of the tests and Tier-2 exchanges failing more than 60%. The
findings remain robust when under joint hypothesis tests.
Besides identifying exchanges that wash trade, we quantify the fractions of fake by taking
advantage of the rounding regularity. To achieve scale without being easily detected, exchanges
conducting wash trading routinely use machine-generated fake orders and limit the order size (e.g.,
Vigna and Osipovich, 2018; Rodgers, 2019). Therefore, wash trades primarily generated by
automated programs are likely to have low levels of roundness, i.e., a larger effective number of
decimals for trades. It is possible that authentic trades are unrounded due to algorithmic trading or
other transaction needs. We thus adopt a benchmark ratio (based on calculations from the
regulated exchanges) of unrounded trades to authentic trades with round sizes. The extra
unrounded trades above the ratio naturally constitute wash trades on unregulated exchanges.
We find that the wash trading volume on average is as high as 77.5% of the total trading volume on
the unregulated exchanges, with a median of 79.1%. In particular, wash trades on the twelve Tier-2
exchanges are estimated to be more than 80% of the total trade volume which is still over 70% after
accounting for observable exchange heterogeneity. These estimates, combined with the reported
volumes in Helms (2020), translate into wash trading of over 4.5 Trillion USD in spot markets and
over 1.5 Trillion USD in derivatives markets in the first quarter of 2020 alone. To mitigate the
influence of heterogeneity of traders and algorithmic trading strategies across various exchanges,
we validate the roundness-ratio estimation and conduct a number of robustness tests to guard allay
selection concerns.
5We then study exchange characteristics that correlate with wash trading and investigate the impact
of wash trading on market outcomes such as exchange ranking. In addition, we obtain proprietary
data on historical ranking and trading volume information from CoinMarketCap and show that
exchange ranking depends on wash trading (70% wash trading of total reported volume moves an
exchange’s rank up by 46 positions). We find that an exchange’s wash trading is positively correlated
with its cryptocurrency prices over the short term. We also find that exchanges with longer
establishment history and larger userbase wash trade less. Less prominent exchanges, in contrast,
have short-term incentives for wash trading without drawing too much attention. Moreover, wash
trading is positively predicted by returns and negatively by price volatility.
While current business incentives and ranking systems fuel the rampant wash trading on
unregulated exchanges, the regulated exchanges, having committed considerable resources towards
compliance and license acquisition and facing severe punishments for market manipulation (Perez,
2015), do little wash trading. Our systematic demonstration of the direct or screening effects of
regulation in the cryptocurrency markets has implications for investor protection and financial
stability. We offer a concrete set of tools for exchange regulation and third-party supervision in the
crypto market for convincingly exposing wash trading and potentially combating non-compliant
exchanges. Admittedly, the tests we introduce are not exhaustive and wash traders may adjust their
strategies in response to these tests. They nevertheless serve as valid detections of wash trading
historically and thus make fabrications more difficult and facilitate regulatory resource allocation.
Literature — We contribute to recent studies on cryptocurrencies in several ways.6 Our paper
provides the first academic study of crypto wash trading as an industry-wide phenomenon. Existing
media evidence is anecdotal and speculative while industry reports use methods that are not
transparent or robust, do not typically distinguish regulated from unregulated exchanges, not to
mention that the estimates are often on small sample, imprecise, and ad hoc.7 We use rigorous
statistical tools and intuitive behavioral benchmarks to establish the existence of wash trading on
unregulated exchanges and for various cryptocurrencies.8 Our paper is most closely related to
6 Cong, Li, and Wang (2019, 2020), Lyandres, Palazzo, and Rabetti (2020), Howell, Niessner, and Yermack (2020), and Cong
and Xiao (2020) provide further institutional background on cryptocurrencies and ICOs; a number of articles discuss the
role of crypto-tokens in fundraising and commitment (e.g., Goldstein, Gupta, and Sverchkov, 2020); studies such as Liu and
Tsyvinski (2018) and Shams (2020) document empirical patterns in cryptocurrency returns.
7 Among the earliest wistle-blowers, Bitwise Asset Management presented an industry report to the SEC on March 20,
2019, suggesting potential wash trading on crypto exchanges (Fusaro and Hougan, 2019).
8 When crypto exchanges fake transaction by acting as counterparties on both sides, one can identify specific transactions
as being wash trades by tracing the transaction ID, as is done in some industry reports or using leaked data from individual
exchanges (e.g., Aloosh and Li, 2021, a subsequent study to ours, verify our detection methodology using data leaked from
Mt. Gox and directly show traders clear their own order books); crypto exchanges occasionally incentivize users to wash
6Amiram, Lyandres, and Rabetti (2021), which builds on our work to offer additional detection tools
for wash trading, provide lower bounds using more recent data, and analyze how exchange
competition interacts with exchange operations. Another recent study, Le Pennec, Fiedler, and Ante
(2021), also adds alternative detection tools utilizing, for example, web traffic or wallet data.
Most of the academic literature on wash trading in traditional markets focuses on investor behavior
(e.g., Grinblatt and Keloharju, 2004). We add to that literature by investigating wash trading at the
exchange level with evidence from the new crypto markets. Complementing our study, Gandal et al.
(2018) and Aloosh and Li (2021) provide evidence of manipulation by individual traders at the now-
closed Mt. Gox exchange. More broadly, our study belongs to the literature on manipulation and
misreporting in finance.9 Concerning cryptocurrency markets, Foley, Karlsen, and Putninš (2019)
study the illegal usage of cryptocurrencies; Gandal, Hamrick, Moore, and Oberman (2018) and Griffin
and Shams (2020) discuss manipulative behavior in Bitcoin and Tether; Li, Shin, and Wang (2020),
among others, document pump-and-dump patterns in various cryptocurrencies; Makarov and
Schoar (2020) examine large and recurrent arbitrage spreads across crypto exchanges; most recently,
Choi and Jarrow (2020) discuss crypto bubbles caused by speculation or manipulation. These studies
do not examine wash trading, which our unique and comprehensive data set allows us to do using
robust yet straightforward procedures.
Our study is among the earliest studies on the potential effects of regulation in the cryptocurrency
markets, filling in a void in the literature and offering new insights on cryptocurrency regulation. We
further speak to the debates on market concentration, collusion, and regulation in the blockchain
industry (e.g., Cong and He, 2019; Cong, He, and Li, 2020; Alsabah and Capponi, 2020; Rasu and
Saleh, 2020; Lehar and Parlour, 2020; Amiram et al., 2020) by highlighting another detriment of
vertical-concentration of the operation scope of crypto exchanges. Related, Irresberg, John, and
Saleh (2020) document that only a few blockchains dominate the public blockchain ecosystem.
In terms of methodology, we enrich the use and demonstrate the efficacy of statistical laws and
behavioral principles for manipulation detection at scale in accounting and finance, which is
becoming more important post the COVID-19 pandemic. In particular, we are the first to apply
Benford’s law, trade-size clustering, and power law in FinTech and cryptocurrency studies. Our use
trade as well, as seen in FCoin’s transaction fee mining scheme. Our data’s advantages lie in the quantity and statistical
power that allow us to analyze systematic wash trading.
9 Our paper therefore adds to forensic finance and accounting—the use of economic and financial knowledge to discover or
substantiate evidence of criminal wrongdoing that meets standards in a court of law (e.g., Allen and Gale, 1992; Jarrow,
1992; Christie and Schultz, 1994; Ritter, 2008; Zitzewitz 2012).
7of Pareto-Levy distribution (instead of Zipf’s law, as seen in Mao, Li, and Fu, 2015 and Prandl et al.,
2017) for fraud detection is also novel in social sciences. Finally, our findings imply that researchers
and econometricians using reported volumes by exchanges also need to heed the presence of heavy
wash trading and test the robustness of their conclusions.
The paper proceeds as follows. Section 2 introduces the development and regulatory status of
cryptocurrency exchanges. Section 3 describes our data and summary statistics. Section 4 presents
the methodologies of wash-trading detection and reports our empirical findings. Section 5 quantifies
wash trading and presents an array of tests to validate the methodology and demonstrate the
robustness of results. Section 6 relates wash trading to exchange characteristics, cryptocurrency
returns, and exchange ranking, before discussing its implications for regulation and industry practice.
Section 7 concludes. Online appendices contain supplementary evidence and discussion and are
available at https://sites.google.com/site/linwilliamcong/CWTOA.pdf.
2 Institutional Background of Crypto Exchanges: Development and Regulation
We provide in this section the institutional background of crypto exchanges. Readers familiar with
the cryptocurrency industry may skip reading.
Satoshi Nakamoto introduced Bitcoin in October 2008 and launched it three months later with one
headline in the Times on January 3, 2009, “Chancellor on brink of second bailout for banks,”
embedded in the genesis block. Because Bitcoin is open-source, other “altcoins” (alternative to
Bitcoin) quickly emerged to imitate or improve upon the first few cryptocurrencies. For example,
Ethereum, EOS, and Tron were developed as public platforms for smart contracts and decentralized
applications, with native cryptocurrencies on their own blockchains.10 As we write, over 8000
cryptocurrencies have been launched and circulated globally. The total market capitalization of all
cryptocurrencies just pasted $1 trillion in January 2021. Bitcoin alone once reached nearly $760
billion, larger than Visa ($452 billion on Jan 31, 2021) or Facebook ($736 billion on Jan 31, 2021).
The increasingly sophisticated crypto ecosystem is comprised of mining, payment companies, wallets,
DApp (decentralized application), and crypto exchanges (Hileman and Rauchs, 2017), with increasing
10
Monero, Zcash, and Dash were created to address Bitcoin’s privacy limitations and shortcomings. Other cryptocurrencies
focused on applications content creation and copyright (Steem, Ink), on social/communication (KEY, SNT), on the internet
of things (IOTA, QTUM) and computation power/cloud storage (SC, FCT), among many others.
8awareness and adoption among financial institutions and retail investors. Crypto exchanges —
centralized gateways that facilitate money flow between fiat currency and (decentralized)
cryptocurrency systems — play a critical and dominant role in the industry (Griffin and Shams, 2020).
To date, over 300 exchanges provide cryptocurrency services around the globe, often with leverage
facilities and derivatives on cryptocurrencies. Incumbents exit and new competitors keep emerging
under loose regulatory standards. Because exchanges offer similar products and services, the
competition is even fiercer than that in traditional markets.11
Currently, the total cryptocurrency trading volume on exchanges (likely in large part speculation
activities) is much higher than the on-chain transaction volume (likely actual usage). With
considerable traffic, exchanges usually hold a large number of various cryptocurrencies because of
liquidity demand and custody for customers. Moreover, Initial Exchange Offerings (IEOs) have often
substituted Initial Coin Offerings (ICOs) since 2019, in which an exchange may work with a start-up
issuing cryptocurrencies or tokens.12 As a result, they wield enormous power in the industry. This is
somewhat ironic, given the initial ideals of decentralized trust and financial democratization.
Unregulated exchanges are not required to report trading records to any authority. However, due to
business needs and peer competition, exchanges tend to be more transparent. For example,
algorithmic trading needs high frequency market data, which implies that exchanges need to feed
data to traders through API portals. At the same time, market ranking website and data aggregators
such as the CoinMarketCap Data Accountability & Transparency Alliance are pushing exchanges for
more transparency, accountability, and disclosure from projects.
In the early days, regulators deemed the cryptocurrency industry small and unimportant. It was
widely believed that all crypto exchanges had, to some extent, engaged in non-compliant and
unethical behavior (Gandal et al., 2018; Moore and Christin, 2013; Moore et al., 2018). Exchanges
usually hold substantial funds from users’ accounts (both in fiat and cryptocurrencies) without
proper custody and insurance, which raises severe concerns. Moore and Christin (2013) and Moore
11
Unlike established brands with user stickiness and network effect (Halaburda and Gandal, 2016; Cong, Miao, Tang, and
Xie, 2019), newcomers (with little reputation) are more tempted to pursue high rankings that might be achieved via wash
trading. Top ranked exchanges are thus not necessarily reputable and secure and investors who are misled to them could
face substantial risks. For example, FCoin, which become insolvent in February 2020, previously ranked 56 th on
CoinMarketCap. However, Gemini, a crypto exchanged certified and regulated by the New York State Department of
Finance, is listed 124th on the second page of CoinMarketCap.
https://coinmarketcap.com/rankings/exchanges/reported/2/ (Last accessed December 29, 2019)
12
Security Token Offerings (STOs) in which token issuance is treated as a regular security issuance were hyped to be the
new norm, but are limited by the heavy regulation. Initial DEX Offerings (IDOs, in which DEX stands for decentralized
exchanges) have received attention since 2019 but are in limited scale and are not our focus.
9et al. (2018) examine the failure of Bitcoin exchanges from 2010 to 2015 due to security breaches
(including dominant exchanges such as Mt. Gox). Most often, implied counterparty risk manifests in
the form of notorious ‘runaway bosses’ incidents or exit scams (malicious closure of exchanges and
stealing users’ funds). For example, the once largest transaction-mining exchange FCoin suddenly
claimed insolvent with $130 million client’s funds missing (Zhao, 2020).13 Some exchanges get into
legal quagmires through Ponzi schemes and scams. Xcoinx operated by the startup Onecoin is an
example. Others include Coinroom (Alexandre, 2019), Cobinhood (Palmer, 2020), OKUEX, and Soxex.
The list goes on.
Profit-driven exchanges may also take advantage of the information asymmetry or even directly act
against users’ interests through various market manipulation measures. In an unregulated
environment, an unethical cryptocurrency exchange can be “both a referee and a player” at the
same time. Gandal et al. (2018) investigate the manipulative trading in Mt. Gox, a Bitcoin exchange,
over the period from February to November 2013, and find that a suspicious trader called “Markus,”
most likely an exchange owned account, participated in manipulative trading. Our paper also shows
that many exchanges have engaged in wash trading, likely aiming to improve their ranking or to
attract more customers.
How do exchanges wash trade? The most primitive and rough approach is to simply print trading
records (which do not really happen) in the trading history data. This approach was easily
discovered by customers and observers to monitor live trade books from exchanges’ websites. Even
if exchanges put fake orders into order book and later fill these orders themselves, such a practice is
limited to approved accounts (exchange owned) can fill these orders. This approach can be detected
based on the mismatching between order book depth and trade spread. For example, some
industrial reports utilise the relationship between exchange trading volume and liquidity (spread) for
detecting wash trading. A more technically involved way of wash trading is to deploy algorithm
trading robot to create real orders and execute wash trades on diverse accounts. Exchanges can
deploy wash-only robots or insert wash trades into their market making robots every now and then.
13
Transaction-mining is when an exchange provides incentives to users, usually in the format of exchange issued token.
There are debates on transaction mining, ethically and financially. It is an original scheme from cryptocurrency exchanges
that combines token distribution, dividend distribution and user incentives. It can help newly established exchanges to
bootstrap the operation and obtain clients fast. However, without proper regulation, it inevitably lead to wash trading.
Some transaction mining exchanges deliberately make the reward override trading fees. As a result, a large portion of users
trade for the sole purpose of getting transaction mining ward. The most famous transaction mining exchange Fcoin get
$5.6 billion daily trading volume in less than a month from its establish, that is more than the sum of the rest top-10
platforms on CoinMarketCap. (https://www.coindesk.com/new-crypto-exchange-draws-fire-over-controversial-business-
model)
10However, this approach entails the risk of loss if the positions are not closed in time. Finally, as
mentioned earlier, some exchanges provide incentives for their users to (wash) trade by various fee
rebate or transaction-mining programs. A combination of the above actions make it extremely hard
to detect specific wash trades with transaction history alone.
The general lack of consumer protection in the cryptocurrency industry aggravates the situation.
Consumers’ legitimate rights and interests heavily rely on exchanges’ self-discipline and good faith. If
user interests are undermined in incidents such as hacking or bankruptcy, victims get little
compensation from either exchanges or third-party insurance companies.
As such, risks in the cryptocurrency exchange ecosystem have drawn significant attention from
regulatory authorities in recent years. Regulators in multiple jurisdictions have published statements
to warn the public about the risks (Yu, 2018), and have built internal divisions and created new
institutions to closely monitor the development of the cryptocurrency industry (Brett, 2019).
Authorities (e.g., Bank of Canada, UK Financial Conduct Authority, New York Federal Reserve Bank)
have conducted surveys to investigate the awareness and adoption of cryptocurrency among retail
and institutional investors. In a July 2018 report to the G20, Mark Carney, the chair of the Financial
Stability Board and the head of the Bank of England, warned that illegal manipulations in equity
markets are rampant in crypto: wash trading, pump and dumps, and spoofing by traders (mostly
bots) are particularly detrimental to financial stability and robustness to crises and recessions
(Rodgers, 2019). Since 2017, official cryptocurrency documentation and guidelines have been
released by regulatory agencies in around 20 countries and territories, including the United States,
European Union, United Kingdom, China, Japan, etc. (Blandin et al., 2019).
Wash trading could be a major challenge for regulators because of the unique features of the
cryptocurrency industry render traditional attempts futile and ineffective. 14 For one, regulatory
frameworks are different across countries without a consensus on the correct approach. The
intention and infrastructure for sharing information and collaborative effort are also lacking among
regulators in different countries.
Industry leaders also took action to fight the wash trading problem. CoinMarketCap, for example,
introduced a mandatory API program for all listed exchanges to improve credibility and transparency
14
The United States banned wash trading in the Commodity Exchange Act (CEA) 1936, and the European Union listed it in
the Market Abuse Directive No 2003/6/EC, etc. Therefore, financial services that are operating under the traditional
regulatory framework are naturally prohibited from wash trading.
11(CMC, 2019a). They later developed another rank algorithm based on exchanges’ liquidity instead of
volume (CMC, 2019b). CryptoCompare, a British cryptocurrency data analysis firm, launched a
unique exchange benchmark product that would help safeguard against false exchange volume
reports (Tsavliris, 2019). Nomics, a data provider, developed Transparency Volume based on their
ranking criteria, claiming it is less likely to include wash trading volume (Nomics, 2019). Nonetheless,
the industry is in dire need of effective regulatory tools and a well-integrated regulatory framework.
3 Data and Summary Statistics
Our data come from multiple sources. Cryptocurrency transactions are from TokenInsight, which
provides ratings and industry reports as an independent third-party. Each transaction is fetched
through the exchange’s official API (Application Programming Interface) and contains the exchange
information, unique transaction ID, timestamp, price, amount of cryptocurrency traded, and trade
pair symbol.15 Our data cover the reported trade history of 29 major exchanges which include all
available cryptocurrency trades over the three months from 00:00:00 July 09th to 23:59:59
November 03rd, 2019. We then limit the sample to trades of four major cryptocurrencies, Bitcoin
(BTC), Ether (ETH), Ripple (XRP), and Litecoin (LTC), representing over 60% of the volume and are
available on almost all exchanges. The final sample contains 448,475,535 transactions.
Exchange-related data are collected from both their official websites and various data tracking and
analysis platforms. We gather data on exchange ranking, web traffic, etc., from SimilarWeb, Alexa,
and CoinMarketCap.16
The 29 crypto exchanges in our sample are classified as either regulated or unregulated. The
regulation entity of New York State, the New York State Department of Financial Services (NYSDFS),
was one of the first agencies to establish regulation over cryptocurrencies and led the world in
15 Since US dollars (USD) are only allowed to exchange in three US regulated exchanges (R1, R2 and R3), digital dollars (e.g.
Tether-symbol USDT, which is designed to be pegged to the US dollar) are commonly used as substitutes and widely
accepted by the majority of trading platforms, we treat cryptocurrency-USD pairs and cryptocurrency-USDT pairs as being
the same.
16 SimilarWeb and Alexa are online platforms that track and analyze website popularity and provide quarterly rankings by
web traffic CoinMarketCap is arguably the most dominant data aggregator and provider in the industry, from which we
obtain data on exchange trading volumes and ranks of about 300 exchanges mostly based on daily transaction volumes
during the sample period.SimilarWeb ranking is based on a report over the period from Aug 2019 to Oct 2019
https://www.similarweb.com/; Alexa historical ranking is accessed through https://www.alexa.com/siteinfo on November
15, 2019 and CoinMarketCap ranking is from proprietary data from https://coinmarketcap.com/.
12developing the regulatory framework for the cryptocurrency industry.17 Hence, we categorize the
three exchanges (labeled as R1, R2, and R3) with BitLicense issued by NYSDFS as regulated
exchanges because all three operate under the supervision of NYSDFS.18 BitLicense requires an
exchange to build a sophisticated compliance system, an anti-money laundering program, a capital
control and custodian system, a record-keeping and customer identity system, an information
security team, and a disaster recovery system, as well as to submit necessary documents for routine
checks, which cost between 20k to 100k US dollars even for compliant exchanges (Perez, 2015).
The other 26 non-compliant exchanges are classified as unregulated and are further divided into 10
Tier-1 unregulated (labeled as UT1, UT2... UT10) and 16 Tier-2 unregulated exchanges (labeled as U1,
U2... U16) based on their web traffic. Web traffic measures reflect an exchange’s userbase and
reputation and play essential roles regarding customer acquisition and competition. Specifically,
Tier-1 unregulated exchanges are the ones in the top 700 of the “SimilarWeb” website traffic ranking
of the investment category during the sample period. 19
Japanese Financial Services Agency (FSA) similarly regulates cryptocurrency exchanges. Subsidiaries
of UT5 (Huobi) and UT8 (Okex) are licensed in Japan. From January 10, 2020, crypto exchanges
operating in the UK are also required to register with the Financial Conduct Authority (FCA) for anti-
money laundering and counter-terrorist financing (AML/CTF) supervisor. In our sample, R2, R3, and
UT1 (Binance) have registered with the UK FCA (by September 2020 reference:
https://register.fca.org.uk/s/). Our main findings are robust to using these alternative definitions of
regulation. For example, UT1, UT5, and UT8 behave in a way more like the regulated exchanges in
17 There is no regulatory framework at the federal level in the United States. Each state is regulating/treating
cryptocurrency businesses differently. There are some general requirements based on traditional financial regulations such
as compliance AML, KYC, foreign exchange service, money transmitter license, etc. But NY is the only one to introduce this
crypto specific license, which is mandatory for exchanges operating in the state and is valid in all other states. Besides, NY
is very important in the finance industry because it has always been an important financial hub. Several other countries are
actively engaged with crypto businesses, although they have no specific regulations or laws designed for crypto exchanges.
For example, Singaporean authority attempts to integrate crypto exchanges into the existing systems by requiring crypto
exchanges to comply with the new Payment Services Act (PSA). See Monetary Authority Singapore
(www.mas.gov.sg/regulation/payments/entities-that-have-notified-mas-pursuant-to-the-ps-esp-r). The Swiss government
is actively drafting an Amendment to include Distributed Ledger Technology (a synonym of blockchain technology) into
existing Federal Acts (www.finma.ch/en/authorisation/fintech/).
18 The appendix contains the corresponding names of the exchanges.
19 The remainder of the unregulated exchanges in our sample all ranked lower than 960. SimilarWeb and Alexa are the two
ranking websites based on web traffic. This distinction of tiers does not affect any of our results since they are mostly at
the exchange level. The reference to the two tiers simply reflects the differential publicity of the unregulated exchanges
and how it correlates with wash trading.
13our baseline definition, than to the average unregulated ones, with only one or two failed tests and
compliance with Benford’s law for all trading pairs.20
[Insert Table 1]
Table 1 summarizes the characteristics of exchanges including age, trading volume, and ranks from
different metrics. Note that age for exchanges refers to the period from their dates of
establishments to July 2019. In Table 1, all the regulated exchanges have survived for at least five
years to date. However, most of the unregulated Tier-2 exchanges were launched in 2017 and 2018,
while Tier-1 exchanges are generally older. The patterns hint that exchanges benefit from the long-
term operation.
Trade volume shows little correlation with our classification of exchanges: Some unregulated
exchanges have much larger trading volumes compared with regulated exchanges. For example, U4,
an unregulated Tier-2 exchange, has a 50,944 million USD volume while R2’s volume is only 15,212
million USD. The trading volume of different unregulated exchanges varies significantly. U9 has only
dozens of millions, while a large fraction of unregulated exchanges exceeds tens of billions in the
sample.
We find regulated exchanges, especially R1 and R3, fall behind many unregulated Tier-1 exchanges
in their ranking based on web traffic. R2 has the highest trading volume among regulated exchanges
and a better rank under both ranking algorithms. In terms of CoinMarketCap’s ranks based on
trading volumes, seven unregulated Tier-2 exchanges rank Top 20 and outperform the majority of
unregulated Tier-1 and regulated exchanges. Although trading-volume ranks cannot fully represent
the quality and liquidity of exchanges, it is used by most ranking agencies. Thus, cryptocurrency
investors are likely to choose an exchange based on these trading-volume based ranks. One would
anticipate that unregulated exchanges, especially ones that are launched later, are motivated to
engage in wash trading in order to achieve higher rankings and acquire more customers.
Finally, to relate wash trading and crypto exchange ranking, we also acquire proprietary, high-
frequency data on exchange ranks and reported trading volumes from coinmarketcap.com. The
platform started its business by providing crypto market capitalizations, pricing, and other
20 That said, their trade-size roundness differs from the regulated exchanges in our baseline categorization. While they are
still distinct from most other unregulated exchanges, they do have an estimate of more than 50% of the volume on average
being wash trades. This could be reflections of the more stringent regulatory standard of NY Bitlicence, but could also be
attributed to the fact that UT5 and UT8 only have subsidiaries regulated in Japan and FCA did not mandate the regulation
of UT1 during our sample period.
14information on all kinds of cryptocurrencies. Growing together with the industry, the company has
become a top data provider and ranking agency in the industry. As of June 12, 2020, it serves 4.2
million unique visitors around the globe with 32.6 million visits per month (SimilarWeb.com),
dominating its kind with a valuation in the Binance acquisition proposal (not publicly disclosed) in
March 2020 believed to be 400 million USD (Bambrough, 2020). Currently, this “Crypto Standard and
Poor’s” declares itself as accurate and neutral. However, given their influence and vital function,
these third-party rating agencies are likely to face more regulation just like credit rating agencies in
traditional financial markets.
4 Empirical Evidence of Wash Trading
We present empirical evidence of crypto wash trading entailing four major trading pairs (BTC/USD,
ETH/USD, LTC/USD, and XRP/USD).21 Specifically, we examine the properties of trade sizes on each
exchange and test them against three well-established statistical and behavioral benchmarks. The
multitude of statistical tests when reporting at the exchange level demonstrates the presence of
wash trading on unregulated exchanges in a robust manner. Because they are based on fundamental
behavioral and statistical principles, they are the least prone to the influence of heterogeneous (but
authentic) trading specific to individual traders and exchanges, which we further control for when
quantifying the extent of wash trading in the next section.
4.1 Distribution of First Significant Digits
We investigate whether the first-significant-digit distribution of transactions (denominated in the
cryptocurrencies in question) on each exchange conforms to the pattern implied by Benford’s law.
Inconsistency with Benford’s law suggests potential manipulations.
4.1.1 Benford’s Law
Benford’s law describes the distribution of first significant digits in various naturally generated data
sets and derives from the intuition that many systems follow multiplicative processes (e.g., Li, Cong,
and Wang, 2004). 22 According to Benford (1938):
21 Our choice of trading pairs is motivated by brevity and dominance. LTC/USD data is not available in unregulated
exchange UT7, U1, U6, and U9. XRP/USD data is not available in regulated exchange R3 and unregulated exchanges U1 and
U6. Trading pairs involving other cryptocurrencies exhibit similar patterns.
22
Benford’s law, also known as Newcomb–Benford law, was first proposed by the American astronomer Simon Newcomb
in 1881 after observing the degree of abrasion in different parts of books in a library. Though initially unnoticed, the
15, . (1)
The probability of 1 being the first significant digit is 30.10%. Digits 2 and 3 have probabilities of
17.60% and 12.50%, respectively. The probabilities of the rest (9.7%, 7.9%, 6.7%, 5.8%, 5.1%, and
4.6%, respectively) being the first significant digits decrease as the digit increases.
Naturally, Benford’s law holds in data sets randomly and independently generated from one
distribution or mixed random sampling from various distributions. Apart from natural or sequential
data (e.g., mobile numbers), deterministic samples with exponential growth or decay also follow
Benford’s law or its variants when numbers are expressed in different bases. Benford’s law has been
effectively applied to test the reliability of data and detect manipulation or anomalous patterns in a
wide array of data sets.23
4.1.2 Detecting Violations of Benford’s Law
We check whether the leading digits of trade sizes follow Benford’s law (as shown in Equation 1) on
the 29 exchanges. Figure 1 illustrates the first-significant-digit distribution for four cryptocurrencies
with one regulated exchange and four unregulated exchanges. The five exchanges are the ones that
fail the most tests in their categories and are consistently chosen throughout the paper for concise
illustration. The distributions for the rest of exchanges exhibit similar patterns and are shown in
Online Appendix A. Bars show the fraction of transactions in which the trade size has integer i as the
first-significant-digit. Dots represent the frequency distribution implied by Benford’s law.
[Insert Figure 1]
For R2, 32.75% of BTC trades and 32.73% of ETH trades have “1” as the leading digit, consistent with
the benchmark frequency of 30.10% in Benford’s law. Unregulated exchanges such as U8 and U9
clearly violate Benford’s law with some first significant digits occupying a disproportionally large
fraction. In general, first-significant-digit distributions of all regulated exchanges comply with
proposed law was rediscovered and elaborated in detail by the American physicist Frank Benford (1938). It is applicable in
trading (and has been empirically verified in various asset markets) because reinvesting excess returns and reducing budget
after losses makes the budget process a multiplicative process.
23 Prior literature provides statistical evidence for Benford’s law (e.g., Hill, 1995, 1998; Pinkham, 1961). Li, Cong, and Wang
(2004) provide an overview. Sambridge, Tkalčić, and Jackson (2010) find that Benford’s law holds for 15 sets of modern
observations drawn from the fields of physics, astronomy, geophysics, chemistry, engineering, and mathematics. In
economics, Benford’s law is introduced for fraud detection in tax payments, accounting, macroeconomics, hospitality
management, international trade, and finance (Durtschi et al., 2004; Nigrini, 1996; Günnel and Tödter, 2009; Gonzalez-
Garcia, 2009; Liu and Moulton, 2018; Liu, Sheng, and Wang (2020); Chakrabarty et al., 2020). To see why Benford’s law
intuitively applies to trading, imagine a portfolio manager trading cryptocurrencies only, with all returns reinvested. Then
the size of the portfolio and thus the transactions roughly follow a stochastic multiplicative process. For example, one
might be trading 15-19 bitcoins initially, but as the crypto wealth grows, the transactions could become 20+ or 30+ bitcoins.
If the portfolio incur losses, the transactions might go down to 10-14 bitcoins. Benford’s law would capture this pattern of
having first significant digits being 1 more frequently than being other digits.
16Benford’s law regardless of the type of cryptocurrency. For unregulated exchanges, including Tier-1
and Tier-2, half of them exhibit apparent discrepancies with Benford’s Law in at least one type of
cryptocurrency. Disconformity with Benford’s Law is observed on nine unregulated Tier-2 exchanges,
among which seven violate the law in at least two cryptocurrencies.
[Insert Table 2]
We employ the Pearson’s Chi-squared test to quantitatively assess whether first-significant-digit
distributions conform with Benford’s law (see Table 2). Trades of regulated exchanges follow
Benford’s law, so do those on most of the unregulated Tier-1 exchanges. However, patterns for UT3
are inconsistent with Benford’s law in BTC and XRP trades, with a significance level of 1%. Moreover,
five Tier-2 exchanges (U5, U7, U8, U9, and U14) have significant divergence from Benford’s law in
most cryptocurrencies. Other unregulated exchanges show sizable differences in several
cryptocurrencies. For example, UT7 violates Benford’s law in BTC at a 5% level; U2 and U10 fail in
BTC and XRP at a 1% confidence level, respectively; U2 and U3 fail at a 5% confidence level in ETH.
Overall, all regulated exchanges show consistency with Benford’s law; 20% of unregulated Tier-1
exchanges violate Benford’s law in at least one cryptocurrency, at a 5% significance level; 50% of
Tier-2 exchanges fail to follow Benford’s law in at least one cryptocurrency.
4.2 Trade Size Clustering
As a second test, we investigate whether the trades on crypto exchanges also feature clustering—
traders’ tendencies to use round trade sizes and round prices—, the classical behavioral regularity
commonly observed in financial markets.24 Clustering occurs because authentic traders tend to use
round numbers as cognitive reference points (Rosch, 1975) to simplify and save effort in the
decision-making and evaluation process (Ikenberry and Weston, 2008; Kuo et al., 2015; Lacetera,
Pope, and Sydnor, 2012). Therefore, the cognitive reference of round numbers sets authentic trades
apart from robot trades (Mahmoodzadeh and Gençay, 2017; O’Hara, Yao, and Ye, 2014). Because
wash traders use machine-based automated trading programs to save manpower, especially when
24 Forinstance, Alexander and Peterson (2007) show that in the New York Stock Exchange (NYSE) and Nasdaq, higher
proportions of trades occur at round sizes that are multiples of 500, 1000 or 5000 shares compared to other sizes. Verousis
and ap Gwilym (2013) find trade size clusters at multiples of 500 shares on the London Stock Exchange. Mahmoodzadeh
and Gençay (2017) document the human’s preference for round prices after exchanges change their decimal price systems.
Clustering is also observed in foreign exchanges (Moulton, 2005), derivative markets (ap Gwilym and Meng, 2010), and the
U.S. equity market (Ikenberry and Weston, 2008).
17fake orders feature small trade sizes but large total amounts (Vigna and Osipovich, 2018; Rodgers,
2019), wash trading naturally reduces the proportion of authentic volume, and thus clustering.
Because most cryptocurrencies can be traded in fractions, and some currencies have larger unit
values (especially BTC), we set in the remainder of the paper the smallest unit (base unit) to be one
unit in a certain decimal place valued in the neighborhood of one US dollar. For instance, with the
price of Bitcoin varying around $8000-$10000 in our sample period, most BTC-USD orders are below
1 BTC. Therefore, round numbers in traditional financial markets such as 100, 1000, or 10000 are too
big for individual traders. Because the value of 10-4 BTC is in the order of magnitude of one US Dollar,
it is natural to consider 10-4 BTC as the base unit in this study. Similarly, the base units of ETH, LTC,
and XRP are 0.001 ETH, 0.01 LTC, and 1 XRP, respectively. We now examine whether trade-size
clustering appears at multiples of 100 base units for each cryptocurrency.25
4.2.1 Histograms of Trade Size
Figure 2 depicts trade size distributions of representative exchanges in two observation ranges for
BTC, ETH, LTC, and XRP, highlighting the clustering effect at the round sizes.26 Online Appendix B
displays the histograms of the remaining exchanges. Panel R, Panel UT and Panel U depict the trade-
size distribution for regulated exchanges, unregulated Tier-1 exchanges, and unregulated Tier-2
exchanges, respectively. Note that the Y-axis represents the probability that transactions fall into
each interval, shown on a log scale.
[Insert Figure 2]
Firstly, three regulated exchanges (R2 in Figure 2; R1 and R3 in Online Appendix B) display a
downward sloping curve with prominent peaks at multiples of 5000 base units in the range of 0-10
BTC (e.g., 0.5 BTC, 1 BTC, 1.5BTC, 2BTC, etc.). Similar patterns also appear in distributions of ETH, LTC,
and XRP. The findings suggest the presence of trade size clustering on regulated crypto exchanges.
This finding is consistent with the trade pattern in regulated financial markets, which display a
downward trend because large orders are less frequently placed and executed, as well as a trade
25 We focus on clustering in terms of round numbers in the number of tokens instead of dollar amounts because our data
contains the number of tokens traded and its product with token price is typically not equal to the actual dollar amount
traders use in their orders due to exchange fees. For a few exchanges that we can obtain the time series of fees, we find
our results to be robust to the alternative specification using dollar amounts.
26 The observation ranges include 0-1 BTC, 0-10 BTC, 0-10 ETH, 0-100 ETH, 0-100 LTC, 0-1000 LTC, 0-10000 XPR, and 0-
100000 XPR.
18size clustering effect (e.g., Alexander and Peterson, 2007; ap Gwilym and Meng, 2010;
Mahmoodzadeh and Gençay, 2017; Verousis and ap Gwilym, 2013). Similar to participants in
traditional markets, cryptocurrency investors exhibit preferences for round trade size.
Taking Bitcoin for example, UT6 in Figure 2 does not show clear clustering patterns. Besides, most
trades of UT6 are concentrated at small sizes and display an anomalous drop in frequency, especially
in LTC and XRP trades. Moreover, clustering patterns for different assets vary across crypto
exchanges and have shown no overall pattern. 27
On unregulated Tier-2 exchanges, we observe less apparent clustering at round sizes. Moreover,
trade patterns vary dramatically and are distinguishable from the typical downward distribution. For
instance, trade frequency on U8 does not monotonically change with the increase in trade size in all
cryptocurrency trades when zooming out to larger ranges. Similar issues are observed on other
exchanges (see Online Appendix B, e.g., U5, U7, and U15 in BTC trades; U3, U7, U11, and U15 in ETH
trades). Additionally, on U8, gaps are observed in the histograms of 0-100 ETH, 0-1000 LTC, and 0-
100000 XRP trades. Similarly, transactions on U9 are absent in irregular intervals of trade size and
gaps erratically appear in the range of 0.3-1 BTC, 5.5-9.5 ETH, and 2500-5500 XRP. When zooming
out to larger trade-size ranges, trade patterns of U9 exhibit a cliff pattern with a steep decline in all
cryptocurrencies. Visually, U14 shows scarce peaks at round sizes of all cryptocurrency trades. A
uniform distribution is observed in LTC and XRP, as well as large observation ranges of BTC and
ETH.28 The finding indicates that investors trade with approximately equal frequency at different
trade sizes, which is against the behavioral regularity in financial markets.
4.2.2 Statistical Tests for Clustering
To quantify the effect of trade-size clustering, we conduct the Student’s t-test for each crypto
exchange by comparing trade frequencies at round trade sizes with the highest frequency of nearby
unrounded trades. For each trading pair, we set up two sets of observation windows: windows
centered on multiples of 100 units (100X) with a radius of 50 units (100X-50, 100X+50), and windows
centered on multiples of 500 units (500Y) with a radius of 100 units (500Y-100, 500Y+100). Trade
frequency is calculated as the number of trades with size i over total trade numbers in the
observation window. For example, Figure 3 shows that in BTC trades on R1, the observation window
27
For some Tier-1 exchanges, clustering is less apparent in the trades of XRP than other cryptocurrencies (see
Panel UT2, UT4, and UT5 of Online Appendix B).
28
Furthermore, at least six Tier-2 exchanges display uniform patterns in cryptocurrency trades (e.g., U1, U2,
U3, U6, U10, U11, and U12 in Online Appendix B).
19You can also read