INDEX - THE LIVING PLANET INDEX (LPI) FOR MIGRATORY FRESHWATER FISH - TECHNICAL REPORT
←
→
Page content transcription
If your browser does not render page correctly, please read the page content below
THE LIVING PLANET INDEX
  (LPI) FOR MIGRATORY
    FRESHWATER FISH

LIVING
PLANET
  INDEX

  TECHNICAL
          1
            REPORT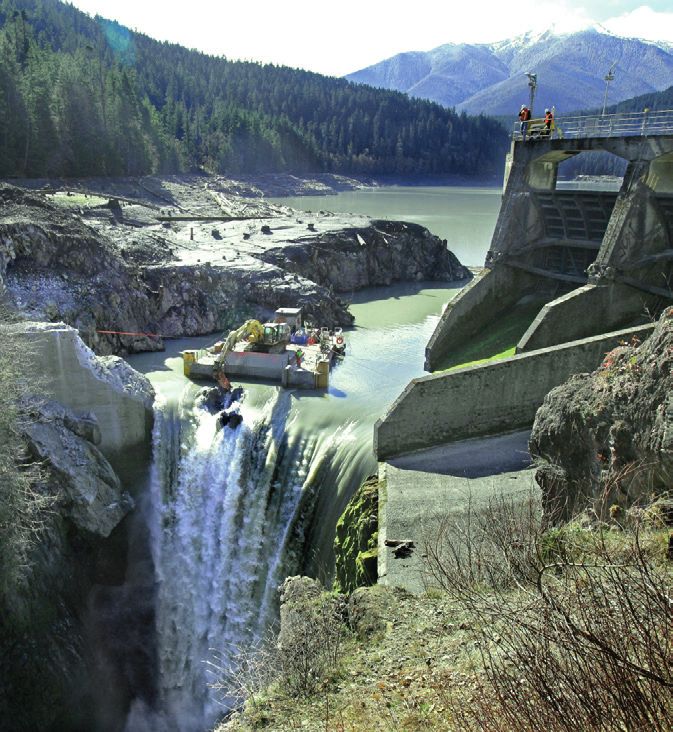
LIVING
                           PLANET
                             INDEX          TECHNICAL REPORT

ACKNOWLEDGEMENTS
We are very grateful to a number of individuals and organisations who have worked with the LPD and/or shared their data.
A full list of all partners and collaborators can be found on the LPI website.

                                                                2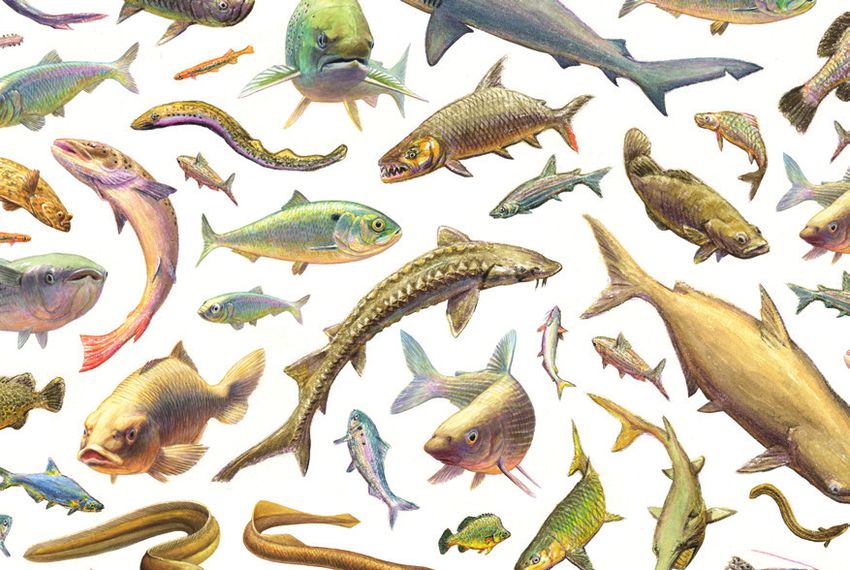
INDEX TABLE OF CONTENTS
Stefanie Deinet1, Kate Scott-Gatty1, Hannah Rotton1, PREFERRED CITATION
William M. Twardek , Valentina Marconi , Louise McRae ,
2 1 1
Deinet, S., Scott-Gatty, K., Rotton, H., Twardek, W. M.,
5 GLOSSARY
Lee J. Baumgartner3, Kerry Brink4, Julie E. Claussen5, Marconi, V., McRae, L., Baumgartner, L. J., Brink, K.,
Steven J. Cooke2, William Darwall6, Britas Klemens Claussen, J. E., Cooke, S. J., Darwall, W., Eriksson, B. K., Garcia
Eriksson7, Carlos Garcia de Leaniz8, Zeb Hogan9, Joshua de Leaniz, C., Hogan, Z., Royte, J., Silva, L. G. M., Thieme, 6 SUMMARY
Royte , Luiz G. M. Silva
10
, Michele L. Thieme , David
11, 12 13
M. L., Tickner, D., Waldman, J., Wanningen, H., Weyl, O. L.
Tickner14, John Waldman15, 16, Herman Wanningen4, Olaf F., Berkhuysen, A. (2020) The Living Planet Index (LPI) for
L. F. Weyl 17, 18
, and Arjan Berkhuysen 4
migratory freshwater fish - Technical Report. World Fish 8 INTRODUCTION
Migration Foundation, The Netherlands.
1 Indicators & Assessments Unit, Institute of Zoology, Zoological Society 11 RESULTS AND DISCUSSION
of London, United Kingdom Edited by Mark van Heukelum
11 Data set
2 Fish Ecology and Conservation Physiology Laboratory, Department of Design Shapeshifter.nl
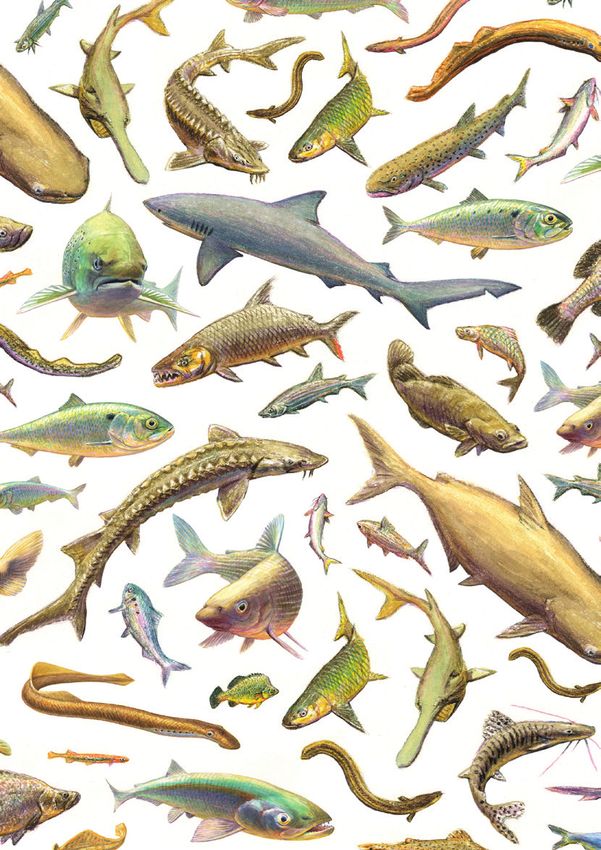
Biology and Institute of Environmental Science, Carleton University, Drawings Jeroen Helmer 12 Global trend
Ottawa, ON, Canada 15 Tropical and temperate zones
3 Institute for Land, Water and Society, Charles Sturt University, Albury, Photography We gratefully acknowledge all of the 17 Regions
New South Wales, Australia photographers who gave us permission
20 Migration categories
4 World Fish Migration Foundation, The Netherlands to use their photographic material.
5 Fisheries Conservation Foundation, Champaign, IL, USA 21 Threats
6 Freshwater Biodiversity Unit, IUCN Global Species Programme, DISCLAIMER 25 Management
Cambridge, United Kingdom All the views expressed in this publication do not
26 Reasons for population increase
7 Groningen Institute for Evolutionary Life-Sciences, University of necessarily reflect those of affiliations mentioned.
Groningen, Groningen, The Netherlands The designation of geographical entities in this report,
8 Centre for Sustainable Aquatic Research, Department of Biosciences, and the presentation of the material, do not imply the 29 RESULTS IN CONTEXT
Swansea University, Swansea, United Kingdom expression of any opinion whatsoever on the part of
9 University of Nevada, Global Water Center, Department of Biology, affiliations concerning the legal status of any country,
34 LIMITATIONS
Reno, Nevada, USA territory, or area, or of its authorities, or concerning the
10 The Nature Conservancy, USA delimitation of its frontiers or boundaries.
11 Programa de Pós-Graduação em Tecnologias para o Desenvolvimento 39 CONCLUSIONS AND RECOMMENDATIONS
Sustentável, Universidade Federal de São João Del Rei, Ouro Branco, The Living Planet Index (LPI) for migratory freshwater
Minas Gerais, Brazil fish Technical report 2020 is an initiative of the World
40 REFERENCES
12 Stocker Lab, Institute of Environmental Engineering, ETH-Zurich, Fish Migration Foundation, commissioned to the ZSL,
Zurich, Switzerland produced in cooperation with a number of experts and
13 World Wildlife Fund, Inc., Washington DC organisations who have contributed to the text, worked 47 APPENDIX
14 WWF-UK, Woking, United Kingdom with the LPD and/or shared their data.
47 The LPI, its calculation and interpretation
15 Department of Biology, Queens College, Queens, NY, USA
16 Graduate Center, City University of New York, New York, NY, USA COPYRIGHT
48 Species list
17 DSI/NRF Research Chair in Inland Fisheries and Freshwater Ecology, © World Fish Migration Foundation 2020 54 Representation
South African Institute for Aquatic Biodiversity, Makhanda, South F. Leggerstraat 14 | 9728 VS Groningen 55 Threats
Africa The Netherlands | info@fishmigration.org
18 Department of Ichthyology and Fisheries Science, Rhodes University,
Makhanda, South Africa WWW.FISHMIGRATION.ORG
3 4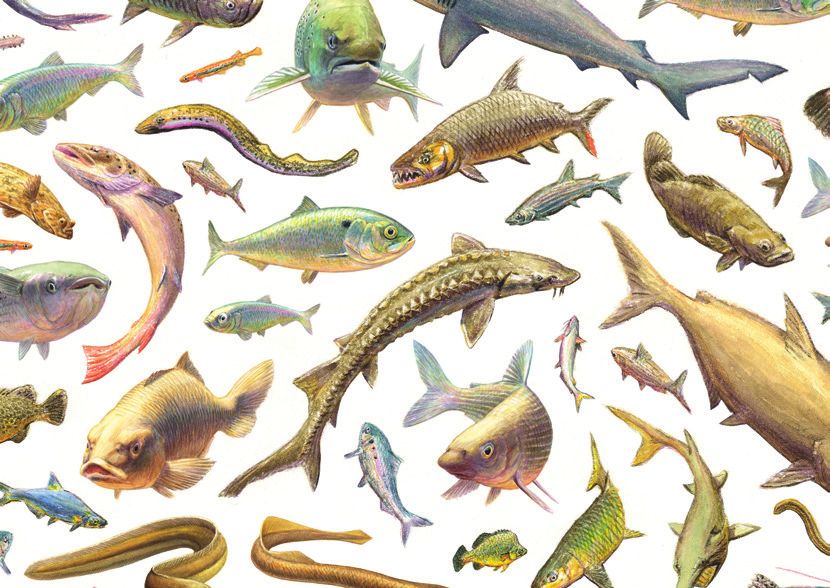
GLOSSARY                                                                                                                       SUMMARY
Migration/Migratory         The movements animals undertake between critical habitats to complete their life cycle.            Migratory freshwater fish (i.e. fish that use freshwater        fish in these areas. Potamodromous fish, have declined
                            Often, this is a seasonal or cyclical movement between breeding and non-breeding areas.            systems, either partly or exclusively) occur around the         more than fish migrating between fresh and salt water
                                                                                                                               world and travel between critical habitats to complete          on average (-83% vs -73%). Populations that are known
Migratory freshwater fish   In this report, any fish species classified in GROMS as catadromous, anadromous,                   their life cycle. They are disproportionately threatened        to be affected by threats anywhere along their migration
                            amphidromous, diadromous or potamodromous.                                                         compared to other fish groups but global trends in abun-        routes show an average decline of 94% while those not
                                                                                                                               dance, regional differences and drivers of patterns have        threatened at the population level have increased on av-
GROMS                       The Global Register of Migratory Species (GROMS) supports the Bonn Convention by                   not yet been comprehensively described. Using abundance         erage. Habitat degradation, alteration, and loss accounted
                            summarising the state of knowledge about animal migration.                                         information from the Living Planet Database, we found           for around a half of threats to migratory fish, while over-
                                                                                                                               widespread declines between 1970 and 2016 in tropical           exploitation accounted for around one-third.
Diadromous                  Fish species that travels between saltwater and fresh water as part of its life cycle. This        and temperate areas and across all regions, all migration
                            category usually includes catadromous, anadromous and amphidromous species but is used             categories and all populations.                                 Protected, regulated and exploited populations decreased
                            for some species in GROMS that have not been assigned to any of these three categories.                                                                            less than unmanaged ones, with the most often recorded
                                                                                                                               Globally, migratory freshwater fish have declined by            actions being related to fisheries regulations, including
Catadromous                 Fish species that migrates down rivers to the sea to spawn, e.g. European eel Anguilla             an average of 76%. Average declines have been more              fishing restrictions, no-take zones, fisheries closures,
                            anguilla.                                                                                          pronounced in Europe (-93%) and Latin America &                 bycatch reductions and stocking (these were most com-
                                                                                                                               Caribbean (-84%), and least in North America (-28%).            mon in North America and Europe). Recorded reasons for
Anadromous                  Fish species that migrates up rivers from the sea to spawn, e.g. salmon and Atlantic               The percentage of species represented was highest in            observed increases tended to be mostly unknown or un-
                            sturgeon Acipenser oxyrinchus.                                                                     the two temperate regions of Europe and North America           described, especially in tropical regions. This information
                                                                                                                               (almost 50%).                                                   is needed to assemble a more complete picture to assess
Amphidromous                Fish species that travels between freshwater and saltwater, but not to breed, e.g. some                                                                            how declines in migratory freshwater fishes could be
                            species of goby, mullet and gudgeon.                                                               For the continents of Africa, Asia, Oceania, and South          reduced or reversed. Our findings confirm that migratory
                                                                                                                               America, data was highly deficient, and we advise against       freshwater fish may be more threatened throughout their
Potamodromous               Fish species that migrates within freshwater only to complete its life cycle, e.g. catfishes and   making conclusions on the status of migratory freshwater        range than previously documented.
                            White sturgeon Acipenser transmontanus.

Mega-fish                   Refers to large-bodied fish that spend a critical part of their life in freshwater or brackish     FISH HEADING UPSTREAM THE JURUENA RIVER, SALTO SÃO SIMÃO, MATO GROSSO-AMAZONIAN STATES, BRAZIL
                            ecosystems and reach at least 30kg.                                                                © Zig Koch / WWF

Species                     A group of living organisms consisting of similar individuals capable of exchanging genes or
                            interbreeding.

Population                  In the Living Planet Database (LPD), a population is a group of individuals of a single species
                            that occur and have been monitored in the same location.

Time series                 A set of comparable values measured over time. Here, these values are abundance estimates
                            of a set of individuals of the same species monitored in the same location over a period of at
                            least two years using a comparable method.

Index                       A measure of change over time compared to a baseline value calculated from time series
                            information.

Data set                    A collection of time series from which an index is calculated.

                                                            5                                                                                                                              6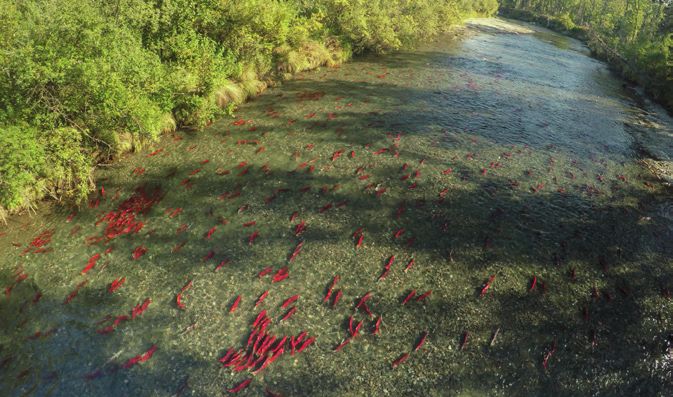
BOX 1
FREE-FLOWING RIVERS                                                                                                                                      INTRODUCTION
A free-flowing river occurs where natural aquatic eco-                           necessary for the completion of their life cycle. A recent              Migration consists of the regular, seasonal movements                 live separately and need to migrate in order to breed (e.g.
system functions and services are largely unaffected                             global assessment of the connectivity status of rivers                  animals undertake between critical habitats to com-                   Zampatti et. al 2010). Here, we define migratory freshwa-
by changes to connectivity and flows allowing an unob-                           globally found that only 37% of rivers longer than 1,000                plete their life cycle (Dingle and Drake 2007). Often, this           ter fish species to be those that use freshwater habitats
structed exchange of material, species and energy within                         km remain free-flowing over their entire length and 23%                 is the movement between breeding and non-breeding                     for at least some part of their life cycle.
the river system and surrounding landscapes beyond.                              flow uninterrupted to the ocean (Grill et al. 2019). Very               areas. In fish, it can be distinguished from other types
Free-flowing rivers provide a multitude of services includ-                      long FFRs are largely restricted to remote regions of the               of movement because it takes place between two or                     There is evidence that freshwater species are at great-
ing cultural, recreational, biodiversity, fisheries, and the                     Arctic and of the Amazon and Congo basins (Figure 1). In                more well-separated habitats, occurs regularly (often                 er risk than their terrestrial counterparts (Collen et al.
delivery of water and organic materials to downstream                            densely populated areas only few very long rivers remain                seasonally), involves a large fraction of a population,               2009b; IUCN 2020). Almost one in three of all freshwater
habitats including floodplains and deltas. The connec-                           free flowing, such as the Irrawaddy and Salween. Dams                   and is directed rather than random (Northcote 1978).                  species are threatened with extinction (Collen et al. 2014),
tivity provided by free-flowing rivers is critical for the                       and reservoirs and their up- and downstream propagation                 Migratory fish occur around the world, with some species              and migratory fish are disproportionately threatened
life history of many migratory fish that depend on both                          of fragmentation and flow regulation are the leading                    moving large distances while others undertake migration               compared to other fish groups (Darwall & Freyhof 2016).
longitudinal and lateral connectivity to access habitats                         contributors to the loss of river connectivity.                         on a more local scale. Thousands of known fish species                Moreover, mega-fishes (species that spend a critical
                                                                                                                                                         have tendencies to migrate within or between rivers and               part of their life in freshwater or brackish ecosystems
                                                                                                                                                         oceans with over 1,100 of these species where migration               and reach 30kg) such as Beluga sturgeon (Huso huso) or
FIGURE 1                                                                                                                                                 is required for their survival (Lucas et al. 2001; Brink et al.       the Mekong giant catfish, are particularly vulnerable to
Free-flowing river status of rivers globally (from Grill et al. 2019).                                                                                   2018). For example, Pacific Salmon return from the ocean              threats (58%; Carrizo et al. 2017). Catches in the Mekong
                                                                                                                                                         to the same river where they were born to breed, while                River basin between 2000 and 2015, for example, have
                                                                                                                                                         Congolli (Pseudaphritis urvillii) where males and females             decreased for 78% of freshwater fish species, and declines

                                                                                                                                                         SOCKEYE SALMON MIGRATING FREELY TO THEIR SPAWNIG GROUNDS. ILIAMNA LAKE, ALASKA
                                                                                                                                                         © Jason Ching

REFERENCES
Grill, G., Lehner, B., Thieme, M., Geenen, B., Tickner, D., Antonelli, F., Babu, S., Borrelli, P., Cheng, L., Crochetiere, H., Ehalt Macedo, H.,
    Filgueiras, R., Goichot, M., Higgins, J., Hogan, Z., Lip, B., McClain, M. E., Meng, J., Mulligan, M., Nilsson, C., Olden, J. D., Opperman, J. J.,
    Petry, P., Reidy Liermann, C., Saenz, L., Salinas-Rodriguez, S., Schelle, P., Schmitt, R. J. P., Snider, J., Tan, F., Tockner, K., Valdujo, P. H.,
    van Soesbergen, A., and Zarfl, C. (2019) Mapping the world’s free-flowing rivers. Nature, 569(7755):215-221.

                                                                            7                                                                                                                                              8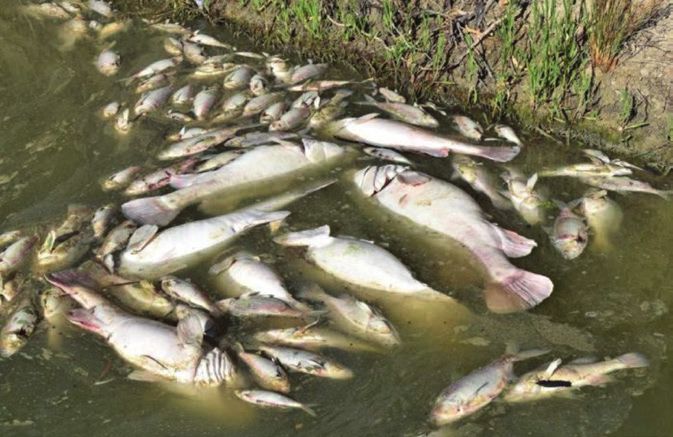
are stronger among medium-to large-bodied species (Ngor             GATHEGA DAM
                                                                                                                                  BOX 2
et al. 2018). However, it is likely that our knowledge is           Dams like the Gathega Dam in New South Wales, Australia
biased towards these charismatic, mega-fishes, and that
smaller, less iconic species may be overlooked (e.g. Yarra
pygmy perch; Saddlier et al. 2013).
                                                                    not only block the migration route of migratory fish, but
                                                                    also block sediment transport and destroy river habitat.
                                                                    © WWF
                                                                                                                                  DAMS
One of the largest issues is the blockages of migration                                                                           The number of dams has increased substantially in the                   longer reach their original spawning grounds. The Chinese
routes and lack of free-flowing rivers globally (Grill et al.                                                                     past six decades for many purposes such as irrigation,                  sturgeon has so far been able to adapt and spawn in an
2019; see Box 1). Many artificial barriers, such as dams,                                                                         water storage, hydroelectric power, navigation and flood                extremely different environment, however, they are on
culverts, road crossings and weirs impede the movement                                                                            control (Lehner et al. 2011). It is reported that there                 the brink of extinction and with further dams proposed
of migratory fish and reduce their ability to complete                                                                            are 57,985 large dams worldwide, with countless small                   the species will not survive without conservation efforts
their lifecycle (Winemiller et al. 2016). Dams and other                                                                          dams (McCully 1996; ICOLD 2020). Now worldwide only                     (Zhuang et al. 2016). These impacts, in addition to water
river infrastructures can also significantly change the                                                                           37% of large rivers over 1,000 km are free flowing (Grill               quality issues (e.g. thermal pollution, dissolved oxygen
flow regime, affecting the extent and connectivity of,                                                                            et al. 2019) and these are mostly in remote locations.                  alteration, heavy metal accumulation) signal a difficult
for example, downstream floodplain habitats, as well                                                                              Dams often have major impacts on migratory fish as they                 future for migratory fish in obstructed river systems.
as the timing and magnitude of critical cues crucial for                                                                          decrease connectivity and alter flow regimes. In the upper
migration and live stage transition (see Box 2). Climate                                                                          Paraná River in Brazil damming changed the river water                  However, there has also been efforts to balance biodiver-
change will continue to exacerbate the impacts of altered                                                                         regime leading to a smaller flooded area downstream.                    sity with dam benefits. Following the construction of hy-
habitats on freshwater ecosystems and add additional                                                                              The migratory Streaked prochilod (Prochilodus lineatus) is              droelectric dams in the Penobscot River (USA), migratory
stressors such as pollution, thermal stress, water diver-                                                                         dependent on flooding as a mechanism for dispersing into                fish populations started to decline, some of them dramat-
sion, water storage, or invasive species proliferation (Ficke                                                                     lagoons where juveniles live for 1-2 years. Without flooding            ically. This led to the Penobscot River Restoration Project
et al. 2007). In addition, because migration is typically                                                                         they are unable to complete this stage in their life cycle              being set up by local stakeholder groups. By removing the
cyclical and predictable, migratory fish can be easily                                                                            and numbers have been reduced to critical levels (Gubiani               two most seaward dams and incorporating fish passages,
exploited (Allan et al. 2005). On top of these obvious and                                                                        et al. 2006). But water flow alterations do not necessarily             six migratory fish species regained access to nearly their
well known threats, there are also many emerging threats                                                                          cause decreases in all migratory freshwater fish. For exam-             full historical range (Opperman et al. 2011). Opportunities
(e.g. microplastic pollution, freshwater salinisation) to                                                                         ple, a number of detritivorous species benefitted from the              were also used to increase electricity generation strate-
freshwater ecosystems and the fish they support (Reid               This report presents an update of the same global             explosive development of attached algae below a newly                   gically at certain remaining dams to ensure that overall
et al. 2019). With knowledge of the current and predicted           analysis using a more recent data set with improved           constructed dam in French Guiana (Merona et al. 2005).                  generation did not decrease (Opperman et al. 2011). With
threats, a global overview of the status and trends of mi-          representation of species monitored in areas generally                                                                                the impact of large dams predicted to greatly increase
gratory freshwater fish is needed to assess impacts and             classified as tropical. We used the Living Planet Index       In addition to changing the hydrology of a river, dams can              habitat fragmentation in tropical and subtropical river ba-
drivers of change on this group, and to examine if trends           (LPI) method (Loh et al. 2005; Collen et al. 2009a; McRae     also create a physical barrier for migratory fish to spawn..            sins (Barbarossa et al. 2020), strategic river management
are consistent among regions.                                       et al. 2017), a global measure of biological diversity that   In the Yangtze river, dams have reduced the river distri-               at multiple scales, and setting conservation priorities for
                                                                    is being used to track progress towards the Aichi Bio-        bution of the Chinese sturgeon by 50% and they can no                   species and basins at risk will be vital.
Biodiversity indicators are an important tool to present a          diversity Targets (SCBD 2010). The LPI tracks trends in
broad overview of trends in migratory fish health at the            abundance of a large number of populations of vertebrate
global scale. Various metrics, such as species extinction           species in much the same way that a stock market index        REFERENCES
risk and abundance, can provide insight into the driving            tracks the value of a set of shares or a retail price index   Barbarossa, V. et al. (2020) Impacts of current and future large dams on the geographic range connectivity of freshwater fish
forces behind observed trends (Böhm et al. 2016; Spooner            tracks the cost of a basket of consumer goods. We exam-           worldwide. PNAS, 117(7):3648-3655.
et al. 2018) and can be used to model projections under             ine more closely how trends in migratory freshwater fish      Grill, G. et al. (2019) Mapping the world’s free-flowing rivers. Nature, 569:215-221. https://doi.org/10.1038/s41586-019-1111-9.
                                                                                                                                  Gubiani, E. A. et al. (2007) Persistence of fish populations in the upper Paraná River: effects of water regulation by dams. Ecology of
future scenarios (Visconti et al. 2016). To date, the first         differ between different regions of the world and between
                                                                                                                                      Freshwater Fish, 16:161-197.
global analyses of this kind using abundance trends in              species undertaking different kinds of migration, and
                                                                                                                                  International Commission on Large Dams (ICOLD) (2020) General synthesis. https://www.icold-cigb.org/article/GB/world_register/
migratory freshwater fish populations revealed an overall           explore possible drivers for the patterns we observe.             general_synthesis/general-synthesis.
decline amongst species since 1970 (WWF 2016; Brink                                                                               Lehner, B. et al. (2011) High-resolution mapping of the world’s reservoirs and dams for sustainable river-flow management. Frontiers in
et al. 2018). However, data coverage tends to be skewed                                                                               Ecology and the Environment, 9:494-502.
towards temperate regions of North America and Europe                                                                             Merona, B. et al. (2005). Alteration of fish diversity downstream from Petit-Saut Dam in French Guiana. Implication of ecological
                                                                                                                                      strategies of fish species. Hydrobiologia, 551:33-47.
(Limburg and Waldman 2009; Heino et al. 2016; McRae
                                                                                                                                  McCully, P. (1996) Silenced rivers: the ecology and politics of large dams. Zed Books, London.
et al. 2017) so the extent to which this trend is consist-                                                                        Opperman, J. et al. (2011). The Penobscot River, Maine, USA: A Basin-Scale Approach to Balancing Power Generation and Ecosystem
ent among all regions of the world has not yet been well                                                                              Restoration. Ecology and Society, 16(3):7.
explored.                                                                                                                         Zhuang, P. et al. (2016) New evidence may support the persistence and adaptability of the near-extinct Chinese sturgeon. Biological
                                                                                                                                     Conservation, 193:66-69.

                                                                9                                                                                                                                    10
FIGURE 1
                                                                                                                                    Map of 1,406 monitored populations of 247 species of fishes listed on GROMS as anadromous, catadromous, amphidromous,

RESULTS                                                                                                                             diadromous or potamodromous included in this analysis. Blue points denote populations used for the last published index
                                                                                                                                    for migratory freshwater fish in the Living Planet Report 2016 (WWF 2016). Orange-pink points denote those populations
                                                                                                                                    that have been added since 2016. Different shades denote the length of the time series in years between 1970 and 2016.

AND
DISCUSSION
DATA SET                                                               (WWF 2016), i.e. a 52% increase in the number of species
We extracted, from the Living Planet Database (LPD; LPI                included (Table 1). Data for these new populations were
2020), abundance information for 1,406 populations of                  collected from scientific journals, government or unpub-
247 fish species listed on the Global Register of Migratory            lished reports, or received from in-country contacts in
Species (GROMS; Riede 2001) as anadromous, catadro-                    the case of unpublished data. The majority of new data
mous, amphidromous, diadromous or potamodromous,                       were added since an unpublished 2018 analysis, which
i.e. completing part or all of their migratory journey in              was based on 981 populations of 180 species. Some were
freshwater. These species will be referred to as ‘migra-               a result of including diadromous fishes, which were previ-
tory freshwater fish’ in this report. Information on the               ously excluded, or a result of the recoding of the GROMS
method used, the interpretation of the LPI (‘The LPI, its              category of existing LPD populations. Most of these new
calculation and interpretation’) and a list of species (Table          populations are time series of between 2 and 20 years
A1) can be found in the Appendix. Non-native populations               in length from around the world, many starting to fill
were not included in the final data set.                               gaps in areas such as Africa, Australia and South America
                                                                       (Table 1, Figure 1). Despite this, many large data gaps
This represents an increase of 757 populations and 85                  remain, especially in the tropics and large parts of Asia                                                                       New populations             Existing populations
species since the last published trend information in 2016             (Figure 1, Table 2).                                                                                                              2-9 years                    2-9 years
                                                                                                                                                                                                         10-19 years                  10-19 years
                                                                                                                                                                                                         20-29 years                  20-29 years
TABLE 1                                                                                                                                                                                                  30-39 years                  30-39 years
Increase in the LPD data set of fishes listed on GROMS as anadromous, catadromous, amphidromous, diadromous or                                                                                           40-48 years                  40-48 years
potamodromous since the last published index in 2016 (WWF 2016).

 DATA SET          SUBSET                                   NUMBER OF                   NUMBER OF                 % CHANGE
 		                                                         SPECIES (2016)              SPECIES (2020)            SINCE 2016
                                                                                                                                    GLOBAL TREND
 Global		                                                   162                         247                       52%               The 247 monitored species showed an overall average                amining the total change for each species in more detail,
 Zone              Temperate                                94                          108                       15%               decrease of 76% between 1970 and 2016 (bootstrapped                we see that the majority of species trends are at the
                   Tropical                                 74                          150                       103%              95% confidence interval: -88% to -53%; Figure 2). This is          extremes, being either very positive or very negative (dark
 Region            Africa                                   24                          43                        79%               equivalent to an average 3% decline per year. Because the          green and dark red bars in Figure 3b). While there are
                   Asia & Oceania                           34                          77                        126%              LPI describes average change, this means that although             plenty of species decreasing less than the most extreme
                   Europe                                   37                          49                        32%               populations of these monitored species are, on average,            cases, smaller increases - ranging from around 5% to
                   Latin America and Caribbean              28                          46                        64%               76% less abundant in 2016 compared to 1970, it should              80% - are observed much less (Figure 3b). Stable species,
                   North America                            61                          63                        3%                be recognised that species could have decreased more or            i.e. those changing by less than 5% over the monitoring
                                                                                                                                    even increased over the same period.                               period, are rare (Figures 3a and 3b). Overall, this suggests
                                                                                                                                                                                                       that there are not just more declining species but that de-
                                                                                                                                    As seen in Figure 3a, the majority of species are declining        clining species are showing greater change than increas-
                                                                                                                                    (56%), while 43% have increased on average. When ex-               ing species.

                                                                  11                                                                                                                              12
FIGURE 2 set is more heavily influenced by the trends of its remain- FIGURE 3B
Average change in abundance of -76% between 1970 and ing populations (see ‘Limitations’ section). Histogram of the total average change of 247 migratory freshwater fish species (listed on GROMS as anadromous,
2016 of 1,406 monitored populations of 247 species of catadromous, amphidromous, diadromous or potamodromous). Please note that ‘±5%’ represents a stable trend.
fishes listed on GROMS as anadromous, catadromous, The global index is based on monitoring data from
amphidromous, diadromous or potamodromous. The locations around the world, although most populations
white line shows the index values and the shaded areas were sampled in the temperate regions of North America 40 Decline Stable Increase
represent the bootstrapped 95% confidence interval and Europe (Figure 1, Table 2). It represents 21% of 1,158
(-88% to -53%). GROMS-listed migratory freshwater fish species, with rep- 35
resentation for different GROMS categories ranging from
2,0 14% in the amphidromous to 40% in the catadromous 30
migration categories (Table 2). Analysis of the propor-
Number of species
tional representation across regions revealed a significant 25
1,5
imbalance of represented areas, with under-representa-
Index (1970 = 1)
tion from Africa and Asia & Oceania, while species in 20
1,0
Europe and North America were well exemplified (Table
A2). In terms of GROMS categories, amphidromous species 15
0,5 are significantly under-represented, while anadromous,
catadromous and diadromous species are over-represent- 10
0,0 ed (Table A2). Species counts in the potamodromous and
freshwater-saltwater combined categories are not signifi- 5
1970
1975
1980
1985
1990
1995
2000
2005
2010
2015
Years cantly different to expected proportions (Table A2).
0
Overall, the global index suggests that monitored popula-
-100~90
-80~90
-60~80
-40~60
-20~40
-5-~20
±5
5~20
20~40
40~60
60~80
80~100
100~200
200~500
500 +
The index displays a fairly consistent decline until the tions of migratory freshwater fish have a similar trend to
mid-2000s, after which the rate of decline slows a little, freshwater vertebrate species overall, which have shown Total change between 1970 and 2016 (%)
resulting in a more stable yet overall downward trend. an average decline of 83% over roughly the same period
A more negative trend can be seen again after 2011. (WWF 2018). This may be surprising, considering the larger
When examining average change by decade, it becomes number of threats migratory fish are exposed to due to
clear that the largest negative change occurred in the travelling long distances and traversing different habitats. FIGURE 4
1970s (-3.9%), 1990s (-4.5%) and between 2010 and 2016 However, it should be noted that the freshwater LPI also Average annual change in population abundance for 1,406 monitored populations of 247 species of fishes listed on GROMS
(-7.7%), with very little change on average in the 2000s includes information on other taxonomic groups, of which as anadromous, catadromous, amphidromous, diadromous or potamodromous by decade: 1970s, 1980s, 1990s, 2000s and
(Figure 4). Both the lack of change in the 2000s and the tropical amphibians show a most precipitous decline, which 2010-2016. Please note that the more negative recent annual trend may be due to reduced data availability, leading to
large decline in the 2010s may be explained by changes in is driving the freshwater trend. Similarly, the overall index rapidly declining species dominating a smaller data set. The small change in the 2000s may be due to a larger number of
data availability. A larger number of declining populations for migratory freshwater fish may mask differences in declining populations leaving the index during this period than populations joining the index.
leave the index after 2000, leading to a more stable trend, different subsets of the underlying data, for example tem-
while the number of available populations reduces in the perate and tropical areas, regions, and GROMS categories, 5%
2010s due to publication lag. In both cases, a smaller data so these are explored in more detail below.
-3,9% -2,1% -4,5% -7,7%
FIGURE 3A
0%
The proportion of 247 migratory freshwater fish species (listed on GROMS as anadromous, catadromous, amphidromous,
diadromous or potamodromous) with a declining (pink-orange), stable (blue) or increasing (green) species-level trend. A 0,2%
stable trend is defined as an overall average change of ±5%.
-5%
FISHES (N=247) Decline Stable Increase
-10% 1970s 1980s 1990s 2000s 2010s
0% 10% 20% 30% 40% 50% 60% 70% 80% 90% 100%
13 14
TABLE 2 RELEASING A TAGGED MEKONG GIANT CATFISH
Number of populations and species of migratory freshwater fish (GROMS-listed as anadromous, catadromous, Mekong River, Cambodia. © Zeb Hogan
amphidromous, diadromous or potamodromous), the number of expected species (according to GROMS), and the percentage
representation for each subset for which an index was calculated. Please refer to the appropriate sections for explanations
of the different data sets.
DATA SET SUBSET POPULATIONS SPECIES EXPECTED %
SPECIES REPRESENTED
Global 1.406 247 1.158 21%
Zone Temperate 1.073 108 - -
Tropical 358 150 - -
Region Africa 104 43 325 13%
Asia & Oceania 165 77 804 10%
Europe 408 49 108 45%
Latin America and Caribbean 80 46 183 25%
North America 649 63 141 45%
GROMS Potamodromous 390 109 572 19%
Fresh- & Saltwater combined 1.016 138 586 24%
Amphidromous 144 44 324 14%
Anadromous 738 59 174 34%
Catadromous 116 28 70 40%
Diadromous 18 7 18 39%
Threat status Threatened 290 116 - -
No threats 175 83 - -
Unknown threat status 941 161 - -
Management Managed 359 63 - -
Unmanaged 428 163 - -
FIGURE 5
Average change in abundance of monitored migratory freshwater fishes (GROMS-listed as anadromous, catadromous,
amphidromous, diadromous or potamodromous) between 1970 and 2016 in
TROPICAL AND TEMPERATE ZONES a) temperate regions ( 79%; 1,073 populations of 108 species) and
The LPD divides the world into temperate and tropical The high variation of the tropical index is because many b) tropical regions ( 82%; 358 populations of 150 species).
zones based on biogeographic realms as defined by Olsen of the tropical species are represented by very short
et al. (2001). The temperate zone includes the Nearctic time series (on average 7.6 years compared to 13.8 years The white lines show the index values and the shaded areas represent the bootstrapped 95% confidence intervals.
and Palearctic (this roughly equates to North America, Eu- in temperate populations). Short-time series result in a
rope and Central Asia), and the tropical zone the remain- greater turnover of data, i.e. many time series enter and
ing areas of the world. Migratory freshwater fish have leave the data set at different times between 1970 and 2,0 A 2,0 B
declined on average in both zones, although they have 2016. Thus, at any given time, fewer species were contrib-
fared slightly better in temperate areas (-79% vs -82%; uting to the tropical index, making it more vulnerable to 1,5 1,5
Figure 5). The overall declines correspond to an average trends of a few populations or set of species.
Index (1970 = 1)
Index (1970 = 1)
change of 3.4% per year for temperate populations and
1,0 1,0
3.6% per year for tropical populations. The temperate
trend declined continuously with few short-term fluctua-
0,5 0,5
tions (Figure 5a; see also Figures 6a and 6b). The tropical
index contained more time series than the temperate, but
still showed a high degree of short-term fluctuations, as 0,0 0,0
indicated by the wider confidence interval (Figure 5b; see
1970
1975
1980
1985
1990
1995
2000
2005
2010
2015
1970
1975
1980
1985
1990
1995
2000
2005
2010
2015
also Figures 6c and 6d). Years Years
15 16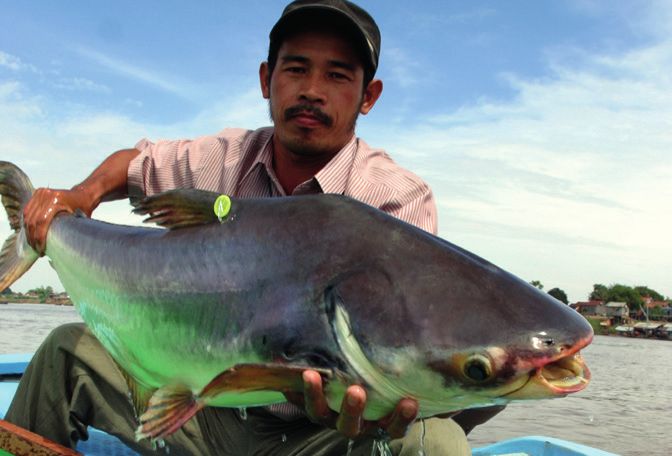
REGIONS
BOX 3
The data set can be divided into different political regions, represented in these two temperate regions (Table 2), the
following the internationally accepted UN Geographic
Region classification (United Nations Statistics Division,
n.d.). When examining trends for migratory freshwater
trends are likely to be the most reliable. Only Asia-Oceania
and Africa show a significantly lower proportion of species
represented in the data set than would be expected
LPI FOR STURGEONS
fish in these regions a picture of widespread average based on actual species numbers (Table A2), so the trends
declines emerges, ranging from -28% in North America may not reflect as accurately what is occurring in these Sturgeons (Acipenseridae) are one of the oldest families ing a positive trend overall. This may be because most
to -93% in Europe (Figure 6). With almost half of species regions. of bony fishes that inhabit the freshwater bodies of Eur- declines in North American sturgeon species occurred
asia and North America. Sturgeons are considered to be earlier in the 20th century prior to 1970 (the earliest
‘megafauna’ species, as they have a slow growth rate and year considered in the LPI) when it is thought overfishing
FIGURE 6 therefore tend to reproduce at a later stage in life. For collapsed populations. North American sturgeon species
Average change in abundance of monitored migratory freshwater fishes (GROMS-listed as anadromous, catadromous, this reason, they cannot adapt quickly to changes in the now appear to have stabilised at a low level relative to
amphidromous, diadromous or potamodromous) between 1970 and 2016 in environment, which makes them particularly susceptible historic values.
a) North America (-28%; 649 populations of 63 species) to threats (Ripple et al. 2019). According to the Interna-
b) Europe (-93%; 408 populations of 49 species) and tional Union for the Conservation of Nature (IUCN), 21
c) Latin America and Caribbean -84% since 1980; 80 populations of 46 species) of the 25 species of sturgeon are threatened, with 16 FIGURE 1
d) Asia-Oceania (-59%; 165 populations of 77 species). classified as Critically Endangered, 2 as Endangered and 3 Average change in abundance of -91% between 1970 and
as Vulnerable (IUCN 2020). The main threats to sturgeon 2016 of 36 monitored populations of 14 Acipenseridae
The white lines show the index values and the shaded areas represent the bootstrapped 95% confidence intervals. Please species are trade and overfishing (they are harvested species. The white line shows the index values and the
note that the index for Africa is not shown here because the resulting trend is noisy, likely due to a small and biased data for their roe), habitat loss and degradation, as well as shaded areas represent the bootstrapped 95% confidence
set. The Latin America & Caribbean index is for 1980-2016. The sharp decline in Oceania from 2000 onwards coincides with pollution. As sturgeons are anadromous, i.e. they spawn interval (range: 75% to -97%). Please note that 4
more populations entering and leaving the index than previously. upstream and feed in river deltas, they are vulnerable to populations of 3 species of sturgeon had to be excluded
any alteration of the river flow such as dam construction because they had a pronounced impact on the index.
that might block their migratory routes to spawning and
2,0 A 2,0 B
feeding grounds (Carrizo et al. 2017; He et al. 2017).
2,0
1,5 1,5
The LPI for migratory freshwater fish contains abundance
information on 14 of the 25 species of Acipenseridae, and
Index (1970 = 1)
Index (1970 = 1)
1,5
1,0 1,0 it is possible to calculate an index for the group. Overall,
Index (1970 = 1)
monitored sturgeon populations have declined by 91% on 1,0
0,5 0,5 average between 1970 and 2016 (Figure 1). The vast ma-
jority either do not have any information recorded as to
0,5
whether there are known threats to the population (47%)
0,0 0,0
or have known threats (53%), with the most commonly
1970
1975
1980
1985
1990
1995
2000
2005
2010
2015
1970
1975
1980
1985
1990
1995
2000
2005
2010
2015
recorded threat being exploitation (55%), followed by hab- 0,0
Years Years
itat degradation and change (31%). Only the three North
1970
1975
1980
1985
1990
1995
2000
2005
2010
2015
American species of sturgeon in the data set are show- Years
2,0 C 2,0 D
1,5 1,5
REFERENCES
Index (1970 = 1)
Index (1970 = 1)
Carrizo, S. F., Jähnig, S. C., Bremerich, V., Freyhof, J., Harrison, I., He, F., Langhans, S. D, Trockner, K., Zarfl, C., and Darwall, W. (2017)
1,0 1,0
Freshwater megafauna: Flagships for freshwater biodiversity under threat. BioScience, 67:919-927. https://doi. org/10.1093/biosci/
bix099.
0,5 0,5
He, F., Zarfl, C., Bremerich, V., Henshaw, A., Darwall, W., Tockner, K., and Jähnig, S. C. (2017) Disappearing giants: A review of threats to
freshwater megafauna. Wiley Interdisciplinary Reviews: Water, 4:e1208. https://doi.org/10.1002/wat2.1208.
0,0 0,0 IUCN (2020) The IUCN Red List of Threatened Species 2019-3.
Ripple, W. J., Wolf, C., Newsome, T. M., Betts, M. G., Ceballos, G., Courchamp, F., Hayward, M.W., Van Valkenburgh, B., Wallach, A.D., and
1970
1975
1980
1985
1990
1995
2000
2005
2010
2015
1970
1975
1980
1985
1990
1995
2000
2005
2010
2015
Years Years Worm, B. (2019) Are we eating the world’s megafauna to extinction? Conservation Letters, 12. https://doi. org/10.1111/conl.12627.
17 18BOX 4 Interestingly, the trend for the Latin America and Car- to under- and overestimation of abundance at different
ibbean region is based on one of the smallest datasets times during the monitoring; and potentially real cyclical
LPI FOR EELS comprising only 46 species, yet these represent a quarter
(25%) of expected species (Table 2). This may be due to
the fact that the GROMS classification system has not
patterns in the abundance of some species.
MIGRATION CATEGORIES
been updated recently, and older taxonomy might miss Fishes that are potamodromous (i.e. complete their
The migration of the European eel (Anguilla anguilla) is high, as the eels are threatened by recreational and species that have been split from other species since then migration entirely within the freshwater system) and
during its life cycle is one of the longest and most com- commercial fisheries, the presence of hydropower and or those that have been more recently described. The species that migrate between freshwater and saltwater
plex in the anguillid group (Tsukamoto et al. 2002). Whilst pumping stations, and pollution. The individuals that sur- trend appears to follow a similar trajectory until the mid- systems (i.e. those categorised in GROMS as anadromous,
the continental phase of the eel’s life-history is relatively vive will become sexually mature and begin their 5000 km 2000s, after which it increases and then decreases again catadromous, amphidromous or diadromous) are likely to
well-studied, we know little about the marine phase. The migration back to their spawning ground in the Sargasso (this is also seen in the tropical index; Figure 5b). This is be exposed to different threats in the different systems,
eel’s migration begins in the open waters of the North Sea as so-called ‘silver eels’. due to a number of potamodromous species from Brazil, and may therefore show different trends. Splitting the
Atlantic, from where the species uses the Gulf Stream to which increased following a drought in 2005 (Freitas et al. data set into these two categories reveals that the
reach European waters. There, eels metamorphose into The complexity of their life cycle makes eels particular- 2012). It is believed that the drought and its extended low equivalent of an average annual decline of 3.8% results
so-called ‘glass eels’ (an intermediary stage in the eel’s ly vulnerable to anthropogenic threats. European eel is water periods caused an abundance of fish carcasses and in potamodromous fishes being 83% less abundant on
complex life history before the juvenile, or elver, stage) listed as Critically Endangered by the IUCN Red List of terrestrial plants detritus that elevated the nutrient lev- average, with most of the decline occurring in the 1970s
and migrate upstream into rivers, where they spend Threatened Species due to a decline of 90-95% in the els in returning flood waters. As algivores or detritivores and 1980s. By contrast, the fish species migrating
5-20 years feeding and maturing. Mortality in this phase recruitment of the species in the last 45 years across a dominate the migratory species here, they would have between fresh- and saltwater decrease more steadily,
large portion of its distribution range (Jacoby & Gollock benefitted from this nutritional pulse. but the overall average change is less at 73% (Figure
2014). According to the International Council for the 7). Nearly a quarter of fish species migrating between
FIGURE 1 Exploration of the Sea (ICES), the recruitment of glass All of the other regions show trends that are less smooth fresh- and saltwater are represented (Table 2), making
Average change in abundance of -92% between 1970 and eels to European waters in 2018 is 2.1% of the 1960-1979 with many spikes and dips, which could be attributed to a this a perhaps more reliable trend. Please refer to Boxes
2016 of 29 monitored populations of 7 anguillid species. level in the North Sea and 10.1% in the rest of Europe. The number of different factors: shorter time series entering 3, 4 and 5 for more detailed information on some of the
The white line shows the index values and the shaded steepest declines were observed between 1980 and 2010, and leaving the indices at different times and causing more iconic anadromous, catadromous and potamodro-
areas represent the bootstrapped 95% confidence interval but recruitment levels have remained low ever since (ICES abrupt changes in the index; monitoring biases leading mous species.
(range: 76% to -97%). 2018).
2,0
But the situation is no better for other Anguilla species FIGURE 7
according to the IUCN Red List, with 6 of the 16 species Average change in abundance between 1970 and 2016 of monitored freshwater fishes migrating
Threatened, 4 Near Threatened, 4 Data Deficient and a) between fresh- and saltwater ( -73%; 1,016 populations of 138 species of fishes listed on GROMS as anadromous, catadromous,
1,5
only 2 Least Concern (IUCN 2020). The LPI for migratory amphidromous or diadromous) or
freshwater fish comprises 29 populations of 7 of these b) within freshwater only (-83%; 390 populations of 109 species listed on GROMS as potamodromous).
Index (1970 = 1)
1,0 anguillid species: A. anguilla, australis, dieffenbachii,
japonica, obscura, reinhardtii and rostrata, mostly from The white lines show the index values and the shaded areas represent the bootstrapped 95% confidence intervals.
0,5 Europe and North America. While this data set is nowhere
near complete, it paints a similar picture, with an average
decline of 92% between 1970 and 2016 (Figure 1). Over 2,0 A 2,0 B
0,0
60% of these populations are considered to be threat-
1970
1975
1980
1985
1990
1995
2000
2005
2010
2015
ened, specifically by habitat loss, exploitation and also 1,5 1,5
Years
climate change.
Index (1970 = 1)
Index (1970 = 1)
1,0 1,0
REFERENCES
0,5 0,5
ICES (2018) European eel (Anguilla anguilla) throughout its natural range.
IUCN (2020) The IUCN Red List of Threatened Species 2019-3.
0,0 0,0
Jacoby, D. & Gollock, M. (2014) Anguilla anguilla . The IUCN Red List of Threatened Species 2014: e.T60344A45833138. https://dx.doi.
1970
1975
1980
1985
1990
1995
2000
2005
2010
2015
1970
1975
1980
1985
1990
1995
2000
2005
2010
2015
org/10.2305/IUCN.UK.2014-1.RLTS.T60344A45833138.en. Downloaded on 07 March 2020.
Tsukamoto, K., Aoyama, J., and Miller, M. J. (2002) Migration, speciation, and the evolution of diadromy in anguillid eels. Canadian Years Years
Journal of Fisheries and Aquatic Sciences, 59: 1989-19989.
19 20FIGURE 8
BOX 5
Average change in abundance of monitored migratory
GOLDEN MAHSEER
2,0 A
freshwater fishes (GROMS-listed as anadromous,
catadromous, amphidromous, diadromous or 1,5
potamodromous) between 1970 and 2016 that are
Index (1970 = 1)
a) threatened (-94%; 290 populations of 116 species)
1,0
b) not threatened (+1171%; 175 populations of 83 species) and The Golden mahseer (Tor putitora) is a potamodromous fishing and over-exploitation, the future for sustainable
c) with unknown threat status (-71%; 941 populations of migratory fish that makes its home in the rivers of the mahseer populations looks dim. There is an urgent need
0,5
161 species). Himalayan region, within the basins of the Indus, Ganges to not only protect mahseer, but the freshwater eco-
and Brahmaputra rivers. These powerful swimmers travel systems that provide their food and necessary habitats
The white lines show the index values and the shaded 0,0 far and fast during their migrations upstream to reach to thrive and reproduce. Yet hope lies with the number
areas represent the bootstrapped 95% confidence their spawning grounds. Many questions remain about of possible solutions that have been tested or explored:
1970
1975
1980
1985
1990
1995
2000
2005
2010
2015
intervals. Please note that the y-axis scale is different for Years this mighty fish including their migration patterns, repro- education programs that focus on the ecosystem services
populations that are not threatened. ductive behaviors, recruitment dynamics, and critical hab- of rivers, conservation initiatives that benefit local com-
itats, as well as information how human activities impact munities, cooperative agreements among stakeholders
20 B 2,0 C these various components. Like other large migratory fish, that focus on the benefits of clean water and healthy
Golden mahseer are listed as endangered on the IUCN Red fish, ecotourism and recreational management plans that
15 1,5 List of Threatened Species. can provide local economic resources, protected area or
national park offset agreements with hydropower devel-
Index (1970 = 1)
Index (1980 = 1)
The increase of human development within the range of opers, and the application of less destructive sources for
10 1,0
mahseer has taken its toll, especially when so little data renewable energy. All these solutions will require pressure
exists on the biology and migration patterns of Golden for cooperation and action among scientists, conservation
5 0,5
mahseer. Hydropower projects continue to be built at a organizations, anglers, industry stakeholders, and most
rapid pace, and the associated construction impacts of significantly the local citizens who realize the true cost of
0,0
0 sand-mining, road building, siltation, etc., are detrimental losing this magnificent migratory fish.
1970
1975
1980
1985
1990
1995
2000
2005
2010
2015
to the health of all fish. Add in the stress of unregulated
1970
1975
1980
1985
1990
1995
2000
2005
2010
2015
Years Years
GOLDEN MAHSEER
THREATS In addition to identifying whether a population is affected
In the LPD, we record for each population whether it is by threats, the LPD allows for up to three threats to be
affected by threats, not threatened or whether its threat recorded for each population. They are grouped into broad
status is unknown, based on information given in the data categories, following the Red List classification (IUCN
source. This particular ‘threat status’ is specific to the 2020): habitat degradation and change, habitat loss, ex-
population, and does not correspond to the threat status ploitation, invasive species, disease, pollution and climate
for a species or “population” as recorded in the IUCN Red change (Figure A3). This more detailed information on
List (IUCN 2020). When dividing the data set in this way, population-level threats was available for 290 populations
we see that populations that are not threatened have in- of 116 species, totalling 414 recorded threats. While most
creased on average, while those affected by threats show populations were only reported to be affected by one
a serious average decline of 94% (Figure 8). Interestingly, threat, just over one-third mentioned multiple threats.
species populations with unknown threat status - where The most reported threat was habitat degradation and
no specific threat is mentioned in the data source, which change (40%), which together with habitat loss account-
is often the case with large-scale or multi-species papers - ed for nearly 50% of all reported cases (Figure 9a). The
show an average decline of -71% between 1970 and 2016. second most reported threat was overexploitation, which
In combination with the apparently increasing non-threat- accounted for around one-third of all threats (Figure 9a).
ened species populations, this indicates that populations At the regional level, habitat-related threats were most
with unknown threat status are also under pressure even often mentioned for Europe, North America, and Oceania,
though no threat information was not documented. while overexploitation was most commonly reported in
Africa and Asia (Figure 9b).
21 22FIGURE 9 But even the more prominent categories in the data set sub-categories of threats on the IUCN Red List (IUCN 2020)
The distribution of threats for monitored migratory freshwater fishes listed on GROMS as anadromous, catadromous, relating to habitat are not overly informative due in their but with a specific freshwater focus may help to disentan-
165 27 125 58 29 10
amphidromous, diadromous or potamodromous broadness. Habitats can be affected by a multitude of driv- gle these effects and identify the main drivers and any
a) globally and ers of change, including dam-building, other infrastructure regional differences. Clearly, much information is missing
b) for different regions. development, wetland drainage, floodplain disconnection, and needs to be added for more detailed analysis in future
165 27 125 58 29 10
over-abstraction of water, or sand-mining. A finer-scale updates to this indicator.
0% 10% 20% 30% 40% 50% 60% 70% 80% 90% 100%
Threat information was available for 290 populations of 116 species, totalling 414 recorded threats. The numbers in the reclassification of these broad threat categories akin to the
bars (brackets) correspond to the number of times a threat was listed (globally or in each region).
0% 10% 20% 30% 40% 50% 60% 70% 80% 90% 100%
THE 64 M HIGH GLINES CANYON DAM (AKA UPPER ELWHA DAM) DURING REMOVAL
Habitat degradation & change Exploitation Pollution © US National Park Service
Habitat loss Invasive species & disease Climate change
Habitat degradation & change Exploitation Pollution
A Habitat loss Invasive species & disease Climate change
165 27 125 58 29 10
0% 10% 20% 30% 40% 50% 60% 70% 80% 90% 100%
Europe (83)
North America (187)
Europe (83)
BLatin America & Caribbean (43)
Habitat degradation & change Exploitation Pollution
North America (187)
Oceania (36)
Habitat loss Invasive species & disease Climate change
Latin America & Caribbean (43)
Africa (37)
Oceania (36)
Asia (28)
Africa (37) 0% 10% 20% 30% 40% 50% 60% 70% 80% 90% 100%
Asia (28)
0% 10% 20% 30% 40% 50% 60% 70% 80% 90% 100%
While these figures give some indication of what is affect- amount of evidence of the current and future impact of
ing populations in this data set, they are not representa- climate change on migratory fish (Ficke et al. 2007), in-
Europe (83)
tive of the distribution of threats to all migratory fresh- cluding in the Oceania region, where millions of fish have
North America
water fish species globally (187)
and in different regions of the been lost in Australia over the past decade to drought and
world. Habitat degradation, alteration and loss, and over- flooding (Vertessy et al. 2019). Similarly, there is evidence
Latin America & Caribbean (43)
exploitation are undoubtedly serious issues for migratory of pollution and habitat loss causing particularly serious
freshwater fish, however other
Oceania (36)important threats have issues in many parts of Africa (O’Brien et al. 2019).
not been reported as often or are even absent from some
of the regions (FigureAfrica (37)
9a). For example, there is a large
Asia (28)
0% 10% 20% 30% 40% 50% 60% 70% 80% 90% 100%
23 24FIGURE 10 tivities, and which also shows the smallest overall average than unmanaged populations. However, managed pop-
Average change in abundance of monitored migratory freshwater fishes (GROMS-listed as anadromous, catadromous, decline of any region (Figure 6a). By contrast, unmanaged ulations in the LPD are still not increasing. Assuming
amphidromous, diadromous or potamodromous) between 1970 and 2016 that are species populations tend to be more evenly spread across that management interventions are indeed responsible
a) managed (-54%; 359 populations of 63 species) and regions. This issue is discussed in more detail in the ‘Re- for the difference in the trends, this suggests that they
b) not managed (-87%; 428 populations of 163 species). sults in context’ section below. may only be sufficient in slowing as opposed to reversing
declines in this particular selection of species. To identify
The white lines show the index values and the shaded areas represent the bootstrapped 95% confidence intervals. Lastly, it is worth noting that despite receiving some form successful interventions, we therefore examined consist-
of management attention, managed populations are still ently increasing populations in the LPD for which reasons
declining. There could be a number of possible reasons for this increase are coded into broad categories (such
2,0 A 20 B for this, for example that management activities may as management, legal protection or removal of threat).
be newly implemented, insufficient, ineffective or even This information is available for only a small number
1,5 15 inappropriate. Some strategies may even be detrimental, of populations and we show the results for each region
for example stocking can lead to genetic bottlenecking below (Figure 12). Increases recorded in the temperate
Index (1980 = 1)
Index (1970 = 1)
1,0 10
and is often carried out with hatchery-reared strains that regions of Europe and North America have been primarily
are less suited to the natural habitat and may negatively attributed to management (55% and 20% respectively)
impact wild strains of e.g. salmon. Overall, there is a great and unknown reasons (67% and 35% respectively), with
0,5 5
need to add management success data to model the removal of threats and legal protection playing a smaller
connection between population declines or increases and role. In tropical regions, the most common reasons were
0,0 0
management strategies. ‘unknown’ or ‘other’. In the majority of cases, these ‘other’
1970
1975
1980
1985
1990
1995
2000
2005
2010
2015
1970
1975
1980
1985
1990
1995
2000
2005
2010
2015
reasons were species with tolerance of higher salinity
Years Years REASONS FOR POPULATION INCREASE benefitting from climate-related changes in estuaries.
As seen in the previous section, managed populations Interestingly, 50% of 8 populations that are increasing
appear to show a smaller average decline in abundance in the Latin America & Caribbean region are benefitting
MANAGEMENT
Once threats have been identified, it may be possible to stocking, bycatch reductions and the establishment of no-
mitigate their effect on population trends through man- take zones. Habitat management - comprising restoration FIGURE 11
agement. For migratory freshwater fish species, these of habitat and connectivity, land use regulations and Management actions undertaken in managed populations of monitored migratory freshwater fishes (GROMS-listed as
management actions can comprise a variety of different water quality management - accounted for only 11% of anadromous, catadromous, amphidromous, diadromous or potamodromous). Management information was available
approaches, including management of fisheries, habi- recorded management activities, despite the prominence for 359 populations of 63 species, totalling 399 recorded management actions. The numbers in the chart correspond to
tat restoration, dam removal, setting up conservation of habitat-related threats (Figure 9). For around a third the number of times each management type was listed. Fisheries management includes fishing restrictions, stocking,
sanctuaries, species-focused management and legal of managed populations (35%), management activities bycatch reductions, supplementary feeding, no-take zones. Habitat management includes habitat restoration, habitat
protection. Information on whether a population is man- were ‘unknown’, i.e. no information was given about the management, connectivity restoration, land use regulations, water quality management. Legal protection includes
aged in this way is included in the LPD for each popula- nature of the management. Filling these knowledge gaps protected areas, species protection. Other includes management plan, removal of invasive species, threat management,
tion. We find that populations of migratory freshwater by going back to the relevant data sources would help tagging.
fish species that are recorded to receive some form of with building up a more complete picture of possible ways
management have declined less (-54%) than unman- in which declines in migratory freshwater fishes may be
aged populations (-87%, Figure 10). This suggests that reduced or reverted, or to establish which strategies may
management could potentially have a positive effect on not be associated with a positive trend. Fisheries management Legal protection Unknown
some populations. Fisheries management Legal protection Unknown
Habitat management Other
One issue to consider for the results for management pre-
Habitat management Other
In addition to recording whether or not a population is sented above is that other factors may have contributed
managed, the LPD also allows for these management to the observed difference, including life history charac-
actions to be described in more detail. Of the 359 popu- teristics, timing and efficacy of management, or differ-
lations of 63 species that were recorded as managed, the ences relating to the location of monitoring. The trends in
185 50 3 23 138
majority (327 or 91%) listed one management action (7% managed and unmanaged populations may, for example,
185 50 3 23 138
listing two, 2% listing three). When combining these man- be confounded by region. The majority of managed
agement activities into broader categories, we find that populations (80%) and species (51%) were monitored in
most are related to fisheries management (46%, Figure North America, where there is an abundance of fisheries 0% 10% 20% 30% 40% 50% 60% 70% 80% 90% 100%
11), which includes strategies such as fishing restrictions, management agencies, better records of management ac- 0% 10% 20% 30% 40% 50% 60% 70% 80% 90% 100%
25 26You can also read