ALTMETRICS FEASIBILITY STUDY - JUSER
←
→
Page content transcription
If your browser does not render page correctly, please read the page content below

Altmetrics Feasibility Study
Publication details
This report was prepared by:
Dr. Dirk Tunger, Andreas Meier (Forschungszentrum Jülich, Central Library)
Daniel Hartmann (Forschungszentrum Jülich, Project Management Jülich)

This report is a literal translation of the original publication (German):
Tunger, D., Meier, A. & Hartmann, D. (2017). Altmetrics Machbarkeitsstudie;
http://hdl.handle.net/2128/16419

Preparation period: May 2016 – November 2017

Contact: Forschungszentrum Jülich GmbH, Central Library, Bibliometrics Team
Email: zb-bibliometrie@fz-juelich.de
Tel: +49 2461 61-6198
Further information on bibliometrics in the Central Library is available at:
www.bibliometrie.de

Data sources
Database of the company Altmetric.com
Data as of: May 2017

Web of Science by Clarivate Analytics accessed via the data infrastructure
of the Competence Centre for Bibliometrics
Data as of: March 2017

Disclaimer
Liability for information services: The database providers, database operators, and the Central Library of
Forschungszentrum Jülich accept no responsibility for the accuracy or completeness of the results of
searches. In principle, no liability is accepted for damages incurred as a result of technical disturbances or
operational restrictions (except in cases where this is prescribed by law).

Order number Forschungszentrum Jülich
DZA.03446

BMBF ref. no.
421-47025-3/2

Please cite this report as follows:
Tunger, D., Meier, A. & Hartmann, D. (2017). Altmetrics Feasibility Study; http://hdl.handle.net/2128/19648

                                           This report was compiled on behalf of the German Federal
                                           Ministry of Education and Research (BMBF).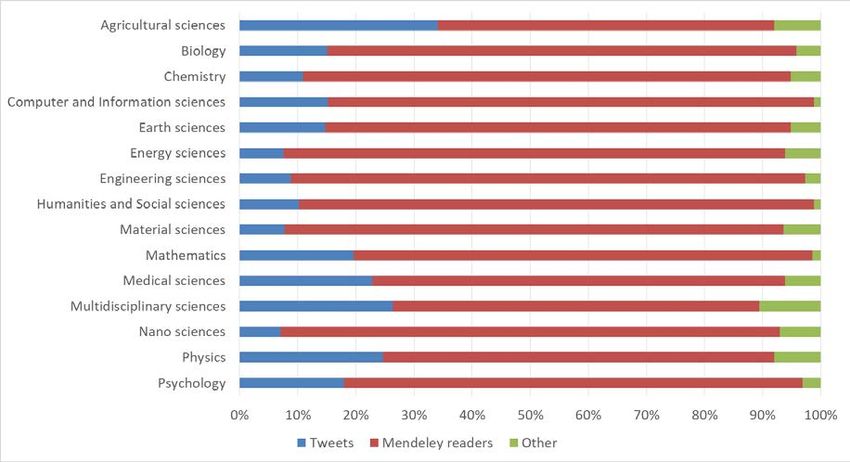
Content

List of Figures                                                     4

List of Tables                                                      4

1.   Executive Summary                                              1

2.   Background and project development                             3

3.   Scientific context of altmetrics                               5

4.   Results                                                        8

4.1 Quantitative data analysis                                      8

4.2 Qualitative statements based on interviews                     15

5.   Discussion of results                                         20

5.1 Overview of the political prospects of altmetrics              20

5.2 How can research policy use altmetrics?                        22

5.3 Conclusion on the use of altmetrics                            25

References                                                         28

Annexes                                                            30

A1: Overview of the sources on Altmetric.com and their weighting   31

A2: Brief portraits of the interviewees                            32

A3: Interview protocols (in German)                                33
List of Figures

Fig. 1: Example of an Altmetric donut and its composition .............................................. 6

Fig. 2: Coverage of the DOIs of German science organizations on Altmetric.com........... 9

Fig. 3: Comparison of the proportions of the disciplines in WoS and on Altmetric.com
(based on DOIs, 2013);................................................................................................. 10

Fig. 4: Distribution of altmetric perception in the individual disciplines (Tweets, Mendeley
readers, and other) ....................................................................................................... 11

Fig. 5: Distribution of altmetric perception in the individual disciplines (news items, policy
documents, Facebook posts, and other) ....................................................................... 12

Fig. 6: Publication profiles of German science organisations according to disciplines ... 14

Fig. 7: Significance and application maturity of altmetrics (arranged by the authors)..... 16

List of Tables

Tab. 1: Number and proportion of DOIs in WoS and on Altmetric.com (2013–2015) ....... 9

Tab. 2: Distribution of altmetric perception across individual sources (number of
documents with at least one mention in the respective category). ................................. 13

Tab. 3: Weighting of mentions according to source type (as of 28 November 2017) ..... 31
Altmetrics Feasibility Study   1

1.    Executive Summary

“To what extent and in what way does it make sense to use altmetrics in science policy and
science management?”

This is the key question that this study focuses on. The aim is to enable a comprehensive
and detailed representation of altmetrics from different perspectives of the science system.
In addition to the perspective of scientific literature, the results incorporate our own data
analysis and expert opinions expressed in interviews.

The approach of using altmetrics to measure the communication of research within the
science community and beyond, into society, is currently the subject of debate. The
introduction of “alternative metrics” (altmetrics) is at the centre of current discourse about
whether or not the focus on classic bibliometric indicators, and therefore the conventional
system of peer-review journal publications, still reflects the true impact of scientific research
in the Internet age.

Quantitative data analysis in this study revealed that an increasing number of scientific
publications are cited, discussed, liked, and Tweeted in social media, and also distributed via
other Internet sources. This shows that the importance of social media in the scientific context
is growing.

To answer the key question about using altmetrics in the science system, a distinction is
made between applications in evaluation, science itself, public relations work, and libraries.
In order to permit a well-founded overall judgement, this study is based on quantitative data
analysis as well as expert interviews and the scientific state of the art. All factors relevant to
a reliable feasibility study are thus included in this analysis.

The study reveals that altmetrics are not yet suitable for use in evaluations because the
indicator system and availability of data currently do not permit this. This is also linked to the
discussion about a reward system in science: in contrast to bibliometrics, which are
concerned with the analysis of scientific publications by analysing direct scientific output, the
resonance of science on social media is not at the heart of this reward system.

Although altmetrics should not currently be used for science evaluation, there are already
fields in which their application is possible and meaningful. This includes science itself, public
relations, and libraries. The main application is to illustrate visibility on the level of individual
publications.
Altmetrics Feasibility Study   2

Altmetrics are still at an exploratory stage and have far to go before they can make a regular
contribution to quantitative science indicators. The scientific debate over the past few years
has led to altmetrics achieving the significance and application maturity required for initial
applications. However, they must be developed further for more extensive applications,
particularly those that go beyond the significance of individual publications and aggregate
various levels of data. Altmetrics represent communication with a very high significance in
science and that increasingly reaches beyond scientific journals. This is why targeted rewards
could boost the use of social media. This would also help consolidate the position of altmetric
analyses. Improved communication of science into society could be a tangible objective.

Altmetrics Feasibility Study   3

2. Background and project development

The altmetrics approach is debated with respect to the communication of research findings
within the scientific community and into society at large. The introduction of altmetrics is at
the centre of current discourse about whether or not the focus on classic bibliometric
indicators still reflects the true impact of research work in the Internet age. During the course
of this discussion, the term “altmetrics” was coined as a collective term for alternative
indicators which consider the perception of web-based communication beyond the
conventional peer-review method. These indicators reveal who cites, discusses, or shares
scientific publications in the national press, social media, policy documents, and other web-
based sources, and who is concerned with publications both within the science system and
beyond. The intuitive and much-discussed potential of altmetrics is pitted against a number
of questions, which are addressed and clarified in this study:

To what extent and in what way does it make sense to use altmetrics in science
policy and science management?

This question is at the heart of this study. In what way are altmetrics currently used, what
findings do they reveal, and where do bottlenecks loom? Should the use of altmetrics in
science policy and science management be encouraged? The key objective of this feasibility
study is to find answers to the above questions as well as to create a basis for discussion
about applying and using altmetrics in Germany.

The first part of the study is concerned with the scientific context of altmetrics (Section 3).
The focus is on what application options have already been identified and scientifically
investigated. For this purpose, the current state of the scientific literature is compiled and
matched to an overview of current challenges. The aim is to develop an understanding of
altmetrics that is compatible with a dedicated consideration of the options for application in
the context of science policy.

Section 4 is the main part of the study and comprises results from quantitative and qualitative
analyses.

The quantitative analyses are based on analyses conducted by the Jülich project team
supported by data partner Altmetric.com. The analyses are primarily inspired by the annual
pact monitoring indicator report 1 and comprise an analysis on the level of science
organizations in Germany. They also illustrate the extent of Altmetric.com as a data source

1   The 2017 indicator report (in German) is available at: http://hdl.handle.net/2128/16265

Altmetrics Feasibility Study   4

as well as discipline-specific publication profiles based on Web of Science for comparison.
These analyses are introduced to the study to create an independent representation of the
data situation that is not influenced by third parties. It must be emphasized that the
investigation’s explicit focus is the significance and suitability of altmetrics on an institutional
level, as opposed to representing a benchmark for the corresponding institutions.

For the qualitative analysis, five expert interviews were conducted to obtain insights from a
diverse range of perspectives and to reflect the group’s own results. The interviewees include
scientists and individuals from the practice-oriented sphere of altmetrics. In preparation for
the interviews, the team’s research and analyses were supplemented by the service
provider’s own point of view during a visit to our data partner in London.

Section 5 is a summary of all results, compiling an evaluation of the application maturity and
significance of altmetrics as well as presenting recommendations for action and outlining
possible development paths. This report thus represents a basis for discussion for this
dynamic and emerging field.
Altmetrics Feasibility Study   5

3. Scientific context of altmetrics

In 2017, the altmetrics community was able to look back on more than six years of research.
On the one hand, the visibility and presence of altmetrics are quite impressive (cf. Haustein,
2016a) because they are used as marketing tools by many scientific publishers – more than
300 publications on the subject have appeared, and there are even conferences dedicated
solely to altmetrics. On the other hand, there is no uniform definition of the term, and therefore
no consensus on what exactly is measured by altmetrics and what conclusions can be drawn
from the results (Haustein, 2016b; Franzen, 2017; Butler et al., 2017).

A semantic analysis of contributions in social media is lacking for the most part, which is a
major issue making the evaluation of altmetrics counts so difficult. Mentions are mostly
counted based on identifiers such as the DOI 2. However, it is not possible to mass evaluate
which mentions should be deemed as positive and which should be deemed as negative,
which means that a “performance paradox” develops (Meyer and Gupta, 1994). This problem
exists in a similar form in classical bibliometrics and must be considered an inherent problem
of the use of quantitative metrics (Holbrook et al., 2013). Furthermore, the coverage of
scientific publications is relatively low and the distribution varies significantly both across
disciplines and across platforms. Haustein et al. (2015) found that 21.5 % of all scientific
publications from 2012 available in Web of Science were mentioned in at least one Tweet,
while the proportion of publications mentioned in other social media was less than 5 %. In
comparison, 67 % of these publications were cited in Web of Science at least once. These
findings are verified by our own analyses, with a positive tendency (see Section 4.1). Among
the scientific disciplines, there are also strong variations concerning the coverage at
Altmetric.com: publications from the field of medicine are represented considerably more
often than, for example, publications from the engineering sciences (see Section 4.1).
Differences in coverage appear to benefit the humanities in particular. While the humanities
are scarcely considered in established databases such as Web of Science, their coverage is
considerably greater in the field of altmetrics, according to a study conducted by Hammarfelt
(2014): over 61 % of the investigated publications in this field have at least one reader on
Mendeley and more than 20 % have already been discussed on Twitter.

In general, the data basis underlying altmetrics is often problematic: the reproduction of data
is almost impossible because data providers change or disappear completely or modify their
data basis (Haustein et al., 2014). Platforms such as Weibo or LinkedIn, which used to be

2 Mentions in the fields of news and policy documents were analysed using a text mining algorithm.
In addition to the DOI, metadata (author names, date of publication, etc.) in the text are recorded and
assigned to the respective publications (Altmetric.com, 2017).

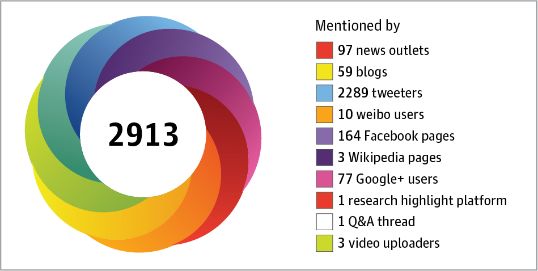
Altmetrics Feasibility Study   6

included in the sources covered by Altmetric.com, are now no longer analysed since these
data providers no longer grant access. 3 Quality control, such as a validity check of accounts
or the clean-up of duplicates, rarely occurs on social media platforms, and therefore
complicates the aggregating and filtering of data for altmetrics providers (Thelwall, 2014). A
study by Fraumann et al. (2015) ascertained that duplicates can be found in several types of
sources on Altmetric.com, which makes the credibility of the attention score uncertain.

This attention score is currently used by many scientific publishers and institutions as a
marketing tool in the form of the “Altmetric donut”. The Altmetric donut is implemented on the
websites of the journals Nature and Science among others, and in the repositories of the
universities of Cambridge and Zurich. The composition of the attention score is based on an
algorithm that adds up the attention – weighted differently – paid to scientific output in diverse
sources (see Fig. 1) 4. This is a trend which is regarded sceptically in science, with the
Altmetric donut being viewed as a successful gimmick, but one that is meaningless for
science (cf. Franzen, 2017). Simply adding
up counts in a single metric is “impossible
and undesirable” (European Commission,                Fig. 1: Example of an Altmetric donut and its
2017a). The attention score does not,                                 composition

therefore, represent the impact of scientific
performance, but it is suited to filtering out
the articles that have sparked interest on
social media (Warren et al., 2016; European
Commission, 2017b).

With regard to the practical application of altmetrics in research policy, science evaluations,
and management, the specialist literature is overwhelmingly sceptical. Bornmann and
Haunschild (2016) stress the problematic nature of the matter, namely that altmetrics should
first conform with the Leiden Manifesto for research metrics (Hicks et al., 2015) before being
applied on a greater scale. The key difficulties associated with altmetrics are presented,
namely that there are currently no standardized indicators, that altmetric data are for the most
part not accessible in a transparent and open manner, and that numbers can be manipulated
through “gaming”. Gaming is a term which describes the targeted manipulation of data for
the purposes of achieving better altmetric values. Such gaming activities are negative side
effects of an orientation towards user statistics in evaluation practice (cf. Franzen, 2017).
However, in spite of the difficulty in consistently and unambiguously distinguishing gaming
from marketing, Altmetric.com is trying to minimize gaming. For example, obvious

3Data compiled to date for these sources are still available (Altmetric.com, 2017).
4An overview of all analysed sources and their weighting in the attention score is available in
Appendix A1.
Altmetrics Feasibility Study   7

manipulations of Altmetric scores are manually removed or limited through spammer lists
(Altmetric.com, 2017). Gaming is also a problem beyond the sources assessed by altmetrics
service providers: in a study by Meier and Tunger (2017a), it was clearly shown that it is
possible to considerably influence the metrics specially developed by the ResearchGate 5
platform, the RG score 6. The authors found that even without any scientific publications, it is
possible within a relatively short time to achieve an RG score that is higher than the RG
scores of half of all ResearchGate users solely through gaming.
In another study for the European Commission (2017b), Holmberg found that altmetrics are
not yet practically applied in the EU for the purposes of science evaluation. In his view, such
practice on a wide scale would be premature as long as it remains unclear what altmetrics
actually measure.

In terms of the qualitative evaluation of scientific output, altmetrics should not generally be
viewed as a replacement for the conventional peer-review procedure; they should instead be
viewed as an option for obtaining a second opinion and additional information (Wouters et
al., 2015; Butler et al., 2017). A report by the Expert Group on Altmetrics compiled on behalf
of the European Commission also argues in favour of classical bibliometrics offering
“complementary approaches to evaluation” together with alternative metrics (European
Commission, 2017a). In addition, the expert group sees potential for including a wider
audience beyond the closed science system and for gathering information considerably faster
than with conventional metrics. Furthermore, the idea of this approach is not limited to
conventional scientific publication formats but offers the perspective of making data sources
such as software and data sets accessible (e.g. as part of research data management).

5 ResearchGate is one of the largest social networks for scientists and has more than 14 million
users worldwide (as of: 30.11.2017, https://www.researchgate.net/about).
ResearchGate does not share any data with altmetrics service providers and is therefore not one of
the sources analysed.
6 The RG score is intended to measure the “scientific reputation” of ResearchGate users. It is

influenced by the impact of a user’s own scientific publications but also to a large degree by their
social activities on the platform (https://www.researchgate.net/RGScore/FAQ).
Altmetrics Feasibility Study   8

4. Results

This Section represents the main part of the study and comprises the key results from
independent quantitative data analyses and qualitative expert interviews. The quantitative
analyses combined with a workshop with data partner Altmetric.com form the basis of the
interviews. Impulses and ideas from the interviews were echoed in the subsequent talks and
reflected in the fine-tuning of the data analysis.

The present study is therefore the result of a process shaped by several phases of reflection,
which – particularly due to the exploratory nature of this study – is a decisive characteristic
for the conclusion.

4.1    Quantitative data analysis

The data analysis presented below not only makes it possible to evaluate the use of altmetrics
in research policy based on literature and qualitative analyses but also to verify these
analyses by means of concrete assessments of available data. The complete Web of Science
publication years 2013–2015 were matched with the data basis of Altmetric.com. To this end,
the Web of Science data basis was requested from the local database instance of the
Competence Centre for Bibliometrics 7, which is the basis of all analyses in this section. The
advantage of this data basis is not only in its local availability but also the existing unambiguity
of affiliations. This permits analyses to be conducted on the level of science organizations,
similar to the annual pact monitoring indicator report (Mittermaier et al., 2017).

Each analysed year (2013–2015) featured around 1.6 million publications (which have a DOI)
in WoS. These publications registered in WoS represent close to 70 % of the entire
publication output of these years and form the basis of our subsequent investigations. There
were no restrictions in terms of document types in WoS, meaning that the entire data basis
was analysed. Matching the WoS data to the data basis of Altmetric.com revealed that the
percentage of WoS publications on Altmetric.com rose from 33.4 % in 2013 to 42.2 % in 2015
(see Tab. 1). This means that the proportion of publications for which altmetric data are
available is drawing ever closer to the 50 % mark. A logical conclusion is that the significance
of scientific publications on social media is growing and therefore also the opportunities for,
interest in, and necessity of analysing these data in a meaningful way. At this point, it must
be noted that questions concerning, for example, the impact of science on society have so

7The Competence Centre for Bibliometrics is a BMBF-funded project (funding reference no:
01PQ17001); for further information, please visit www.bibliometrie.info.
Altmetrics Feasibility Study 9
far not been answered using bibliometric methods. This is where altmetrics come in and might
lead to new opportunities.
2013 2014 2015
WoS publications with DOI 1,586,101 1,625,593 1,635,465
Publications with Altmetric.com 529,392 596,484 690,535
feedback
Proportion 33.4 % 36.7 % 42.2 %
Tab. 1: Number and proportion of DOIs in WoS and on Altmetric.com (2013–2015)
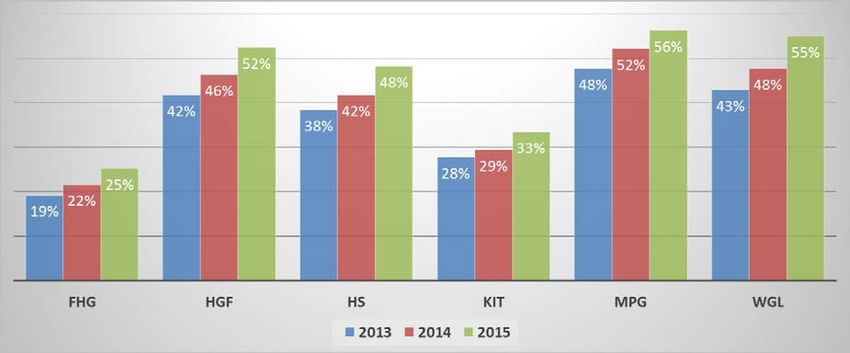
Fig. 2: Coverage of the DOIs of German science organizations 8 on Altmetric.com
How is social media resonance distributed across the individual science organizations of the
German science system and how does this change over time? We know from bibliometric
distribution patterns that typical distribution trends are not linear but skewed (cf. Haustein and
Tunger, 2013). Fig. 2 illustrates that the proportion of the altmetric feedback is much higher
for MPG publications than, for example, FHG publications: while 50 % of MPG publications,
on average, achieve perception in the sources of Altmetric.com, only around 20 % of FHG
publications do so. It must be noted that WoS as a publications database also contains
publications which have not yet received any citations, i.e. which do not generate any
resonance in the bibliometric world. A skewed distribution also applies to this process – even
on the level of the science organizations.
The uneven distribution of the original publications across the feedback of the analysed
altmetric data set means that distortions may occur in the representation of science
organizations. This is comparable to different citation rates in various bibliometric disciplines.
While bibliometrics corrects this by means of normalized indicators, such a model is not yet
8 FHG: Fraunhofer Society, HGF: Helmholtz Association (excl. KIT), HS: universities and universities
of applied sciences, KIT: Karlsruhe Institute of Technology, MPG: Max Planck Society, WGL:
Science Association Gottfried Wilhelm LeibnizAltmetrics Feasibility Study 10
conceivable in altmetrics since no indicators or corresponding interpretation have been
determined to date.
A differentiated consideration, according to disciplines, reveals potential distortions in
multimedia resonance. The low FHG proportion is in agreement with the observation that
engineering sciences are generally less active on social media while this proportion is very
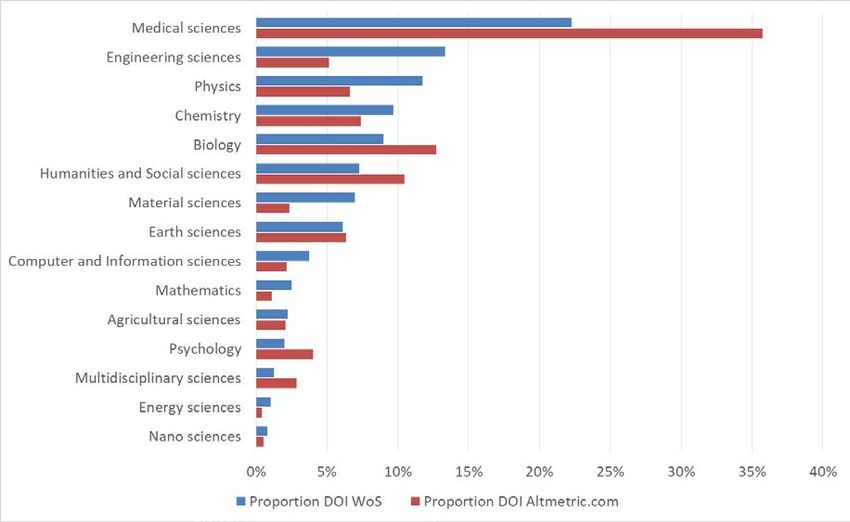
high in medical science compared to other disciplines. This is shown clearly in Fig. 3: The
distribution of DOIs for the year 2013 9 (proportion of WoS DOIs) is shown in red, based on
the allocation of publications to WoS subject categories and subsequent aggregation using
a classification according to the main disciplines. The respective proportions of altmetric
resonance (proportion of Altmetric.com DOIs) are depicted in blue. The disciplines are
allocated according to the underlying scientific publication and the allocation is absolutely
comparable to the proportions of DOIs in WoS. 10 The statistical population is formed from all
WoS publications from the year 2013 that have a DOI as well as the resulting proportion of
feedback with corresponding data in the data basis of Altmetric.com. Multiple classifications
can lead to values over 100 % when added up.
Fig. 3: Comparison of the proportions of the disciplines in WoS and on Altmetric.com (based on
DOIs, 2013); sorted by the proportion of DOIs in WoS (red)
In addition to medicine, the humanities benefit greatly from altmetrics. While this discipline
has a relatively low proportion in WoS, the proportion of publications mentioned on
9 The analysis for the year 2013 serves as an example to illustrate the distributions. Analyses for the
years 2014 and 2015 would not differ greatly.
10 Altmetric.com serves as the data basis for altmetric feedback.Altmetrics Feasibility Study 11
Altmetric.com is higher. This result also reflects the perception of Hammarfelt (2014) (see
Section 3). The observation that DOI coverage varies between disciplines was confirmed by
the analyses of Altmetric.com and the University of Cambridge (Wastl, 2017; Altmetric, 2017).
Some disciplines (e.g. engineering sciences) are rarely discussed on the social media
platforms covered. This reveals parallels to the discipline-specific distribution of output and
citations in WoS, which are described in more detail by Haustein and Tunger (2013).
Mechanisms of the news values theory also underlie this observation (see Section 5.2).
As described at the beginning, altmetrics counts are made up of various sources. Fig. 4
shows an approach to localizing the two most important sources according to citation
frequency, Mendeley and Twitter.
Fig. 4: Distribution of altmetric perception in the individual disciplines (Tweets, Mendeley readers,
and other 11)
Fig. 4 shows that the majority of mentions across all disciplines can be attributed to Mendeley
(60–90 %). It must be noted, however, that Mendeley does not influence the Altmetric score
– in spite of, or because of, its large proportion of mentions (see weighting of Altmetric score
in Annex A1). In terms of numbers, Twitter also has a dominant role with multiple times more
counts than all other sources. This underlines the conclusion that the Altmetric score is
11 The distribution of the other sources is shown in Fig. 5.Altmetrics Feasibility Study 12
primarily driven by Twitter – particularly in light of the fact that one Tweet is weighted as 1
(see Annex A1).
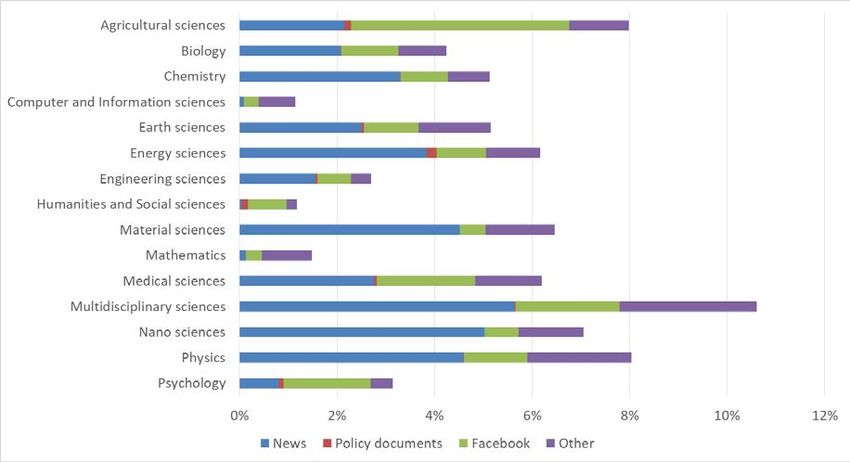
Fig. 5: Distribution of altmetric perception in the individual disciplines (news items, policy documents,
Facebook posts, and other 12)
Figures 4 and 5 show the distribution of altmetric perception in the individual disciplines,
differentiated according to the individual social media platforms. In addition to the existing
observation that Mendeley represents the largest proportion (~ 60–90 %), followed by Twitter
(~ 7–34 %), the importance of other document types is also visible on Altmetric.com. For
example, it is apparent that the proportion of news items is very high (~ 6 %) for
multidisciplinary journals (Nature, Science, …). This in turn could be an indicator that reflects
a societal tendency towards showing great interest in interdisciplinary, cutting-edge research
that is associated with these journals. At this point, it should be scrutinized whether the high
proportion of news items for Nature and Science is due purely to scientific interest in cutting-
edge research or whether the dominant position of individual scientific journals is conferred
from a traditional to a new system. Physics, nanoscience, and materials sciences display a
similar proportion of news items (~ 5 %) while the humanities are not mentioned at all. Due
to the fact that mentions in news items are weighted with 8, and therefore have the largest
influence of all types of sources on the Altmetric score, the proportion of news items is
essential (see weightings in Annex A1).
12
Other sources include a small proportion (max. 3 %) of the following: blogs, peer reviews, Weibo,
Wikipedia, Google+, Reddit, research highlight platforms, Stack Overflow, and YouTube.Altmetrics Feasibility Study 13
2013 2014 2015
No. of docs Propor- No. of docs Propor- No. of docs Propor-
with at least 1 tion of with at least 1 tion of with at least 1 tion of
mention in the total mention in the total mention in the total
category category category
News items 38,888 2.5 % 48,818 3.0 % 62,352 3.8 %
Blog posts 42,805 2.7 % 46,754 2.9 % 48,424 3.0 %
Policy documents 13 14,284 0.9 % 10,662 0.7 % 6,664 0.4 %
Tweets 383,183 24.2 % 478,446 29.4 % 577,442 35.3 %
Peer reviews 5,595 0.4 % 6,828 0.4 % 6,241 0.4 %
Weibo posts 418 0.0 % 3,994 0.2 % 2,154 0.1 %
Facebook posts 106,426 6.7 % 98,046 6.0 % 160,830 9.8 %
Wikipedia pages 19,046 1.2 % 16,524 1.0 % 13,490 0.8 %
Google+ posts 18,924 1.2 % 20,223 1.2 % 21,293 1.3 %
LinkedIn posts 69 0.0 % 7 0.0 % 0 0.0 %
Reddit posts 5,159 0.3 % 5,958 0.4 % 10,117 0.6 %
Pins 164 0.0 % 1 0.0 % 1 0.0 %
Research highlight 11,776 0.7 % 8,659 0.5 % 6,805 0.4 %
platforms
Q&A threads 946 0.1 % 831 0.1 % 571 0.0 %
Videos 3,437 0.2 % 3,176 0.2 % 2,841 0.2 %
Syllabi 0 0.0 % 1 0.0 % 5 0.0 %
Mendeley readers 499,439 31.5 % 550,332 33.9 % 618,982 37.8 %
WoS publications 1,586,101 1,625,593 1,635,465
with DOI
Publications with 529,392 596,484 690,535
Altmetric.com
feedback
Tab. 2: Distribution of altmetric perception across individual sources (number of documents with at
least one mention in the respective category).
The distribution is uneven across the science organizations not only in terms of feedback but
also how publications are distributed across social media platforms, when it comes to
publications that were mentioned at least once on the respective platform: Mendeley has the
largest share at 31.5–37.8 %, followed by Twitter at 24.2–35.3 %. This means that, in relation
to the total number, around 35 % of the 1.6 million WoS publications from 2015 also induced
Tweets, and roughly 38 % were registered with Mendeley (see Tab. 2, please note that
publications may be attributed several times).
In terms of the coverage of WoS publications in Mendeley, Bornmann and Haunschild report
values of around 90 % in contrast to the less than 40 % we measured. This deviation is due
to the different approach to data collection: While Haunschild and Bornmann (2016) directly
retrieved WoS DOIs from Mendeley via an API, Altmetric.com retrieves DOIs from the other
sources, excluding Mendeley (i.e. Twitter, Facebook, blogs, …), and then retrieves
information for them from Mendeley. The reason for this is the Altmetric.com workflow: Web
13 We can only speculate over the reason for the annual decrease in the number of documents with
mentions in policy documents. The most likely assumption is that it takes several years for
publications to be mentioned in policy documents. Therefore, newer publications are mentioned less
often than older ones. Altmetric.com also found this assumption to be the most plausible
(Altmetric.com, 2017).Altmetrics Feasibility Study 14
of Science and Scopus data are not available for this application. Naturally, this approach
leads to differences in the consideration and the result.
Fig. 6: Publication profiles of German science organisations according to disciplines
(based on WoS and Altmetric.com, 2013)
The scientific priorities of a science organization can be determined easily from its publication
profile, as depicted by the red line in the diagrams above. These reveal a high publication
rate by Fraunhofer and KIT in the fields of physics, engineering, and materials science. MPG
generates a large proportion of publications in physics, bioscience, and chemistry, while HGF
has a large publication output in physics, medicine, and geoscience, and WGL in medicine,
bioscience, and geoscience. The publication proportion reflects the percentage of one
science organisation’s WoS publications in one discipline compared to the overall publication
output of this science organisation. In contrast, the blue line represents the proportion of
perception received by the publication output of a science organisation from WoS (red line)
on social media. The discipline-specific classification is based on the allocation of the originalAltmetrics Feasibility Study 15
publications to disciplines (see also Fig. 3). This reveals in which disciplines the proportion
of altmetric perception is higher or lower than expected based on the publication proportion
in WoS. For example, the perception of FHG, WGL, and HGF in medicine is significantly
higher than expected; the same applies to the perception of all science organizations in
bioscience. These figures clearly show the previously mentioned perception of KIT and FHG
in engineering science, which is well below the publication average. This representation must
not be understood as a judgement but as a description of the distribution of altmetric data in
the source used: the quantitative analysis gives insights into the nature and representation
options of the data basis. For example, we also investigated whether open access (OA)
publications are more readily disseminated via social media than publications that are not
freely available. This is not the case. While OA publications make up around 11 % of the
statistical population of all WoS publications with a DOI in the years 2013–2015, the
proportion of feedback from Altmetric.com is approximately 14 % and therefore not
significantly higher than in the statistical population.
The findings from the quantitative analysis will be expanded in the following by means of a
qualitative analysis based on expert interviews.
4.2 Qualitative statements based on interviews
The following results are based on five guideline-supported interviews and a two-day
workshop with data partner Altmetric.com. In selecting the interviewees, particular attention
was paid to covering heterogeneous perspectives of scientific discourse as well as the user
side. This selection represents the subject area from different points of view. Brief profiles of
the interviewees can be found in Annex A2. The protocols of the interviews are available in
Annex A3 (in German).
Emphasis was placed on overarching issues of application and development of this emerging
field, explicitly excluding scientific details.
In analogy to the guidelines, this section is subdivided into three thematic blocks:
• Question block I: personal perspective of altmetrics
• Question block II: application areas in research policy and science management
• Question block III: future potential and development prospects
Interviewee perspectives of altmetricsAltmetrics Feasibility Study 16
The individual perspectives compiled by means of an exploratory approach divert from each
other with regard to the interviewees’ estimates of the validity and applicability of altmetrics.
Within the scope of the interviews, however, sufficient overlap was achieved to gain a
comprehensive overall picture from the various points of view. For illustration and summary
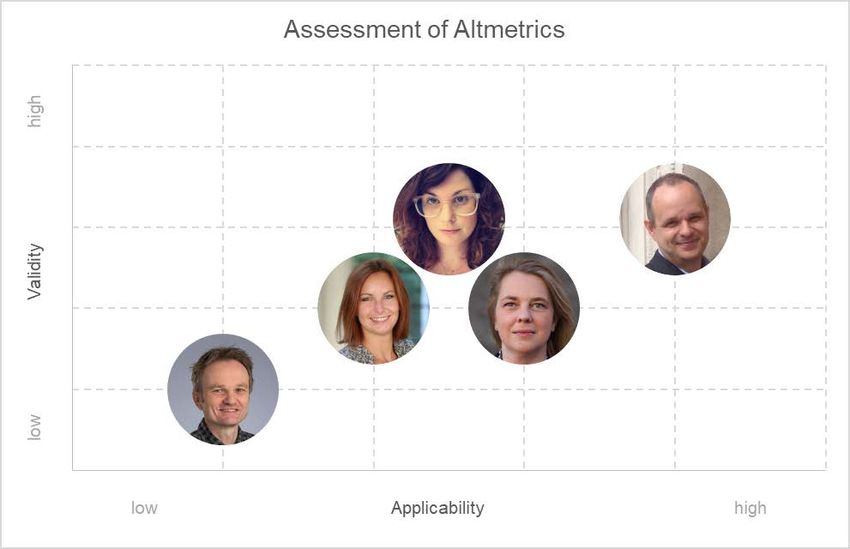
purposes, the interviewees are arranged according to their estimate of the significance and
application maturity of altmetrics in the figure below 14.
Fig. 7: Significance and application maturity of altmetrics (arranged by the authors)
From left to right: Lutz Bornmann, Isabella Peters, Stefanie Haustein, Martina Franzen, and Jürgen Wastl.
Brief profiles of the interviewees can be found in Annex A2.
Significance of altmetrics
In summary, it should be noted that the opinions on significance differ less than the opinions
on application maturity 15. The significance is estimated to be in a low to medium range.
Isabella Peters explicitly emphasized that “high expectations have been consolidated [with
regard to the developmental state].” The initial euphoria in the field, focusing on the far-
reaching potential – including measuring the social impact and performance evaluation of
science – seems to have abated. A multitude of scientific investigations have contributed to
this trend, introducing a wide range of problematic issues concerning the significance of
altmetrics. Section 3, which concerns the scientific context of the topic, summarizes the
14 The interviewees were arranged according to their statements in the respective interviews by the
authors of this report.
15 The latter are discussed against the backdrop of research policy in the following section.Altmetrics Feasibility Study 17 degree of coverage and representativeness, gaming, validity, and information underlying the numbers. These issues were also mentioned in the interviews, with various foci. There was seeming consensus that altmetrics should not be seen as an alternative to bibliometrics; instead, they represent a new perspective on the communication of and about science in social media. Perception and “popularity” are emphasized in this context. In contrast, the scientific quality or excellence is reflected poorly, as just one factor amongst many, which only partly has a positive correlation with perception. This contradicts the principle of bibliometrics, which is based on an inherent and peer-review-based approach to evaluating science. Comparisons between bibliometrics and altmetrics can thus be considered inappropriate. Several interviewees mentioned the need for other [science-reflective] disciplines, such as science sociology or philosophy (cf. Franzen), and in-depth analyses of the motivations underlying social media activities. This view matches the perception expressed by Altmetric.com, which explicitly emphasized that the data basis reflects only the perception, and therefore represents an initial starting point for more thorough analyses. How significant the data are, however, can only be determined in a subsequent step. On the one hand, several interviewees stressed that the “instruments used in bibliometrics (normalization etc.)” can be transferred in a targeted manner (Bornmann). On the other hand, the bibliometric focus in the analyses was criticized because altmetrics are more of a “window into another world beyond the citation system and the science community” (Peters) and should be used as such. Although the peer-review process remains central to science, altmetrics only cover “what is not visible for bibliometrics” (Haustein). Against the backdrop of current research projects, whose main objectives are comparisons of bibliometric analyses with altmetrics, for example using Mendeley counts, it should also be questioned what added value could thus be created (Franzen, Haustein). On the basis of the “ample data” (Bornmann), the objective is to specifically achieve communication beyond that within the science system.
Altmetrics Feasibility Study   18

Application areas in research policy and science management

In accordance with the questions presented in Section 2, the association with research policy
and science management also represents the primary pillar in the interviews. Furthermore,
guiding principles are addressed with regard to the extent to which, and the manner in which,
politics can and should support developments. A key to gaining relevant insights in the long
run is primarily based on the extent of the experience that can be exploited by this application.

Application maturity of altmetrics

In contrast to the significance of altmetrics, the expert opinions differ more widely between
each other with regard to their application maturity (see Fig. 7). To some extent, this can be
attributed to the more widely differing expectations: should altmetric characteristics be a
purely quantitative indicator, or do they represent a starting point for qualitative analyses?
Furthermore, the fields of application are very wide-ranging and also include marketing
activities which currently have less significance for research policy.

Against the backdrop of these heterogeneous perspectives on the topic, there is, however, a
consensus concerning one key issue: altmetric characteristics cannot currently be interpreted
as stand-alone and quantitative indicators. In particular, the interviewees agreed
unanimously that altmetrics do not represent a scientific data basis, which is a prerequisite
for evaluating science. Lutz Bornmann also hypothesized that it is the responsibility of
science to advise against such applications. With regard to control effects, Isabella Peters
also stresses that “no one [...] [should] receive funding because his post was (re-)Tweeted
5,000 times”. Performance cannot be assessed using such conclusions (Haustein), although
altmetrics can contribute an initial indicator to qualitative evaluations (cf. Wastl). In their
current form, all experts interviewed advised against using altmetrics in research evaluation.
These opinions agree with the findings from the practice-oriented literature discussed in
Section 3.

In terms of drawing conclusions from this hypothesis, however, opinions differ greatly over
what role politics should play and in what way altmetrics can be used for research policy: in
four of the five interviews, politics was accorded an active – if varying – role in shaping this
process. Jürgen Wastl attributed the most active role to politics: He says the essential
objective is that politics “fix demands and articulate research issues”, i.e. to create an
overarching    and   binding   framework     for   application.   Subsequently,     Wastl     sees
implementation as the responsibility of the science organizations, which would have a
corresponding mandate through political requirements. Due to the exploratory developmental
Altmetrics Feasibility Study   19

state, however, he views politics as being responsible for showing an openness and
sensitivity in terms of reacting to the insights that can be gained through altmetrics.

From a sociological point of view, Martina Franzen stressed that this would be an
experimental system and that learning through trial and error would be important. She thinks
that actively dealing with the topic would lead to a gradual opening of the “black box”.
Similarly, all interviewees agreed that scientific reflection, theory development, and in-depth
analyses are an integral and indispensable part of the process of generating insights. This
particularly includes openness to results which may indicate that altmetrics are not, in fact,
usable for research evaluation in the long term.

When examining the application options, a major aspect was to actively shape the process,
for example by establishing data concerning relevant issues. These data are “established
according to users’ priorities” and represent “an important push factor” (Franzen). This was
also confirmed during the workshop with Altmetric.com: customer requests and availability
are a key orientation for developments, but also particularly for the resource-intensive
expansion of sources such as policy documents and news items. Isabella Peters also
stressed resulting requirements from a systemic point of view: “Politics and funding play a
major role because science tends to maintain long-established traditions” and no system
change is possible without such stimuli.

At the other end of the spectrum, Bornmann promoted a comparatively technocratic
approach. He said that politics should refrain from application as long as the scientific
knowledge gained is yet to reach a sufficiently advanced stage. Science has the responsibility
to first investigate whether altmetrics can be used as a quantitative indicator in research
evaluation, and if so, to what extent.
Altmetrics Feasibility Study   20

5.       Discussion of results

In conclusion of this study, the results obtained by the various methods are discussed and
evaluated. An overall picture is developed, which provides answers to the questions
articulated at the beginning of the study and outlines potential application prospects. Three
major aspects will be discussed in this section: political prospects, the issue of the use of
altmetrics for science policy, and an outlook on the topic by the project team based on this
study.

5.1 Overview of the political prospects of altmetrics

To date, the European Commission attaches great significance to altmetrics, particularly
against the backdrop of open science. This is also reflected in the establishment of the
associated expert group. The efforts have so far led to a compilation of twelve
recommendations within the open science context 16. In the political context of the European
Union’s supranational level, the importance of guidelines for the conscientious application of
metrics is emphasized.

In the following, these guidelines are intertwined with the demands from the Leiden Manifesto
for research metrics (Hicks et al., 2015). The Leiden manifesto emphasizes the aspect of
complementarity as a key principle and basis of any evaluation practice. It says the aim
should be for the existing qualitative practices to complement each other in an advantageous
manner. Peer review and expert assessment – it claims – could be reinforced by the
appropriate use of quantitative metrics, and further aspects beyond the traditional science
system could be illuminated: “Quantitative evaluation should support qualitative, expert
assessment” (Hicks et al., 2015, p. 430). Considering the general opinion expressed in the
interviews, it is this exact aspect that all interviewees consider to be very important.

Another important aspect of collecting quantitative analyses is the openness and
transparency of all steps in the analysis process: “keep data collection and analytical
processes open, transparent and simple” (Hicks et al., 2015, p. 430), i.e. analyses should be
verifiable and the indicators should not be unnecessarily complicated. This does not mean
that simple indicators (e.g. absolute numbers) with no significance should be used instead.
This recommendation is particularly important against the backdrop of the Altmetric Attention
Score, since this composite indicator always combines differing data from many different
sources. Their individual significance is unknown, meaning the score value can only

16   Next-generation metrics: Responsible metrics and evaluation for open science, EC, 2017.
Altmetrics Feasibility Study   21

contribute rudimentary information regarding the visibility of a publication on social media. It
should not, therefore, be used for evaluation. At this point, attention should also be drawn to
the inappropriate use of the journal impact factor, which occurs in cumulative form particularly
in medical science: its incorrect use as a citation indicator instead of as a simple journal
indicator shows that it is immensely difficult to eliminate a “metric” once it has been
established. Metrics in the scientific context must be reliable, reproducible, and significant.

The interviewees also agreed that the question of what altmetrics measure is one of the key
research issues in the field of altmetrics, and that science needs to work further on answering
it. Although there are approaches for some types of source, it will take time for science to
interpret them. In addition, the scientific incentive system must also be considered: the big
difference between bibliometrics and altmetrics is that scientific publications are the
traditional and indispensable main output of science. Bibliometrics thus measure something
that is at the centre of the scientific reward system. The communication of science to society –
i.e. what is measured by altmetrics – is not yet part of the scientific reward system. Creating
incentives and expanding this reward system would likely lead to increased use of social
media by science and thus also strengthen altmetrics. One step in this direction has already
been taken: our own data analysis for this study showed that an increasing proportion of
publications is perceived, linked, and discussed on social media. Conclusions can thus be
drawn about the rising significance of social media in the scientific context and – with
appropriate incentives – could lead to encouraging the use of social media in a targeted
manner and the associated altmetric analyses.
Altmetrics Feasibility Study   22

5.2 How can research policy use altmetrics?

The debate over the wide range of application options was presented in detail in Section 4.2,
which looked at the results of the interviews. To what extent altmetrics will establish
themselves in research policy fundamentally depends on empirical values from practical
application in the sense of a learning experimental system. On the basis of the results
obtained, potential areas of application will therefore be outlined in this section.

Science evaluation, performance assessment, and measurement of social
impact

The results obtained in our own quantitative analysis, the multi-faceted expert interviews, and
the intense exchange with the service provider as well as secondary literature emphasize the
exploratory developmental status of altmetrics. A uniform picture of the applicability in
performance assessments of institutions and actors becomes apparent, for example within
the scope of science evaluation. In these sensitive areas, care must be taken with regard to
the application of altmetrics, and validation represents an essential component. In the
scientific discourse, a deeper understanding of the heterogeneity and significance of the data,
a meaningful indicator system, and benchmarks must be achieved. In the near future,
altmetrics will be more of a complementary component rather than an independent indicator
for the assessment of scientific performance.

In addition, some research topics are more in the focus of society than others, without
necessarily displaying a larger social impact 17. Altmetrics can therefore be viewed as an
incomplete indicator of social visibility. To what extent this circumstance will change over time
cannot currently be predicted and depends more on the social discourse on science and the
opening of the science system than on further methodological developments.

The role of research policy could thus consist of triggering such developments. Potential
options of supporting the process include setting framework conditions, determining
requirements for applications, and promoting altmetrics. However, any implementation in the
sense of application in suitable fields requires specific knowledge, the majority of which is
present in science organizations. This is generally backed up by empirical values from
science policy as well as the view expressed in the interview by the University of Cambridge
as a representative of university research. In keeping with a learning system, this results in
the requirement of being open to change and leaving sufficient leeway in provisions. It is not

17 In this context, attention should be drawn to the news values theory: it describes factors as to why

some topics are reasonably certain to be reported on while others are unlikely to become the object
of journalistic reports in the mass media. The theory describes factors such as surprise, sensation,
usefulness, and prominence, whose different weighting influences the manner of reporting (cf.
Galtung and Ruge, 1965).
Altmetrics Feasibility Study   23

yet clear to what extent the potential of altmetrics is unlocked more through qualitative
indicators or through quantitative, characteristics-based indicators. It must be noted,
however, that scientific efforts have so far been limited to quantitative considerations.

Public relations, visibility, and promotion of activities

Communication of science and its visibility in the public sphere is in part represented by
altmetrics. In any case, it should be noted that there is a rising trend in social media activity
measured according to the frequency of contributions and the number of people involved.
There is thus an increased importance and potential of using social media platforms to
proactively draw attention to research, i.e. promote it.

As an example in this context, institutional efforts such as those undertaken by universities
or the European Commission, can be observed, which strategically position their own
publications and activities – in keeping with opening up the science system, widening
knowledge transfer, and addressing social challenges. Against the backdrop of the
exploratory state of these efforts, altmetrics could serve as feedback, for example, to test
various approaches aimed at new target groups in society. With regard to research policy,
activities with a strong social relevance and their visibility could represent a particularly
interesting field of application complementing current evaluation approaches to analysing
media resonance. Initial network analyses are already delivering promising results and their
application to research policy issues could be examined. Using specific issues associated
with the distribution of communication, attention could be focused, for example, on the
identification of relevant multipliers 18 in the spread of information. Identifying such
mechanisms and transmission channels in pilot studies would be promising research
priorities in this respect, in addition to the medial resonance already addressed through
established investigation designs. 19

Publishers already use the Altmetric score as feedback on articles, albeit in a strongly
aggregated and simplified form. Similar efforts are also apparent at universities and research
institutions, which are testing the implementation of the Altmetric donut both with and without
the score, although the added value of these efforts has yet to be clarified. As part of a pilot
measure, the OECD is currently investigating to what extent the Altmetric Explorer and the
implementation of the Altmetric score are suited to determining the social range of policy
documents.

18 E.g. science journalists and representatives from politics, industry, interest groups, and NGOs
19 Example questions: Which social media actors contribute to the effective distribution of
information? How can publications be disseminated in society and politics? To what extent can
publications be found in policy documents? What is the significance of politicians promoting them?
Altmetrics Feasibility Study   24

Science institutions can also use altmetrics within the scope of science marketing: it is
conceivable that altmetrics could be used to focus attention on the publications by an
institution that are widely discussed, shared, tweeted, or used in news pieces. This would
permit the interface between science and society to be better addressed. According to a
press release from Forschungszentrum Jülich, selected press releases concerning scientific
publications available on Jülich’s website now feature the Altmetric pictogram in order to
determine the online resonance to publications. It is visible alongside the information about
the original publication and displays the number of mentions as well as information about the
associated communication channels, which are specified in detail on the provider’s website 20.
Jülich is therefore one of the first scientific institutions in Germany to go public with the
altmetrics topics and a respective service.

Science

Applying altmetrics in science can take a direction similar to that described in the previous
section on public relations: for scientists, the visibility of their publications is essential. The
reputation resulting from others using their scientific output in the form of ideas, statements,
calculations, and findings is an essential part of the science system. Only when this output is
used – whether in other scientific publications or in web-based communication, social media,
news items, or policy documents – creates a lasting benefit for the scientist in question. This
also applies to bibliometrics, and its importance in altmetrics is growing. In summary, the aim
of scientists is to achieve the highest possible impact with their publications, and to document
this accordingly. This helps scientists to increase their reputation in the long term. It is a sign
of appreciation for any scientist when their work is noticed, viewed as relevant, and cited by
a colleague (Cf. Jokić and Ball 2006, p. 145). This applies to the classic publication process
as well as to altmetrics: Science is a competition for attention. It is also about amazing others
and generating interest for the scientists themselves. If there is one thing that motivates the
career choice of scientists, then it is attention – not earnings (cf. Franck 1996, p. 37 f). In
short, in the media society, it is no longer sufficient to simply be rich: you also need a high
profile (cf. Franck 1996) in order to make it in the attention economy (cf. Franck 1996). This
was revealed by a survey among almost 700 scientists registered on the ResearchGate
platform. The majority stated that they thought it important to have the highest possible RG
score (Meier and Tunger, 2017b). Many scientists try to achieve a certain degree of
prominence in the scientific community in order to clearly demonstrate their own position.
This can also be termed “visibility”: Whoever has something to say needs visibility (cf.
Fisherappelt.de 2016).

20 Cf. http://www.fz-juelich.de/SharedDocs/Meldungen/PORTAL/DE/2017/17-09-20-
altmetrics.html?nn=448936 (last accessed on 28 November 2017)
You can also read