COSMO-CLM regional climate simulations in the Coordinated Regional Climate Downscaling Experiment (CORDEX) framework: a review
←
→
Page content transcription
If your browser does not render page correctly, please read the page content below
Geosci. Model Dev., 14, 5125–5154, 2021
https://doi.org/10.5194/gmd-14-5125-2021
© Author(s) 2021. This work is distributed under
the Creative Commons Attribution 4.0 License.

COSMO-CLM regional climate simulations in the Coordinated
Regional Climate Downscaling Experiment (CORDEX)
framework: a review
Silje Lund Sørland1,a , Roman Brogli1 , Praveen Kumar Pothapakula2 , Emmanuele Russo3 , Jonas Van de Walle4 ,
Bodo Ahrens2 , Ivonne Anders5,6 , Edoardo Bucchignani7,8 , Edouard L. Davin1 , Marie-Estelle Demory1 ,
Alessandro Dosio9 , Hendrik Feldmann10 , Barbara Früh11 , Beate Geyer12 , Klaus Keuler13 , Donghyun Lee14 ,
Delei Li15 , Nicole P. M. van Lipzig4 , Seung-Ki Min14,16 , Hans-Jürgen Panitz10 , Burkhardt Rockel12 , Christoph Schär1 ,
Christian Steger11 , and Wim Thiery17
1 Institute for Atmospheric and Climate Science, ETH Zurich, Zurich, Switzerland
2 Institute for Atmospheric and Environmental Sciences, Goethe University, Frankfurt am Main, Germany
3 Climate and Environmental Physics, University of Bern, Bern, Switzerland
4 Department of Earth and Environmental Sciences, KU Leuven, Leuven, Belgium
5 Deutsches Klimarechenzentrum, Hamburg, Germany
6 Central Institute for Meteorology and Geodynamics (ZAMG), Vienna, Austria
7 Centro Italiano Ricerche Aerospaziali (CIRA), Capua, Italy
8 Centro Euro-Mediterraneo sui Cambiamenti Climatici (CMCC), Caserta, Italy
9 European Commission Joint Research Centre (JRC), Ispra, Italy
10 Institute for Meteorology and Climate Research (IMK-TRO), Karlsruhe Institute of Technology (KIT), Karlsruhe, Germany
11 Deutscher Wetterdienst (DWD), 63067 Offenbach, Germany
12 Helmholtz-Zentrum, Geesthacht, Germany
13 Chair of Atmospheric Processes, Brandenburg University of Technology (BTU), Cottbus-Senftenberg, Germany
14 Division of Environmental Science and Engineering, Pohang University of Science and Technology (POSTECH),

Pohang, South Korea
15 CAS Key Laboratory of Ocean Circulation and Waves, Institute of Oceanology,

Chinese Academy of Sciences, Qingdao, China
16 Institute for Convergence Research and Education in Advanced Technology, Yonsei University, Incheon, South Korea
17 Department of Hydrology and Hydraulic Engineering, Vrije Universiteit Brussels, Brussels, Belgium
a current address: NORCE Norwegian Research Centre, Bergen, Norway

Correspondence: Silje Lund Sørland (ssor@norceresearch.no)

Received: 30 December 2020 – Discussion started: 19 February 2021
Revised: 4 July 2021 – Accepted: 15 July 2021 – Published: 17 August 2021

Abstract. In the last decade, the Climate Limited-area         0.22◦ (∼ 25 km), and 0.11◦ (∼ 12 km) over the CORDEX
Modeling Community (CLM-Community) has contributed             domains Europe, South Asia, East Asia, Australasia, and
to the Coordinated Regional Climate Downscaling Exper-         Africa. This major effort resulted in 80 regional climate sim-
iment (CORDEX) with an extensive set of regional cli-          ulations publicly available through the Earth System Grid
mate simulations. Using several versions of the COSMO-         Federation (ESGF) web portals for use in impact studies and
CLM-Community model, ERA-Interim reanalysis and eight          climate scenario assessments. Here we review the produc-
global climate models from phase 5 of the Coupled Model        tion of these simulations and assess their results in terms of
Intercomparison Project (CMIP5) were dynamically down-         mean near-surface temperature and precipitation to aid the
scaled with horizontal grid spacings of 0.44◦ (∼ 50 km),       future design of the COSMO-CLM model simulations. It is

Published by Copernicus Publications on behalf of the European Geosciences Union.
5126                                                       S. L. Sørland et al.: COSMO-CLM simulations within CORDEX

found that a domain-specific parameter tuning is beneficial,         The CORDEX experimental design was initially de-
while increasing horizontal model resolution (from 50 to 25       scribed in Giorgi et al. (2009), where a minimum hori-
or 12 km grid spacing) alone does not always improve the          zontal grid spacing of around 0.44◦ (∼ 50 km) was rec-
performance of the simulation. Moreover, the COSMO-CLM            ommended. However, it was left to the modeling groups
performance depends on the driving data. This is generally        within each CORDEX domain to establish a simulation pro-
more important than the dependence on horizontal resolu-          tocol and to coordinate the simulations. Over Europe, groups
tion, model version, and configuration. Our results empha-        were encouraged to perform additional simulations at 0.11◦
size the importance of performing regional climate projec-        (∼ 12 km) horizontal resolution (Jacob et al., 2020), although
tions in a coordinated way, where guidance from both the          Kotlarski et al. (2014) for Europe as well as Panitz et al.
global (GCM) and regional (RCM) climate modeling com-             (2014) for Africa found no significant added value in the
munities is needed to increase the reliability of the GCM–        mean fields with an increase in horizontal resolution. How-
RCM modeling chain.                                               ever, added value is found for extreme events and over com-
                                                                  plex terrain when the grid is refined from 0.44 to 0.11◦ over
                                                                  Europe (Prein et al., 2016; Torma et al., 2015).
                                                                     The ensemble size of CORDEX simulations varies greatly
1   Introduction
                                                                  amongst domains. The main reason is the limited resources
Dynamical downscaling of global climate models (GCMs)             from the modeling centers to perform model simulations on
with a regional climate model (RCM) is an approach em-            multiple domains. To overcome this issue, CORDEX has pri-
ployed to obtain higher spatial and temporal resolved climate     oritized regions that are particularly vulnerable to climate
information at the regional to local scales (Rummukainen,         variability and change and for which RCM-based climate
2016; Giorgi, 2019; Gutowski et al., 2016; Jacob et al.,          projections are rare, such as Africa (Giorgi et al., 2009). Still,
2020). These GCM–RCM model chain data are typically               Europe has the largest ensemble size, while other domains
used as the basis for impact studies and long-term adaptation     have a smaller number of available simulations (Spinoni
planning by impact modeling groups, stakeholders, and na-         et al., 2020).
tional climate assessment reports (Ahrens et al., 2014; Kjell-       A new framework within CORDEX was presented by
ström et al., 2016; Dalelane et al., 2018; Rineau et al., 2019;   Gutowski et al. (2016) (Coordinated Output for Regional
Sørland et al., 2020; Sterl et al., 2020; Vanderkelen et al.,     Evaluations, CORDEX-CORE), with the goal of producing
2020).                                                            a set of homogeneous high-resolution regional climate pro-
   GCM simulations are coordinated through international          jections covering all continents. A core set of three GCMs
projects such as the Coupled Model Intercomparison Project        from CMIP5 was suggested to be dynamically downscaled
phase 5 (CMIP5; Taylor et al., 2012), in which the future sce-    for two emission scenarios, with a recommended horizon-
narios, describing emissions, land use, and aerosol changes,      tal grid spacing of 0.22◦ (∼ 25 km), which is half the hor-
are given by representative concentration pathways (RCPs)         izontal resolution considered in the first CORDEX frame-
(IPCC, 2013; Taylor et al., 2012; Moss et al., 2010). The dy-     work (Giorgi et al., 2009). To participate in the CORDEX-
namical downscaling of CMIP5 simulations by RCMs has              CORE initiative, each RCM group needs to produce more
been initiated through the Coordinated Regional Climate           than 6000 model years, which results in over 400 TB of data,
Downscaling Experiment (CORDEX; Giorgi et al., 2009).             as each domain generates 10 model integrations, including 1
Since 2009, when CORDEX was officially designed and en-           evaluation (30 years), 3 historical (3 × 55 years), 3 RCP2.6
dorsed by the World Climate Research Programme (WCRP),            (3 × 95 years), and 3 RCP8.5 (3 × 95 years) simulations.
regional climate projections have been produced by sev-           This is a huge effort that most RCM groups are not able to
eral modeling groups over 14 different domains covering           perform alone, and until today only the groups using the re-
nearly all mainlands of the globe. Today, Earth System Grid       gional models REMO and RegCM have been able to conduct
Federation (ESGF) servers contain more than 370 GCM–              all required simulations following the CORDEX-CORE pro-
RCM model chain simulations (http://htmlpreview.github.io/        tocol (Remedio et al., 2019; Ciarlo et al., 2020; Teichmann
?http://is-enes-data.github.io/CORDEX_status.html, last ac-       et al., 2020).
cess: 24 November 2020), and the number of simulations               The regional climate model COSMO-CLM (or CCLM)
has increased substantially in recent years. For instance, for    is an example of a model developed and used by a com-
Europe, more than 100 GCM–RCM simulations have been               munity of scientists, the CLM-Community (http://www.
produced as part of EURO-CORDEX. Compared to earlier              clm-community.eu/, last access: 12 August 2021). The
projects such as PRUDENCE (Christensen and Christensen,           COSMO-CLM model has been used for a large set of exper-
2007) and ENSEMBLES (van der Linden and Mitchell,                 iments and run over a wide range of timescales (up to a cen-
2009), the number of simulations has increased by more than       tury) and resolutions (1–50 km) (e.g., Ban et al., 2014; Bris-
400 % (Christensen et al., 2019).                                 son et al., 2015; Chatterjee et al., 2017; Wouters et al., 2017;
                                                                  Leutwyler et al., 2017; Schultze and Rockel, 2018; Schlem-
                                                                  mer et al., 2018; Imamovic et al., 2019; Panosetti et al., 2019;

Geosci. Model Dev., 14, 5125–5154, 2021                                            https://doi.org/10.5194/gmd-14-5125-2021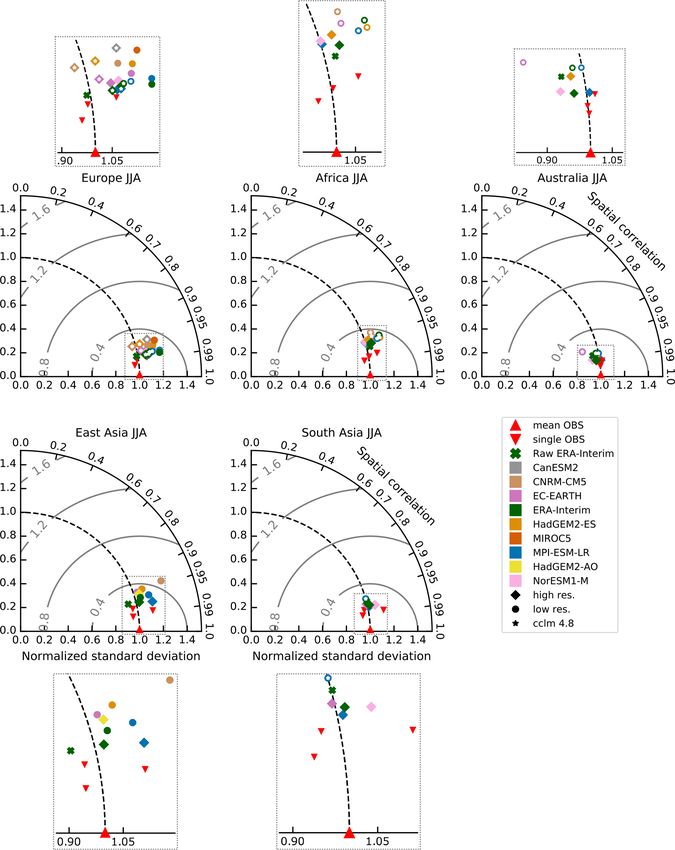
S. L. Sørland et al.: COSMO-CLM simulations within CORDEX                                                                    5127

Hentgen et al., 2019; Brogli et al., 2019). COSMO-CLM has            CORE domains Africa, East Asia, Australasia, and South
been used to perform regional climate simulations over Eu-           Asia. Since the existing COSMO-CLM CORDEX simula-
rope for more than 15 years (Rockel et al., 2008), has today         tions differ in more than one way (i.e., versions, configura-
been extensively used for climate simulations over multiple          tions, and resolutions), we do not perform a systematic anal-
domains around the globe (e.g., Panitz et al., 2014; Asharaf         ysis of each simulation, but we rather focus on sharing our
and Ahrens, 2015; Bucchignani et al., 2016b; Keuler et al.,          experiences, as we anticipate we can learn a lot from this ex-
2016; Sørland et al., 2018; Hirsch et al., 2019; Li et al.,          tensive ensemble, which is based on all model integrations
2018; Termonia et al., 2018; Di Virgilio et al., 2019; Russo         that are available as of February 2020. Such an analysis will
et al., 2020; Drobinski et al., 2020; Evans et al., 2020), and       support the future design of model simulations in the com-
in this way contributed to the CORDEX initiative. Rockel             munity. The dependence of the model results on the driving
and Geyer (2008) investigated how COSMO-CLM performs                 GCM is also discussed.
over various domains and climate zones when keeping inten-              The following Sect. 2 gives an overview of the CLM-
tionally the same setup as for its “home domain”, which was          Community, the model development, and a description of
introduced as model transferability (Takle et al., 2007). One        the model configurations used for the CORDEX simulations.
of the main findings was that the model has difficulties over        Section 3 describes the methods and data. The results are pre-
domains with a climate substantially different from that of          sented in Sect. 4, and we end with a summary and discussion
Europe, where the RCM has been developed, and the model              in Sect. 5.
may need to be re-tuned for specific domains. This re-tuning
can for instance be the use of an objective model calibra-
tion (Bellprat et al., 2016; Russo et al., 2020) or the use of       2     CLM-Community and COSMO-CLM model
a different physical parameterization scheme (e.g., convec-
tion after Bechtold et al., 2008, instead of Tiedtke, 1989, as       2.1    The CLM-Community and its community effort
was done in CCLM for Australasia) or a higher model top,
which is necessary for tropical regions because of the higher        The Climate Limited-area Modeling Community (CLM-
tropopause. In CORDEX, COSMO-CLM was re-tuned for                    Community, https://www.clm-community.eu, last access:
each of the CORDEX domains (see Sect. 2.3).                          12 August 2021) is an open, international network of sci-
   Since the CMIP5 scenario simulations became available,            entists, joining efforts to develop and use community mod-
the CLM-Community has downscaled eight GCMs (see                     els. For the last 15 years, the community model employed
Sect. 3.2). The majority of the dynamical downscaling ex-            has been COSMO-CLM (Rockel et al., 2008). COSMO-
periments with COSMO-CLM have been performed follow-                 CLM is the climate version of the COSMO model (Bal-
ing the EURO-CORDEX framework at 0.11 and 0.44◦ hor-                 dauf et al., 2011), a limited-area numerical weather predic-
izontal grid spacings. There are also numerous simulations           tion model developed by the Deutscher Wetterdienst (DWD)
for other CORDEX domains at 0.44◦ horizontal resolution,             in the 1990s for weather forecasting applications. COSMO
such as Africa (Panitz et al., 2014; Dosio et al., 2015; Dosio       itself is the further developed and renamed version of the
and Panitz, 2016), East Asia (Li et al., 2018, 2020), South          DWD’s “Lokalmodell (LM)” (Steppeler et al., 2003). Based
Asia (Asharaf and Ahrens, 2015), and Australasia (Di Vir-            on LM, a climate version of LM, called CLM, was devel-
gilio et al., 2019; Hirsch et al., 2019). Recently, as part of the   oped at the end of the 1990s. In 2007 LM and CLM were
CORDEX-CORE initiative, the CLM-Community has con-                   reunified, and, due to the renaming of LM to COSMO, CLM
tributed with a set of downscaling experiments over Africa,          was renamed COSMO-CLM (CCLM: COSMO model in
East Asia, Australasia, and South Asia, using a horizontal           CLimate Model; see, e.g., Rockel et al., 2008; Steger and
grid spacing of 0.22◦ . The total number of simulations con-         Bucchignani, 2020). The two model branches (COSMO and
ducted by the CLM-Community sums up to 80 simulations                COSMO-CLM) are developed separately and merged regu-
(Table 1 lists the number of simulations available for each          larly. This practice is recognizable in the model version num-
domain with different resolutions and various RCPs).                 ber, where the whole digit (e.g., 5.0) marks a unified version
   This study presents the contribution from the CLM-                and the decimal digit indicates the developments that have
Community to regional climate projections following the di-          occurred independently within the CLM-Community and the
rectives of the CORDEX framework. Much of the develop-               COSMO consortium. The new releases include model im-
ment of COSMO-CLM is done to improve the model perfor-               provements, extensions, or bug fixes. A new major version
mance over Europe, and COSMO-CLM today realistically                 is always quality-checked and compared to the previous one
simulates the European climate, which is confirmed in differ-        by means of evaluation of the climatology over the European
ent studies (e.g., Kotlarski et al., 2014; Vautard et al., 2020,     domain.
and Fig. 1). That the RCMs tend to have the best performance            The CLM-Community was founded in 2004 and currently
over their home domain has been noted previously (Takle              includes 212 members from 72 institutions located all over
et al., 2007). Thus, in this study we assess and compare the         the world (as of November 2020). The aim of the CLM-
model performance over Europe with the four CORDEX-                  Community is to coordinate the model development, to eval-

https://doi.org/10.5194/gmd-14-5125-2021                                               Geosci. Model Dev., 14, 5125–5154, 2021
5128                                                          S. L. Sørland et al.: COSMO-CLM simulations within CORDEX

Table 1. Number of COSMO-CLM simulations available for the different domains (EUR: Europe, AFR: Africa, AUS: Australasia, EAS:
East Asia, WAS: South Asia), driven by ERA-Interim (Dee et al., 2011), CanESM2 (Arora et al., 2011; Von Salzen et al., 2013), CNRM-CM5
(Voldoire et al., 2013), EC-EARTH (Hazeleger et al., 2012), HadGEM (HadGEM2-ES, Collins et al., 2011; The HadGEM2 Development
Team, 2011; HadGEM-AO, Baek et al., 2013), MIROC5 (Watanabe et al., 2011), MPI-ESM-LR (Stevens et al., 2013), and NorESM1-M
(Iversen et al., 2013). The respective ERA-Interim simulation is the evaluation run and is typically from 1979 to 2010. The GCM-driven
simulations include a historical simulation (1950–2005) and one or more scenarios RCP2.6/4.5/8.5 (2006–2099). For each domain, up to two
different horizontal grid spacings are used: 0.44◦ (50 km) and 0.11◦ (12 km, only for Europe) or 0.22◦ (25 km, for all the other domains).
From the GCM’s ensembles the first realization (r1) is used for all the GCMs, except for EC-EARTH (r12) and for MPI-ESM (three members:
r1, r2, and r3). The HadGEM-ES GCM is used for all domains, except for East Asia, where HadGEM-AO is used.

         ERA-Interim     MPI-ESM        HadGEM        CNRM-CM5       EC-EARTH        CanESM2          NorESM         MIROC5
         0.11/          0.11/          0.11/          0.11/          0.11/          0.11/            0.11/          0.11/          Domain
          0.22   0.44    0.22   0.44    0.22   0.44    0.22   0.44    0.22   0.44    0.22     0.44    0.22   0.44    0.22   0.44     sum
 EUR         2      2       6      3      3      1       2       1      4      1       1                1              2      1        30
 AFR         2      1       2      2      2      2               2             2                        2                              17
 AUS         1      1       2      2      2                                    2                        2                              12
 EAS         1      1       2      2      2      2               2             2                                                       14
 WAS         1              2      1                                    1                               2                               7
 Sum         7      5      14     10      9      5       2       5      5      7       1                7              2      1        80

uate it, and to recommend model configurations. Addition-              scheme that includes cloud water, rain water, snow, and ice
ally, the community ensures an efficient use of resources with         (Doms et al., 2013). The soil processes are simulated by
the objective of providing the best possible long-term cli-            the soil–vegetation–atmosphere-transfer sub-model TERRA
mate simulations and to help answer key questions of climate           (Schrodin and Heise, 2001; Schulz et al., 2016). Here, prog-
change at the regional and local scales.                               nostic equations are solved for soil water content, tempera-
                                                                       ture, and ice in 10 soil layers by default. Alternative param-
2.2    COSMO-CLM description, developments, and                        eterizations can be employed (e.g., the parameterization of
       versions                                                        convection by Bechtold et al., 2008 or land-surface models
                                                                       such as VEG3D or the Community Land Model; Will et al.,
                                                                       2017).
COSMO-CLM is a non-hydrostatic, limited-area atmo-
                                                                          The model versions used for CORDEX simulations are
spheric model designed for applications from the meso-β
                                                                       COSMO-CLM4-8-17 (Panitz et al., 2014; Keuler et al.,
to meso-γ scales (Steppeler et al., 2003). The model de-
                                                                       2016; Di Virgilio et al., 2019; Hirsch et al., 2019), multiple
scribes compressible flow in a moist atmosphere, thereby
                                                                       versions of COSMO-CLM5 (Sørland et al., 2018; Li et al.,
relying on the primitive thermodynamical equations. These
                                                                       2018), and the accelerated version COSMO-crCLIM (Vau-
equations are solved numerically with a Runge–Kutta time-
                                                                       tard et al., 2020; Pothapakula et al., 2020). The following
stepping scheme (Wicker and Skamarock, 2002) on a three-
                                                                       sections give short descriptions of the different versions, their
dimensional Arakawa-C grid (Arakawa and Lamb, 1977).
                                                                       main model developments, and new options for different con-
This grid is based on rotated geographical coordinates and a
                                                                       figurations.
generalized, terrain-following height coordinate (Doms and
Baldauf, 2013). The current standard version has 40 non-
equidistant vertical levels up to the top boundary of the              2.2.1   COSMO-CLM4
model domain at 22.7 km, though the number of levels and
height tops can be changed by the user. At the upper lev-              Most developments of COSMO-CLM4 were driven by the
els, a sponge layer with Rayleigh damping is used, whereby             goal of reducing a cold bias present in the regional climate
the default model version is damping all the fields against            simulations over Europe. Sensitivity simulations were car-
the driving boundary fields above 11 km. Alternative up-               ried out with different model configurations at a resolution
per level damping can be chosen (e.g., Klemp et al., 2008)             of 0.44◦ following the ENSEMBLES (van der Linden and
as well as the height where the damping occurs. The stan-              Mitchell, 2009) framework over Europe. The main improve-
dard physical parameterizations include the radiative transfer         ments and developments were related to an introduction of
scheme by Ritter and Geleyn (1992), the Tiedtke parameteri-            the new RCP scenarios (van Vuuren et al., 2011; Moss et al.,
zation for convection (Tiedtke, 1989), and a turbulent kinetic         2010) and a new option for a modified albedo treatment ad-
energy-based surface transfer and planetary boundary layer             justing the albedo according to soil moisture between val-
parameterization (Raschendorfer, 2001). The parameteriza-              ues for dry and saturated soils (Lawrence and Chase, 2007).
tion of precipitation is based on a four-category microphysics         Furthermore, activating a formulation of soil thermal con-

Geosci. Model Dev., 14, 5125–5154, 2021                                                     https://doi.org/10.5194/gmd-14-5125-2021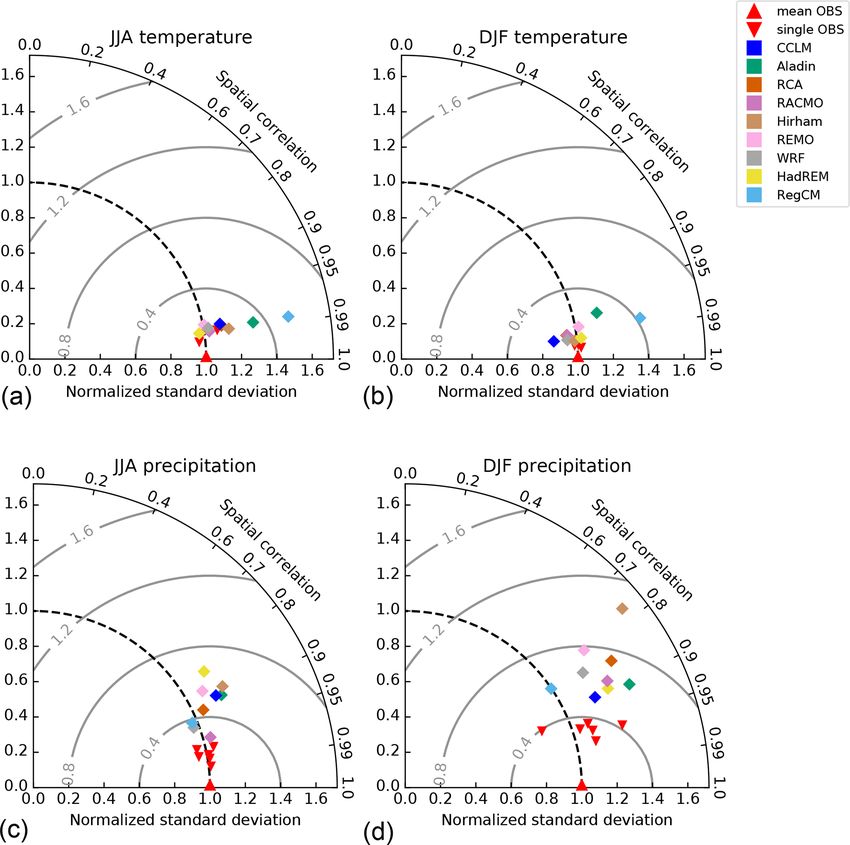
S. L. Sørland et al.: COSMO-CLM simulations within CORDEX                                                                            5129

Figure 1. Spatial Taylor diagram exploring the model performance of the EUR-11 RCM ensemble, for temperature (a, b) and precipita-
tion (c, d) for the boreal summer (June–July–August, JJA; a, c) and boreal winter (December–January–February, DJF; b, d) seasons. The
reference observation is the ensemble mean of the products listed in Sect. 3.1, and the downward-facing red triangles indicate every single
observational product. The colors represent different ERA-Interim (Dee et al., 2011)-driven RCM simulations, whereby the different RCM
versions shown in the legend are Aladin53, RCA4, RACMO22E, HIRHAM5, REMO2015, WRF331F, HadREM3-GA7-05, RegCM4-6 and
CCLM. The latter is represented here by COSMO-crCLIM-v1-1. See Kotlarski et al. (2014) or Vautard et al. (2020) for a documentation and
comprehensive comparison of the different RCMs. More details about the evaluation metrics are given in Sect. 3.3.

ductivity dependent on soil moisture was shown to improve               2.2.2   COSMO-CLM5
the simulated diurnal cycles of the surface temperature, par-
ticularly in arid regions (Schulz et al., 2016). For the first          The developments occurring from COSMO-CLM4 to
CORDEX simulations carried out by the CLM-Community                     COSMO-CLM5 comprise the possibility of using, besides
(Keuler et al., 2016), the resulting COSMO-CLM4-8-17 ver-               the standard temporally constant aerosol optical depths
sion was used. This version was applied over Europe for                 (AODs) described in Tanré et al. (1991), two alternative
an ensemble of simulations with horizontal grid spacings of             AOD datasets, namely Tegen (Tegen et al., 1997) and Ae-
0.11◦ (EUR-11) and 0.44◦ (EUR-44). The same model ver-                  rocom (Kinne et al., 2006), which both vary monthly. In ad-
sion was also used over Africa (Panitz et al., 2014; Dosio              dition, the possibility of choosing different parameterizations
et al., 2015; Dosio and Panitz, 2016), South Asia (Asharaf              of bare soil evaporation (see, e.g., Schulz and Vogel, 2020)
and Ahrens, 2015), and Australasia (Di Virgilio et al., 2019;           was also included in COSMO-CLM5. With COSMO-CLM5,
Hirsch et al., 2019) but with a modified configuration (see             a coordinated parameter testing effort together with an objec-
Sect. 2.3).                                                             tive model calibration (Bellprat et al., 2012) was performed
                                                                        to test new model options and to find a satisfactory model
                                                                        setup for climate simulations over Europe at the 50 km hor-

https://doi.org/10.5194/gmd-14-5125-2021                                                   Geosci. Model Dev., 14, 5125–5154, 2021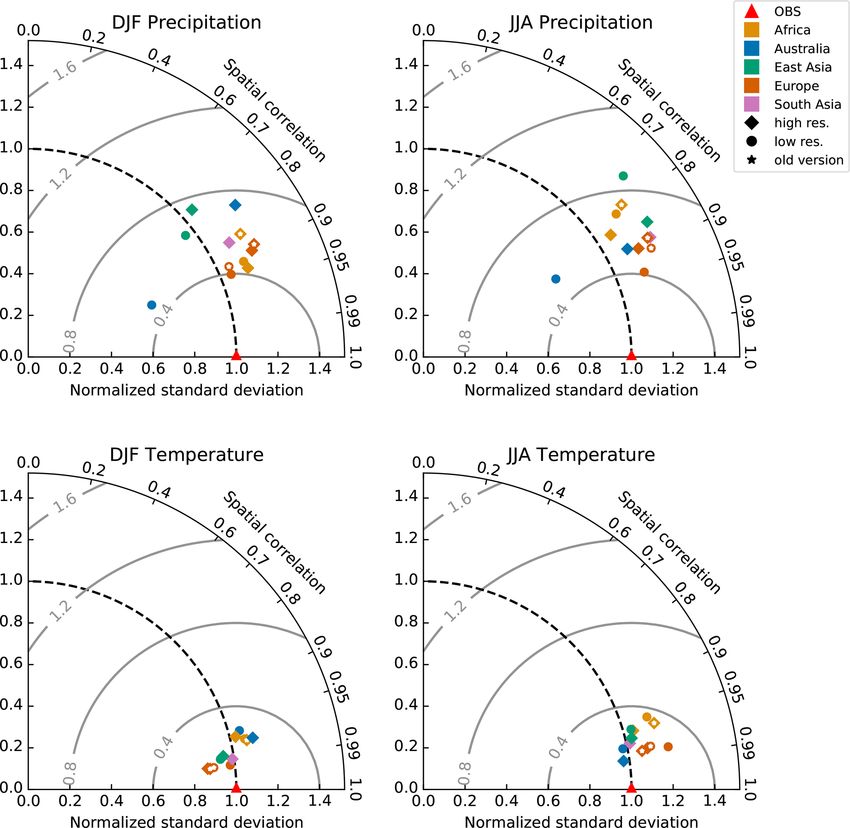
5130                                                       S. L. Sørland et al.: COSMO-CLM simulations within CORDEX

izontal grid spacing. This led to the recommended model           CORDEX simulations are performed with the configuration
version of COSMO-CLM5-0-6. Most of the latest CORDEX              of the model versions described in Sect. 2.2 and the spe-
simulations are performed with COSMO-CLM5, with minor             cific configurations listed in Table S1. At the time of writ-
changes that did not influence the model performance signif-      ing, 30 simulations performed with COSMO-CLM exist for
icantly from versions 5-0-6 to 5-0-16 (e.g., minor bug fixes      the EURO-CORDEX domain, 21 simulations of which per-
or additional output variables).                                  formed with the horizontal grid spacing of 0.11◦ and 9 sim-
                                                                  ulations with 0.44◦ . These simulations are forced by either
2.2.3    COSMO-crCLIM                                             ERA-Interim (Dee et al., 2011) or seven GCMs under three
                                                                  RCPs (see Tables 1 and S2). The results of these simulations
COSMO-crCLIM (Convection-resolving climate modeling               have been included in several scientific studies as well as
on future supercomputing platforms) is an accelerated ver-        national climate change assessment reports (e.g., Kotlarski
sion of the COSMO model (based on version 4) that has             et al., 2014; Keuler et al., 2016; Prein et al., 2016; Sør-
been developed to run on heterogeneous hardware architec-         land et al., 2018; Dalelane et al., 2018; Bülow et al., 2019;
tures including multicore central processing units (CPUs)         Shatwell et al., 2019; Sørland et al., 2020; Vanderkelen et al.,
and graphics processing units (GPUs) (Fuhrer et al., 2014;        2020; Vautard et al., 2020; Demory et al., 2020; Coppola
Schär et al., 2020). COSMO-crCLIM was adapted for cli-            et al., 2020a).
mate applications (Leutwyler et al., 2017), and the cur-
rent configuration includes a new groundwater formulation         2.3.2   CORDEX-Africa
(Schlemmer et al., 2018). COSMO-crCLIM has been exten-
sively tested over Europe for convection-resolving simula-        The first CORDEX-Africa simulations were performed with
tions (Leutwyler et al., 2017; Hentgen et al., 2019; Vergara-     a horizontal grid spacing of 0.44◦ (AFR-44) using COSMO-
Temprado et al., 2020). Other adjustments include chang-          CLM4-8-17, following the CORDEX-Africa domain con-
ing the upper-level damping to only relax the vertical ve-        figurations (Giorgi et al., 2009; see also Fig. 1 in Panitz
locity instead of all dynamical fields (Klemp et al., 2008).      et al., 2014). Thirty-five vertical levels were used and, to
COSMO-crCLIM has been used to produce CORDEX sim-                 allow the free development of deep convection through-
ulations over Europe (EUR-11) and over South Asia (WAS-           out the whole tropical troposphere, the height of the up-
22). All the developments done on COSMO-crCLIM are cur-           permost level was increased from about 23 to 30 km above
rently fed back into the COSMO/COSMO-CLM branch, so               sea level. In addition, the bottom height of the Rayleigh-
version COSMO-CLM6.0 will be available on both CPUs               damping layer (Rayleigh, 1877) was increased from its stan-
and GPUs.                                                         dard value of about 11 to 18 km. Together, these settings
                                                                  are referred to as the COSMO-CLM’s tropical configuration
2.3     Model configurations and general specifics for
                                                                  (Thiery et al., 2015), a configuration used in several subse-
        CORDEX domains
                                                                  quent experiments over tropical domains (e.g., Thiery et al.,
The CLM-Community coordinates the development of                  2016; Brousse et al., 2019; Van de Walle et al., 2019). Fur-
COSMO-CLM and provides a community model with a stan-             thermore, the land-surface albedo was replaced by a new
dard setup, as described in Sect. 2.2. However, the model         dataset based on monthly satellite-derived fields for dry and
configuration can vary depending on the simulation do-            saturated soil (Lawrence and Chase, 2007), which gave more
main and experimental design. For the CORDEX simula-              realistic model results over the deserts. Vegetation parame-
tions, the model domains and protocols are provided (see          ters (leaf area index and plant cover) were also prescribed
https://cordex.org/, last access: 12 August 2021), but some       by monthly climatological fields derived from the ECO-
changes in the model configuration have been applied de-          CLIMAP dataset (Masson et al., 2003). These simulations
pending on the domain and resolution to obtain an optimal         were analyzed by Panitz et al. (2014), Dosio et al. (2015),
model performance. Table S1 in the Supplement summarizes          and Dosio and Panitz (2016), used for climate impact as-
the main differences in the configurations of each model ver-     sessments (e.g., Vanderkelen et al., 2018a, b), and compared
sion for each domain. The specific decisions made for each        to the other CORDEX-Africa RCMs in a number of studies
model configuration are described in the following sections.      (e.g., Dosio et al., 2019, 2020). In Panitz et al. (2014), an
In each case, an evaluation run has been performed, where         additional evaluation simulation at 0.22◦ was performed to
the boundary conditions are taken from the ERA-Interim re-        investigate the effect of increasing the horizontal resolution
analysis (Dee et al., 2011), resulting in 12 evaluation simula-   (from 0.44 to 0.22◦ ) and decreasing the time step (from 240
tions.                                                            to 120 s), respectively (see Table S1).
                                                                     For the next-generation CORDEX-CORE simulations
2.3.1    CORDEX-Europe                                            over Africa, a horizontal grid spacing of 0.22◦ (AFR-22)
                                                                  was required. The AFR-44 setup was used as a starting point
As most of the model development is done to improve Eu-           but updated with a new model version, COSMO-CLM5-0-
ropean simulation performances, the EUR-11 and EUR-44             15. The number of vertical levels was increased from 35 to

Geosci. Model Dev., 14, 5125–5154, 2021                                           https://doi.org/10.5194/gmd-14-5125-2021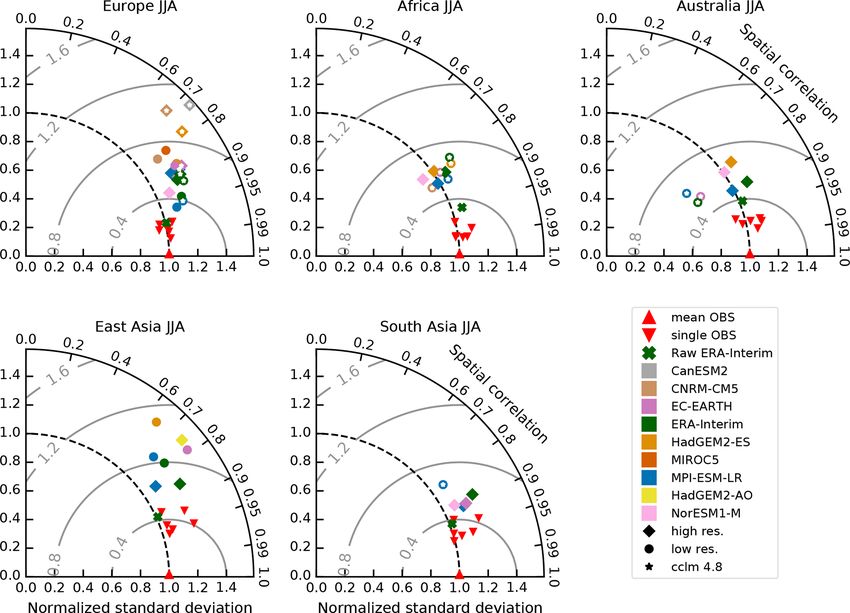
S. L. Sørland et al.: COSMO-CLM simulations within CORDEX                                                                   5131

57 to allow for a more detailed representation of the ver-         ies focusing on model evaluation or projected change in sur-
tical extent. Several tuning parameters were changed ac-           face temperature, precipitation, and wind speed/energy over
cording to the findings of Bucchignani et al. (2016a), and         CORDEX-EAS (Li et al., 2018, 2019, 2020).
two tuning parameters affecting the thickness of the laminar          For EAS-22, CCLM-5-0-9 was employed. Compared to
boundary layer for heat (rlam_heat) and the vertical varia-        CCLM-5-0-2, a minor bug for soil water content transpira-
tion of the critical humidity for sub-grid clouds (uc1) were       tion was fixed. Several namelist parameters are set differently
changed to reduce precipitation and temperature biases. The        from their default values (Table S1, type of turbulence, mi-
applied aerosol climatology was also changed from Tanré            crophysics, convection, and surface schemes). Spectral nudg-
et al. (1991) to Tegen et al. (1997). At the time of writing, 17   ing based on von Storch et al. (2000) was employed for zonal
COSMO-CLM CORDEX simulations exist over the African                and meridional winds above 850 hPa to reduce systematic bi-
domain (8 for AFR-22 and 9 for AFR-44; see Table 1).               ases in surface air temperature, precipitation, and monsoon
                                                                   circulation over East Asia while retaining the observed large-
2.3.3   CORDEX-Australasia                                         scale variations (Lee et al., 2016), supporting previous RCM
                                                                   studies for East Asia (e.g., Cha et al., 2011; Hong and Chang,
The northern part of the CORDEX-Australasia domain ex-             2011). A time step of 150 s is used.
tends into the tropics; therefore, the tropical setup used over       Fourteen COSMO-CLM simulations currently exist for
the CORDEX-Africa domain was employed for the simula-              the East Asian domain, of which five were performed fol-
tion at 0.44◦ horizontal grid spacing (AUS-44). For convec-        lowing the EAS-22 framework and nine following the EAS-
tion, the Bechtold scheme (Bechtold et al., 2008) was used         44 framework. It should be noted that the CORDEX-East
instead of the default Tiedtke scheme (Tiedtke, 1989). For         Asia domain has slightly changed since its initial configu-
these simulations, CCLM4-8-17 was used, but instead of ap-         ration, and thus EAS-22 and EAS-44 cover slightly different
plying the standard TERRA scheme (Schrodin and Heise,              domains (Zhou et al., 2016).
2001) mainly developed for mid-latitude climate, CCLM4-
8-17 was coupled to the Community Land Model version               2.3.5   CORDEX-South Asia
3.5 (CLM3.5, Oleson et al., 2008; Davin et al., 2011) to
reduce warm biases over the Australian arid areas present          Over South Asia, COSMO-CLM has been tested and used in
in the standard version. The CCLM4-8-17-CLM3-5 simula-             various downscaling experiments with a horizontal grid spac-
tions are analyzed in model comparison studies (Di Virgilio        ing of 0.44◦ (Rockel and Geyer, 2008; Dobler and Ahrens,
et al., 2019; Hirsch et al., 2019) over the Australian part of     2010, 2011). Yet the first COSMO-CLM simulation follow-
the CORDEX-Australasia domain.                                     ing the CORDEX protocol for South Asia at 0.44◦ horizon-
   For the CORDEX-CORE simulations (AUS-22), CCLM-                 tal grid spacing (WAS-44) was carried out in Asharaf and
5-0-15 was used, in which a new computation of bare soil           Ahrens (2015). A total of 35 vertical levels were used in this
evaporation using a resistance formulation was implemented         configuration with a time step of 240 s. The standard physi-
(Schulz and Vogel, 2020). As this implementation substan-          cal schemes were employed, except for the Kessler-type mi-
tially improved the near-surface temperature biases, a cou-        crophysics scheme (Kessler, 1969). The GCM MPI-ESM-LR
pling to CLM3.5 was no longer necessary. Fifty-seven ver-          was downscaled for the historical and RCP4.5 emission sce-
tical levels are employed for the AUS-22 simulations, other-       narios.
wise the configuration is identical to the AUS-44 simulations.        Within the CORDEX-CORE framework, COSMO-
   For the Australian domain, currently a total of 12              crCLIM-v1-1 was used at a horizontal grid spacing of 0.22◦ ,
CORDEX simulations exist, 7 with the AUS-22 configura-             using the tropical configuration (height top of 30 km) includ-
tions and 5 with the AUS-44 configurations.                        ing 57 vertical levels and a time step of 150 s, as suggested
                                                                   by Asharaf and Ahrens (2015). Except for changes in the
2.3.4   CORDEX-East Asia                                           horizontal and vertical resolutions and changes in tuning
                                                                   parameter values based on expert tuning to improve the
The CORDEX-EAS-44 simulations use CCLM-5-0-2, with                 model performance, the configuration and parameterization
45 vertical levels where the uppermost level is at a height        schemes were identical to that over Europe (see Table S1).
of 30 km. A time step of 300 s is used. Considering the sub-          For the South Asian domain, a total of six COSMO-CLM
stantial extension of troposphere height across the tropical       simulations exist following the WAS-22 framework. Note
areas, the lower boundary of the Rayleigh-damping layer in         that for the WAS-44 simulation with CCLM4-8-17, no offi-
the model was set to 18 km rather than the typical value of        cial evaluation run was performed, and thus the downscaled
11 km, similar to the tropical setup. The tuning parameters        MPI-ESM-LR (Asharaf and Ahrens, 2015) is only included
are default except for the vertical diffusion coefficient (wich-   when analyzing the GCM-driven simulations in Sect. 4.2.
fakt) that was increased. The standard aerosol dataset was
replaced with the Tegen (Tegen et al., 1997) aerosol climatol-
ogy. These simulations have been applied in scientific stud-

https://doi.org/10.5194/gmd-14-5125-2021                                             Geosci. Model Dev., 14, 5125–5154, 2021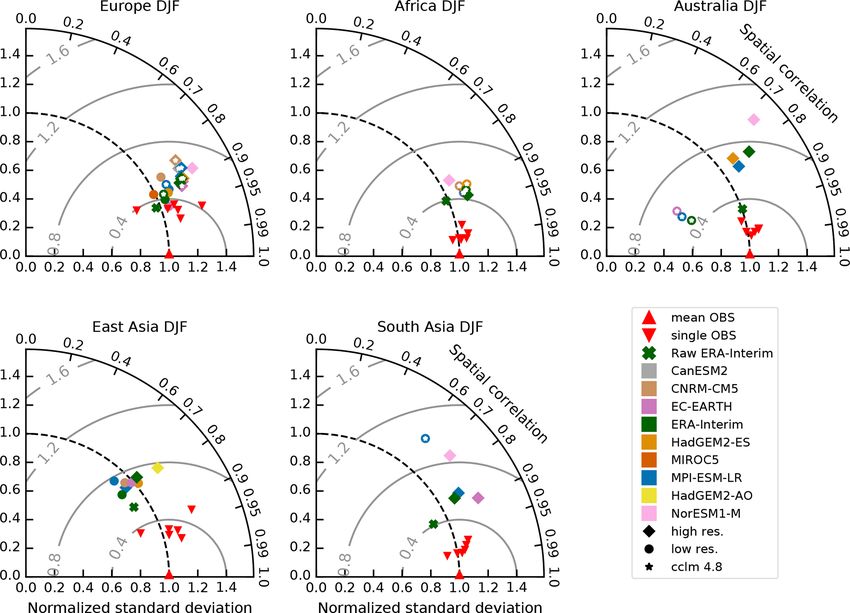
5132                                                      S. L. Sørland et al.: COSMO-CLM simulations within CORDEX

3     Method and data                                            (Giorgi et al., 2009; Gutowski et al., 2016) for the domains
                                                                 Europe, Africa, Australasia, East Asia, and South Asia. Ad-
3.1     Observational datasets                                   ditional COSMO-CLM simulations have been performed for
                                                                 other CORDEX domains (e.g., central Asia, Russo et al.,
All simulations are evaluated against a number of global ob-     2019, 2020; Antarctica, Zentek and Heinemann, 2020; Sou-
servation datasets, allowing for a fair comparison between       verijns et al., 2019; Mediterranean basin, Obermann et al.,
the different domains. The main focus is on the performance      2018; South America, Lejeune et al., 2015; and Middle East–
of near-surface temperature and precipitation. The datasets      northern Africa, Bucchignani et al., 2016a, b). However, as
with their temporal and horizontal resolutions and their ref-    those simulations have not downscaled any of the GCMs
erences are listed in Table S2.                                  used in the current study or are not yet published on an ESGF
                                                                 node, they are not considered here. All simulations were car-
3.1.1    Near-surface temperature                                ried out in a rotated longitude–latitude spherical coordinate
                                                                 system with grid spacings of 0.11, 0.22, or 0.44◦ over the
Three global near-surface temperature datasets are consid-
                                                                 standard CORDEX domains. The simulated COSMO-CLM
ered for the evaluation of the simulations: first, the Global
                                                                 model domain contains a lateral relaxation zone (between
Historical Climatology Network version 2 and the Climate
                                                                 8 and 12 grid spacings), which is required by the dynami-
Anomaly Monitoring System (GHCN2+CAMS, Fan and
                                                                 cal downscaling technique to transfer the data of the driving
van den Dool, 2008), which combine two large individual
                                                                 global climate simulation to the regional model simulation.
datasets of station observations; second, a dataset collected
                                                                    Soil moisture is initialized by a climatological mean value
by the University of DELaware (UDEL), including a large
                                                                 representative of the starting date of the simulation, taken
number of station temperature data, both from the GHCN2
                                                                 from an evaluation simulation driven by the ERA-Interim re-
and, more extensively, from the archive of Willmott and Mat-
                                                                 analysis (Dee et al., 2011). Following the CORDEX frame-
suura (2001); third, time-series datasets produced by the Cli-
                                                                 work, an evaluation simulation driven by the ERA-Interim
matic Research Unit (CRU) at the University of East An-
                                                                 reanalysis is performed over each domain, where all the eval-
glia, which is based on an archive of monthly mean tem-
                                                                 uation simulations cover the time period 1979–2010, except
peratures provided by more than 4000 weather stations dis-
                                                                 CCLM4-8-17 for EUR-11 and AFR-44 which is simulated
tributed around the world (University of East Anglia Climatic
                                                                 for 1989–2008 and AFR-22 CCLM4-8-17 for 1989–2000.
Research Unit et al., 2008). The three temperature datasets
                                                                    A total of eight GCMs were downscaled for a continuous
are given as a monthly mean and at a horizontal resolution of
                                                                 transient time period covering the historical period (1950–
0.5◦ (Table S2).
                                                                 2005) and the future period (2006–2099) under RCP2.6,
3.1.2    Precipitation                                           RCP4.5, or RCP8.5 (Moss et al., 2010; van Vuuren et al.,
                                                                 2011). Table S3 gives an overview of the simulations per-
For precipitation, besides the UDEL (Willmott and Mat-           formed for each domain, GCM, and scenario, similar to Ta-
suura, 2001) and CRU gridded (University of East Anglia          ble 1 but including information on the model versions. The
Climatic Research Unit et al., 2008) station data described      various GCMs used as driving data for COSMO-CLM in
above, the following datasets are used: the Global Precipi-      this study are listed in Table 2; they include those selected
tation Climatology Center (GPCC, Schneider et al., 2018),        for the CORDEX simulations (chosen in order to provide a
providing monthly gridded precipitation data at 0.25◦ hori-      wide range of climate changes over Europe) and those parts
zontal grid spacing from quality-controlled weather stations     of the CORDEX-CORE framework or external projects (e.g.,
worldwide; the Multi-Source Weighted-Ensemble Precipita-         ReKLIS, Dalelane et al., 2018; PRINCIPLES, Vautard et al.,
tion (MSWEP, Beck et al., 2019), including rain-gauge, satel-    2020).
lite, and reanalysis data given at 3-hourly temporal resolu-
tion and 0.1◦ horizontal grid spacing; the Global Precipita-     3.3   Evaluation metrics
tion Climatology Project (GPCP, Adler et al., 2003), where
data from rain-gauge stations, satellites, and sounding obser-   Near-surface temperature and precipitation are evaluated via
vations have been merged to estimate monthly rainfall on         the spatial distribution of climatological seasonal means
a 2.5◦ global grid; and finally the NOAA Climate Predic-         for December–January–February (DJF), March–April–May
tion Center (CPC, Chen et al., 2008), providing global daily     (MAM), June–July–August (JJA), and September–October–
gauge-based precipitation data on a 0.5◦ grid.                   November (SON). The observational datasets are regrid-
                                                                 ded to the CORDEX domains by bilinear and conservative
3.2     Model simulation domains, initial and lateral            remapping for near-surface temperature and precipitation, re-
        boundary conditions                                      spectively. For both variables, biases are calculated as ab-
                                                                 solute and relative differences between the model and the
We present COSMO-CLM simulations performed by the                ensemble mean of the observational products on a grid box
CLM-Community that follow the CORDEX framework                   level. Accounting for the uncertainty in the observations, the

Geosci. Model Dev., 14, 5125–5154, 2021                                          https://doi.org/10.5194/gmd-14-5125-2021
S. L. Sørland et al.: COSMO-CLM simulations within CORDEX 5133
Table 2. List of the various CMIP5 GCMs that have been downscaled with COSMO-CLM for the CORDEX domains assessed in this study.
Model name Resolution References
CanESM2 (Canada) 210 km (T63), 35 levels Arora et al. (2011), Von Salzen et al. (2013)
CNRM-CM5 (France) 160 km (TL127), 31 levels Voldoire et al. (2013)
EC-EARTH (Europe) 80 km (T159), 62 levels Hazeleger et al. (2012)
HadGEM2-ES (UK) 210 × 140 km, 38 levels Collins et al. (2011), The HadGEM2 Development Team (2011)
HadGEM-AO (South Korea) 210 × 140 km (N96), 38 levels Baek et al. (2013)
MIROC5 (Japan) 160 km (T85), 40 levels Watanabe et al. (2011)
MPI-ESM-LR (Germany) 210 km (T63), 47 levels Stevens et al. (2013)
NorESM1-M (Norway) 270 × 210 km, 26 levels Iversen et al. (2013)
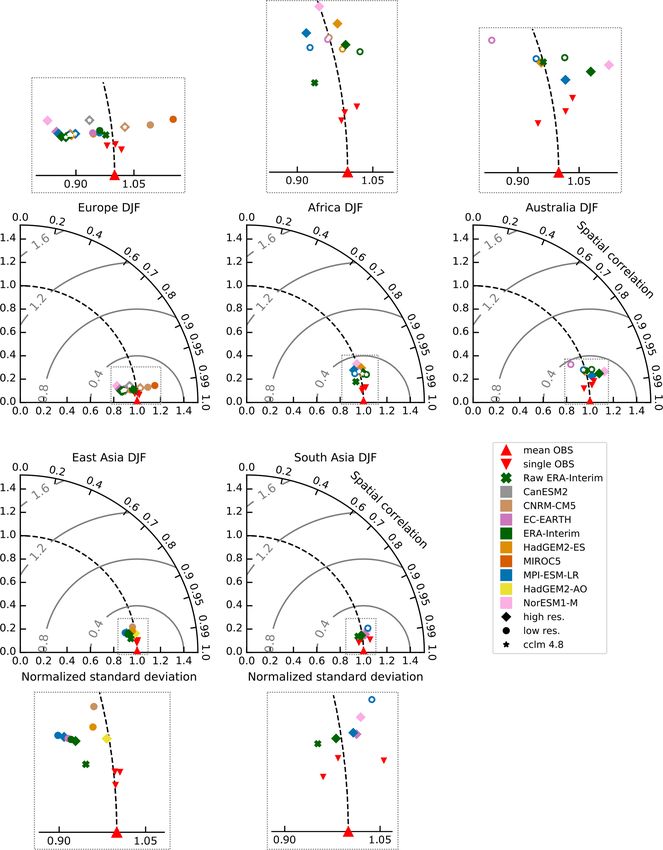
bias is masked, where white areas indicate areas where model shown in Fig. 1. The COSMO-CLM evaluation simulation
values are within the observational range, which contains the is represented by the version COSMO-crCLIM-v1-1. The
minimum and maximum observational values at each grid model performance is assessed in terms of spatial variability
point. over land for the seasonal temperature and precipitation by
To allow an easy comparison of the model performance using a Taylor diagram (see Sect. 3.3). It can clearly be seen
across domains, we summarize the spatial deviations of the that the performance of COSMO-CLM typically lies in the
climatological means by Taylor diagrams (Taylor, 2001), range of the best-performing RCMs over Europe. Motivated
which combine the spatial pattern correlation with the ratio by this, we then investigate the performance of the COSMO-
of spatial variances. The ensemble mean of the observation CLM model over other CORDEX domains, namely Africa,
datasets is used again as a reference. Every data point’s dis- East Asia, Australasia, and South Asia.
tance from the reference corresponds to the normalized and Figures 2 and 3 show the near-surface temperature and
centered root-mean-square difference. The data’s standard precipitation biases as derived from the ERA-Interim-driven
deviation is normalized relative to the reference, for which COSMO-CLM simulations for the five considered domains
the standard deviation is set to 1. For the creation of Taylor for JJA and DJF. Table S4 summarizes the mean absolute
diagrams, simulations and observations were regridded to a biases over land for each evaluation simulation. For refer-
common 0.5◦ grid, and the diagrams were compiled for all ence, the seasonal mean (DJF, MAM, JJA, SON) tempera-
land points of the whole regional simulation domain to avoid ture and precipitation for the different observational datasets
a subjective area choice for assessing the model performance. are shown in the Supplement (Figs. S1–S10). In the follow-
ing, a discussion of the characteristic biases for each region is
given, seeking to assess whether any aspects of the evinced
4 Results biases in each case could be related to the different model
versions or horizontal resolutions. Figure 4 summarizes the
We focus our discussion on near-surface temperature and model performance for the different domains in a Taylor di-
precipitation for DJF and JJA, while MAM and SON re- agram.
sults are included in the Supplement. We first describe the
reanalysis-driven evaluation runs (analyzed for the period 4.1.1 Bias characteristic for the individual domains
of 1981–2010), thereby assessing performance in terms of
the importance of model development and configuration vs. Europe
model resolution for each of the considered CORDEX do-
mains. In the next step, the results of the GCM-driven his- The EURO-CORDEX domain covers most of the pan-
torical simulations (1981–2010, whereby RCP85 is used for European region and thus includes climates characterized
2006–2010) are analyzed, whereby we extend the discussion by cold continental winters in the northeast, large areas
to include the choice of forcing data and the effect of various which are influenced by coastal climate, and a dry and
model configurations and resolutions. warm Mediterranean summer climate. COSMO-CLM has
been used to perform regional climate projections over Eu-
4.1 Evaluation of the reanalysis-driven simulations rope for more than a decade as part of ENSEMBLES, PRU-
DENCE, and now EURO-CORDEX projects. In most eval-
As much of the development of COSMO-CLM is done to im- uation studies over Europe, either the E-OBS dataset is used
prove the model performance over Europe, we start by com- (Kotlarski et al., 2014; Sørland et al., 2018) or the evaluation
paring the performance of the evaluation simulations from is performed on higher-resolution observations from differ-
COSMO-CLM with nine different RCMs that have been ent countries (Prein et al., 2016). However, here we are using
developed independently at different European institutions, global datasets in order to compare the model simulations to
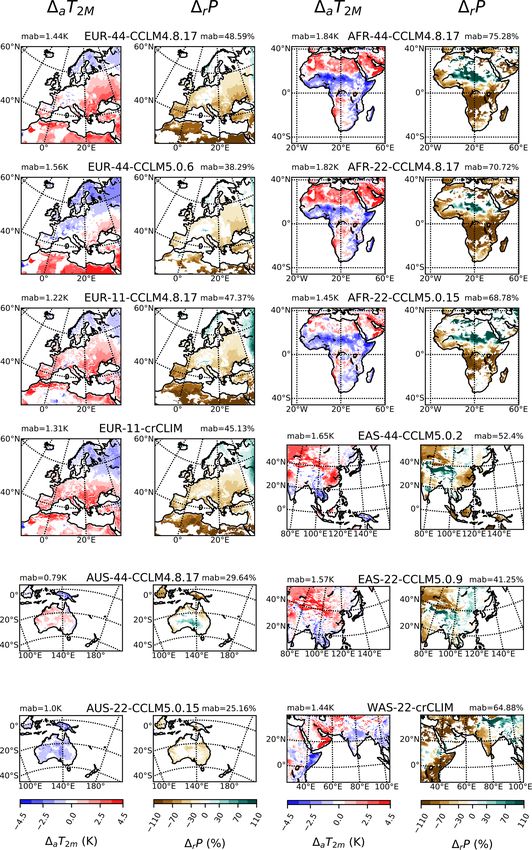
https://doi.org/10.5194/gmd-14-5125-2021 Geosci. Model Dev., 14, 5125–5154, 20215134 S. L. Sørland et al.: COSMO-CLM simulations within CORDEX Figure 2. 2 m air temperature absolute bias (1a T2 m ; columns 1 and 3) and total seasonal precipitation relative bias (1r P ; columns 2 and 4) of the evaluation runs for JJA for the different domains and model resolutions and versions. The evaluation period is from 1981 to 2010, except EUR-11-CCLM4-8-17 and AFR-44-CCLM4-8-17, which is for the years 1989–2008, and AFR-22-CCLM4-8-17, which covers the years 1989–2000. The bias is masked white when the model value falls within the observational range. The mean absolute bias is given on top of each sub-figure (and in Table S4). See Table S1 for the model configurations and Table S3 for the full simulation overview. Geosci. Model Dev., 14, 5125–5154, 2021 https://doi.org/10.5194/gmd-14-5125-2021
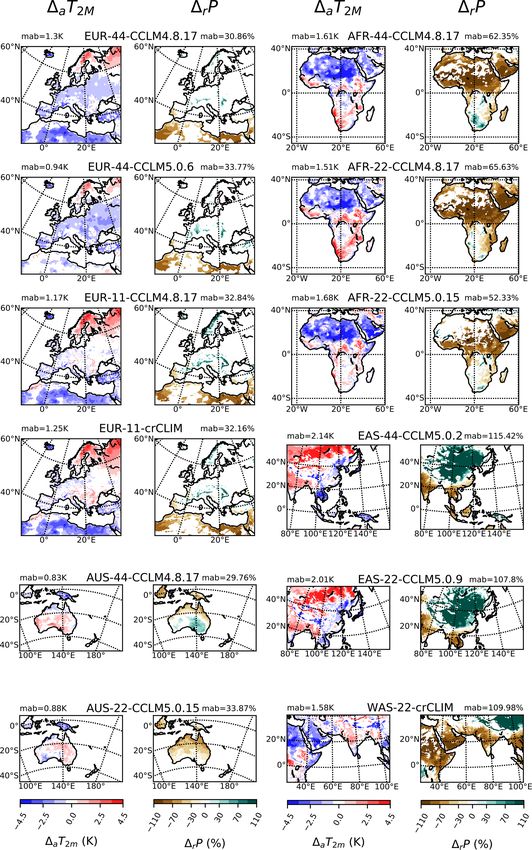
S. L. Sørland et al.: COSMO-CLM simulations within CORDEX                                     5135

Figure 3. Same as Fig. 2 but for DJF.

https://doi.org/10.5194/gmd-14-5125-2021                    Geosci. Model Dev., 14, 5125–5154, 2021
5136                                                          S. L. Sørland et al.: COSMO-CLM simulations within CORDEX

Figure 4. Spatial Taylor diagram exploring the model performance for JJA and DJF for precipitation and 2 m air temperature for each
domain (labeled with colors) by considering the ERA-Interim-driven simulations. The diamonds (circles) are the 12 km or 24 km, respectively
(50 km), simulations. The older model version is marked with a white star inside the symbols. The triangle is the mean of all observations.

a common dataset, i.e., with the same horizontal resolution             tions (CCLM4-8-17 and CCLM5-0-6) and two EUR-11 sim-
and underlying methodology. Nevertheless, the bias pattern              ulations (CCLM4-8-17 and COSMO-crCLIM). With this en-
shown in Figs. 2 and 3 for Europe agrees with earlier studies           semble, we can explore the differences between model ver-
of COSMO-CLM (Kotlarski et al., 2014), with a warm and                  sions and horizontal resolutions. For the summer tempera-
dry (cold and wet) bias during the summer season over south-            ture bias, changing the horizontal resolution has very little
ern/southeastern (northern/northeastern) Europe. During the             impact on the spatial bias pattern when comparing the ver-
winter, there is a pronounced cold and wet bias over the                sion CCLM4-8-17 between EUR-11 and EUR-44. However,
whole of Europe, except in northern parts of Scandinavia. For           during the winter season, the cold bias is slightly reduced in
the winter precipitation bias shown in Fig. 3, often the spread         EUR-11, but a larger warm bias is seen over the northern ar-
between the observation datasets is larger than the magnitude           eas. When comparing the model versions, the newer versions
of the bias. These bias patterns are also seen in the majority          tend to have a colder climate than the older model version,
of the European RCMs (Kotlarski et al., 2014) and have been             so some of the warm bias is removed (e.g., over southeastern
suggested to be related to using outdated aerosol climatology           Europe), but this then enhances the cold bias elsewhere (e.g.,
or improperly parameterized processes (e.g., convection, mi-            over northern/northeastern Europe).
crophysics, or land-surface processes; Vautard et al., 2013;               The precipitation bias is similar between the model ver-
Davin et al., 2016; Sørland et al., 2020).                              sions, configurations, and resolutions, but there is a tendency
   Following the EURO-CORDEX framework, COSMO-                          for the higher-resolution simulations to be wetter, which re-
CLM has contributed with simulations using four different               duces the dry bias over, e.g., eastern Europe in summer, but
model configurations and resolutions, two EUR-44 simula-

Geosci. Model Dev., 14, 5125–5154, 2021                                                  https://doi.org/10.5194/gmd-14-5125-2021
S. L. Sørland et al.: COSMO-CLM simulations within CORDEX                                                                  5137

then the wet bias is increased, seen over the northeastern       These results suggest that it is not enough to only change the
parts.                                                           horizontal resolution but that it is also important to re-tune
   The mean absolute biases over land for temperature and        the model configuration to the new resolution employed, and
precipitation (Figs. 2 and 3 and Table S4) suggest that there    similar findings are found when using other RCMs (Wu et al.,
is no clear configuration that has a lower absolute bias         2020).
for both parameters for all seasons. For instance, EUR-44-          The newer and higher-resolution model (AFR-22
CCLM4-8-17 (EUR-44-CCLM5-0-6) simulations have the               CCLM5-0-15) has the lowest model bias in terms of JJA
largest (smallest) absolute mean winter temperature bias but     temperature bias, where for instance the warm bias over the
at the same time the lowest (highest) absolute mean winter       Sahara is reduced. Nevertheless, the reduction in the warm
precipitation bias.                                              bias enhances the cold bias in the winter season. The JJA
                                                                 precipitation bias is also lower in the AFR-22 CCLM5-0-15
Africa                                                           simulation, but the bias dipole due to poor ITCZ represen-
                                                                 tation is still present. A lower DJF precipitation bias is also
Africa is among the regions most vulnerable to climate           observed for the AFR-22 CCLM5-0-15 simulations.
change (Giorgi et al., 2009; Niang et al., 2014), and in re-
cent years there has been a huge effort to produce regional      Australasia
climate projections across Africa (e.g., Nikulin et al., 2012;
Kothe et al., 2014; Dosio et al., 2015; Thiery et al., 2016;     The Australasian CORDEX domain is centered around the
Schulz et al., 2016). However, due to the African continent’s    mainland Australian continent, covering different climate
large and cross-equatorial extent, the CORDEX model do-          zones due to the large extent. The northern part has a tropi-
main covers multiple climatic zones, from southern mid lati-     cal climate, while the southern part is more sub-tropical with
tudes over moist tropical to desert climates, yielding a chal-   mild winters. While a large part of Australia is categorized
lenge for RCM groups to set up an optimal model config-          as arid or semi-arid regions and this dry surface state am-
uration. The COSMO-CLM ensemble over Africa consists             plifies heat waves (Hirsch et al., 2019), the southern coast
of two model versions, CCLM4-8-17 following the AFR-44           and New Zealand have a temperate climate. The COSMO-
framework and CCLM5-0-15 for AFR-22 (Table S1). More-            CLM ensemble over Australasia consists of two horizon-
over, as part of the study by Panitz et al. (2014), CCLM4-       tal resolutions (AUS-22 and AUS-44) with two model ver-
8-17 was used to simulate over the African domain with a         sions with quite different configurations, as the AUS-44
higher resolution (AFR-22), mainly to investigate the effect     CCLM4-8-17-CLM3-5 simulation is coupled to the Com-
of increased horizontal resolution while keeping most of the     munity Land Model (Davin et al., 2011), compared to the
configuration unchanged (only the time step was changed;         AUS-22 CCLM-5-0-15, which uses the standard TERRA-
see Table S1). Thus, with the three-member CCLM ensem-           ML scheme (Schrodin and Heise, 2001). These differences
ble over Africa, we can investigate the effect of employ-        in both resolution and configuration should be kept in mind
ing different model versions (i.e., AFR-22 CCLM4-8-17 vs.        when comparing the two sets of simulations. The two evalu-
AFR-22 CCLM-5-0-15) and the effect of increased resolu-          ation runs exhibit quite different temperature biases, in par-
tion (i.e., AFR-44 vs. AFR-22). The general performance of       ticular during the austral winter season (i.e., JJA), where the
COSMO-CLM over Africa shows that the summer (winter)             AUS-44 simulation has a warm bias over most of the Aus-
hemisphere tends to exhibit a warm (cold) temperature bias       tralian continent, compared to a cold bias in the AUS-22 sim-
(Figs. 2–3), which is assumed to be caused by a wrong rep-       ulation (Figs. 2–3). The winter precipitation bias is more sim-
resentation of clouds, especially at the Intertropical Conver-   ilar between the two simulations, with a dry bias over large
gence Zone (ITCZ) (Kothe et al., 2014). The most striking        areas, except over central Australia, which has a wet bias for
result is that the model performance is very little influenced   the AUS-44 simulation. During austral summer (i.e., DJF),
when using the same model version with almost the same           a cold temperature bias and dry precipitation bias are seen
configuration but different horizontal resolution, consistent    for both simulations over the tropical regions (i.e., the north-
with the findings in Panitz et al. (2014). When the horizon-     ern part of the model domain). Elsewhere AUS-44 shows a
tal resolution is increased together with using an updated       warm bias and AUS-22 a warm bias except for the southern
model version and modifying the configurations, the results      coast. The precipitation bias during the summer resembles
for AFR-22 and AFR-44 differ more. Thus, the model perfor-       the winter pattern but with larger magnitudes. Based on vi-
mance seems to be more sensitive to model version and con-       sual inspection, no simulation seems to perform better than
figuration than to the horizontal resolution, and this is seen   the other, and the bias is sometimes within the range of the
for both the temperature and precipitation for all the sea-      spread of the observations, in particular for the winter pre-
sons. The AFR-22 simulation with CCLM5-0-15 has been             cipitation and summer temperature. When comparing mean
run with an increased number of vertical levels and changes      absolute land biases, AUS-44 CCLM4-8-17-CLM3-5 (AUS-
in the aerosol climatology and some of the tuning parameters     22 CCLM5-0-15) simulation exhibits the best performance
compared to the simulations with the older model version.        for DJF (JJA) (Table S4).

https://doi.org/10.5194/gmd-14-5125-2021                                           Geosci. Model Dev., 14, 5125–5154, 2021
5138 S. L. Sørland et al.: COSMO-CLM simulations within CORDEX
East Asia bias is reduced, which seems to be due to the use of spectral
nudging that constrains the CCLM simulation to be closer to
East Asia features high population density, a great variety the large-scale flow from ERA-Interim (Lee et al., 2016). In
of topography and vegetation, and complex climate systems, contrast, EAS-22 shows a stronger dry bias over India than
being a region vulnerable to climate change (Konapala et al., seen in EAS-44, which might be associated with the differ-
2020). It is strongly influenced by the monsoon system, ent spatial domains (i.e., the larger part of the Indian Ocean
characterized by a cold dry winter season, with dominant in EAS-44). During the winter, when the large-scale forcing
northerly flow from the northern interior, and a warm rainy is stronger, the biases in EAS-44 and EAS-22 are quite sim-
summer season, with southerly flow advecting moisture from ilar, suggesting that these biases are related to the physical
the ocean. parameterization schemes used, for instance the deep con-
Great efforts have been made to understand the regional vection or the land-surface scheme. The mean biases over
monsoon climate over East Asia using regional climate mod- land for the two simulations for the different seasons are of
els, starting with the Regional Climate Model Intercompari- similar magnitude, seen both for temperature and precipita-
son Project (RMIP) for Asia (Fu et al., 2005). COSMO-CLM tion. However, it should be noted that the magnitude of the
has been used extensively over the region to study different precipitation bias is among the largest of the considered do-
atmospheric processes, such as surface wind (Feser and von mains (see Table S4), suggesting that the model experiences
Storch, 2008; Li et al., 2016), as well as the regional climate particular deficiencies in simulating the climate of East Asia.
(Wang et al., 2013; Huang et al., 2015; Zhou et al., 2016; Li
et al., 2018). South Asia
CORDEX simulations over East Asia at 0.44◦ (EAS-44)
and 0.22◦ (EAS-22) have been performed with versions The South Asian domain (WAS) comprises several challeng-
CCLM5-0-2 and CCLM5-0-9, respectively. Due to an up- ing features to simulate properly with a regional model, such
dated EAS-CORDEX domain, the domains are not identical: as the complex topography from the Himalayan and Hindu-
while EAS-44 follows the CORDEX framework for the first Kush mountain chains in the north or the tropical climate rep-
phase, which covers a large area including Southeast Asia resented by a strong seasonal rainfall from the South Asian
and northern Australia, EAS-22 follows the second phase monsoon circulation. For the CORDEX WAS domain, only
with a smaller domain excluding tropical Southeast Asia one evaluation integration exists, performed with COSMO-
(Zhou et al., 2016). Note that a Southeast Asia CORDEX crCLIM-v1-1 at 0.22◦ grid spacing (WAS-22). During the
domain has been established (Tangang et al., 2020). Thus, boreal summer, a cold bias over northern parts of India, the
the different domains might have an influence on the model Horn of Africa, and Myanmar (Fig. 2) is seen. Interestingly,
performance. Keeping this effect of the different domains in this cold bias is connected with a dry bias as seen over India
mind together with EAS-22 applying spectral nudging, we and parts of the African region. The dry bias over the interior
compare simulations over East Asia conducted with a simi- of the Indian subcontinent is also observed in earlier studies
lar model version at different horizontal resolutions and with where COSMO-CLM is forced with other reanalysis prod-
different model configurations. ucts (e.g., ERA-40 reanalysis in Dobler and Ahrens, 2010,
During boreal summer (Fig. 2), EAS-44-CCLM5-0-2 and NCEP reanalysis II data in Rockel and Geyer, 2008). The
tends to feature a warm bias over eastern China and part dry bias in the summer monsoon rainfall has been attributed
of northwestern China and Kazakhstan, while a cold bias is to the lack of moisture transport into the interior parts of the
found over southern India and Indochina. In winter (Fig. 3), Indian subcontinent due to the excess rainfall over the West-
warm biases are widely distributed over the northern part of ern Ghats and its nearby warm southeastern Arabian Sea and
the East Asian domain and large parts of India, while a cold also plausible inconsistencies in the representation of con-
bias is seen over eastern China, Indochina, and the tropical vection (Ahrens et al., 2020). The dry bias is also present
islands. The precipitation during summer shows a dry bias in in the EAS-22 simulation, with its East Asian domain partly
the same region as with warm bias, while the wet bias occurs overlapping with the South Asian domain. Moreover, over
mainly over the Tibetan Plateau. During winter, there is a wet the Horn of Africa, the JJA precipitation bias in WAS-22 is
bias of more than 70 % over the northern interior and a dry similar to the CCLM biases in the AFR-22 and -44 simu-
bias of similar magnitude over India and Indochina. lations. Thus, it seems that these biases are not due to the
The EAS-22 simulation shows similar summer bias pat- choice of the model configuration or location of the domain
terns to EAS-44, including the warm and dry bias in the but rather due to some processes being wrongly represented
northwestern inland area and the cold bias in the Indochina in COSMO-CLM.
Peninsula. However, the strong warm and dry bias in EAS- During the winter season, there is a warm bias over north-
44 over eastern China is not present in EAS-22. This warm western India and the Ethiopian Highlands and a cold bias
and dry bias in the EAS-44 simulation might be a result of over northern Africa and the Middle East (Fig. 3). A simi-
a deficient summer monsoon circulation, where the precip- lar cold bias is also seen over Africa and the Middle East in
itation over land is not properly simulated. In EAS-22 the the AFR-22 and AFR-44 simulations. For precipitation, a dry
Geosci. Model Dev., 14, 5125–5154, 2021 https://doi.org/10.5194/gmd-14-5125-2021You can also read