Vulnerability and adaptation to sea-level rise in Auckland, New Zealand Georgina Hart
←
→
Page content transcription
If your browser does not render page correctly, please read the page content below
Vulnerability and adaptation to sea-level rise in Auckland,
New Zealand

         Georgina Hart

         NZCCRI 2011 report 08
         October 2011

         The New Zealand Climate Change Research Institute
         Victoria University of Wellington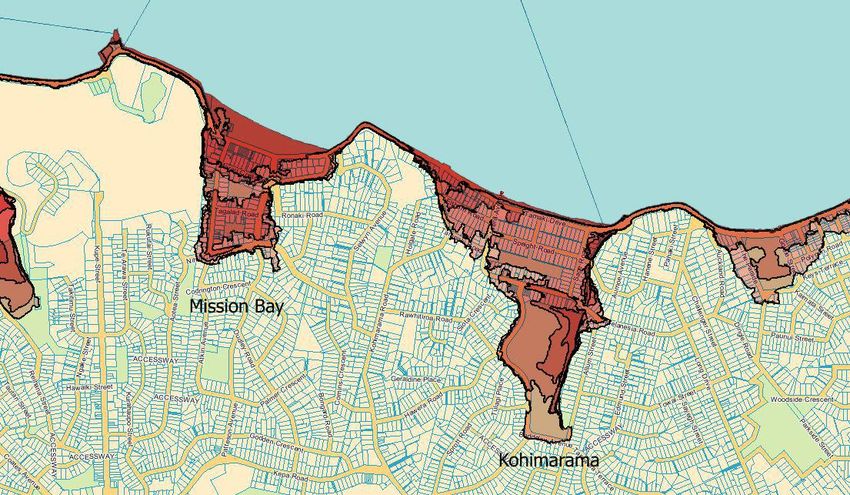
The New Zealand Climate Change Research Institute
School of Geography, Environment and Earth Sciences
Victoria University of Wellington
PO Box 600
Wellington
New Zealand

Contact:           Liz Thomas
Phone:             (04) 463 5507
Email:             liz.thomas@vuw.ac.nz

Acknowledgements
This research was funded by the Foundation for Research, Science and Technology under contract
VICX0805 Community Vulnerability and Resilience. The research was conducted as a Masters of
Environmental Studies supervised by Associate Professor Ralph Chapman of the School of
Geography, Environment and Earth Sciences at Victoria University of Wellington, and Dr Andy
Reisinger at the New Zealand Climate Change Research Institute, Victoria University of Wellington
(CCRI) now at the New Zealand Agricultural Greenhouse Gas Research Centre. Ongoing support and
review was provided by Judy Lawrence, Adjunct Research Associate (CCRI). Simon Tegg and
Dorothee Quade, research assistants at CCRI, contributed to this document. Professor Martin
Manning (CCRI), as research programme leader, provided invaluable support and reviewed the draft
of this report along with Ann Magee (previously Auckland Regional Council) for which the researcher
is very grateful. Inundation modelling was conducted by Doug Ramsay, Rob Bell, and colleagues at
the National Institute of Water and Atmospheric Research (NIWA), and initial GIS analysis was
conducted by Scott Schimmel (Victoria University of Wellington) Auckland Regional Council.
Auckland and Manukau city councils provided ongoing input and support, including GIS data and
data licences for inundation modelling. The researcher would also like to sincerely thank the
interview participants whose input was crucial to this research.
Contract: E1307

 Vulnerability, Resilience, and Adaptation Objective 2 reports, October 2011
 NZCCRI-2011-01       Synthesis: Community vulnerability, resilience and adaptation to climate change in New Zealand
 NZCCRI-2011-02       Vulnerability and adaptation to increased flood risk with climate change—Hutt Valley summary (Case
                      study: Flooding)
 NZCCRI-2011-03       The potential effects of climate change on flood frequency in the Hutt River (SGEES client report)
                      (Case study: Flooding)
 NZCCRI-2011-04       Potential flooding and inundation on the Hutt River (SGEES client report) (Case study: Flooding)
 NZCCRI-2011-05       RiskScape: Flood-fragility methodology (NIWA client report) (Case study: Flooding)
 NZCCRI-2011-06       Vulnerability and adaptation to increased flood risk with climate change—Hutt Valley household
                      survey (Case study: Flooding)
 NZCCRI-2011-07       Perspectives on flood-risk management under climate change—implications for local government
                      decision making (Case study: Flooding)
 NZCCRI-2011-08       Vulnerability and adaptation to sea-level rise in Auckland, New Zealand (Case study: Sea-level rise)
 NZCCRI-2011-09       Climate resilient water management in Wellington, New Zealand (Case study: Water security)
All reports available on the NZCCRI website: http://www.victoria.ac.nz/climate-change/reports

                                                            ii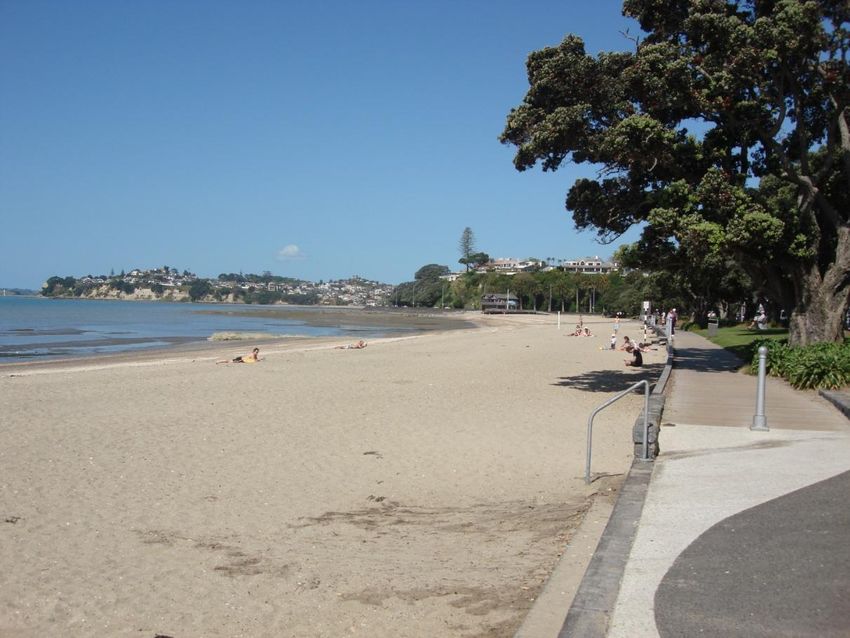
Contents
Executive summary .......................................................................................................................................... 1
    Research purpose......................................................................................................................................... 1
    Research questions ...................................................................................................................................... 1
    Research findings ......................................................................................................................................... 1

1      Introduction............................................................................................................................................. 3
    1.1        Research purpose ............................................................................................................................ 3
    1.2        Research questions .......................................................................................................................... 3
    1.3        Research methodology .................................................................................................................... 3
    1.4        Research framework ........................................................................................................................ 4

2      Case study background ............................................................................................................................ 9
    2.1        Sea-level rise and adaptation options............................................................................................... 9
    2.2        Legislative context ......................................................................................................................... 12
    2.3        The study sites ............................................................................................................................... 13

3      Potential impacts of sea-level rise .......................................................................................................... 21
    3.1        Methods ........................................................................................................................................ 21
    3.2        Changing 1 percent AEP levels and inundation mapping ................................................................. 22
    3.3        Results: Potential socioeconomic impacts ...................................................................................... 26

4      Adaptation opportunities and barriers ................................................................................................... 29
    4.1    Coastal-hazards management: The current approach ..................................................................... 29
    4.2        Preparing for sea-level rise............................................................................................................. 34
    4.3        Adaptation response options at the study sites .............................................................................. 42

5      Conclusion ............................................................................................................................................. 47

6      References ............................................................................................................................................. 53

7      Appendices ............................................................................................................................................ 57
    Appendix 1: Sea-level rise response options ............................................................................................... 57
    Appendix 2: Managed retreat implementation options ............................................................................... 59
    Appendix 3: Summary of NIWA extreme sea levels methods and results ..................................................... 61
    Appendix 4: Interview schedule .................................................................................................................. 63
    Appendix 5: Interview participants ............................................................................................................. 67

                                                                               iii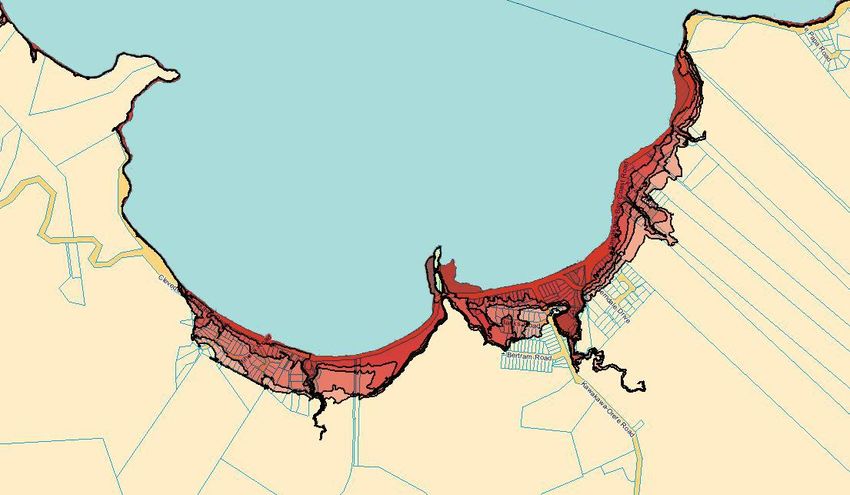
List of tables and figures
Table 1. Typology of adaptation actions, modified from Smit & Wandel (2006). ........................................ 5
Table 2. Recent scientific projections of sea-level rise by 2100, adapted from The Royal Society (2010)... 11
Table 3. Predicted water levels above Auckland Vertical Datum (AVD-46) for AEP of 50%, 10%, 2%, and
1%, for Waitemata Harbour, for the present day and with local relative
sea-level rise of 0.5m, 1.0m, and 1.5m relative to present day mean sea level (2007 MSL). ........ 23
Table 4. The number of people and percentage of census area population potentially affected during
a 1% AEP event for the present day and three sea-level rise scenarios....................................... 27
Table 5. Summary of key findings of this study. ....................................................................................... 48
Table 6. Predicted storm tidewater levels in metres above Auckland mean sea level datum
(AVD-46) at the Auckland Ports Ltd. gauge site and their approximate AEP (% and approximate
ARI) for the present day and for local relative mean sea-level rise of 0.5, 1.0, and 1.5m relative
to present day (2007 MSL). ........................................................................................................ 62
Figure 1. Vulnerability and its components (Allen Consulting, 2005) ........................................................... 4
Figure 2. Map showing the case study locations within the Auckland Region. The map also
shows the former district and regional council boundaries. The inset map shows Auckland
region within the North Island of New Zealand
( Auckland Council, reprinted with permission). ...................................................................... 14
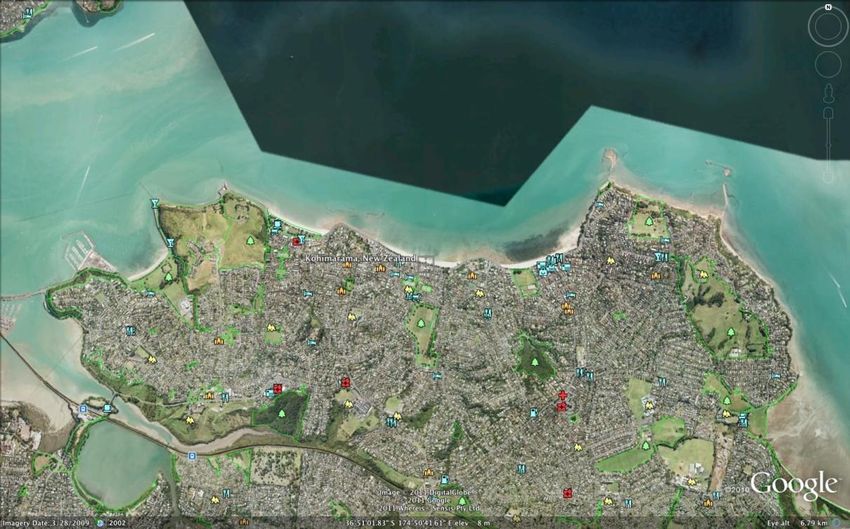
Figure 3. Satellite image of the Eastern Bays area, Mission Bay (left) and Kohimarama (right)
are circled (Source: Google Earth, 2010)..................................................................................... 15
Figure 4. Looking east along Kohimarama beach at mid-tide, 2010. ( 2010 Georgina Hart) ..................... 16
Figure 5. Looking east along Kohimarama Beach during the storm of January 23 2011
( 2011 Benjamin Eitelberg. Reprinted with permission) ........................................................... 17
Figure 6. Satellite image of Kawakawa Bay (Source: Google Earth, 2010) .................................................. 18
Figure 7. Change to extreme tide levels and potential static inundation for a 1% AEP event
with sea-level rise of 0.5m, 1.0m, and 1.5m (lower bound), at Mission Bay / Kohimarama. ......... 24
Figure 8. Change to extreme tide levels and potential static inundation for a 1% AEP event
with sea-level rise of 0.5m, 1.0m, and 1.5m (lower bound), at Kawakawa Bay. ........................... 25
Figure 9. Number of properties potentially affected by coastal inundation during a 1% AEP
water level event, for present day local mean sea level and for local relative sea-level rise of
0.5m, 1.0m, 1.5m, and 2.0m sea-level rise (lower bound) at Mission Bay / Kohimarama and
Kawakawa Bay. .......................................................................................................................... 28
Figure 10. Total economic value of properties potentially affected by coastal inundation
during a 1% AEP water level event, for the present day local mean sea level and for local
relative sea-level rise of 0.5m, 1.0m, and 1.5m (lower bound) at Mission Bay / Kohimarama
and Kawakawa Bay. ................................................................................................................... 28
Figure 11. 1% AEP event static inundation contour for 0.5, 1.0, 1.5, and 2.0m sea-level rise at Mission Bay
/ Kohimarama............................................................................................................................ 65
Figure 12. 1% AEP event static inundation contours for 0.5, 1.0, 1.5, and 2.0m sea-level rise at Kawakawa
Bay. ........................................................................................................................................... 66
iv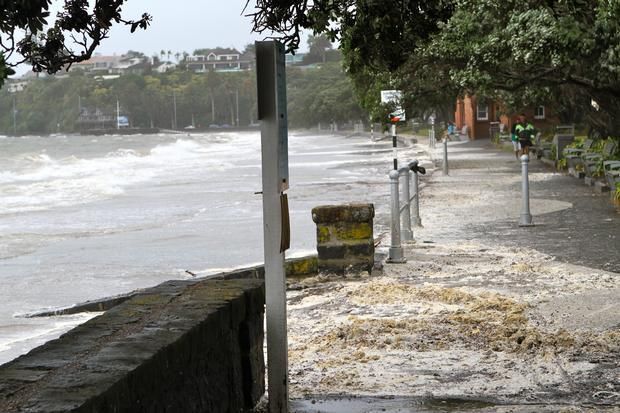
List of acronyms
ACC                    Auckland City Council

AEP                    Annual exceedance probability

ARC                    Auckland Regional Council

ARI                    Average return interval

CMA                    Coastal management area

EQS                    Engineering quality standards

GCM                    Global climate models

GIS                    Geographic information system

GNS                    Geological and Nuclear Sciences

ICZM                   Integrated coastal zone management

IPCC                   Intergovernmental Panel on Climate Change

MCC                    Manukau City Council

MfE                    Ministry for the Environment

NES                    National environmental standard

NIWA                   National Institute of Water and Atmospheric Research

NPS                    National policy statement

NZCPS                  New Zealand Coastal Policy Statement

RMA                    Resource Management Act 1991

RPS                    Regional policy statement

                   v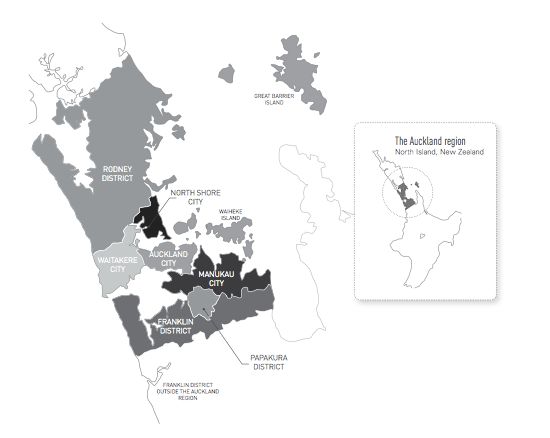
Executive summary
Research purpose
This report sets out the findings of an Auckland-based case study investigating vulnerability and
adaptation to sea-level rise at existing residential settlements. This case study focused on two
coastal settlements, Mission Bay / Kohimarama, and Kawakawa Bay, both part of New Zealand’s
largest city—Auckland. A case study methodology was applied to conduct an in-depth investigation
of the issues related to planning for long-term sea-level rise and coastal-hazards management at the
study sites, and more generally for existing development in the Auckland region.
The study aimed to investigate:
how Auckland may be affected by changing coastal conditions as sea level rises
adaptation options for responding to sea-level rise and barriers to their implementation
the potential that different management options have for reducing vulnerability and increasing
resilience of existing coastal settlements.
Research questions
The study was structured around answering the following four research questions:
1. What effect will sea-level rise have on extreme sea levels at the study sites, and how will the
impacts related to a 1 percent annual exceedence probability (AEP)1 event vary for a range of
sea-level rise scenarios change (in the absence of adaptation)?
2. How are coastal hazards and projected sea-level rise managed in Auckland and at the study
sites?
3. What adaptation opportunities and barriers exist at the two study sites?
4. Could managed retreat be implemented at either of the study sites? What are the particular
issues for, and barriers to, implementing managed retreat?
Research findings
Participating councils are in the early stages of planning for future sea level rise
This study found that current coastal management at the participating councils was in the early
stages of considering sea-level rise effects, and that in most instances the use of adjusted flood-
mitigation measures (e.g. minimum site levels) was considered adequate for protecting private
property against hazard risk. However, guidance information generated by participating councils has
not taken into account the potential for high rates of sea-level rise by 2100. Recent internationally
published projections (e.g. Pfeffer, et al., 2008; Rahmstorf, 2007) indicate that the rate of sea-level
rise could increase dramatically in the second half of the twenty-first century. This means that if
1
AEP is the probability that a given water level will be exceeded within a 1-year time period, and is usually
expressed as either a fraction or a percentage. An alternative way of describing flood risk is in terms of average
return intervals (ARI).
1proactive responses are delayed, responses could be required much more rapidly in the future,
which could have significant structural and economic implications for future generations.
Coastal-hazards risk will increase at Mission Bay / Kohimarama and Kawakawa Bay and adaptation
will be required
Mission Bay / Kohimarama and Kawakawa Bay, Auckland will experience increasing coastal-hazard
risk as the numbers of people and property potentially affected by storm events increases as sea
level rises. Findings from the present study suggest that existing settlements in the Auckland region
may already be ‘locked in’ to a coastal adaptation approach focused on maintaining the current
coastline through coastal stabilisation. This approach will decrease community resilience and
increase vulnerability in the long term, even if it is found to be a successful short-term response.
Retreat offers an alternative approach that is strongly aligned with reducing community vulnerability
and increasing resilience. However, strong opposition from communities to any retreat approach is
expected. Developing trusted climate science information, education around coastal hazard risk, and
participatory community-led decision making were identified as central enablers for a retreat
approach to be included as a viable coastal-adaptation option for communities in the Auckland
region.
21 Introduction
1.1 Research purpose
This report sets out the findings of an Auckland-based case study investigating vulnerability and
adaptation to sea-level rise at existing residential settlements. This project has been conducted
simultaneously as master’s thesis research and as one of three case studies that form Objective 2 of
the collaborative, interdisciplinary research project on Community Vulnerability, Resilience and
Adaptation to the impacts of climate change. The project is led by Victoria University and funded by
the Foundation for Research, Science and Technology (FRST)2. The aim of the project was to develop
a ‘New Zealand specific framework for the comprehensive identification of community vulnerability,
and options for increasing resilience’ (CCRI, 2008, p. 3).
This case study focused on two coastal settlements, Mission Bay / Kohimarama, and Kawakawa Bay,
both part of New Zealand’s largest city—Auckland. A case study methodology was applied to
conduct an in-depth investigation of the issues related to planning for long-term sea-level rise and
coastal-hazards management at the study sites, and more generally for existing development in the
Auckland region.
The study aimed to investigate:
how Auckland may be affected by changing coastal conditions as sea level rises
adaptation options for responding to sea-level rise and barriers to their implementation
the potential that different management options have for reducing vulnerability and increasing
resilience of existing coastal settlements.
1.2 Research questions
The study was structured around answering the following four research questions:
1. What effect will sea-level rise have on extreme sea levels at the study sites, and how will the
impacts related to a 1 percent annual exceedence probability (AEP) event vary for a range of sea-
level rise scenarios change (in the absence of adaptation)?
2. How are coastal hazards and projected sea-level rise managed in Auckland and at the study sites?
3. What adaptation opportunities and barriers exist at the two study sites?
4. Could managed retreat be implemented at either of the study sites? What are the particular
issues for, and barriers to, implementing managed retreat?
1.3 Research methodology
To address the research questions, potential inundation during a 1 percent AEP event was mapped
at the study sites and potential socio-economic impacts were assessed using geographic information
system (GIS) analysis. A series of in-depth interviews were conducted using this information about
changing risk. Impacts and adaptation response information were used in the interviews to discuss
2
FRST was merged in February 2011 with the Ministry of Research, Science and Technology (MoRST) to form
the Ministry of Science and Innovation (MSI), which is responsible for the policy and investment functions of
both those agencies.
3experiences of sea-level rise response to date and views regarding options for the future. Qualitative
thematic analysis of the interview transcripts was undertaken to describe the current approach,
issues, and barriers to coastal-hazards management and sea-level rise response; and the views of
interview participants to various sea-level rise response options at the two study sites.
1.4 Research framework
1.4.1 Vulnerability
In this study, vulnerability is understood as a function of exposure, sensitivity, and adaptive
capacity—a framework that reflects the vulnerability-assessment literature (Cutter, 1996; Metzger,
Leemans, & Schröter, 2005; Metzger & Schröter, 2006; Preston, et al., 2008; Preston & Stafford-
Smith, 2009; Schröter & ATEAM consortium, 2004; Smit & Wandel, 2006; Turner II, et al., 2003) and
as used in the IPCC Fourth Assessment Report 2007, which defines vulnerability as ‘the degree to
which a system is susceptible to, and unable to cope with, adverse effects of climate change’
(Intergovernmental Panel on Climate Change, 2007, p. 883). Vulnerability and its components are
shown in Figure 1.
Figure 1. Vulnerability and its components (Allen Consulting, 2005)
1.4.2 Exposure
Exposure generally refers to the state and change in external stresses that a system is exposed to. In
the context of climate change, these are normally specific climate and other biophysical variables
(including their variability and frequency of extremes). The location of people and assets can also be
regarded as exposure (Intergovernmental Panel on Climate Change, 2007; Preston & Stafford-Smith,
2009).
1.4.3 Sensitivity
Sensitivity is the degree to which a system is affected, adversely or beneficially, by a given exposure
(Intergovernmental Panel on Climate Change, 2007). A system can be sensitive to direct (physical)
impacts (e.g. a given change in rainfall affects the water supply of a city) as well as indirect (socio-
4economic) impacts (e.g. age structure of a population influences the degree to which mortality
increases during a heatwave).
1.4.4 Adaptation
Adaptation is change made by a given system in response to expected and / or experienced
exposure and sensitivity to climatic stimuli, and is defined as the ‘adjustment in natural or human
systems in response to actual or expected climatic stimuli or their effects, which moderates harm or
exploits beneficial opportunities’ (IPCC, 2007a, p. 27). Adaptation can be autonomous or planned. It
can be implemented in anticipation of future events, concurrently as events occur, or reactively after
events have occurred. Table 1 provides a typology of adaptation responses, including adaptation at
different scales, in different forms, and the degree of change. Given an expected degree of exposure
and sensitivity to an external climatic stressor or stimulus, the adaptation that actually occurs in
anticipation or response to stimuli is then essentially influenced by a system’s adaptive capacity.
Table 1. Typology of adaptation actions, modified from Smit & Wandel (2006)
Intent Timing Spatial scale Form Degree of change
Planned Anticipatory Local Behavioural Incremental
Autonomous Concurrent Regional Financial Transformational
Reactive National Technological
Institutional
1.4.5 Adaptive capacity
Adaptive capacity describes the ability of a system to adapt to climate change—to moderate
potential damages, take opportunities, or cope with adverse impacts (Intergovernmental Panel on
Climate Change, 2007; Smit & Pilifosova, 2003).
Adaptive capacity includes:
coping capacity (the ability to accept the impacts and recover back to the system state before
the impact, but does not change the system’s exposure or sensitivity to reduce future impacts)
the ability to adapt (the change in a system’s exposure or sensitivity to reduce future impacts).
Both coping capacity and ability to adapt can change over time for a number of reasons, for example
socio-economic change in a given area (Adger, 2006; Yohe & Tol, 2002; Turner II, et al., 2003; Eriksen
& Kelly, 2007).
The general framework described above represents a static snapshot of vulnerability in time. It does
not show interactions between components, nor the steps that can increase or reduce vulnerability
over time. Vulnerability is dynamic spatially and temporally, especially as risks and their
consequences are unlikely to increase linearly with increasing frequency and intensity of extreme
events. Further, adaptive capacity at the household, community, and regional scales are interlinked
and influence each other. Dynamic interactions between the components of vulnerability through
time and space mean that, further to the static framework given above, temporal and spatial
5components are also central to understanding and reducing vulnerability (Smit & Wandel, 2006; Smit
& Pilifosova, 2003).
Adger (2003) demonstrates that adaptive capacity is place and culture-specific and can only be
identified through place and culture specific research. Moser and Ekstrom (2010) highlight the
interconnected structural elements that provide the wider context within which adaptation decision
making takes place. The identification of these structural elements—the actors, the governance
regime in which they operate, and the characteristics of the system exposed to climate change—can
help to diagnose adaptation barriers.
An important insight from the resilience literature (Nelson, et al., 2007) is that adaptation can go
beyond being related to specific (static) risks. Through a resilience lens, adaptation is seen as the
ability to maintain a response capacity in the face of risks that keep changing and evolving. Human
capital, governance structures, and institutional flexibility are salient characteristics of human-
ecological systems that strongly influence successful adaptation to such changing risks. That is,
adaptation in which responses exhibit opportunity taking, and through system feedbacks, adaptation
of the system as a whole over time (Nelson, et al., 2007, p. 199).
1.4.6 Coastal vulnerability
A large body of work has developed specifically focused on vulnerability assessments of coastal
regions (IPCC CZMS, 1992b; Vellinga & Leatherman, 1989; Klein & Nicholls, 1999; Klein & Nicholls,
1999; McFadden, et al., 2007). A number of approaches for conducting coastal vulnerability
assessments have been developed, beginning with top-down approaches that focused on using a
priori vulnerability indicators (IPCC, 1990; IPCC CZMS, 1990; Nicholls, 1994), to more recent top-
down approaches that have built tools to quantitatively model vulnerability and build vulnerability
indices (Hinkel & Klein, 2009).
The Common Methodology for Assessing the Vulnerability of Coastal Areas (IPCC CZMS, 1992a), an
early coastal vulnerability assessment method, has seven analytical steps. The steps outline a
process to identify areas, people, and natural resources that are at risk, and to identify and assess
the costs and feasibility of responses in those instances of high risk, using seven indicators. The
common methodology, and subsequent early studies, developed some useful indicators for
assessing the exposure and sensitivity of coastal systems to sea-level rise and related impacts, some
of which are used in this study.
However, early methodologies have been criticised for not taking into account local social and
cultural contexts in relation to adaptation, among other things. More recently applied ‘bottom-up’
approaches have aimed to increase understanding of the local situational context (physical, social,
institutional factors) to allow the practical application of adaptation activities at the local scale (Smit
& Wandel, 2006). The Intergovernmental Panel on Climate Change (IPCC) (2007a) identified the
importance of development pathways for a community’s vulnerability to climate change, rather than
solely the magnitude of biophysical changes. This approach is consistent with a system / resilience
framework.
Within the context of coastal-hazards management, the legacy of past decisions (e.g. the location of
existing settlements and protection measures) affects today’s management choices, and decisions
made today will in turn affect the pathways taken in the future. Studies using the common
methodology have not typically considered local coastal interactions, nor local constraints and
6barriers to specific adaptation options. It is this sort of interaction, particularly, between local
government and the communities in the Auckland region, and the local barriers that policies face,
that this case study explores. For example, this study investigated the extent to which the system for
governing coastal hazards is starting to move beyond the legacies of past rather static approaches to
coastal-hazards management, to take a more dynamic view of risks over time and look to processes
to increase community engagement as part of building resilience to changing risks.
72 Case study background
2.1 Sea-level rise and adaptation options
2.1.1 Projected sea-level rise
Global mean sea level has risen, and will continue to rise, due to anthropogenic climate change
Global mean sea level is rising as a result of anthropogenic climate change and will continue to rise
for hundreds of years (IPCC, 2007b; The Royal Society of New Zealand, 2010). New Zealand’s mean
sea level rose at an average rate of 1.6mm per year throughout the twentieth century,
corresponding approximately with observations of the global mean (Hannah, 2004). It is expected
that New Zealand’s mean sea level will continue to rise approximately in line with global mean levels
over the coming century (MfE, 2008). An acceleration in the global mean rate of rise that has been
observed in the second half of the twentieth century has not been observed in New Zealand’s tidal
record (Hannah, 2004; Bindoff, et al., 2007). However, New Zealand’s mean sea level is estimated
using just four tide gauge records (Auckland, Wellington, Christchurch and Dunedin), which must be
corrected for land movement (Hannah, 2004), and satellite (altimetry) measurements introduced in
1993, which have recorded higher sea level values around New Zealand (AVISO, 2010), are not yet
included in analysis of mean sea-level change for New Zealand (2004).
For timeframes beyond 2100, sea-level rise of 10cm per decade should be considered
The IPCC’s most recent scientific assessment of climate change presented multiple model-based
projections of sea-level rise that ranged from 18–59cm of sea-level rise to the 2090s, relative to
1990 levels (Meehl, et al., 2007). The range represents outputs from a range of global climate
models (GCM) for six different future emissions scenarios. Observed sea-level rise from 1990 has
been tracking at the upper end of IPCC projections (Bindoff, et al., 2007). To achieve sea-level rise
around the lower end of the projected range, global greenhouse gas emissions would have to be
stabilised in the very near term (Ministry for the Environment, 2008).
Because GCM assumptions include static ice-sheet melt at 1990 rates, the IPCC cautioned that an
additional 10–20cm of sea-level rise could be expected—if the rate of ice-sheet melt increased
linearly with global temperature (Meehl, et al., 2007). Dynamic ice-sheet processes are not currently
included in global climate models. For this reason, the IPCC 2007 report emphasised that the model-
based projections given did not represent an upper limit for sea-level rise over the twenty-first
century, nor could a best estimate for sea-level rise by 2100 be given.
New Zealand’s current guidance on incorporating sea-level rise into long-term council planning and
coastal-hazards management (Ministry for the Environment, 2008) is based on the 2007 IPCC
projections. MfE recommends that for the timeframe to 2100 a base value sea-level rise of 0.5m
relative to 1990 be assessed, as well as:
‘assessment of the potential consequences from a range of possible higher sea-level rises of
at least 0.8m (relative to 1990)’ (Ministry for the Environment, 2008, p. 20).
The 0.8m value takes into account a linear increase in the rate of ice-sheet melt with global
temperature. The MfE guidance also emphasises that sea level will continue rising beyond 2100,
9even if greenhouse gas emissions are stabilised in the near term. Thus, it is recommended that for
timeframes beyond 2100, sea-level rise of 10cm per decade should be considered.
It is the rate of rise, rather than the total amount, that correlates with global mean temperatures
In the four years since the 2007 IPCC report, projections of sea-level rise have changed dramatically
(The Royal Society of New Zealand, 2010). Significant advances have been made in understanding
the processes contributing to sea-level rise, showing that all sea-level rise observed since 1950 could
be explained by climate change (where previously it could not) (Domingues, et al., 2008); that the
contribution to observed sea-level rise of glacier and ice-sheet melt is much higher than was
previously thought (Velicogna, 2009; Domingues, et al., 2008); and that, in the past, sea level may
have risen more than 2m per century (Rohling, et al., 2008). Recent projections of sea-level rise to
2100 include higher levels of rise than have previously been published, based on semi-empirical
methods used to extrapolate from past temperature and sea-level records (Rahmstorf, 2007;
Horton, et al., 2008). The increase in recent projections of sea-level rise to 2100 is due to the
inclusion of much higher contributions of ice-sheet melt in projections. The IPCC (2007) projections
assumed glacier and ice-sheet melt contributed just 25 percent to sea-level rise to 2100. However,
Domingues et al. (2008) showed that the contribution of glacier and ice-sheet melt to sea-level rise is
now around 60 percent, indicating that the contribution of these factors will continue to increase
over the twenty-first century. Support for the semi-empirical method for projecting sea-level rise
developed by Rahmstorf and others has been supported by recent work (Kemp, et al., 2011) that has
found that it is the rate of sea level rise rather than the total amount of rise that correlates with
global mean temperature over the last 2000 years.
Change will occur much more rapidly in the second half of the twenty-first century
Table 2 shows recent scientific projections of sea-level rise by 2100. Dynamic ice-sheet melt could
result in sea-level rise considerably larger than IPCC model-based projections (2007), with some
studies finding that increases of 1.6 to 2.0m by 2100 cannot be ruled out (Rahmstorf, 2007; Horton,
et al., 2008; Pfeffer, et al., 2008). The serious risks associated with these higher estimates of sea-
level rise by 2100 affirm the need for the full range of plausible sea-level rise projections to be
carefully considered when making decisions in the areas of long-lasting infrastructure and
settlement development (Nicholls, et al., in press). Recent studies have also found that the rate of
sea-level rise is likely to be much higher in the second half of the century than in the first, indicating
that change will occur much more rapidly in the second half of the twenty-first century. This may
result in the need for rapid response measures (with significant economic and structural
implications), especially if inertia in governance structures constrains early proactive adaptation.
10Table 2. Recent scientific projections of sea-level rise by 2100, adapted from The Royal Society (2010)
Source Projected sea-level rise by
2100 (m)
Pfeffer (2008) 0.8–2.0
Rahmstorf (2007) 0.5–1.4
Horton (2008) 0.5–1.0
Grinstead (2009) 0.3–2.2
Vermeer (2009) 0.75–1.9
Jevrejeva (2010) 0.6–1.6
2.1.2 Adaptation options
Increasing development and rising property values along the coast, coupled with rising sea levels and
other climate-related impacts are expected to significantly increase coastal-hazard risk over the
twenty-first century. Uncertainty around the future rate of sea-level rise, questions about the
response of coastal processes to large amounts of sea-level rise, and institutional and social barriers
make responding to and coping with future sea-level rise and its impacts a major challenge for
coastal management (Cutter, 2008; Ministry for the Environment, 2008; Blackett, et al., 2010; Cayan,
et al., 2009; Titus, et al., 2009).
The IPCC (IPCC CZMS, 1990; IPCC, 2007a) outlines three broad strategic options for responding to
sea-level rise:
1. Protect landward property using structural and non-structural coastal engineering structures.
2. Accommodate human settlements to the changing conditions through structural changes to
buildings.
3. Retreat from coastal-hazard-prone areas of the coast.
Beneath these high-level response approaches sits a range of specific response options and
mechanisms for their implementation.
Coastal protection attempts to ‘manage’ natural processes rather than managing people and land
use to avoid coastal hazards
Coastal protection works include structural coastal engineering works such as sea walls, revetments,
groynes, and breakwaters; and non-structural coastal engineering such as beach nourishment and
dune creation and restoration (see Appendix 1 for a comprehensive list of sea-level rise response
options). Coastal protection refers to ‘hold-the-line’ response strategies that attempt to ‘manage’
natural processes, as opposed to a focus on managing people and land use to avoid coastal hazards.
11Accommodation measures adjust human structures and behaviour to minimise risk
Accommodation measures include emergency planning and individual flood-protection measures
such as raising site levels, buildings, and infrastructure; and changing building codes.
Accommodation measures by themselves do not attempt to control natural processes, but rather
adjust human structures and behaviour to minimise risk. Accommodation measures may be an
effective response to periodic inundation, but are unlikely to be an effective response to a trend rise
in the scale or frequency of inundation and erosion.
The availability and affordability of insurance is likely to change
Insurance operates in New Zealand to underwrite risk, but recent disasters have highlighted that its
availability and affordability is likely to change. Increasing limits to the commercial insurability of
coastal property is going to have to be addressed by local government, through a careful long-term
planning process to avoid and minimise risk in which managed retreat will play a part in some
existing settlements.
Retreat adjusts human settlements and structures in response to coastal hazards
Retreat can be reactive (abandonment of property) or planned. Planned retreat refers to the
landward relocation of buildings and infrastructure when they are threatened by coastal hazards,
and can include policies and rules to limit new development and redevelopment in coastal hazard
areas and eventually removing or relocating buildings and assets landward in identified areas.
Retreat adjusts human settlements and structures in response to chronic coastal hazards. Planned
retreat is not considered widely applicable for highly developed urban areas with high levels of sunk
costs. Examples of planned retreat are predominantly cases where the land reclaimed by the sea has
been rural farmland or a natural system (e.g. a wetland or estuary)(Rupp & Nicholls, 2002).
Numerous methods and tools have been developed to assist in making decisions about the most
appropriate type, scale, and timing of adaptation at various scales from the global to the local
(Dickinson, 2008).
2.2 Legislative context
In New Zealand, responsibility for the (sustainable) management of natural and physical resources,
including avoiding or mitigating the effects of coastal hazards, is devolved to local authorities.
National instruments, technical support, and emergency funding come from central government.
New Zealand has a two-tiered local authority structure of regional councils and territorial authorities
(district and city councils) within regional boundaries. Local authorities derive their powers and
responsibilities from a number of statutes that define, support, and guide the management of
coastal hazards and sea-level rise in New Zealand.
The key statutory instruments setting out the roles and responsibilities for the management of
coastal hazards and sea-level rise are the: Local Government Act 2002; Resource Management Act
1991 (RMA); New Zealand Coastal Policy Statement 1994 and 2010 (NZCPS); Building Act 2004; and
the Civil Defence Emergency Management Act 2002. Since 2004, the RMA has empowered
exercising functions under the Act to have particular regard to the effects of climate change and thus
provides for anticipatory planning approaches for sea-level rise risk. The emergency management
legislation addresses reduction, readiness, response, and recovery from hazards—in practice the
emphasis is on the last three components. However, none of the key instruments mentioned here
12explicitly encourage communities to consider long-term dynamic adaptation to evolving coastal
hazards, or mention concepts such as transformational change, which may be required as changing
risks signal that ‘coping’ will not remain tenable in the future. Two exceptions are the 1994 NZCPS’s
recognition of the need to consider coastal-management options such as ‘abandonment or
relocation of existing structures’3, and the 2010 NZCPS’s mention of managed retreat in the context
of climate change4.
2.3 The study sites
Two study sites were selected to assess and compare adaptation response opportunities and
barriers for existing development. Both areas have been identified as having existing settlements
that may be affected by sea-level rise, primarily due to their low-lying elevation and proximity to the
coast (Ramsay, at al., 2008a; Ramsay, et al., 2008b). The adjacent bays, Mission Bay and
Kohimarama, are considered as one study site, and Kawakawa Bay another site, seen in Figure 2—a
map of the Auckland region and the position of each of the study sites in relation to each other.
Mission Bay / Kohimarama is a centrally located settlement with high-density, high-value
development, existing coastal-defence structures, and very low social deprivation scores (Crampton
& Atkinson, 2007). In contrast, Kawakawa Bay is a small settlement on the fringes of the Auckland
region, with low-levels of development, lower-value property, and mid-to-high-level social
deprivation scores (Crampton & Atkinson, 2007). Until 1 November 2010 they were under the
jurisdiction of different territorial authorities. Mission Bay / Kohimarama was within the Auckland
City Council (ACC) boundary, and Kawakawa Bay was within the Manukau City Council (MCC)
boundary. On 1 November 2010, all the Auckland authorities were amalgamated into one—the
Auckland Council (a unitary authority with both regional and territorial responsibilities and powers),
which is currently developing a spatial plan and a unitary plan for the region.
Auckland is New Zealand’s largest city, home to one third of the country’s population, and is growing
quickly. Auckland’s current population of 1.4 million (Statistics New Zealand, 2010), is projected to
reach two million by 2035, in just 24 years (Auckland Regional Council, 2010). Auckland is a coastal
region with significant areas of existing development at risk from coastal hazards, such as erosion
and episodic inundation, which are expected to be exacerbated by projected sea-level rise (Auckland
Regional Council, 2009).
3
Policy 3.4.6 of the NZCPS 1994.
4
Objective 5 and Policy 25 of the NZCPS 2010.
13Mission Bay/Kohimarama
Kawakawa Bay
Figure 2. Map showing the case study locations within the Auckland Region. The map also shows the former district
and regional council boundaries. The inset map shows Auckland region within the North Island of New
Zealand ( Auckland Council, reprinted with permission).
2.3.1 Mission Bay / Kohimarama
Mission Bay and Kohimarama are situated approximately 7km east of central Auckland on the
southern shore of Waitemata Harbour. The combined population of Mission Bay and Kohimarama is
around 12,180. This area is affluent—it has one of the highest average income levels in New Zealand,
some of New Zealand’s most expensive properties, and low socio-economic deprivation scores
(Statistics New Zealand, 2010; Crampton & Atkinson, 2007). Figure 2 shows the eastern bays area
with Mission Bay / Kohimarama circled. Mission Bay is the bay to the left and Kohimarama to the
right of the inside of the circle.
This area has a long history of Māori settlement. Ngāti Whātua (iwi of the Auckland isthmus region)
regard the coastline and waters of this area as having high cultural significance for their tribe (B.
Papa, December 08, 2010). European settlement began in the 1840s. Rapid development of the
eastern bays suburbs began after the completion of Tamaki Drive in 1932 (Auckland City Council,
1999). Since then, land use in this area has been predominantly low-to-mid-intensity residential
development, with limited multilevel development. A mix of other uses exists, including low-
intensity commercial development in small pockets, and high levels of recreational use.
The area’s views, beaches, coastal reserves, restaurants, and retail centres and the Tamaki Drive
‘Scenic Way’ make this stretch of coastline one of the most popular recreational areas in the region
(Auckland City Council, 1999). The area is considered both a highly modified residential (and in some
parts semi-urban) environment and a sensitive coastal system, with a coastal sensitivity rating of five
14(significant sensitivity), on a scale of seven—one being low sensitivity and seven being extreme
sensitivity5. Significant natural character, amenity value, and indigenous flora are important issues
highlighted by local authorities in the region (Auckland City Council, 1999).
Coastal environment and processes
The coastline in this area is a sheltered harbour environment with relatively low-energy wave action
(Auckland City Council, 1999). Construction of Tamaki Drive involved considerable modification of
the coastline including the construction of a sea wall that runs from Mechanics Bay to St. Heliers Bay
(this includes the study area). The sea wall altered the natural shape of the coast and coastal
processes. As well as this, the increase in impermeable surface area and development of the
stormwater system draining into the small embayments has resulted in altered sediment and
current patterns.
Coastal hazards and management decisions to date
Mission Bay / Kohimarama has experienced long-term coastal erosion following the construction of
the Tamaki Drive sea wall (Abott.J.E., 1987, cited in Hamill, 1988). Historic long-term erosion led to
the loss of the high tide beaches in both embayments, and the partial failure of the Tamaki Drive sea
wall. Council response has been to publicly fund beach renourishment at Mission Bay in the mid-
1990s, and at Kohimarama in the mid-2000s. It is unknown how long renourishment undertaken at
the sites will last. Further coastal protection works are expected to be required in the future if
protection of the sea wall, road, and adjacent coastal reserve is to continue (Beca Carter Hollings &
Ferner Ltd, 2003).
Figure 3. Satellite image of the Eastern Bays area, Mission Bay (left) and Kohimarama (right) are circled (Source:
Google Earth, 2010).
5
See Buckland Brown Ltd. (1994) for methodology and criteria of this rating.
15A small number of houses are believed to be at risk of inundation today for a 1 percent AEP water-
level event (Ramsay et al., 2008a). However, the main disruptions caused by large coastal storms
today would be:
over topping of sea walls and inundation of reserve land and Tamaki Drive
traffic disruption due to the road being inundated
potential damage to the Tamaki Drive sea wall and erosion of beach sediments.
Areas susceptible to current inundation risk up to the 1 percent AEP storm tidewater level are
considered by council to be adequately accounted for by council maps of areas prone to flooding
(Craig, 2010). New development in identified flood-risk areas is subject to minimum freeboard6
standards under section 5D of the Auckland City Council District Plan Isthmus section (Auckland City
Council, 1999). Because current flood risk is managed through minimum freeboard levels for
buildings, no further action has been taken in response to new information showing changing risk of
coastal inundation. Council officers have identified that the new Auckland Council will have to take
considerable steps to plan for changing conditions due to projected sea-level rise (Craig, 2010).
Figure 4. Looking east along Kohimarama beach at mid-tide, 2010. ( 2010 Georgina Hart)
6
Freeboard is a factor of safety usually expressed in feet above a flood level for purposes of floodplain
management.
16Figure 5. Looking east along Kohimarama Beach during the storm of January 23 2011 ( 2011 Benjamin Eitelberg.
Reprinted with permission)
Figure 4 shows Kohimarama beach at mid-tide, looking east. Figure 5 shows Kohimarama beach at
high tide during a large coastal storm event on the weekend of 22–23 January 2011, looking east.
This storm resulted in coastal inundation, as well as stormwater flooding. Private properties were
flooded as a result of this storm. However, this flooding was primarily caused by stormwater system
overflow caused by rainfall. The Tamaki Drive sea wall (seen in Figures 4 and 5 above) is considered a
significant regional asset with iconic heritage values. This heritage status, coupled with the large
scale of sunk costs in the Tamaki Drive scenic way (road, cycle ways, coastal reserve, and sea wall
protection), may represent existing ‘lock in’ to a particular pathway for response to sea-level rise—
the continued armouring of the coast to protect these assets and values.
2.3.2 Kawakawa Bay
Kawakawa Bay is situated approximately 40km south-east of central Auckland on the southern
shoreline of the Tamaki Straight, to the south east of Waitemata harbour. Just over 1000 people live
at Kawakawa Bay. The population is a mix of retired and working people. Above the permanent
resident population there is a non-resident population of absentee holiday home property owners.
The Bay has low-to-mid-level socio-economic deprivation scores (Crampton & Atkinson, 2007).
The Bay is defined by Pawhetu Point to the west and Kawakawa Bay boat club to the east, and is
about 4km long with a central headland, Te Iwirahirahi Point, seen in Figure 6 (below) dividing the
embayment into two (Tonkin & Taylor Ltd, 2007). Kawakawa Bay’s western embayment has a sandy
shoreline, while the eastern embayment has a mix of sandy and cobble shoreline with several rock
outcrops (Tonkin & Taylor Ltd, 2007). The Kawakawa Bay shoreline is designated a Regionally
Significant Landscape (Rating 5), but has no coastal protection areas identified in statutory plans
(Auckland Regional Council, 1999b). Kawakawa Bay is classed as an ‘inshore wave environment’,
17exposed to fetch and depth limited wind-generated waves from the north-west to north-east
(Tonkin & Taylor Ltd, 2007; Auckland Regional Council, 2000).
Land use in Kawakawa Bay has been predominantly grazing for farming. Since approximately 1950,
the coastal margin has been developed for residential dwellings, mostly for retirement and holiday
homes. Dwellings at Kawakawa Bay have been unserviced and have relied on tank water for supply
and septic-tank systems for wastewater disposal. Development has occurred primarily in two areas
of low-lying land adjacent to the road and coastline, as can be seen in Figure 6, in areas zoned
‘residential settlement unserviced’. Beyond this land is farmland zoned ‘rural’. The Clevedon-
Kawakawa Bay Road and Kawakawa Bay Coast Road run along the backshore of Kawakawa Bay,
separated from the coastline by a narrow strip of grass (Manukau City Council, 2002).
Figure 6. Satellite image of Kawakawa Bay (Source: Google Earth, 2010)
Coastal hazards and management decisions to date
Based on ARC indicative topographic, bathymetric, and water-level data contained in the ARC beach
monitoring database, Tonkin & Taylor (2007; 2003) found that Kawakawa Bay is exposed to erosion
and inundation risk. Much of the Kawakawa Bay coastline is stable, although erosion has been
observed where the coastline has been modified or land has been reclaimed. These localised areas
of erosion are at Te Iwirahirahi Point and Rautawa Stream (east and west). The erosion rate is
considered low but, because of the proximity of infrastructure, the risk is considered significant
(Tonkin & Taylor Ltd, 2007). Ad hoc consented and unconsented coastal protection structures have
historically been built along the Kawakawa Bay shoreline. MCC commissioned a coastal engineering
assessment for the area in 2003, and subsequently an upgrade of coastal protection measures in
2007. Tonkin & Taylor designed a coastal protection response plan to manage erosion at Kawakawa
18Bay that involved a mix of structural and non-structural engineering measures, including
renourishment of some areas and a stone revetment in one area. The management response does
not include a long-term plan and the environmental-effects report for the works acknowledges that
the effects of climate change and sea-level rise will need to be considered for the area. In summary,
current coastal protection at the site can only be considered a short-term response to coastal
erosion and further measures will be required.
Tonkin & Taylor qualitatively assessed that inundation would be likely during a 2 percent AEP event
(50-year average return interval—ARI). From this assessment, Tonkin & Taylor (2007) inferred that
infrastructure and buildings on low-lying land in this area are susceptible to inundation. Riley
Consultants found no major reported flood issues for Kawakawa Bay. However, Riley Consultants
also made the assumption that low-lying coastal areas, where residential properties are situated, are
prone to flooding based on their elevation and proximity to the coast, streams, and the large
catchment area that drains into the coastal area (Riley Consultants Ltd., 2001). MCC managed flood
risk through engineering quality standards (EQS) in its district plan. The EQS prescribes that all
development will have a minimum site level (mAVD-46), and minimum freeboard levels for all
development sites adjacent to open channels and overland flow paths (Manukau City Council, 2002).
The district plan does not directly refer to coastal inundation or coastal areas, but it is assumed that
minimum sites levels adequately protect buildings from coastal inundation up to the 1 percent AEP
level. Adjusted minimum site levels have been recommended to take into account sea-level rise of
up to 0.66m to the 1 percent AEP standard (Ramsay, et al., 2008b).
193 Potential impacts of sea-level rise
Sea-level rise is expected to worsen the occurrence of erosion and inundation around New Zealand’s
coast. The geophysical characteristics of a given area of coast will determine to what degree erosion
or inundation increases or is initiated. Currently, coastal inundation risk exists at both sites.
However, the risk is low and presents only a small disruption to people so it is not considered a
priority at either settlement, and current flood-risk management is considered satisfactory. This
section presents this study’s investigation of how coastal flood risk could change with sea-level rise
at the study sites.
3.1 Methods
GIS analysis was used to assess the potential impacts of a 1 percent AEP event for three sea-level
rise scenarios at the two coastal settlements. To do this the National Institute of Water and
Atmospheric Research (NIWA) was commissioned to derive extreme sea level static inundation
contours for Waitemata Harbour. Full details of the methods used to generate the inundation
contours can be found in the original studies on the influence of climate change on extreme sea
levels around the ACC and MCC district coastlines (summarised in Appendix 3 of this report) (Ramsay
et al., 2008b; Ramsay et al., 2008a). Future sea-level rise can be added to extreme sea-level values to
estimate how inundation risk may change with long-term sea-level rise.
Potential static inundation extent during a 1 percent AEP event was mapped using GIS. The number
of people, property, and the total economic value of property potentially affected during a 1 percent
AEP event for three sea-level rise scenarios were estimated using GIS analysis.
The information generated in this component of the case study is not designed to be the basis of
specific planning decisions. Rather, the information is designed to give an indication of the scale of
the issue at the case study sites and, in doing so, provide contextual background for the in-depth
investigation of the opportunities for, and barriers to, adaptation to sea-level rise investigated
through in-depth interviews conducted for this study.
3.1.1 Selecting sea-level rise scenarios
Scenarios of future sea-level rise were selected for this study based on an adaptive risk-management
approach consistent with IPCC guidance on developing sea-level rise scenarios (Nicholls, et al., in
press). Sea-level rise scenarios of 0.5m, 1.0m, and 1.5m were selected for this study, reflecting the
latest scientific findings projecting sea-level rise to the end of the century. The sea-level rise
scenarios represent local relative sea-level rise, and are measured relative to present day (2007)
local mean sea level. A further scenario of 2.0m sea-level rise was also assessed. However, it was
found that the difference in impact and expert views regarding the required adaptive response, from
1.5m to 2.0m sea-level rise, was minimal at the study sites due to the sites’ topography.
Consequently, the results of the 2.0m scenario are not presented here.
Timeframes are not assigned to the three sea-level rise scenarios. This is consistent with an
adaptive-management approach, whereby risks and responses are assessed independent of the
timeframe at which impacts and responses may occur. Specific timing of responses may be applied
subsequently, and can be reviewed as new information becomes available. The higher sea-level rise
scenarios investigate the implications of high-impact low-likelihood scenarios of sea-level rise and
21You can also read