Environmental Scan www.mdc.govt.nz - March 2020

Page created by Victoria Cummings
 
CONTINUE READING
Environmental Scan www.mdc.govt.nz - March 2020
Environmental
Scan
March 2020

www.mdc.govt.nz

                  Environmental Scan 2020   1
Environmental Scan www.mdc.govt.nz - March 2020
Contents
                              INTRODUCTION                                             5

                              SOCIAL AND CULTURAL PROFILE                             11

                              ECONOMIC PROFILE                                        21

                              ENVIRONMENTAL PROFILE                                   31

                              MAJOR REGIONAL DEVELOPMENTS/PROJECTS                    37

                              GOVERNMENT PROPOSALS, LEGISLATION,                      39
                              INQUIRIES AND NATIONAL TRENDS

                              BIBLIOGRAPHY                                            60

2   Environmental Scan 2020                                 Environmental Scan 2020        3
Environmental Scan www.mdc.govt.nz - March 2020
Introduction
                              An Environmental Scan looks at what changes are likely to affect the future internal and external operating
                              environment for Manawatū District Council (Council). It looks at where the community is heading and what
                              we, as Council, should be doing about it. It should lead to a discussion with elected members about what tools
                              Council has available to influence the direction the community is taking.
                              The purpose of local government, as set out in the Local Government Act 2002 includes reference to the role of
                              local authorities in promoting the social, economic, environmental and cultural wellbeing of their communities.
                              The indicators included in this report have been grouped into each of the wellbeings under the headings of
                              “Social and Cultural Profile,” “Economic Profile” and “Environmental Profile.” However, it is recognised that the
                              many of these indicators have impacts across multiple wellbeings.
                              Council has used the most up-to-date data available to prepare this Environmental Scan. In some cases this
                              data is historic trend data, sometimes it is current at the time the Environmental Scan was finalised, and in some
                              cases Council has used data and trends to prepare future forecasts. Council does not intend to update the
                              Environmental Scan over time, but the forecasting assumptions contained within Council’s Ten Year Plan will be
                              continually updated up until adoption.

                              6 March 2020

4   Environmental Scan 2020                                                 Environmental Scan 2020                                           5
Environmental Scan www.mdc.govt.nz - March 2020
Introduction
                              The Manawatū District covers 256,693 hectares and stretches from Rangiwāhia in the north to Himatangi Beach
                              in the south. It shares a boundary with Palmerston North City in the south-east. The western boundary of the
                              District follows the Rangitikei River and the eastern boundary is the Ruahine Ranges. Within the Manawatū District
                              are a range of natural features, including the Ruahine Ranges, Pohangina Valley and the West Coast beaches and
                              sand dunes. Research has recognised the Manawatū dunefield as the best representative example of Holocene
                              dune development in New Zealand, and one of the best examples of parabolic dune development in Australasia
                              (Manawatū District Council, 2020).

                              Population and Household Growth
                              The estimated resident population of the Manawatū District as at 30 June 2019 was 31,732. The proportion of
                              the total population in Feilding (consisting of the Maewa, Feilding North, Feilding West, Feilding Central, Feilding
                              East, Rakiraki and Oroua Bridge Area Units) was estimated as 17,307, or 54.5% of the total District population.
                              The District’s population is forecast to have increased to 32,555 people by 2021 and 36,478 by 2031 (the period
                              of the 10 Year plan). These forecasts are based on the assumption that the population will grow in line with the
                              Statistics New Zealand high projections. Updated estimates and projections released from the 2018 Census
                              (in March and December 2020 respectively) will provide a clearer picture of current population and future
                              projections.
                              The proportion of total residents living in Feilding is forecast to decrease slightly over time from 54.4% in 2021
                              to 54% by 2031 and 53.8% by 2051. This is not consistent with what our Council anticipates based on current
                              development trends.
                              The total population of the Manawatū District (based on Statistics New Zealand high projections) is forecast to
                              increase to 42,525 people by 2051 (an increase of 34% over the 32 years from 2019 to 2051).
                              The total number of dwellings in the Manawatū District as at 30 June 2019 was estimated as 12,693. The total
                              number of dwellings within Feilding as at 30 June 2019 was estimated at 6,923 (54.5% of all dwellings in the
                              District). The number of dwellings in the Manawatū District is forecast to increase to 15,199 by 2031 (an increase
                              of 2,506 dwellings, or 19.7% from 2019 estimates) and 17,719 by 2051 (5,026 new dwellings from 2019 to 2051, an
                              increase in 39.6% of total dwellings). These estimates are based on the assumption that average household size
                              will be consistent with Statistics New Zealand projections by Territorial Authority and that the average household
                              size from 2039 to 2051 will remain at 2.4 (the average size as at 2038).

                              Growth Planning
                              Manawatū District Council undertook the Feilding Urban Growth Framework Study in 2013 to identify where
                              Feilding could grow into the future, the urban growth framework identified 5 growth precinct’s suitable for
                              growth. The District Plan has given effect to the Feilding Urban Growth Framework through the following plan
                              changes.
                              Precinct 5 was re-zoned from Rural to Industrial Zone in 2015.
                              Precinct’s 1,2, and 3 were re-zoned from Rural to Deferred Residential Zone in 2014. The Deferred Residential
                              Zoning is intended to be uplifted once a review of the District Plan’s hazards chapter has been undertaken.
                              Precinct 4 has been recently rezoned to Residential Zone in 2020. It is noted that Precinct 4 is envisioned to
                              provide the majority of Feilding’s residential growth over the next 10 years.

6   Environmental Scan 2020                                                  Environmental Scan 2020                                            7
Environmental Scan www.mdc.govt.nz - March 2020
Iwi and Māori context
Map 1: Growth Precincts Around Feilding. Feilding Urban Growth Framework Study 2013
                                                                                      The local Māori landscape comprises a wide range of collectives who express an identified interest in the
                                                                                      Manawatū District. Marae, pā, hapū, iwi, and organisations within the District are listed below:

                                                                                      Table 1: Marae, pā, hapū, iwi and organisations within the District

                                                                                        Marae/Organisation                                     Hapū                    Iwi

                                                                                        Aorangi                                                Ngāti Tahuriwakanui     Ngāti Kauwhata
                                                                                        Kauwhata                                               Ngāti Hinepare          Ngāti Kauwhata
                                                                                        Te Iwa Tekau mā Iwa                                    Ngāti Tūroa             Ngāti Kauwhata
                                                                                        Kōtuku                                                 -                       Ngāti Raukawa
                                                                                                                                               Ngāti Waewae            Tūwharetoa
                                                                                        Poupatate                                              Ngāti Pikiahu           Ngāti Raukawa
                                                                                        Te Tikanga                                             Ngāti Pikiahu           Ngāti Raukawa
                                                                                                                                               Ngāti Waewae            Ngāti Tūwharetoa
                                                                                        Te Hiri                                                Ngāti Rangatahi         Ngāti Raukawa
                                                                                                                                               Ngāti Matakore          Ngāti Maniapoto

                                                                                        Taumata o te Rā                                        Ngāti Manomano          Ngāti Raukawa
                                                                                        Paranui                                                Ngāti Tūranga           Ngāti Raukawa
                                                                                        Motuiti                                                Ngāti Rākau             Ngāti Raukawa
                                                                                        Te Rangimārie                                          Te Rangitepaia          Rangitāne ki Manawatū
                                                                                                                                               Ngāti Hineatue

                                                                                        Parewahawaha                                           Ngāti Huia              Ngāti Raukawa
                                                                                                                                               Ngāti Pare Raukawa      Ngāti Raukawa

                                                                                        Ngā Kaitiaki o Ngāti Kauwhata                          -                       Ngāti Kauwhata
                                                                                        Te Rūnanga o Raukawa Inc                               -                       Ngāti Kauwhata
                                                                                                                                               -                       Ngāti Raukawa
                                                                                                                                               -                       Ngāti Maniapoto

                                                                                        Te Roopū Hokowhitu Charitable Trust                    -                       Ngāti Kauwhata
                                                                                                                                               -                       Ngāti Raukawa
                                                                                                                                               -                       Ngāti Tūwharetoa
                                                                                                                                               -                       Ngāti Maniapoto
                                                                                        Te Rūnanga o Ngā Waiariki Ngāti Apa                    -                       Ngāti Apa
                                                                                        Te Maru o Ruahine Trust                                -                       Ngāti Hauiti
                                                                                        Rauhuia Environmental Services                         -                       Ngāti Hauiti
                                                                                        Muaūpoko Tribal Authority Incorporated                 -                       Muaūpoko
                                                                                        Te Rūnanga o Toa Rangatira Incorporated                -                       Ngāti Toa

8                                  Environmental Scan 2020                                                                        Environmental Scan 2020                                    9
Environmental Scan www.mdc.govt.nz - March 2020
In March, Treaty Settlement hearings for hapū and iwi located in the Manawatū District will commence. This will
include Ngāti Kauwhata, Ngāti Raukawa, and Ngāti Matakore. The length of this process can vary between iwi,                                                Goal 5: A driven and enabling
                                                                                                                                                           Council
however, the anticipated duration of this process is expected to last somewhere between 3-5 years.
                                                                                                                                                           (No external strategies)

Map 2: Map of Marae in the Manawatū District                                                                              Rangitīkei   Make it a                                               1. Infrastructural service levels
                                                                                                                          District     place that
                                                                                                                                                                                               2. Economic development
                                                                                                                          Council      we all want
                                                                                                                                       to call home                                            3. Future-looking community
                                                                                                                                                                                                  facilities
                                                                                                                                                                                               4. Earthquake-prone buildings
                                                                                                                                                                                               5. Communication/engagement
                                                                                                                                                                                                  and collaboration
                                                                                                                                                                                               6. Rates level/affordability/value
                                                                                                                                                                                               7.   Environment/climate change
                                                                                                                                                                                               8. Regulatory performance
                                                                                                                                                                                               9. Community resilience

                                                                                                                        Tararua        A growing and       Priorities:
                                                                                                                        District       prosperous
                                                                                                                                                           1. Continued investment in
                                                                                                                        Council        District
                                                                                                                                                              core infrastructure
                                                                                                                                       providing a
                                                                                                                                       wide range of       2. Promoting and facilitating
Strategic Direction of Adjoining Territorial Authorities                                                                                                      economic development
                                                                                                                                       employment
Table 2 summarises the strategic direction of adjoining territorial authorities. Like the Manawatū District Council’s                  opportunities       3. Continued financial viability
Long Term Plan 2018-2028, the Rangitīkei District Council has a vision statement and list of outcomes sought.                          that is                through sustainable growth
The Palmerston North City Council (PNCC) and Tararua District Council have an overarching vision and list of                           underpinned by         and investment
key priorities or goals they want to achieve. The Horowhenua District Council does not have a vision statement,                        highly efficient,
but a list of outcomes they seek to achieve through their Long Term Plan.                                                              capable, and
                                                                                                                                       affordable
Table 2 - Strategic direction of adjoining territorial authorities                                                                     infrastructure

 Council          Vision            Priorities/Strategies                   Outcomes                                    Horowhenua                                                             1. Thriving communities
                                                                                                                        District
                                                                                                                                                                                               2. An exuberant economy
 Palmerston       Small city        Goals and Strategies                                                                Council
                                                                                                                                                                                               3. Stunning environment
 North City       benefits, big     Goal 1: An innovative and
 Council          city ambition     growing city                                                                                                                                               4. Enabling Infrastructure
 (PNCC)                             City Development Strategy
                                                                                                                                                                                               5. Partnership with Tangata
                                    Economic Development
                                    Strategy                                                                                                                                                      Whenua

                                    Goal 2: A creative and exciting                                                                                                                            6. Vibrant cultures
                                    city
                                    Creative and Liveable Strategy                                                      Horizons                                                               1. Natural hazard resilience
                                    Goal 3: A connected and safe                                                        Regional                                                               2. Healthy ecosystems
                                    community                                                                           Council                                                                3. Human wellbeing
                                    Connected Community Strategy
                                                                                                                                                                                               4. Connected communities
                                    Goal 4: An eco-city
                                                                                                                                                                                               5. A robust economy
                                    Eco City Strategy
                                                                                                                                                                                               6. Confidence in decision making

10                                             Environmental Scan 2020                                                                                               Environmental Scan 2020                                        11
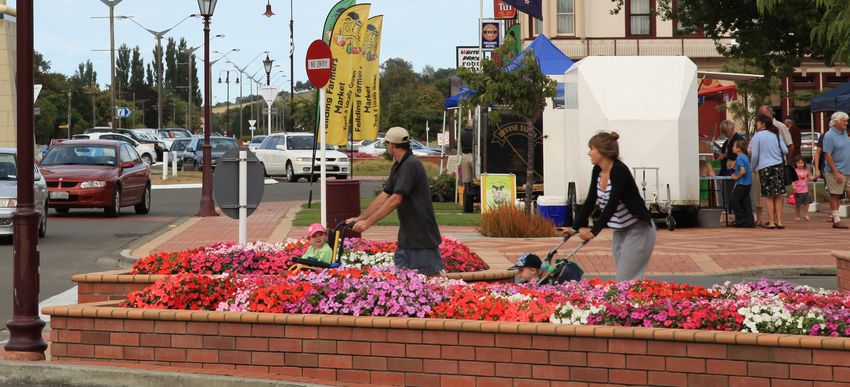
Environmental Scan www.mdc.govt.nz - March 2020
Common Themes
                                                                                                                        Social and Cultural Profile
The following are themes that are common across more than one neighbouring territorial authority in Table 1
above:                                                                                                                  Demographics
     1.   Economic development (PNCC, Rangitīkei District Council, Tararua District Council and Horowhenua
                                                                                                                        The interim population household demographics have been estimated as follows (Figure 1):
          District Council)
     2. Community Safety, resilience or connectedness (PNCC, Rangitīkei District Council, Horowhenua                    Figure 1 - Age group projections 2019-2051
        District Council and Horizons)
     3.   Environment or sustainability (PNCC, Rangitīkei District Council, Horowhenua District Council and
          Horizons)
     4. Infrastructure (Rangitīkei District Council, Tararua District Council and Horowhenua District Council
     5.   Rates affordability or financial viability (Rangitīkei District Council and Tararua District Council)

The Community Outcomes contained in the Manawatū District Council’s Long Term Plan 2018-2028 also include
reference to economic development, the natural environment and infrastructure. The Community Outcomes
do not currently address the themes of community safety, resilience or connectedness, other than in relation
to the resilience of the built environment and connection via quality infrastructure, services and technology.
However our recently adopted Community Development Strategy commits to a future focus on these matters.
The environmental community outcome in the Manawatū District Council’s Long Term Plan 2018-2028 is more
focussed on the protection of natural and physical resources than environmental sustainability. However, the
imminent development of the Environmental Sustainability Strategy reflects a common future focus with our
neighbouring territorial authorities.
The community outcome “Manawatū District Council is a customer-focussed and efficient organisation” is
related to rates affordability and financial viability, but less explicitly than some of our neighbouring territorial
authorities.

12                                                                                                                                                                 Environmental Scan 2020                         13
Environmental Scan www.mdc.govt.nz - March 2020
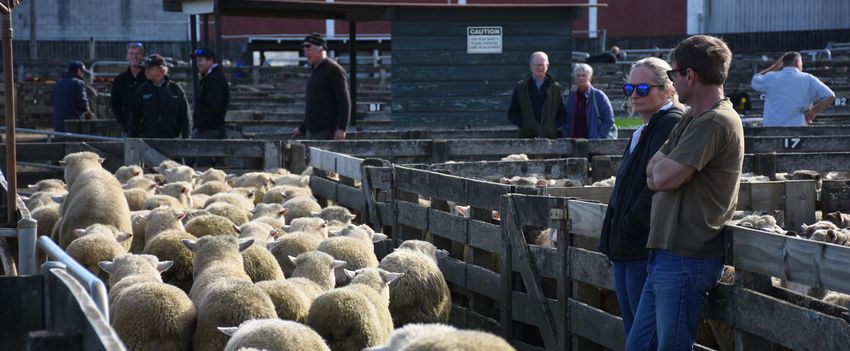
As at 30 June 2019, it was estimated that 5,754 residents were aged 65+ (18.1% of the total resident population).                       Table 3: Change in ethnic profile 2013 to 2018 by location
By 2051 the number of residents aged 65+ is forecast to increase to 11,595 residents, which is equivalent to
27.5% of the total resident population in the Manawatū District.
                                                                                                                                                                                             Northern and         Southern and
Also of interest is the projected increase in the percentage of residents aged 85+ from 1.9% (597 residents) as at                       Location         District          Feilding                                                      New Zealand
                                                                                                                                                                                             Eastern Rural        Western Rural
30 June 2019 to 6.4% (2,722 residents) by 2051 (Figure 2).
                                                                                                                                         Year           2013     2018     2013      2018     2013      2018       2013       2018       2013         2018
Figure 2 - Percentage of the District’s residents aged 85+
                                                                                                                                         European       86.4%    89.2%    83.6%     87.0%    90.6%     93.2%      88.7%      91.4%      70.0%        70.2%

          6.0%                                                                                                                           Māori          14.3%    16.5%    17.8%     19.4%    9.2%      11.5%      10.6%      14.1%      14.1%        16.5%

                                                                                                                                         Pacific        1.8%     2.6%     2.1%      2.5%     0.8%      1.4%       0.9%       1.3%       7.0%         8.1%
          5.0%
                                                                                                                                         People
          4.0%
                                                                                                                                         Asian          1.8%     2.6%     2.4%      3.2%     0.8%      1.3%       1.2%       2.1%       11.1%        15.1%

          3.0%                                                                                                                           Middle
                                                                                                                                         Eastern        0.3%     0.3%     0.2%      0.3%     0.2%      0.2%       0.5%       0.5%       1.1%         1.5%
          2.0%                                                                                                                           Latin

                                                                                                                                         Other          2.6%     1.7%     2.3%      1.4%     2.7%      1.8%       2.9%       1.9%       1.6%         1.2%
          1.0%

          0.0%                                                                                                                          Health
                   19     21     23     25     27     29     31     33     35     37     39     41     43     45     47     49     51   Subnational data on smoking and other health indicators will not be released by Statistics New Zealand until May
                 20     20     20     20     20     20     20     20     20     20     20     20     20     20     20     20     20
                                                                                                                                        2020. This data is therefore not able to be considered in this Environmental Scan, but will be considered for the
                                                                                                                                        10 Year Plan, once it is available.
                                                                         85+

                                                                                                                                        Water Security
Demographic projections are District-wide as opposed to being at the area unit level. Demographic percentages
from the Statistics New Zealand high series have been applied to the calculated population assumptions to                               Due to the Havelock North drinking water outbreak (2016) and resulting changes to the drinking water standards
determine age group proportions. Due to the unlikelihood of the magnitude of increases in the proportion of the                         there has been a heightened regulatory and political focus on secure water and resilient potable water supplies.
85+ population continuing, the age group ratios have been extrapolated from 2043 to 2051.                                               The Feilding township is currently heavily reliant on the Oroua River Almadale abstraction and is supplemented
                                                                                                                                        by two secure bores located on the true left of the Oroua River. This current configuration creates a level of risk
Ethnicity                                                                                                                               due to low flow restrictions, inability to treat surface water during flood events, insufficient firefighting flows for
                                                                                                                                        Precinct 5 (the industrial precinct) and vulnerability associated with having to pipe water across the Oroua River.
Census ethnicity data from 2013 and 2018 has been compared to see how the ethnic profile of the Manawatū
District has changed (Table 3). This table also compares the ethnic profile of the District with New Zealand                            Due to the unsecure nature of the Almadale abstraction, associated risk, and the fact the reservoir and trunk
as a whole. When compared with national data, the Manawatū District is predominantly bi-cultural, that is,                              main into Feilding is in need of a significant upgrade and seismic strengthening, a strategic water assessment
predominantly European and Māori. The data also suggests an almost doubling in the proportion of residents                              was completed ahead of the 2018 – 2028 Long Term Plan. This assessment concluded that if the Almadale
identifying as Pacific Peoples or Asian. However, comparisons are difficult for the following reasons:                                  Water Treatment plant and associated abstraction was decommissioned and water sourced from a secure bore
                                                                                                                                        on the true right of the Oroua River significant savings and increased resilience would be achieved (Manawatū
     1.   Responses total to over 100% due to the identification of some respondents with more than one                                 District Council, 2018).
          ethnicity.
                                                                                                                                        The 2018-2028 Long Term Plan included the Feilding Water Strategy as a key project with a total budget of
     2. Ethnicity identification in 2018 was more defined than in 2013. That is, those selecting “other” reduced                        $7,963,959, inflated over the 10 year period. Through the 2018-2028 Long Term Plan, Council agreed to proceed
        significantly between 2013 and 2018, which may have influenced in part the increase in the proportion                           with the recommended option of constructing a new bore, treatment plant and reservoir, rather than renewing
        identifying as “Pacific Peoples” or “Asian.”                                                                                    the various components of the Almadale Water Treatment Plant (Manawatū District Council, 2018).
Another thing to note is that there is a larger Māori population in Feilding than in other areas of the District.                       With the reservoir nearing completion and a site purchased for the new bore and treatment plant progress
                                                                                                                                        towards realising the Feilding Water Strategy is well underway.

14                                                         Environmental Scan 2020                                                                                                      Environmental Scan 2020                                              15
Environmental Scan www.mdc.govt.nz - March 2020
Following completion of the Feilding Water Strategy physical works, the Manawatū District water will be sourced       While deprivation levels are low in the Manawatū comparison with Horowhenua, Ruapehu and Whanganui,
completely from secure groundwater sources, rather than being a combination of a surface water take from the          increasing costs of housing disproportionately impact on low income households within every community.
Oroua River and groundwater bores. The new network will be more resilient than the current network as the
pipeline from the new Feilding bore will not need to cross the Oroua River, and will not be limited by the river      Housing Affordability
turbidity and surface water low flow restricted abstraction limits.
                                                                                                                      Housing affordability in the Manawatū District continues to compare well with New Zealand but has deteriorated
While the Almadale surface water abstraction is relatively isolated the decommissioning will reduce the risk of
                                                                                                                      rapidly over the past four years. Specifically, house prices in the Manawatū District have increased by 74.5%
accidental or malicious contamination.
                                                                                                                      over the four years to December 2019. This compares to 27.0% growth in house prices across the country over
                                                                                                                      the same period. While this is positive for many, indicators reflect the impact of increasing house values on the
Education                                                                                                             affordability and availability of housing for New Zealand families.
In May 2019 the Ministry of Education released its National Education Growth Plan 2030 which is the Ministry’s        The average house in the District would have cost 4.6 times the average wage in December 2014. Today, the
new approach for coordinating its response to population growth across New Zealand. The Taranaki, Whanganui           average residential property costs 8.1 times the average wage. Affordability of houses in the District are now on
and Manawatū region has been identified as an area which is experiencing steady growth. The Ministry has              a par with neighbouring Palmerston North.
developed catchment plans for New Plymouth and Palmerston North and is currently working with Council’s
Policy Planners to develop a growth plan for the wider Manawatū.                                                      Figure 4 - Ratio of average house price to average annual income
Initial indications from school enrolment data has identified that there are several schools within the District
that have reached capacity with enrolment plans being put in place to manage this. This includes Feilding High
School, Colyton School, Kopane School, Mount Biggs School, Newbury School, Hiwinui School, Manchester
Street School and Halcombe School. The Ministry has noted that there are a number of schools in the District                                                                                                                                                                                                                                                                                     New Zealand 11.0
who have spare capacity to accommodate projected future growth. The Ministry is aware of the predicted                      12
growth in the north-western area of Feilding (Precinct 4) and has factored in the impact that this may have on
schools located close to this intended growth area.
                                                                                                                           10
In spite of the current numbers in many of the local schools the Ministry’s view is that the predicted growth in                                                                                                                                                                                                                                                                                 Palmerston North 8.1
the Manawatū District within the next 10 to 20 years will not have a huge impact on the capacity available within                                                                                                                                                                                                                                                                                Manawatū District 8.1
                                                                                                                            8
the schools that currently exist. The Ministry will continue to keep a close watching brief on school enrolment
data and if need be, introduce further enrolment plans to manage this.
                                                                                                                            6

Deprivation
                                                                                                                            4
The following chart illustrates the scale of deprivation across the region where 5 indicates the proportion of
households living in the most deprived conditions and 1 indicates the proportion of least deprived households.
                                                                                                                            2
Figure 3 - Regional variation in socioeconomic deprivation
                                                                                                                            0

                                                                                                                                 2005/3
                                                                                                                                          2005/9
                                                                                                                                                   2006/3
                                                                                                                                                            2006/9
                                                                                                                                                                     2007/3
                                                                                                                                                                              2007/9
                                                                                                                                                                                       2008/3
                                                                                                                                                                                                2008/9
                                                                                                                                                                                                         2009/3
                                                                                                                                                                                                                  2009/9
                                                                                                                                                                                                                           2010/3
                                                                                                                                                                                                                                    2010/9
                                                                                                                                                                                                                                             2011/3
                                                                                                                                                                                                                                                      2011/9
                                                                                                                                                                                                                                                               2012/3
                                                                                                                                                                                                                                                                        2012/9
                                                                                                                                                                                                                                                                                 2013/3
                                                                                                                                                                                                                                                                                          2013/9
                                                                                                                                                                                                                                                                                                   2014/4
                                                                                                                                                                                                                                                                                                            2014/9
                                                                                                                                                                                                                                                                                                                     2015/3
                                                                                                                                                                                                                                                                                                                              2015/9
                                                                                                                                                                                                                                                                                                                                       2016/3
                                                                                                                                                                                                                                                                                                                                                2016/9
                                                                                                                                                                                                                                                                                                                                                         2017/3
                                                                                                                                                                                                                                                                                                                                                                  2017/9
                                                                                                                                                                                                                                                                                                                                                                           2018/3
                                                                                                                                                                                                                                                                                                                                                                                    2018/9
                                                                                                                                                                                                                                                                                                                                                                                             2019/3
                                                                                                                                                                                                                                                                                                                                                                                                      2019/9
                      50%

                      45%        44%
                                             41%
                                                                                                                                                                                         Manawatū District                                                     Palmerston North                                                        New Zealand
                      40%

                      35%

                      30%                               22%                                        28%

                      25%
                                                              19%
                      20%                                                       18%   18%

                      15%                                               14%
                                       10%
                      10%

                                                   4%                                    5%
                       5%
                                                                                                        2%
                            0%
                       0%
                             Ruapehu   Whanganui Rangitikei Manawatū        Palmerston        Tararua    Horowhenua
                                                                               North
                                                         1     2    3   4   5

16                                                 Environmental Scan 2020                                                                                                                                                                             Environmental Scan 2020                                                                                                                                           17
Environmental Scan www.mdc.govt.nz - March 2020
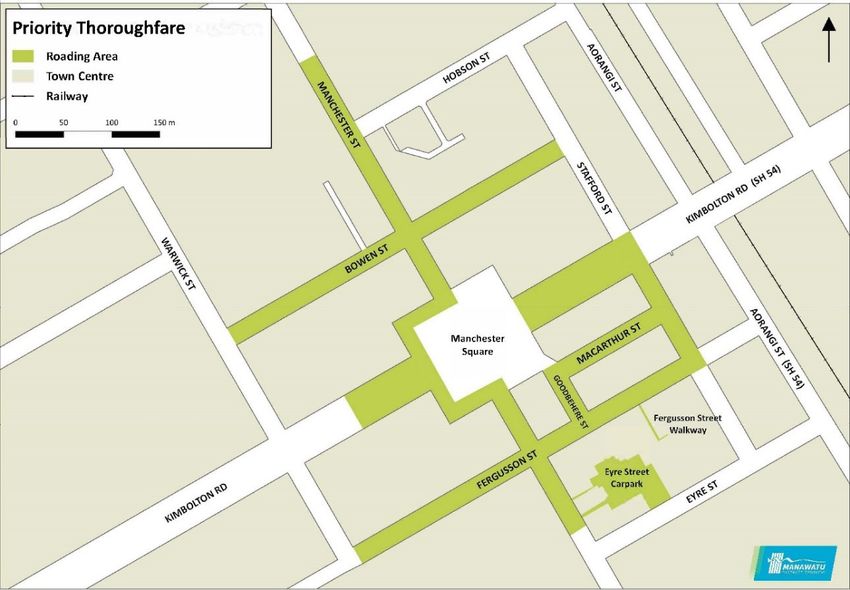
Rental affordability in the Manawatū District compares well with New Zealand but has deteriorated from 30.0%                                                             While affordability is a significant issue, availability is also impacting on the ability of families to secure housing.
two years ago to 31.7% in December 2019. As at December 31, average rent in the District was $339 versus $365                                                            Anecdotal evidence suggests that in-part, the decline in affordability and availability of rental properties is in
in neighbouring Palmerston North.                                                                                                                                        response to elevated central government regulations where landlords are increasing rents to cover costs of
                                                                                                                                                                         compliance or withdrawing properties from the rental market. Alongside rapid house price growth, these factors
Figure 5 - Average rent as a Percentage of average household income                                                                                                      place additional upward pressure on the cost of rental properties and downward pressure on the supply of rental
                                                                                                                                                                         properties to the market.

                                                40%
                                                                                                                                               New Zealand 35.2%         Affordable Housing Units2
                                                 35%
                                                                                                                                               Manawatū District 31.7%   Using the Statistics New Zealand medium population projections for the Manawatū District, the Manawatū
                                                30%                                                                                            Palmerston North 31.3%    Community Trust has calculated that they will need to build at least 48 new affordable housing units if it is to
                                                 25%                                                                                                                     meet the increased demand that will come with an aging population. At a minimum, 31 new units will be needed
                                                                                                                                                                         just to maintain the current ratio of affordable housing units to total Manawatū households (1.85%). To keep up
                                                20%                                                                                                                      with the growth in the number of one-person 65+ age group households would require 295 units by 2033 (an
                                                 15%                                                                                                                     additional 90 units).

                                                 10%
                                                                                                                                                                         The Manawatū Community Trust has a target of reaching 253 units by 2033 (an additional 48 units). The remaining
                                                                                                                                                                         42 units will need to be delivered by the private sector or other providers. The Manawatū Community Trust has
                                                     5%                                                                                                                  secured an interest-bearing loan from Council to assist in building the new units. In addition, the Trust will also
                                                                                                                                                                         fundraise, look at cost-effective building methods, considering partnerships with other providers and industry
                                                     0%
                                                                                                                                                                         and will explore ways to access other forms of finance.
                                                                2000/6
                                                                2001/3
                                                               2001/12
                                                                2002/9
                                                                2003/6
                                                                2004/3
                                                               2004/12
                                                                2005/9
                                                                2006/6
                                                                2007/3
                                                               2007/12
                                                                2008/9
                                                                2009/6
                                                                2010/3
                                                               2010/12
                                                                2011/9
                                                                2012/6
                                                                2013/3
                                                               2013/12
                                                                2014/9
                                                                2015/6
                                                                2016/3
                                                               2016/12
                                                                2017/9
                                                                2018/6
                                                                2019/3
                                                               Manawatū District              Palmerston North            New Zealand                                    Public Transport Provision
                                                                                                                                                                         The current Feilding Around Town/Feilding to Palmerston North bus service consists of weekday services, Saturday
The declining affordability of housing is reflected in the exponential growth of families registered for social
                                                                                                                                                                         services, public holiday services and weekday school services (that only operate during school term). The service
housing. The number of families eligible for social housing in the District increased from 2 in December 2014
                                                                                                                                                                         operates Monday-Saturday travelling around Feilding and then to Palmerston North via key destinations such as
to 64 in December 2019. In Palmerston North, eligible families increased from 20 in December 2014 to 436 in
                                                                                                                                                                         Palmerston North Airport and Hospital. The current timetable is scheduled to provide passenger connections to
December 2019. Across the region, registered families increased from 51 to 876 over the same period1.
                                                                                                                                                                         Massey University and Palmerston North urban routes. In addition, two morning and two afternoon services run
Figure 6 - Social housing register                                                                                                                                       during school term to provide direct services to Palmerston North Girls High School and Palmerston North Boys
                                                                                                                                                                         High School (Horizons Regional Council, 2019d).
                    1000                                                                                                                                                 Services do not operate on Sunday. Public holiday services run to the Saturday timetable, with the exception of
                     900                                                                                                                             876                 Good Friday, Easter Sunday, Christmas Day and Anzac Day which have no services operating (Horizons Regional
                                                                                                                                                                         Council, 2019d).
                     800
                                                                                                                                                                         Horizons is currently undertaking a mid-term review of the Feilding public transport service. The purpose
                      700                                                                                                                                                of the review is to identify operational efficiencies and/or improvements to provide a service that meets the
                                                                                                                                                                         community’s needs by enabling transport choice (Horizons Regional Council, 2019d).
                     600                                                                                                                 590
                                                                                                                                                                         A Feilding Public Transport Services Advisory Group (Advisory Group) has been established to support this
                      500
                                                                                                                                                                         review. A detailed investigation of the shortlisted options is currently being undertaken prior to consulting with
                     400                                                                                                                                                 the community. These detailed investigations will give the community a better understanding of their costs,
                                                                                                                                                                         timetable possibilities and pros and cons. The agreed shortlisted options are as follows (Shirley, Meeting minutes,
                     300                                                                                           304
                                                                                    233                                                                  436             shortlist confirmation and updated timeline, 2019b):
                     200                                                                                                           307

                                                               75
                      100                                                             119                    154

                                                                                                                                                           64
                                                                40                     26                    21                    40
                         0
                                 5         15        15         5        6    6    6  6        7    7    7    7      8    8      18   18 19  19      19   19
                               -1      n-         p-        c-
                                                               1       -1 n-1 p-1 c-1       -1    -1 p-1 c-1       -1 n-1      p- ec- ar- un-      p- ec-
                             ar                                      ar                   ar un                  ar
                          M          Ju         Se        De        M      Ju   Se De   M       J     Se   De   M     Ju    Se      D   M  J    Se     D
                                          Manawatū District                        Palmerston North                  Manawatū-Whanganui Region

1
    Eligibility for social housing is based on both the lack of availability and affordability of rental properties.
                                                                                                                                                                         2
                                                                                                                                                                          All information for this section was sourced from the Manawatū Community Trust submission to MDC’s Long Term Plan 2018-28 (May
                                                                                                                                                                         2018)

18                                                                                 Environmental Scan 2020                                                                                                                   Environmental Scan 2020                                                       19
1.   Around town service (option 4)                                                    2. Commuter (options 8 and 9b are being explored further as part of the shortlist investigation phase)

Figure 7 - Around town service (option 4)                                                Figure 8 - Commuter (options 8 and 9b)

The following variations of this option are also being assessed:
     •    Option 4a: Option 4 with Lethbridge Street extension included
     •    Option 4b: Option 4 with Monmouth Street included
     •    Option 4c: Option 4 with Lethbridge Street and Monmouth Street included

                                                                                         The option of running smaller buses for the around town service is being considered and costed in the detailed
                                                                                         shortlist phase. Also being considered are increased frequency and Sunday services. Consultation is scheduled
                                                                                         to commence in February 2020 (Shirley, Advisory Group meeting minutes, 2019a).
                                                                                         The intention will be that the around town and commuter services operate separately from one another however
                                                                                         the timetables will be developed to ensure maximum efficiency and seamless connections between the two
                                                                                         services (Shirley, Advisory Group meeting minutes, 2019a).
                                                                                         Based on the project timeline, any minor approved changes will be implemented from June 2020 (Year 3 of
                                                                                         Horizons 2018-2028 Long Term Plan). Any larger changes that require investment and time to complete will be
                                                                                         implemented in year 1 of Horizons 2021-2031 Long Term Plan (Shirley, Meeting minutes, shortlist confirmation
                                                                                         and updated timeline, 2019b).

                                                                                         Town Centre Refresh
                                                                                         The Feilding Town Centre Refresh 2020 is a vision to enliven the town centre, using feedback from community
                                                                                         consultation. Community priorities included encouraging business, making open spaces accessible and
                                                                                         interesting, ensuring getting around is easy and safe for pedestrians and vehicles, and valuing our heritage
                                                                                         buildings (Manawatū District Council, 2019b). Thoughtful action on this project will ensure development reflects
                                                                                         the vision of the community, promoting a vibrant atmosphere and attracting and retaining businesses in the
                                                                                         Feilding town centre.
                                                                                         This project will be informed by a car parking survey which was conducted in late 2019 within the shopping core

20                                            Environmental Scan 2020               20                                                Environmental Scan 2020                                          21
and peripheral commercial areas. Findings of this survey included that within 28 zones of on-street parking,
between 12 and 19 zones reached utilization levels of 85% or more on both weekdays and weekends, which                                    Economic Profile
causes users to perceive the parking spaces as full. Within the Friday survey, parking around Manchester Square
exceeded 100%, where parking outside marked parking spaces was observed. It was also noted that the overspill                             Economic growth
in parking around Manchester Square and on-street loading and deliveries could have a negative impact on
                                                                                                                                          The Manawatū District economy grew by 3.5% to a total value of $1.04b to the year ended December 2019. This
safety and efficiency (WSP, 2019).
                                                                                                                                          is an estimated increase of $36m when compared with the year ended December 2018. This District growth rate
Options suggested to improve parking issues include paid parking or enforcing of time limits through ticketing.                           of 3.5% significantly exceeds the regional and national growth rate of 2.5% and 2.3% respectively, for the year
It is recognised that free parking in the town centre is highly valued by locals and a marketing feature for                              ended December 2019.
Feilding so other options suggested include making access to the town centre more convenient and attractive
for non-car based forms of transport, and collaborating with business owners to direct long-term parking for                              Figure 9 - Annual GDP average percentage change
commuting and business purposes away from the main shopping area to ensure these parks are available for
short term users (WSP, 2019).
                                                                                                                                                                 8%
                                                                                                                                                                                                                         Manawatū District 3.5%
New Communication Modes
                                                                                                                                                                 6%                                          Manawatū-Whanganui Region 2.5%
The public information space is becoming crowded with niche channels for both disseminating information and
receiving input from local communities. People are increasingly using personal devices and engaging on digital
platforms where they can interact with like-minded people.                                                                                                       4%

As a result, getting messages to and from people requires a paradigm shift from traditional forms of public
communication. Traditional channels (eg. newspaper and radio) now reach a limited sector of the community                                                        2%
who still engage with these forms of communication. The challenge for Council is to find channels that will
                                                                                                                                                                                                                              New Zealand 2.3%
attract a wider, previously unreached audience who will engage with what Council is doing, without losing those
                                                                                                                                                                 0%
with whom Council already has an established relationship.
For the foreseeable future Council needs to retain a range of traditional broadcast channels such as radio and
                                                                                                                                                                -2%
print media as well as finding creative ways to use digital forms of communication to engage with an increasingly
“digital native” population.
                                                                                                                                                                -4%
Inequity of Technology – Rural vs Urban
MBIE’s Rural Broadband Initiative phase two3 (RBI2) aims to reduce the number of rural households and                                                           -6%
businesses that cannot access broadband speeds of at least 20 Mbps download – this was assessed at 90,000                                                               05 006 007 008 009 010 011 012 013 014 015 016 017 018 019
                                                                                                                                                                      20   2  2   2    2   2   2   2  2    2   2  2    2  2    2
nationally in 2017. Towns and settlements in the Manawatū District that are programmed for installation of ultra-
fast broadband by December 2022 are Bunnythorpe, Feilding fringe, Himatangi Beach, Kimbolton, Rongotea                                                                     Manawatū District      New Zealand        Manawatū-Whanganui Region
and Sanson (Crown Infrastruture Partners Ltd., 2020a).
The Mobile Black Spots Fund (MBSF) is an initiative to improve the availability of mobile services on state                               The strong economic performance of the Manawatū District was driven by population growth, favourable trade
highways and improve visitor experience at tourist destinations. The MBSF will cover 4 tourist sites and 67kms of                         conditions, high employment, house price growth, robust consumer and tourism spending and high levels of
state highway in the Manawatū-Whanganui region however none of these are located in the Manawatū District                                 investment flowing into the District.
(Crown Infrastructure Partners Ltd., 2020b).
                                                                                                                                          The 10 year annual average GDP growth for the District was 3.9% versus 1.8% for the Manawatū-Whanganui
These initiatives are intended help to bring equality to internet access between rural and urban areas, but a                             Region and 2.8% for New Zealand.
discrepancy may be seen where many rural areas are waiting until 2022 to have access to broadband and
                                                                                                                                          The value of construction investment reached $106m to the year ended December 2019. This is stable from the
mobile reception, when some parts of New Zealand are already being introduced to 5G (the next generation of
                                                                                                                                          strong levels of investment posted to the year ended December 2018.
mobile broadband technology with exponentially faster upload and download speeds). This is currently limited
to selected areas of the South Island, but further rollouts are being announced in March 2020 (Spark NZ Website,                          There was a total of 191 new dwellings consented to the year ended December 2019. This is strong but a
2020).                                                                                                                                    reduction on the 205 dwellings consented over the year to December 2018. In contrast, the total value of
                                                                                                                                          residential consents increased by 2.1% to a total of $91.64m over the year to December 2019.
                                                                                                                                          There was $14.4m of commercial construction consented over the year to December 2019. This is a $1.89m
                                                                                                                                          reduction on the level of investment from the previous year. This temporary contraction is explained by a lull in
                                                                                                                                          consents approved for the redevelopment of Ohakea.
3
 The first phase of the Rural Broadband Initiative ran from 2011 - 2016 and brought ultra-fast broadband to many rural locations across
NZ such as schools, medical facilities and libraries, followed by business and homes.

22                                                      Environmental Scan 2020                                                                                                            Environmental Scan 2020                                       23
Specifically, $3.1m of consents were approved over 2019 versus $6.7m in 2018. The ramping up of construction         Structure of the economy
at Ohakea to meet the 2023 deadline for the relocation of Air Force Squadron No. 5 from Whenuapai to Ohakea
will see the value of construction investment surge from 2020 to 2023.                                               Highlighting exposure of the District economy to the current supply and demand side shocks, the District
                                                                                                                     economy relies heavily on the agriculture, forestry and fishing and manufacturing sectors. On the upside, the
                                                                                                                     District economy also relies heavily on the government funded public administration and safety sectors which
The Covid-19 Virus
                                                                                                                     are less affected by global supply and demand conditions and supported by emergency conditions.
The combined effects of the global spread of Covid-19 and drought conditions pose a short-term risk to the
domestic and local economy.                                                                                          Figure 10 - Industry Structure – Year Ended March 2019
Over the longer term, the fundamentals of the District and national economy remain solid. However 2020
has brought with it significant challenges to the global economy that will inevitably impact on New Zealand,
and in particular on regional economies dependent on tertiary education, tourism, merchandise export trade
and imports of inputs to production and consumer goods from China. In a nutshell, Covid-19 is imposing a                         $231.6m
                                                                                                                                  19.2%                 $216m
simultaneous supply and demand side shock on the global economy, the full impact of which is not currently
                                                                                                                                                         17.9%
clear. In terms of agricultural production, the effects of Covid-19 are exacerbated by the current drought                                                                                 Agriculture, Forestry and   Wholesale Trade
                                                                                                                                                                                           Fishing
conditions experienced across the region and New Zealand, imposing restrictions on the ability of farmers to                                                                                                           Professional, Scientific and
                                                                                                                       $45m                                                                Manufacturing               Technical Services
reduce stocking units due to the sharp slowdown of meat and meat product manufacturing. The impacts of the              3.7%                                       $125.9m                 Public Administration and   Retail Trade
drought are also likely to be felt later in the year when dairy supply volumes are affected.                          $46.6m                                        10.4%                  safety
                                                                                                                                                                                                                       Education and Training
                                                                                                                       3.9%                                                                Rental, Hiring and Real
China is our largest market making up 27.9% of our merchandise export trade to December 2019. China is                $52.2m                                                               Estate Services             Health Care and Social
                                                                                                                                                                                                                       Assistance
currently operating at approximately 30 per cent of normal capacity, meaning supply chains are significantly           4.3%                                                                Owner-Occupied Property
                                                                                                                         $60.9m                                  $112.7m                                               All other industries
                                                                                                                                                                                           Operation
disrupted and demand for food products are constrained. As China recovers from the Covid-19 outbreak, we                   5.0%                                    9.3%
                                                                                                                                                                                           Construction
are likely to see a considerable recovery in demand for meat products. The risk is that the spread of Covid-19                $62.4m
                                                                                                                                5.2% $70.7m            $108.4m
to other parts of the globe will trigger a global recession, placing medium-term downward pressure on the                                                9.0%
                                                                                                                                     5.8%     $76.7m
incomes of our largest trading partners and reducing demand for New Zealand products over a longer period                                      6.3%
of time.
For 2020 however, we expect to see no or low growth in the economy in particular in regional economies that
are dependent on tourism, international education, export trade and manufacturing. Due to the structure of the
Manawatū District economy, we expect a downturn in 2020 with recovery in the second half of 2020 or 2021
driven by the recovery of global supply chains and international demand for our products alongside strong levels
of central government investment flowing into the District and wider region. Maintaining capacity and capability,    Agriculture, forestry and fishing directly contributed 17.9% of total GDP to the local economy. Other major
therefore sustaining household incomes, consumption activity and protecting jobs, will largely depend on the         contributors to the local economy include manufacturing and public administration and safety. In particular,
actions of central government and financial institutions. Central government will need to implement fiscal policy    meat processing makes up 40.1% of total manufacturing GDP while Defence contributed 81.2% of public
that maintains levels of employment and incomes. Measures could include changes to taxation policy settings,         administration and safety GDP.
while financial institutions will need to implement flexibility in repayment schedules in particular in heavily
                                                                                                                     The agriculture, forestry and fishing sector is the largest employer in the District. Dairy cattle farming is the
indebted industries. Along with carefully constructed fiscal policy, monetary policy will need to be responsive to
                                                                                                                     largest subsector, directly contributing $89.8m to the local economy and generating 680 jobs within the local
a downturn in consumption to support jobs and disposable incomes in the domestic economy.
                                                                                                                     industry. The manufacturing and public administration and safety sectors directly contributed a further 2,685
                                                                                                                     jobs to the local economy.

                                                                                                                     Primary Sector Security / Access to Markets
                                                                                                                     International events outside the control of industry and local government have the potential to significantly
                                                                                                                     impact on the prosperity of the Manawatū District. The Infometrics economic profile for the year ended March
                                                                                                                     2019 estimates that export trade as a percentage of GDP has increased from 32.4% over the year to March 2018
                                                                                                                     to 35% to the year ended March 2019. This increase in the strength of export income is generated from strong
                                                                                                                     commodity prices for goods produced in our District in addition to favourable terms of trade for New Zealand
                                                                                                                     producers. Sustaining this strong trade position is dependent upon a range of factors such as:
                                                                                                                         •   Central government progressing trade relationships and free trade agreements with international
                                                                                                                             markets;
                                                                                                                         •   International stability that enables the current strong global demand for New Zealand commodities to
                                                                                                                             continue; and

24                                            Environmental Scan 2020                                                                                                        Environmental Scan 2020                                                  25
•   Policy and regulation that protects the resource base i.e. biosecurity and environmental integrity, as     The Labour Market
         well as regulation and policy that supports the profitability of primary producers.
                                                                                                                    The average annual unemployment rate for the District to December remains beneath national unemployment
As discussed, the greatest immediate threat to the New Zealand economy is the spread of Covid-19 virus globally     at 3.3%. This compares with a regional unemployment rate of 5.2% and a national unemployment rate of 4.1%.
and the impact this is having on demand for New Zealand agri-food products and it follows, commodity prices
                                                                                                                    Figure 11 - Average annual unemployment rate
for goods produced in New Zealand. To demonstrate, to the year ended December 2019, China was by far our
largest export market making up 27.9% of the total value of New Zealand exports. The current shock to global
trade from the contraction of global demand and the downturn of supply of Chinese inputs to production
has driven down global commodity prices impacting considerably on trade both here and internationally. At                                              9%
the Central Government level, any indication of impacts are being watched closely and as discussed, fiscal
responses are important to manage the impacts of the Covid-19 outbreak on the domestic economy. Data                                                   8%
to support communities to understand potential impacts as more information comes to light would enable
local government and Economic Development Agencies to provide support to our industry sectors and reduce                                               7%
in-part the impacts of uncertainty on economic activity. The Reserve Bank of New Zealand is monitoring the
                                                                                                                                                                                                                                       5.2%

                                                                                                                                 Unemployment Rate %
impacts closely and these impacts will be reported to Council as events unfold.                                                                        6%

More generally, rising protectionism from the United States and the disruption to existing trade arrangements
                                                                                                                                                       5%
and global supply chains driven by Brexit create additional uncertainty for New Zealand primary producers.                                                                                                                              4.1%
While there may be both costs and opportunities for New Zealand producers, the time it takes to negotiate
                                                                                                                                                       4%
and secure trade arrangements poses a cost in terms of uncertainty over periods of negotiation. Thus far, New
Zealand export trade has stood up to the disruption created via the China/USA ‘trade war’. For a small exporting
                                                                                                                                                       3%                                                                              3.3%
nation such as New Zealand, maintaining strong trade relationships, entering into timely negotiations, protecting
the reputation of New Zealand products and progressing with our trade partners in good faith is paramount to
                                                                                                                                                       2%
protecting and expanding market access for our primary producers. Appropriate Central Government policy and
investment is crucial to ensure the right conditions for our primary producers are delivered. Local Government                                         1%
also has an important role to play in advocating for Central Government trade policy and actions that protect
the interests of our primary producers.                                                                                                                0%
Local government also has a central role to play in advocating for central and regional government policy that                                                02 003 004 005 006 007 008 009 010 011 012 013 014 015 016 017 018 019
supports our primary producers to adapt to growing challenges such as changing temperatures, regulatory                                                     20  2   2 2 2       2 2 2 2         2 2     2 2 2 2 2 2 2
requirements and growing costs of compliance. An important part of this is understanding the contribution                                                           Manawatū District         New Zealand         Manawatū-Whanganui Region
that the productive rural sector makes to the wellbeing of our wider communities and the sustainability of
rural communities, including the economic and social costs of indiscriminate land-use conversion from food
production to forestry and carbon farming. Entering into partnerships with primary producers, research institutes
                                                                                                                    To the year ended December 2019, the number of jobseeker beneficiaries increased by 104 to 739. This is a 16.40%
and central government to support the interests of the rural sector alongside innovation and processes to
                                                                                                                    increase in jobseekers over the year to December 2019. This compares with a 10.0% annual increase in national
increase productivity and alleviate environmental concerns is an opportunity for local government to contribute
                                                                                                                    jobseeker beneficiaries. Increases in the number of jobseekers alongside a stable and low unemployment rate
to building the resiliency of the sector, for the benefit of our local communities.
                                                                                                                    in the District continue to imply the mismatch of labour demand with labour supply. Investment in training and
                                                                                                                    skills guided by detailed knowledge of workforce imbalances is essential to address labour force constraints.

                                                                                                                    Labour Market Self-Sufficiency
                                                                                                                    Place of work data from the 2018 Census found that there are 13,818 people who live in the District and work
                                                                                                                    around the Manawatū-Whanganui Region. 9,906 of these workers both live and work in the Manawatū District.
                                                                                                                    Table 3 shows that the Manawatū has a higher level of labour market interdependency than other territorial
                                                                                                                    authorities in the Region. The 2018 Census found that 3,501 workers that live in the Manawatū District work
                                                                                                                    within Palmerston North (25.3% of the total workforce). This has declined from 4,719 workers, or 38.9% of the
                                                                                                                    total workforce, in the 2013 Census.

26                                             Environmental Scan 2020                                                                                                                  Environmental Scan 2020                                27
Table 4: 2018 Census live and work data – labour market self-sufficiency                                               Agriculture, Forestry and Fishing                  20         -48        -8          80          -15        29
                                                                                                                       Information Media and Telecommunications           -5         -1         0           7           20         22
 Territorial                    % of total workers by residence that live and work in the
 Authority                      same District                                                                          Public Administration and Safety                   -14        14         -1          12          5          15
                                                                                                                       Arts and Recreation Services                       1          -5         -2          6           11         11
                                              2013                                        2018
                                                                                                                       Retail Trade                                       -2         -19        8           -3          18         3
 Ruapehu District                             97.9%                                       99.6%                        Owner-Occupied Property Operation                  0          0          0           0           0          0

 Whanganui District                                                                                                    Unallocated                                        0          0          0           0           0          0
                                              95.0%                                       97.8%
                                                                                                                       Mining                                             5          0          -5          1           -1         -1
 Rangitīkei District                          75.4%                                       84.3%
 Manawatū District                            55.9%                                       71.7%                       Construction, manufacturing, accommodation and food services, and professional, scientific and technical
 Palmerston North City                                                                                                services jobs stand out in terms of labour demand over the four year period. The range of skill levels of growth
                                              93.3%                                       95.7%
                                                                                                                      sectors is promising in the sense that changes to the labour market are catering for both entry level positions
 Tararua District                             91.0%                                       93.1%                       to support youth and re-entry to the workforce in addition to higher skilled occupations in the professional
                                                                                                                      services.
 Horowhenua District                          84.5%                                       90.5%
                                                                                                                      Strong growth in construction as a result of unprecedented residential and commercial construction investment
                                                                                                                      over the period has driven sustained growth in construction sector employment. This is likely to continue
As Table 4 shows, the percentage of workers that both live and work in the Manawatū District has increased from       with approximately $200m worth of commercial construction planned for Ōhakea to 2023 and no signs of a
55.9% in 2013 to 71.7% in 2018. This is positive as it indicates that the labour market is providing for a greater    slowdown in residential investment. Accessing labour to support the construction industry to expand to cater
proportion of our workforce within our boundaries.                                                                    for the current growth is essential to both the economic and social wellbeing of our communities, especially as
                                                                                                                      the District experiences significant housing supply constraints.
Skills and Talent Development, Attraction and Retention
                                                                                                                      The range of sectors that are experiencing strong labour demand highlights the importance of understanding
Labour force imbalances are a significant constraint to local economic activity in particular where national          labour market characteristics by place when we define ‘skills and talent’ and design programmes to match
labour market conditions are tight and it is difficult to access appropriately skilled labour from either within or   labour supply with labour demand. This is also essential for the purpose of informing youth and workers in
outside the area. As discussed, the District is currently experiencing an exceptionally low unemployment rate         declining industries. Interestingly, Ministry of Education counts data shows that the percentage of secondary
alongside strong growth in the number of job seeker beneficiaries. These factors imply a significant mismatch         school students in the District leaving school with university entrance fell from 39.1% in 2009 to 28.6% in 2018.
between labour supply and labour demand in the District.                                                              Anecdotally, this suggests a range of employment and training opportunities available to young people reducing
                                                                                                                      the need for school leavers to achieve the level of qualification that will enable them to go directly to university.
Latest Infometrics data for the year ended March 2019 confirm particularly strong growth in employment,
                                                                                                                      Considering the demand for trades-people and labourers, leaving school earlier to enter the construction
increasing by 3.1% versus 1.9% for New Zealand. Breaking this down, job openings data by industry reveals
                                                                                                                      industry does not constitute a decline in skills and talent. Hence, it is important to understand the occupations
changes in labour demand in the District over the period March 2015 to March 2019.
                                                                                                                      that are in demand when we define ‘skills and talent’ and invest accordingly to attract and retain the specific skills
Table 5 - Job openings data by industry                                                                               needed to supply our labour demand.
                                                                                                                      Manawatū District Council invests in our Central Economic Development Agency (CEDA) to undertake labour
 Industry                                             2015       2016        2017   2018          2019   Totals
                                                                                                                      force analysis and design strategy and actions to support skills development and attract and retain skills and
 Construction                                          32         23         103    101           85       345
                                                                                                                      talent to the area.
 Manufacturing                                         78         88         58     7             99       330
 Accommodation and Food Services                       25         30         29     16            70       170        Earthquake-Prone Buildings
 Professional, Scientific and Technical Services       64         52         0      -1            24       140
                                                                                                                      The Building (Earthquake-prone Buildings) Amendment Act 2016 came into force on 1 July 2017. It changed
 Wholesale Trade                                       -17        7          57     89            -2       133
                                                                                                                      the current system for identifying and remediating earthquake-prone buildings. The new system ensures the
 Health Care and Social Assistance                     86         29         -5     21            -7       124
                                                                                                                      way our buildings are managed for future earthquakes is consistent across the country, and provides more
 Administrative and Support Services                   8          56         37     15            -8       108        information for people using buildings, such as notices on earthquake-prone buildings and a public register
 Transport, Postal and Warehousing                     20         0          10     39            31       100        (Ministry of Business, Innovation and Employment, 2017).
 Other Services                                        4          11         12     21            31       79         The new system prioritises identification and remediation of earthquake-prone buildings that either pose a high
 Rental, Hiring and Real Estate Services               0          5          31     30            -10      56         risk to life safety, or are critical to recovery in an emergency. In 2019 the Manawatū District Council consulted
 Education and Training                                5          -7         15     19            4        37         with the community to identify ‘priority thoroughfares’ that are sufficiently busy and where falling masonry
 Financial and Insurance Services                      2          11         6      7             8        34
 Electricity, Gas, Water and Waste Services            5          -3         -3     11            20       29

28                                                 Environmental Scan 2020                                                                                            Environmental Scan 2020                                             29
from buildings damaged in an earthquake would pose a high risk to life safety. Unreinforced masonry buildings             Council will be notifying owners of non-priority buildings in July 2020 that their buildings are potentially
on priority thoroughfares are determined ‘priority buildings’ (Ministry of Business, Innovation and Employment,           earthquake-prone. Owners will have 12 months to respond to Council. Therefore, Council will start issuing
2017).                                                                                                                    earthquake-prone building notices for these buildings around August 2021.

The map below illustrates the priority thoroughfares within the Feilding Central Business District.                       Owners of earthquake-prone heritage buildings may apply to Council for an extension of up to 10 years to
                                                                                                                          strengthen their buildings. For an extension to be granted, the building must be a Category 1 historic place
Figure 12 - Priority thoroughfares in the Feilding CBD:                                                                   on the New Zealand Heritage List/Rārangi Kōrero, or included on the National Historic Landmarks List/Ngā
                                                                                                                          Manawhenua o Aotearoa me ōna korero Tūturu (Building Performance Website, 2020).
                                                                                                                          There is an engineering solution project underway with six building owners in Feilding. The engineering
                                                                                                                          assessments are due to be completed by March 2020. This project has funding from Heritage Equip.
                                                                                                                          There is potential that the owners of priority earthquake-prone buildings within the Feilding CBD may demolish
                                                                                                                          their buildings rather than strengthening them. This would have economic impacts as well as impacts on the
                                                                                                                          amenity and vitality of the Feilding CBD, the scale of such effects being dependent on when and if new buildings
                                                                                                                          are constructed in their place. If Council does not manage the impacts on businesses well, such as by not
                                                                                                                          providing for innovative and mixed use development, there is potential for businesses to relocate outside of
                                                                                                                          the District. This would have flow on impacts on the District economy, including flow on effects from a less
                                                                                                                          attractive CBD, as well as social effects.
                                                                                                                          There is also potential for disruption, congestion, dust and noise effects while earthquake-prone buildings are
                                                                                                                          being strengthened. These effects could be particularly significant if businesses are limited in their ability to
                                                                                                                          temporarily relocate or otherwise continue trading during construction works. The strengthening of earthquake-
                                                                                                                          prone buildings could also temporarily detract from the amenity of the business areas.
                                                                                                                          Council may need to consider and consult on the type and scale of any support that it provides to owners
                                                                                                                          of earthquake-prone buildings during the engineering assessment and strengthening or demolition phase to
                                                                                                                          manage potential impacts on the wider community.

                                                                                                                          Retail Trade
                                                                                                                          Retail spending increased by 4.1% in the District to the year ended December 2019. This is an increase of $8.1m
                                                                                                                          from the previous year, to a total of $208.4m. Spending on takeaways increased by 13.1% followed by 9.5%
                                                                                                                          growth in spending on ‘other retail’. Accommodation expenditure also increased by a healthy 8.4% over the
As the Manawatū District has been categorised as a high seismic risk area, the Manawatū District Council is               year to December, while expenditure on hardware/homeware and apparel posted declines by 3.8% and 1.1%
required to identify potentially earthquake-prone buildings within five years of the Act coming into effect (i.e. by      respectively. Growth in retail activity in the District compares well with national spending which increased by
1 July 2022). Council has now completed the identification of all potential priority earthquake-prone buildings           2.3% alongside a 3.3% increase in retail activity for the Manawatū-Whanganui Region.
in the District and notified the owners of these buildings. Owners have 12 months to respond to Council with an
engineering assessment, evidence of factual error or notification that they do not intent to provide an engineering       Figure 13 - Change in retail sales
assessment. The assessment must be signed by an engineer with relevant skills and experience in structural
                                                                                                                                                                  80                                                                    13.1%                   14%
and earthquake engineering, that meets the requirements of the Earthquake-Prone Building Methodology. If                                                                    2.9%
                                                                                                                                                                  70                                                                                            12%
the engineering assessment determines the building is less than 34% New Build Standard (NBS) the building is
                                                                                                                                                                                               9.5%                                                             10%
classified as earthquake-prone. Council will then issue earthquake-prone building notices under the Building                                                      60                                                         7.0%                        8.4%

Act.                                                                                                                                                                                                                                                            8%
                                                                                                                                                                  50
                                                                                                                                                                                    1.1%

                                                                                                                                                    Millions $
                                                                                                                                                                                                                    4.1%                         -1.1%          6%
The Building (Earthquake-prone Buildings) Amendment Act 2016 gives these building owners 7.5 years from the                                                       40
                                                                                                                                                                                                                                                                4%
date they received the notice from Council in which to strengthen or demolish their earthquake-prone building,                                                    30       $75.7                         -3.8%                                                  2%
or that part of the building that, if it were to collapse, would do so in a way that is likely to cause injury or death                                           20                $40.1                                                                       0%
to persons in or near the building or on any other property, or cause damage to any other property (Ministry of                                                                                $35.3
                                                                                                                                                                  10                                                                                            -2%
Business, Innovation and Employment, 2017). Owners of all other earthquake-prone buildings must strengthen                                                                                               $12.4     $12.8        $12.7    $12.6
                                                                                                                                                                                                                                                         $2.7
                                                                                                                                                                      0                                                                          $3.6
                                                                                                                                                                                                                                                                -4%
or demolish their earthquake-prone building(s) within 15 years of receiving an earthquake-prone building notice

                                                                                                                                                                           g

                                                                                                                                                                                     l

                                                                                                                                                                                               il

                                                                                                                                                                                                           e

                                                                                                                                                                                                                     s

                                                                                                                                                                                                                                              s

                                                                                                                                                                                                                                             s

                                                                                                                                                                                                                                              l

                                                                                                                                                                                                                                             n
                                                                                                                                                                 -10

                                                                                                                                                                                      e

                                                                                                                                                                                                                                           re
                                                                                                                                                                                                                                                                -6%

                                                                                                                                                                                                                   or

                                                                                                                                                                                                                                           nt

                                                                                                                                                                                                                                          ay
                                                                                                                                                                                               ta

                                                                                                                                                                                                         ar
                                                                                                                                                                          lin

                                                                                                                                                                                                                                          io
(Ministry of Business, Innovation and Employment, 2017).

                                                                                                                                                                                   Fu

                                                                                                                                                                                                                                        pa
                                                                                                                                                                                           Re

                                                                                                                                                                                                                                        ra
                                                                                                                                                                                                                 aj
                                                                                                                                                                                                     ew

                                                                                                                                                                                                                                       at
                                                                                                                                                                                                                                      aw
                                                                                                                                                                      ai

                                                                                                                                                                                                               M

                                                                                                                                                                                                                           tu

                                                                                                                                                                                                                                     Ap

                                                                                                                                                                                                                                     od
                                                                                                                                                                     t

                                                                                                                                                                                                    om

                                                                                                                                                                                                                                    ke
                                                                                                                                                                  Re

                                                                                                                                                                                          er

                                                                                                                                                                                                                         s

                                                                                                                                                                                                                                  m
                                                                                                                                                                                                                      Re
                                                                                                                                                                                     th

                                                                                                                                                                                                                                 Ta
                                                                                                                                                                 od

                                                                                                                                                                                                H

                                                                                                                                                                                                                                m
Council will start issuing earthquake-prone building notices for priority buildings in August 2020.

                                                                                                                                                                                    O

                                                                                                                                                                                                                       /
                                                                                                                                                                                              e/

                                                                                                                                                                                                                    es

                                                                                                                                                                                                                             co
                                                                                                                                                        Fo

                                                                                                                                                                                            ar

                                                                                                                                                                                                                 af

                                                                                                                                                                                                                           Ac
                                                                                                                                                                                          dw

                                                                                                                                                                                                            /C
                                                                                                                                                                                                           rs
                                                                                                                                                                                      ar

                                                                                                                                                                                                         Ba
                                                                                                                                                                                     H
                                                                                                                                                                            Dec 2018 $                    Dec 2019 $                      Annual % change

30                                              Environmental Scan 2020                                                                                                                          Environmental Scan 2020                                              31
Tourism                                                                                                                 Figure 15- Average weekly rent – 1994 to 2019
Tourism spending in the District increased by 9.4% to a total of $54.0m to the year ended December 2019. This
compares with annual growth of 2% in Palmerston North and 3.5% growth nationally. International tourism
expenditure in the District increased by 14.1% over the year while domestic tourism expenditure increased by                         500
8.5%. Overall, international tourism contributed $9.6m while domestic tourism contributed $44.4m to total
                                                                                                                                     450
tourism spending.                                                                                                                                                                                                                                                 New Zealand $440
                                                                                                                                     400
Australia continues to be the District’s largest international tourism market. Australian tourists spent $2.5m in the
                                                                                                                                                                                                                                                                  Palmerston North $365
District over the year to December 2019. This is 11.9% growth from the previous year. Strong growth in tourism                       350
spending from Africa and the Middle East, the United States and Germany also helped to bolster international                                                                                                                                                      Manawatū District $331
tourism spending in the District over the period from December 2018 to December 2019.                                                300

                                                                                                                                     250
Figure 14 - International visitor expenditure
                                                                                                                                     200

                                                                                                                                     150
                               5%
                         3%                                                                                                          100
                    4%
               5%                                                                                                                     50
                                         26%
                                                                                                                                       0
          6%                                                             Australia            Germany

                                                                                                                                           00

                                                                                                                                                 01

                                                                                                                                                       02

                                                                                                                                                             03

                                                                                                                                                                   04

                                                                                                                                                                         05

                                                                                                                                                                               06

                                                                                                                                                                                     07

                                                                                                                                                                                           08

                                                                                                                                                                                                 09

                                                                                                                                                                                                       10

                                                                                                                                                                                                             11

                                                                                                                                                                                                                   12

                                                                                                                                                                                                                         13

                                                                                                                                                                                                                               14

                                                                                                                                                                                                                                     15

                                                                                                                                                                                                                                           16

                                                                                                                                                                                                                                                 17

                                                                                                                                                                                                                                                       18

                                                                                                                                                                                                                                                             19
                                                                                                                                                                                                            20

                                                                                                                                                                                                                                                20
                                                                                                                                                                                                                                    20
                                                                                                                                                                                                                        20
                                                                                                                                                                                                                  20

                                                                                                                                                                                                                              20

                                                                                                                                                                                                                                          20

                                                                                                                                                                                                                                                            20
                                                                                                                                                                                                                                                      20
                                                                                                                                                20

                                                                                                                                                                                                      20
                                                                                                                                                                                    20
                                                                                                                                                                        20
                                                                                                                                                            20
                                                                                                                                                      20

                                                                                                                                                                              20

                                                                                                                                                                                                20
                                                                                                                                                                  20

                                                                                                                                                                                          20
                                                                                                                                        20
                                                                         Rest of Oceania      China
                                                                         USA                  Africa and Middle East
        7%                                                                                                                                                   Manawatū District                       Palmerston North City                      New Zealand
                                                                         UK                   All other countries
                                                                         Rest of Asia
               9%                                                        Europe                                         Financial Stability
                                        25%
                                                                                                                        Elevated housing costs are impacting on financial stability. The Reserve Bank of New Zealand (RBNZ) reports
                         10%
                                                                                                                        that ‘The high level and concentration of household sector debt remains the largest single vulnerability of New
                                                                                                                        Zealand’s financial system’ (Reserve Bank of New Zealand, 2019).
                                                                                                                        Household debt accounts for 60% of bank lending. In September 2019, housing debt made up 94.2% of total
                                                                                                                        household debt and increased at a rate of 6.5% over the year to September 2019, versus 0.2% for consumer debt.
                                                                                                                        Overall, household and consumer debt grew at 6.2% over the year.
Manawatū-Whanganui residents are the largest contributor to domestic tourism spending in the District.
                                                                                                                        The RBNZ has responded to increasing debt levels by retaining loan-to-value (LVR) restrictions in an attempt
The number of guest nights in the District to the year ended September increased by 2,094 (3.9%). The guest             to limit further house price growth. The RBNZ is also expected to announce increased capital requirements on
night data series ended in September 2019 therefore, September is the last quarter we have guest night data for.        banks to ensure sufficient capital is held to withstand financial shocks. While such measures support resilience in
                                                                                                                        financial markets they cost those families on low to middle incomes as they have the potential to drive up bank
House Sales                                                                                                             mortgage rates, increasing rents and limiting home ownership for a greater number of families. In addition, the
                                                                                                                        LVR restrictions will impact on those families struggling to save the 20% deposit needed to buy a home.
Annual house sales over the year from September 2018 to September 2019 increased from 432 to 454 (up 4.6%).
Across the Manawatū-Whanganui Region, volumes declined by 4% while national volumes were also down,
falling by 0.7% over the period.

Average Weekly Rent
Average rents in the District as at December 2019 were $331 per week. This compares to average weekly rent of
$365 in Palmerston North and $440 in New Zealand overall. Over the 25-year time series, average weekly rents
in the District have generally undershot Palmerston North rents. Over the past three years, the gap between
rents in the District and Palmerston North have converged. Assuming availability of housing for long term
accommodation, strong housing supply growth will help to alleviate housing pressures over time.

32                                             Environmental Scan 2020                                                                                                                    Environmental Scan 2020                                                                     33
You can also read