Recommendations for Cardiac Chamber Quantification by Echocardiography in Adults: An Update from the American Society of Echocardiography and the ...
←
→
Page content transcription
If your browser does not render page correctly, please read the page content below
European Heart Journal – Cardiovascular Imaging (2015) 16, 233–271                                                                     POSITION PAPER
                  doi:10.1093/ehjci/jev014

Recommendations for Cardiac Chamber
Quantification by Echocardiography in Adults:
An Update from the American Society of
Echocardiography and the European Association
of Cardiovascular Imaging
Roberto M. Lang, MD, FASE, FESC, Luigi P. Badano, MD, PhD, FESC,
Victor Mor-Avi, PhD, FASE, Jonathan Afilalo, MD, MSc, Anderson Armstrong, MD, MSc,
Laura Ernande, MD, PhD, Frank A. Flachskampf, MD, FESC, Elyse Foster, MD, FASE,
Steven A. Goldstein, MD, Tatiana Kuznetsova, MD, PhD, Patrizio Lancellotti, MD, PhD,
FESC, Denisa Muraru, MD, PhD, Michael H. Picard, MD, FASE, Ernst R. Rietzschel, MD,
PhD, Lawrence Rudski, MD, FASE, Kirk T. Spencer, MD, FASE, Wendy Tsang, MD,

                                                                                                                                                                                                       Downloaded from by guest on March 18, 2016
and Jens-Uwe Voigt, MD, PhD, FESC
Chicago, Illinois; Padua, Italy; Montreal, Quebec and Toronto, Ontario, Canada; Baltimore, Maryland; Créteil, France; Uppsala, Sweden; San Francisco, California; Washington, District of Columbia;
Leuven, Liège, and Ghent, Belgium; Boston, Massachusetts

The rapid technological developments of the past decade and the changes in echocardiographic practice brought about by these developments
have resulted in the need for updated recommendations to the previously published guidelines for cardiac chamber quantification, which was the
goal of the joint writing group assembled by the American Society of Echocardiography and the European Association of Cardiovascular Imaging.
This document provides updated normal values for all four cardiac chambers, including three-dimensional echocardiography and myocardial de-
formation, when possible, on the basis of considerably larger numbers of normal subjects, compiled from multiple databases. In addition, this
document attempts to eliminate several minor discrepancies that existed between previously published guidelines.
-----------------------------------------------------------------------------------------------------------------------------------------------------------
Keywords                         Adult echocardiography † Transthoracic echocardiography † Ventricular function † Normal values

From the University of Chicago Medical Center, Chicago, Illinois (R.M.L., V.M.-A., K.T.S.); the University of Padua, Padua, Italy (L.P.B., D.M.); Jewish General Hospital, McGill University,
Montreal, Quebec, Canada (J.A., L.R.); Johns Hopkins University, Baltimore, Maryland (A.A.); INSERM U955 and Hôpital Henri Mondor, Créteil, France (L.E.); Uppsala University, Uppsala,
Sweden (F.A.F.); the University of California, San Francisco, San Francisco, California (E.F.); Medstar Washington Hospital Center, Washington, District of Columbia (S.A.G.); University
Hospital Leuven, Leuven, Belgium (T.K., J.-U.V.); the University of Liège Hospital, Liège, Belgium (P.L.); Massachusetts General Hospital and Harvard Medical School, Boston, Massachusetts
(M.H.P.); Ghent University Hospital, Ghent, Belgium (E.R.R.); and the University of Toronto, Toronto, Ontario, Canada (W.T.).
The following authors reported no actual or potential conflicts of interest in relation to this document: Jonathan Afilalo, MD, MSc, Anderson Armstrong, MD, MSc, Laura Ernande, MD,
PhD, Frank A. Flachskampf, MD, FESC, Steven A. Goldstein, MD, Tatiana Kuznetsova, MD, PhD, Patrizio Lancellotti, MD, PhD, FESC, Victor Mor-Avi, PhD, FASE, Michael H. Picard, MD,
FASE, Ernst R. Rietzschel, MD, PhD, Kirk T. Spencer, MD, FASE, Wendy Tsang, MD, and Jens-Uwe Voigt, MD, PhD, FESC. The following authors reported relationships with one or more
commercial interests: Luigi P. Badano, MD, PhD, FESC, received grants from GE Healthcare, Siemens, and Esaote and serves on the speakers’ bureau for GE Healthcare. Elyse Foster, MD,
FASE, received grant support from Abbott Vascular Structural Heart. Roberto M. Lang, MD, FASE, FESC, received grants from and serves on the speakers’ bureau and advisory board for
Philips Medical Systems. Denisa Muraru, MD, received research equipment from and served as a consultant for GE Healthcare. Lawrence Rudski, MD, FASE, holds stock in GE.
Drs Lang and Badano co-chaired the Writing Group.
Published on behalf of the European Society of Cardiology. All rights reserved. & The Author 2015. For permissions please email: journals.permissions@oup.com.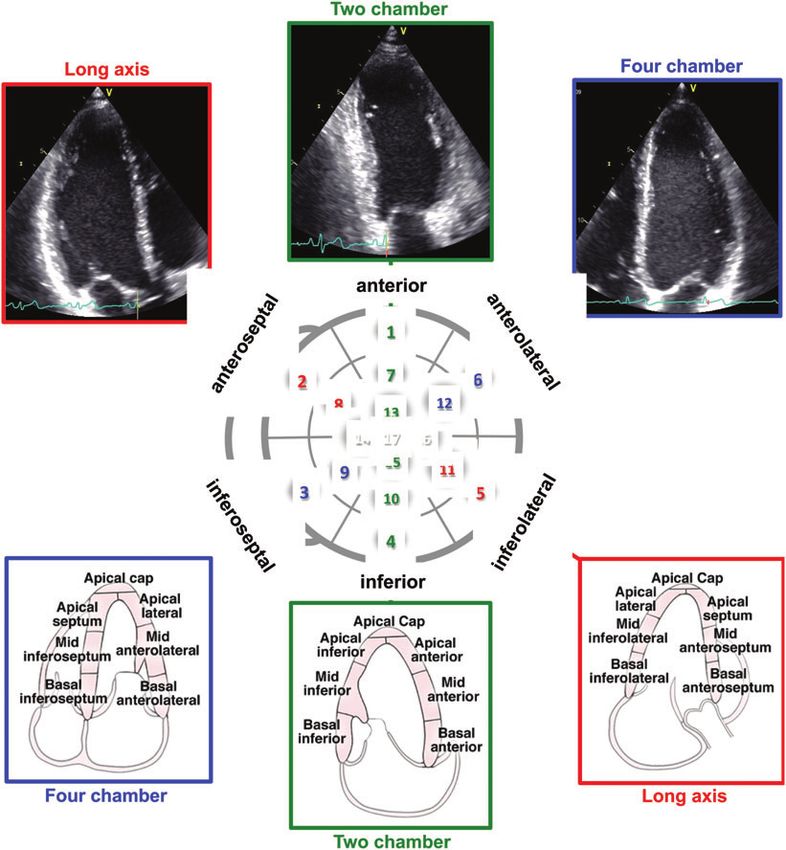
234 R.M. Lang et al.
Table of Contents
I. The Left Ventricle . . . . . . . . . . . . . . . . . . . . . . . . . . . . . . 235 V. The Inferior Vena Cava . . . . . . . . . . . . . . . . . . . . . . . . . . 265
1. Measurement of LV Size . . . . . . . . . . . . . . . . . . . . . . . 235 Notice and Disclaimer . . . . . . . . . . . . . . . . . . . . . . . . . . . . 265
1.1. Linear Measurements . . . . . . . . . . . . . . . . . . . . . 235 Abbreviations . . . . . . . . . . . . . . . . . . . . . . . . . . . . . . . . . . 265
1.2. Volumetric Measurements . . . . . . . . . . . . . . . . . . 235 References . . . . . . . . . . . . . . . . . . . . . . . . . . . . . . . . . . . . 265
1.3. Normal Reference Values for 2DE . . . . . . . . . . . . . 238 Appendix . . . . . . . . . . . . . . . . . . . . . . . . . . . . . . . . . . . . . 271
1.4. Normal Reference Values for 3DE . . . . . . . . . . . . . 238 Methods . . . . . . . . . . . . . . . . . . . . . . . . . . . . . . . . . . . . . 271
Recommendation . . . . . . . . . . . . . . . . . . . . . . . 238 Echocardiographic Measurements . . . . . . . . . . . . . . . . . . . . . 271
2. LV Global Systolic Function . . . . . . . . . . . . . . . . . . . . 238 Statistical Analysis . . . . . . . . . . . . . . . . . . . . . . . . . . . . . . . 271
2.1. Fractional Shortening . . . . . . . . . . . . . . . . . . . . . . 238
2.2. EF . . . . . . . . . . . . . . . . . . . . . . . . . . . . . . . . . . 239
2.3. Global Longitudinal Strain (GLS) . . . . . . . . . . . . . . 239
2.4. Normal Reference Values . . . . . . . . . . . . . . . . . . . 239 The quantification of cardiac chamber size and function is the corner-
Recommendations . . . . . . . . . . . . . . . . . . . . . . 242 stone of cardiac imaging, with echocardiography being the most com-
3. LV Regional Function . . . . . . . . . . . . . . . . . . . . . . . . . 242 monly used noninvasive modality because of its unique ability to
3.1. Segmentation of the Left Ventricle . . . . . . . . . . . . . 242 provide real-time images of the beating heart, combined with its avail-
3.2. Visual Assessment . . . . . . . . . . . . . . . . . . . . . . . 243 ability and portability. Standardization of the methodology used to
3.3. Regional Wall Motion during Infarction and Ischemia . 243 quantify cardiac chambers is maintained by creating and disseminating
3.4. Regional Abnormalities in the Absence of Coronary official recommendations, which when followed by practitioners
Artery Disease . . . . . . . . . . . . . . . . . . . . . . . . . . . . . 243 provides uniformity and facilitates communication. Recommenda-
3.5. Quantification of Regional Wall Motion Using tions for echocardiographic chamber quantification were last pub-
Doppler and STE . . . . . . . . . . . . . . . . . . . . . . . . . . . 244 lished in 2005 by the American Society of Echocardiography (ASE)
Recommendations . . . . . . . . . . . . . . . . . . . . . . 245 and the European Association of Echocardiography (renamed the
European Association of Cardiovascular Imaging [EACVI]).1,2
Downloaded from by guest on March 18, 2016
4. LV Mass . . . . . . . . . . . . . . . . . . . . . . . . . . . . . . . . . 245
Recommendations . . . . . . . . . . . . . . . . . . . . . . 248 Since then, echocardiographic technology has continued evolving,
II. The Right Ventricle . . . . . . . . . . . . . . . . . . . . . . . . . . . . 249 with two major developments being real-time three-dimensional
5. General Recommendations for RV Quantification . . . . . . 249 (3D) echocardiography (3DE) and myocardial deformation imaging.
6. Essential Imaging Windows and Views . . . . . . . . . . . . . . 249 The goal of this document is to provide an update to the previously
7. RV Measurements . . . . . . . . . . . . . . . . . . . . . . . . . . 249 published guidelines, as well as recommendations and reference
7.1. Linear Measurements . . . . . . . . . . . . . . . . . . . . . 249 values, while eliminating the minor discrepancies that existed
7.2. Volumetric Measurements . . . . . . . . . . . . . . . . . . 251 between previous guidelines. The normal values in this update
Recommendations . . . . . . . . . . . . . . . . . . . . . . 251 include 3DE and myocardial deformation, when possible. Important-
8. RV Systolic Function . . . . . . . . . . . . . . . . . . . . . . . . . 253 ly, compared with the previous guidelines, this update is based on
8.1. RIMP . . . . . . . . . . . . . . . . . . . . . . . . . . . . . . . . 253 considerably larger numbers of normal subjects, compiled from mul-
8.2. TAPSE . . . . . . . . . . . . . . . . . . . . . . . . . . . . . . . 254 tiple databases, to improve the reliability of the reference values.
8.3. RV 2D FAC . . . . . . . . . . . . . . . . . . . . . . . . . . . . 255 Although most issues covered in this document reflect a broad
8.4. DTI-Derived Tricuspid Lateral Annular Systolic consensus among the members of the writing group, one important
Velocity . . . . . . . . . . . . . . . . . . . . . . . . . . . . . . . . . 255 issue the group debated was partition values for severity of abnormal-
8.5. RV Strain and Strain Rate . . . . . . . . . . . . . . . . . . . 255 ities. Most often, in addition to describing a parameter as normal or
Recommendations . . . . . . . . . . . . . . . . . . . . . . 256 abnormal (reference values), clinical echocardiographers qualify
8.6. RV 3D EF . . . . . . . . . . . . . . . . . . . . . . . . . . . . . 256 the degree of abnormality with terms such as mildly, moderately,
Recommendation . . . . . . . . . . . . . . . . . . . . . . . 256 and severely abnormal, which reflect the degree to which measure-
III. The Left and Right Atria . . . . . . . . . . . . . . . . . . . . . . . . . 256 ments deviate from normal. In addition to providing normative
9. LA Measurements . . . . . . . . . . . . . . . . . . . . . . . . . . 257 data, it would be beneficial to standardize cutoffs for severity of ab-
9.1. General Considerations for LA Size . . . . . . . . . . . . 257 normality for all parameters across echocardiography laboratories,
9.2. Linear Dimensions and Area Measurements . . . . . . . 257 such that the term moderately abnormal, for example, would have
9.3. Volume Measurements . . . . . . . . . . . . . . . . . . . . 257 the same meaning universally. However, different approaches may
9.4. Normal Values of LA Measurements . . . . . . . . . . . . 257 be used for determining cutoff values for the different degrees of
Recommendations . . . . . . . . . . . . . . . . . . . . . . 260 abnormality, all of which have significant limitations.
10. Right Atrial measurements . . . . . . . . . . . . . . . . . . . . 260 The first approach would be to empirically define cutoffs for mild,
Recommendations . . . . . . . . . . . . . . . . . . . . . . 260 moderate, and severe abnormalities on the basis of SDs above or
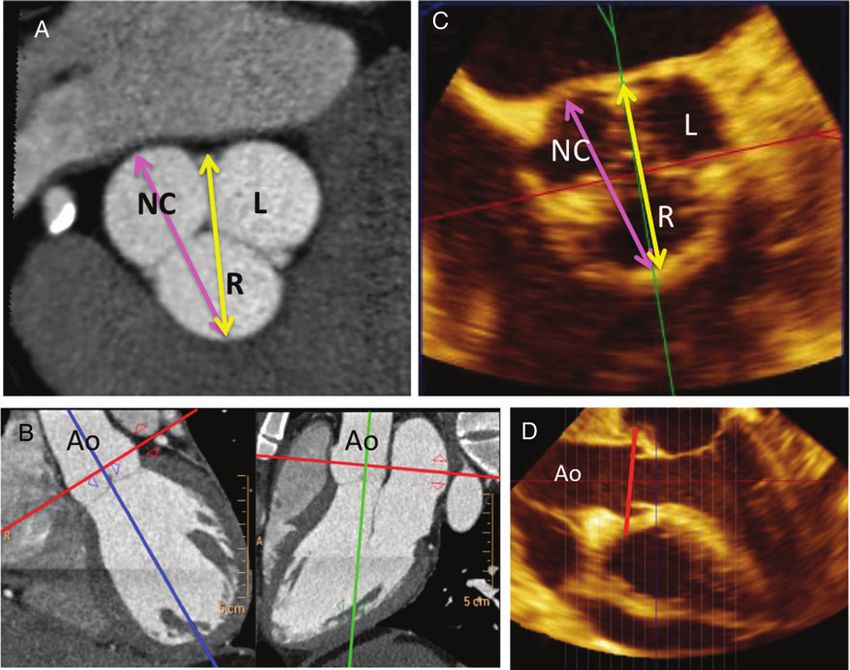
IV. The Aortic Annulus and Aortic Root . . . . . . . . . . . . . . . . . 260 below the reference limit derived from a group of healthy people.
11. The Aortic Annulus . . . . . . . . . . . . . . . . . . . . . . . . . 260 The advantage of this method is that these data readily exist for
12. The Aortic Root . . . . . . . . . . . . . . . . . . . . . . . . . . . 262 most echocardiographic parameters. However, this approach is
13. Identification of Aortic Root Dilatation . . . . . . . . . . . . 264 fundamentally flawed. First, not all echocardiographic parameters
Recommendations . . . . . . . . . . . . . . . . . . . . . . 265 are normally distributed (or Gaussian), even in a normal population.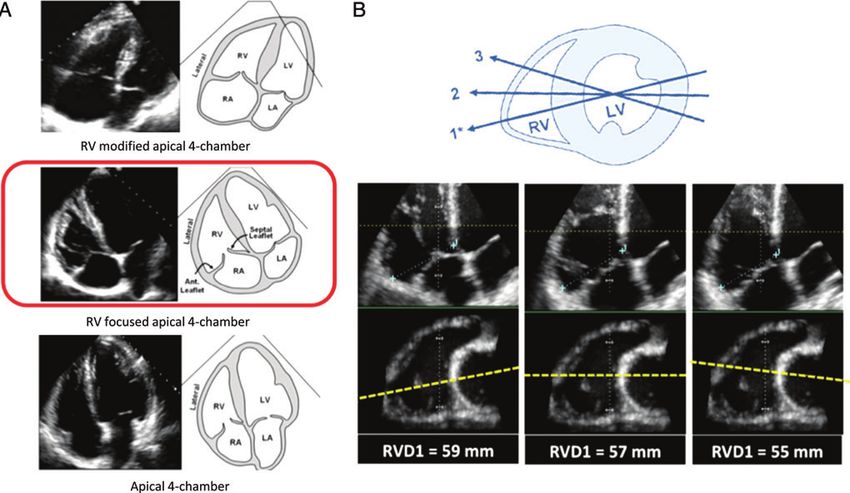
Recommendations for Cardiac Chamber Quantification by Echocardiography in Adults                                                             235

Second, even if a particular parameter is normally distributed in          the same range of normal values for LV and right ventricular (RV)
normal subjects, most echocardiographic parameters, when mea-              chamber dimensions and volumes apply for both TEE and TTE. For
sured in the general population, have a significant asymmetric distri-     details on specific views for optimal measurements, please refer to
bution in one direction (abnormally large for size or abnormally low       the recently published TEE guidelines.3
for function parameters). An alternative method would be to define            All measurements described in this document should be per-
abnormalities on the basis of percentile values (e.g., 95th, 99th) of      formed on more than one cardiac cycle to account for interbeat vari-
measurements derived from a population that includes both                  ability. The committee suggests the average of three beats for patients
healthy people and those with disease. Although these data would           in normal sinus rhythm and a minimum of five beats in patients with
still not be normally distributed, they would account for the asym-        atrial fibrillation. Because the committee acknowledges that the im-
metric distribution and the range of abnormality present within the        plementation of this recommendation is time consuming, the use
general population. The major limitation of this approach is that          of representative beats is acceptable in the clinical setting.
such population data sets simply do not exist for most echocardio-
graphic variables.
    Ideally, an approach that predicts outcomes or prognosis would be      I. The Left Ventricle
preferred. That is, defining a variable as moderately deviated from
normal would imply that there is a moderate risk for a particular          1. Measurement of LV Size
adverse outcome for a patient. Although sufficient data linking risk       The most commonly used parameters to describe LV cavity size
and cardiac chamber sizes exist for several parameters (e.g., left ven-    include linear internal dimensions and volumes. Measurements are
tricular [LV] size and ejection fraction [EF], left atrial [LA] volume),   commonly reported for end-diastole and end-systole, which are
outcomes data are lacking for many other parameters. Unfortunately,        then used to derive parameters of global LV function. To allow com-
this approach also has limitations. The first obstacle is how to           parison among individuals with different body sizes, chamber mea-
best define risk. The cutoffs suggested for the same parameter             surements should be reported indexed to BSA.
vary broadly for different risks in different patient populations and
disease states.                                                            1.1 Linear Measurements

                                                                                                                                                     Downloaded from by guest on March 18, 2016
    Last, cutoff values may be determined by experience-based con-         It is recommended that linear internal measurements of the left ven-
sensus of expert opinions. An extensive debate arose among the             tricle and its walls be performed in the parasternal long-axis view.
members of the writing group, some of whom felt that providing             Values should be carefully obtained perpendicular to the LV long
partition values on the basis of this scientifically less-than-rigorous    axis and measured at or immediately below the level of the mitral
approach would be a disservice to the echocardiography community           valve leaflet tips. In this regard, the electronic calipers should be
and that a disease-specific approach might be required to achieve          positioned on the interface between the myocardial wall and cavity
meaningful clinical categorization of the severity of abnormality.         and the interface between the wall and the pericardium. Internal
Others felt that such cutoffs would provide a uniform reference for        dimensions can be obtained with a two-dimensional (2D) echocardi-
echocardiographic reporting, which would be easier to interpret            ography (2DE)-guided M-mode approach, although linear measure-
by referring clinicians. The compromise was to provide experience-         ments obtained from 2D echocardiographic images are preferred
based partition values only for LV EF and LA volume, while suggested       to avoid oblique sections of the ventricle (Table 1).
partition values for additional parameters of LV size and mass are
listed in the Appendix. All partition values should interpreted with       1.2 Volumetric Measurements
caution in this perspective.                                               LV volumes are measured using 2DE or 3DE. Volume calculations
    For parameters other than LV size, function, and mass as well          derived from linear measurements may be inaccurate, because they
as LA volume, only the mean value and the SD of gender-, age-,             rely on the assumption of a fixed geometric LV shape such as a
and body surface area (BSA)-normalized cutoffs or upper and                prolate ellipsoid, which does not apply in a variety of cardiac
lower limits are reported in the appropriate sections of this docu-        pathologies. Accordingly, the Teichholz and Quinones methods for
ment. For these parameters, measurements exceeding + 1.96 SDs              calculating LV volumes from LV linear dimensions are no longer
(i.e., the 95% confidence interval) should be classified as abnormal.      recommended for clinical use.
Any description of the degree of deviation from normality in the              Volumetric measurements are usually based on tracings of the
echocardiographic report should remain at the discretion of the indi-      interface between the compacted myocardium and the LV cavity.
vidual laboratory, and the writing group does not recommend specif-        At the mitral valve level, the contour is closed by connecting the
ic partition values.                                                       two opposite sections of the mitral ring with a straight line. LV
    Quantification using transesophageal echocardiography (TEE) has        length is defined as the distance between the bisector of this line
advantages and disadvantages compared with transthoracic echocar-          and the apical point of the LV contour, which is most distant to it.
diography (TTE). Although visualization of many cardiac structures is      The use of the longer LV length between the apical two- and four-
improved with TEE, some differences in measurements have been              chamber views is recommended.
found between TEE and TTE, particularly for chamber dimensions                LV volumes should be measured from the apical four- and two-
and thickness. These differences are primarily attributable to the in-     chamber views. Two-dimensional echocardiographic image acquisi-
ability to obtain from the transesophageal approach the standardized       tion should aim to maximize LV areas, while avoiding foreshortening
imaging planes and views used when quantifying chamber dimensions          of the left ventricle, which results in volume underestimation. Acquir-
transthoracically. It is the recommendation of this writing group that     ing LV views at a reduced depth to focus on the LV cavity will reduce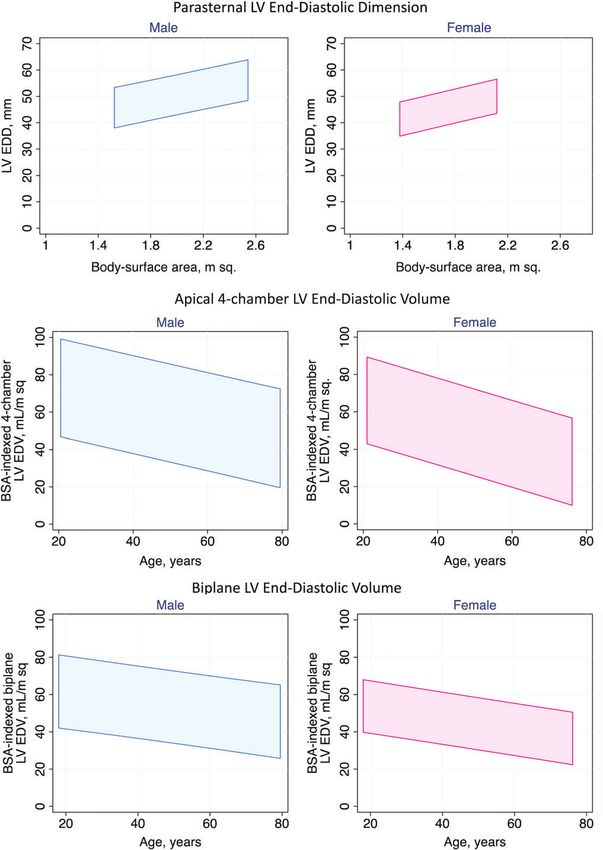
236                                                                                                                                                              R.M. Lang et al.

 Table 1       Recommendations for the echocardiographic assessment of LV size and function

 Parameter and method                             Technique                                                    Advantages                         Limitations
 ...............................................................................................................................................................................
 Internal linear dimensions                       M-mode tracing                                               † Reproducible                    † Beam orientation
    Linear internal measurements of the                                                                        † High temporal resolution          frequently off axis
    LV should be acquired in the                                                                               † Wealth of published data        † Single dimension, i.e.,
    parasternal long-axis view carefully                                                                                                           representative only in
    obtained perpendicular to the LV long                                                                                                          normally shaped
    axis, and measured at the level of the                                                                                                         ventricles
    mitral valve leaflet tips. Electronic
    calipers should be positioned on the
    interface between myocardial wall and
    cavity and the interface between wall
    and pericardium (orange arrows).

                                                  2D-guided linear measurements                                † Facilitates orientation         † Lower frame rates than
                                                                                                                 perpendicular to the              M-mode
                                                                                                                 ventricular long axis           † Single dimension, i.e.,
                                                                                                                                                   representative only in
                                                                                                                                                   normally shaped
                                                                                                                                                   ventricles

                                                                                                                                                                                    Downloaded from by guest on March 18, 2016
 Volumes                                          Biplane disk summation                                       † Corrects for shape              † Apex frequently
   Volume measurements are usually                                                                               distortions                       foreshortened
   based on tracings of the blood-tissue                                                                       † Less geometrical                † Endocardial dropout
   interface in the apical four- and                                                                             assumptions compared            † Blind to shape
   two-chamber views. At the mitral                                                                              with linear dimensions            distortions not
   valve level, the contour is closed by                                                                                                           visualized in the apical
   connecting the two opposite sections                                                                                                            two- and four-chamber
   of the mitral ring with a straight line. LV                                                                                                     planes
   length is defined as the distance
   between the middle of this line and the
   most distant point of the LV contour.

                                                  Area-length                                                  † Partial correction for          † Apex frequently
                                                                                                                 shape distortion                  foreshortened
                                                                                                                                                 † Heavily based on
                                                                                                                                                   geometrical
                                                                                                                                                   assumptions
                                                                                                                                                 † Limited published data
                                                                                                                                                   on normal population

                                                                                                                                                                     Continued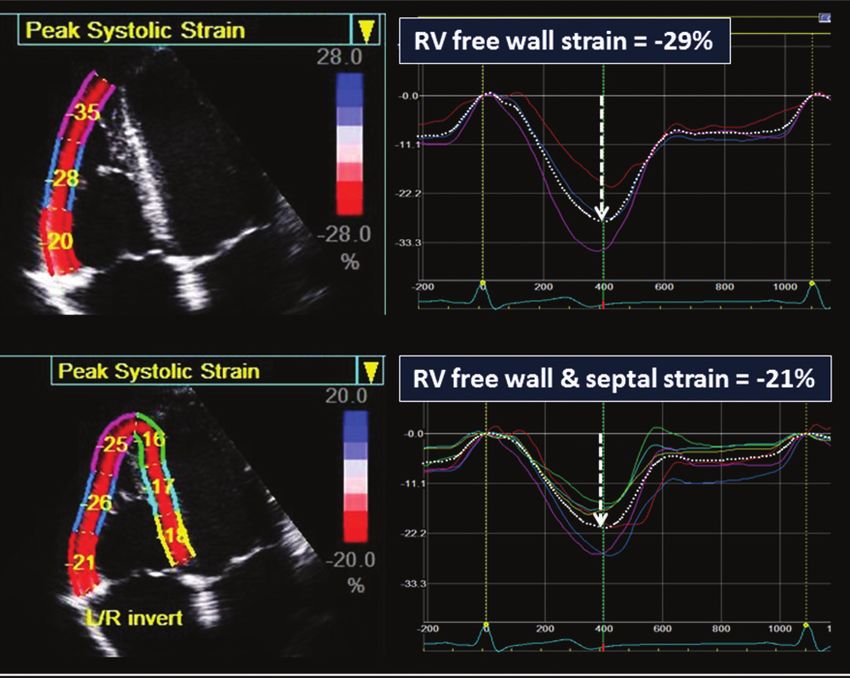
Recommendations for Cardiac Chamber Quantification by Echocardiography in Adults                                                                                                  237

 Table 1 Continued

  Parameter and method                             Technique                                                     Advantages                         Limitations
  ...............................................................................................................................................................................
                                                   Endocardial border enhancement                                † Helpful in patients with        † Same limitations as the
                                                                                                                   suboptimal acoustic               above non-contrast 2D
                                                                                                                   window                            techniques
                                                                                                                 † Provides volumes that           † Acoustic shadowing in
                                                                                                                   are closer to those               LV basal segments with
                                                                                                                   measured with cardiac             excess contrast
                                                                                                                   magnetic resonance

                                                   3D data sets                                                  † No geometrical                  † Lower temporal
                                                                                                                   assumption                        resolution
                                                                                                                 † Unaffected by                   † Less published data on
                                                                                                                   foreshortening                    normal values
                                                                                                                 † More accurate and               † Image quality
                                                                                                                   reproducible compared             dependent
                                                                                                                   to other imaging
                                                                                                                   modalities

                                                                                                                                                                                        Downloaded from by guest on March 18, 2016
  Global longitudinal strain                                                                                     † Angle independent               † Vendor dependent
    Peak value of 2D longitudinal speckle                                                                        † Established prognostic
    tracking derived strain (%).                                                                                   value

 2D, two-dimensional; 3D, three-dimensional; A2C, apical 2-chamber view; A4C, apical 4-chamber view; EDV, end-diastolic volume; ESV, end-systolic volume; LV, left ventricular.

the likelihood of foreshortening and minimize errors in endocardial                           should be taken to avoid acoustic shadowing, which may occur in
border tracings (Table 1). Because the issue of foreshortening is                             LV basal segments in the presence of high concentrations of contrast.
less relevant in 3D data sets, 3D image acquisition should focus                              Normal reference values for LV volumes with contrast enhancement
primarily on including the entire left ventricle within the pyramidal                         are not well established.
data set. To ensure reasonably accurate identification of end-systole,                           The most commonly used method for 2D echocardiographic
the temporal resolution of 3D imaging should be maximized without                             volume calculations is the biplane method of disks summation (modi-
compromising spatial resolution.                                                              fied Simpson’s rule), which is the recommended 2D echocardio-
   Contrast agents should be used when needed to improve endo-                                graphic method by consensus of this committee (Table 1). An
cardial delineation when two or more contiguous LV endocardial                                alternative method to calculate LV volumes when apical endocardial
segments are poorly visualized in apical views, as per published guide-                       definition precludes accurate tracing is the area-length method, in
lines.4 Contrast-enhanced images may provide larger volumes than                              which the LV is assumed to be bullet shaped. The mid-LV cross-
unenhanced images that are closer to those obtained with cardiac                              sectional area is computed by planimetry in the parasternal short-axis
magnetic resonance (CMR) in head-to-head comparison.5 Care                                    view and the length of the ventricle taken from the midpoint of the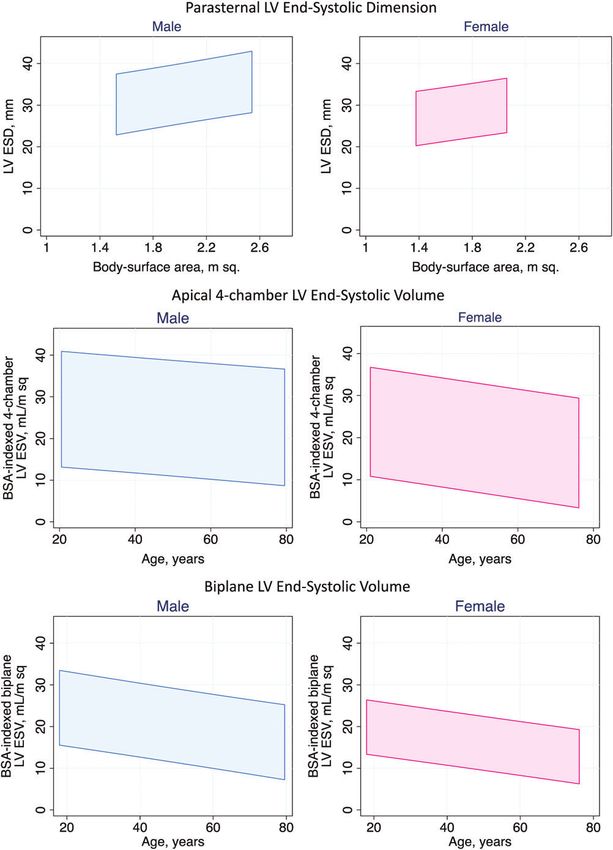
238                                                                                                                                  R.M. Lang et al.

annular plane to the apex in the apical four-chamber view (Table 1).       accuracy of 3DE is comparable with that of CMR, although
The shortcoming of this method is that the bullet-shape assumption         volumes tend to be lower on echocardiography.6
does not always hold true. One of the advantages of 3D echocardio-            The effects of ethnicity on 3D echocardiographic LV volumes were
graphic volume measurements is that they do not rely on geometric          investigated in one study, which reported that LV volumes were
assumptions. In patients with good image quality, 3D echocardio-           smaller among Asian Indians than white Europeans, but EF did not
graphic measurements are accurate and reproducible and should              differ among ethnic groups.14 In most 3D echocardiographic
therefore be used when available and feasible.6 The advantages and         studies, the relationship between age and 3D echocardiographic LV
disadvantages of the various methods are summarized in Table 1.            volumes was examined, and weak to moderate negative correlations
                                                                           were seen between age and LV volumes, while EF did not change sig-
                                                                           nificantly with age.10,15,16 This finding is similar to those described in
1.3 Normal Reference Values for 2DE
                                                                           the CMR literature.17,18 On the basis of weighted averages of three
Data were extracted from seven databases, including Asklepios (year
                                                                           studies,16,19,20 3D echocardiographic LV volumes were larger than
0 and year 10),7 Flemengho,8 CARDIA5 and CARDIA25,9 Padua 3D
                                                                           2D echocardiographic values, and corresponding upper limits of
Echo Normal,10 and the Normal Reference Ranges for Echocardiog-
                                                                           the normal range were EDVs of 79 mL/m2 for men and 71 mL/m2
raphy study,11,12 to obtain reference values in normal subjects for the
                                                                           for women and ESVs of 32 mL/m2 for men and 28 mL/m2 for
left ventricle and the left atrium (see section 10). All data were
                                                                           women. Ultimately, a large study in a diverse population will be
obtained without the use of contrast agents. Data sets for all patients
                                                                           needed to establish normal reference ranges for 3DE for different
included age, gender, ethnicity, height, and weight. To ensure a
                                                                           ethnic groups.
normal population, subjects in these studies were excluded if
any of the following criteria were met: systolic blood pressure
                                                                           Recommendation
.140 mm Hg, diastolic blood pressure .80 mm Hg, history of drug-
                                                                           LV size should be routinely assessed on 2DE by calculating volumes
treated hypertension, diagnosis of diabetes, impaired fasting glucose
                                                                           using the biplane method of disks summation technique. In laborator-
.100 mg/dL, body mass index .30 kg/m2, creatinine .1.3 mg/dL,
                                                                           ies with experience in 3DE, 3D measurement and reporting of LV
estimated glomerular filtration rate ,60 mL/min/1.73 m2, total chol-
                                                                           volumes is recommended when feasible depending on image
esterol .240 mg/dL, low-density lipoprotein cholesterol .130 mg/

                                                                                                                                                        Downloaded from by guest on March 18, 2016
                                                                           quality. When reporting LV linear dimensions, the recommended
dL, and total triglycerides .150 mg/dL. Details of the statistical ana-
                                                                           method is 2D-guided measurements. LV size and volume measure-
lysis are described in the Appendix. Because of varied study aims, not
                                                                           ments should be reported indexed to BSA. For general reference,
all echocardiographic measurements were available for each data-
                                                                           2D echocardiographic LV EDVs of 74 mL/m2 for men and 61 mL/
base. Supplemental Table 1 summarizes the sources of the data for
                                                                           m2 for women and LV ESVs of 31 mL/m2 for men and 24 mL/m2
each measurement group and their baseline characteristics.
                                                                           for women should be used as the upper limits of the corresponding
   Table 2 shows the normal values for 2D echocardiographic para-
                                                                           normal range.
meters of LV size and function according to gender, while Supple-
mental Table 2 provides expanded data for the same parameters,
                                                                           2. LV Global Systolic Function
obtained from different echocardiographic views, and also includes
                                                                           Global LV function is usually assessed by measuring the difference
the corresponding number of subjects used to obtain these data. Sup-
                                                                           between the end-diastolic and end-systolic value of a one-
plemental Table 3 lists normal ranges and consensus-based partition
                                                                           dimensional, 2D, or 3D parameter divided by its end-diastolic
cutoffs for LV dimensions, volumes, EF, and mass. On multivariate
                                                                           value. For this, end-diastole is preferably defined as the first frame
analysis, age, gender, and BSA were found to have a significant
                                                                           after mitral valve closure or the frame in the cardiac cycle in which
independent influence on LV end-diastolic volume (EDV) and LV
                                                                           the respective LV dimension or volume measurement is the largest.
end-systolic volume (ESV). The results across genders and age
                                                                           End-systole is best defined as the frame after aortic valve closure
deciles subdivided into absolute and BSA-normalized values are
                                                                           or the frame in which the cardiac dimension or volume is smallest.
shown in Supplemental Table 4 (see Appendix).
                                                                           In patients with regular heart rhythm, measurements of the timing
   Because ethnicity is an important factor, results of analysis by race
                                                                           of valve openings and closures derived from M-mode echocardiog-
and gender are presented in Supplemental Table 5. From the regres-
                                                                           raphy, pulsed-wave (PW) or continuous-wave Doppler may be
sion analysis, nomograms are provided for plotting observed LV
                                                                           used for accurate definitions of ventricular time intervals.
dimensions versus BSA or BSA-indexed LV volumes versus age
(Figures 1 and 2). Nomograms for absolute LV measurements
                                                                           2.1 Fractional Shortening
against age (Supplemental Figures 1 and 2) and BSA (Supplemental
                                                                           Fractional shortening can be derived from 2D-guided M-mode
Figures 3 and 4) are also provided (see Appendix).
                                                                           imaging or preferably from linear measurements obtained from 2D
                                                                           images. Deriving global LV function parameters from linear measure-
1.4 Normal Reference Values for 3DE                                        ments is problematic when there are regional wall motion abnormal-
Several studies have published 3D echocardiographic reference              ities due to coronary disease or conduction abnormalities. In patients
values for healthy normotensive subjects, which are summarized in          with uncomplicated hypertension, obesity or valvular diseases, such
Table 3.13 The reported variations in the normal ranges from study         regional differences are rare in the absence of clinically recognized
to study are likely due to differences in populations, echocardio-         myocardial infarction, and accordingly, this parameter may provide
graphic equipment, and analysis software, as well as variability in        useful information in clinical studies.21 In patients with normal size
measurement techniques. In patients with good image quality, the           of the LV base but enlarged midventricular and distal portions, LV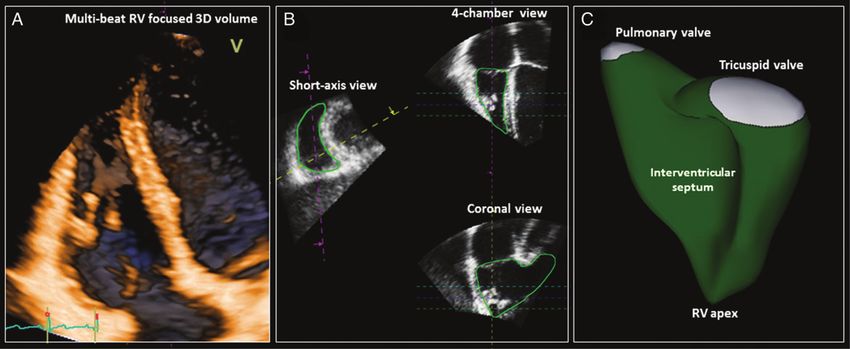
Recommendations for Cardiac Chamber Quantification by Echocardiography in Adults                                                                                                     239

 Table 2        Normal values for 2D echocardiographic parameters of LV size and function according to gender

                                                            Male                                                                     Female
                                                            ..................................................                       ..................................................
  Parameter                                                 Mean + SD                            2-SD range                          Mean + SD                          2-SD range
  ...............................................................................................................................................................................
  LV internal dimension
   Diastolic dimension (mm)                                 50.2 + 4.1                           42.0– 58.4                          45.0 + 3.6                         37.8– 52.2
   Systolic dimension (mm)                                  32.4 + 3.7                           25.0– 39.8                          28.2 + 3.3                         21.6– 34.8
  LV volumes (biplane)
   LV EDV (mL)                                               106 + 22                              62– 150                             76 + 15                            46– 106
   LV ESV (mL)                                                41 + 10                              21– 61                              28 + 7                             14– 42
  LV volumes normalized by BSA
   LV EDV (mL/m2)                                             54 + 10                              34– 74                              45 + 8                             29– 61
   LV ESV (mL/m2)                                             21 + 5                               11– 31                              16 + 4                              8– 24
  LV EF (biplane)                                             62 + 5                               52– 72                              64 + 5                             54– 74

 BSA, body surface area; EDV, end-diastolic volume; EF, ejection fraction; ESV, end-stystolic volume; LV, left ventricular; SD, standard deviation.

volume would be a better marker of LV size than linear dimension                                     After optimizing image quality, maximizing frame rate, and minim-
measured at the LV base.                                                                          izing foreshortening, which are all critical to reduce measurement
                                                                                                  variability, GLS measurements should be made in the three standard
2.2 EF                                                                                            apical views and averaged.25 Measurements should begin with the
EF is calculated from EDV and ESV estimates, using the following                                  apical long-axis view to visualize aortic valve closure, using opening

                                                                                                                                                                                           Downloaded from by guest on March 18, 2016
formula:                                                                                          and closing clicks of the aortic valve or aortic valve opening and
                                                                                                  closing on M-mode imaging. When regional tracking is suboptimal
                          EF = (EDV − ESV)/EDV.
                                                                                                  in more than two myocardial segments in a single view, the calculation
                                                                                                  of GLS should be avoided. In such cases, alternative indices may be
   LV volume estimates may be derived from 2DE or 3DE, as
                                                                                                  used to gain insight into longitudinal LV function, such as mitral
described above (section 1.2). The biplane method of disks (modified
                                                                                                  annular plane systolic excursion or pulsed Doppler tissue imaging
Simpson’s rule) is the currently recommended 2D method to assess
                                                                                                  (DTI)-derived mitral annular peak systolic velocity (s′ ).
LV EF by consensus of this committee. Table 4 lists 2DE-derived
                                                                                                     There are concurrent definitions as a basis for GLS calculation
biplane LV EF, including normal ranges and consensus-based severity
                                                                                                  using endocardial, midwall, or average deformation.24 This commit-
partition cutoffs according to gender. In patients with good image
                                                                                                  tee refrains from recommendations in this regard and refers to the
quality, 3DE-based EF measurements are accurate and reproducible
                                                                                                  ongoing joint standardization initiative of the ASE, EACVI, and the
and should be used when available and feasible.6,10,15,16,19,20
                                                                                                  ultrasound imaging industry.24,26 Because of intervendor and inter-
2.3 Global Longitudinal Strain (GLS)                                                              software variability and age and load dependency, serial assessment
Lagrangian strain is defined as the change in length of an object within                          of GLS in individual patients should be performed using the same
a certain direction relative to its baseline length:                                              vendor’s equipment and the same software.
                                                                                                     The preponderance of currently available data is for midwall GLS.
                          Strain(%) = (Lt − L0 )/L0 ,                                             Although the evidence base for its use in routine clinical echocardiog-
                                                                                                  raphy is far smaller than that for EF, measures of midwall GLS have
where Lt is the length at time t, and L0 is the initial length at time 0.                         been shown in several studies to be robust and reproducible27 and
The most commonly used strain-based measure of LV global systolic                                 to offer incremental predictive value in unselected patients undergo-
function is GLS. It is usually assessed by speckle-tracking echocardi-                            ing echocardiography for the assessment of resting function,28,29 as
ography (STE)22 – 24 (Table 1). On 2DE, peak GLS describes the                                    well as in predicting postoperative LV function in patients with
relative length change of the LV myocardium between end-diastole                                  valve disease.30,31
and end-systole:

                       GLS(%) = (MLs − MLd)/MLd,                                                  2.4 Normal Reference Values
                                                                                                  Normal reference values for LV EF derived from 2DE have been
where ML is myocardial length at end-systole (MLs) and end-diastole                               updated using the population-based studies described in section
(MLd). Because MLs is smaller than MLd, peak GLS is a negative                                    1.3 above. Details can be found in Tables 2 and 4 and Supplemental
number. This negative nature of GLS can lead to confusion when de-                                Tables 2–5 (see Appendix). EF is not significantly related to gender,
scribing increases or decreases in strain. We recommend that all                                  age, or body size, as measured by BSA. Normal EF was 63 + 5%
references to strain changes specifically mention an increase or de-                              using the biplane method of disks. Therefore, in individuals aged
crease in the absolute value of strain, to avoid confusion.                                       .20 years, EF in the range of 53% to 73% should be classified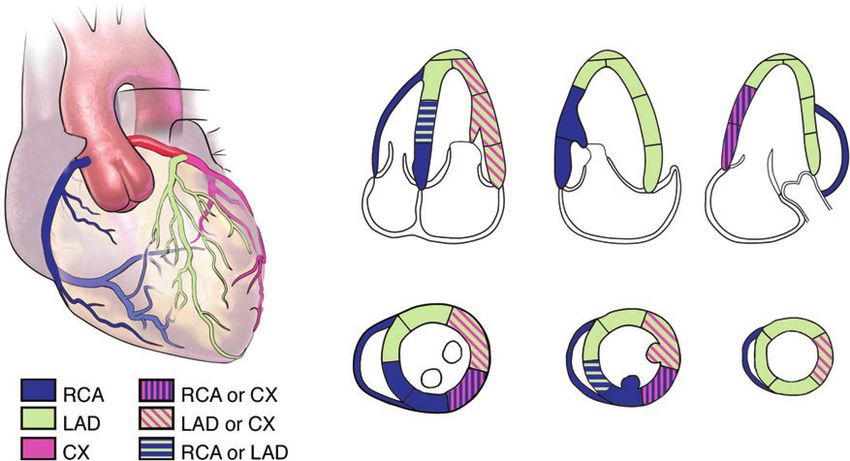
240                                                                                                                               R.M. Lang et al.

                                                                                                                                                     Downloaded from by guest on March 18, 2016

 Figure 1 For men (left) and women (right), the 95% confidence intervals for the following measurements are presented: LV end-diastolic dimen-
 sion measured from a parasternal long-axis window on the basis of BSA (top), BSA-indexed LV EDV measured from an apical four-chamber view on
 the basis of age (middle), and BSA-indexed biplane LV EDV on the basis of age (bottom). For example, a normal BSA-indexed LV EDV measured from
 the four-chamber view in a 40-year-old woman would fall between approximately 30 and 78 mL/m2.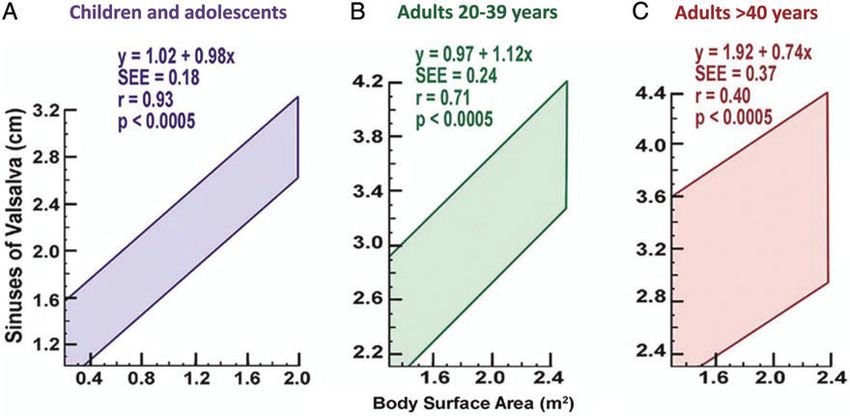
Recommendations for Cardiac Chamber Quantification by Echocardiography in Adults                                                             241

                                                                                                                                                   Downloaded from by guest on March 18, 2016

  Figure 2 For men (left) and women (right), the 95% confidence intervals for the following measurements are presented: LV end-systolic dimen-
  sions measured from a parasternal long-axis window on the basis of BSA (top), BSA-indexed LV ESVs measured from an apical four-chamber view on
  the basis of age (middle), and BSA-indexed biplane LV ESVs based on age (bottom).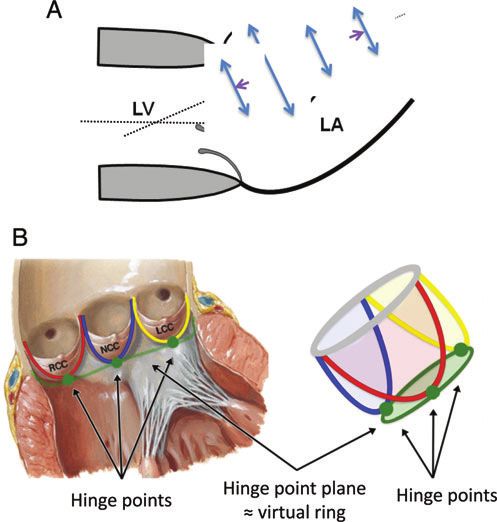
242                                                                                                                                                               R.M. Lang et al.

 Table 3        Normal values for LV parameters obtained with 3DE

                                         Aune et al. (2010)           Fukuda et al. (2012)           Chahal et al. (2012)                              Muraru et al. (2013)
  ...............................................................................................................................................................................
  Number of subjects                     166                          410                            978                                               226
  Ethnic makeup of population            Scandinavian                 Japanese                       51% European white, 49% Asian Indian              White European
  EDVi (mL/m2)
      Men, mean (LLN, ULN)                66 (46, 86)                  50 (26, 74)                   White: 49 (31, 67); Indian: 41 (23, 59)           63 (41, 85)
    Women, mean (LLN, ULN)                58 (42, 74)                  46 (28, 64)                   White: 42 (26, 58); Indian: 39 (23, 55)           56 (40, 78)
  ESVi (mL/m2)
      Men, mean (LLN, ULN)                29 (17, 41)                  19 (9, 29)                    White: 19 (9, 29); Indian: 16 (6, 26)             24 (14, 34)
    Women, mean (LLN, ULN)                23 (13, 33)                  17 (9, 25)                    White: 16 (8, 24); Indian: 15 (7, 23)             20 (12, 28)
  EF (%)
      Men, mean (LLN, ULN)                57 (49, 65)                  61 (53, 69)                   White: 61 (49, 73); Indian: 62 (52, 72)           62 (54, 70)
      Women, mean (LLN, ULN)              61 (49, 73)                  63 (55, 71)                   White: 62 (52, 72); Indian: 62 (52, 72)           65 (57, 73)

 EDVi, LV EDV index; ESVi, LV ESV index; LLN, lower limit of normal; NR, not reported; RT3DTTE, real-time 3D TTE; SVi, LV stroke volume index; ULN, upper limit of normal.
 Modified with permission from Bhave et al.13 LLN and ULN are defined as mean + 2 SDs.

 Table 4        Normal ranges and severity partition cutoff values for 2DE-derived LV EF and LA volume

                                               Male                                                              Female
                                               ................................................................ ................................................................

                                                                                                                                                                                     Downloaded from by guest on March 18, 2016
                                               Normal         Mildly   Moderately                Severely Normal                Mildly   Moderately                 Severely
                                               range          abnormal abnormal                  abnormal range                 abnormal abnormal                   abnormal
  ...............................................................................................................................................................................
  LV EF (%)                                    52– 72         41–51          30–40               ,30             54– 74         41–53           30– 40              ,30
  Maximum LA volume/BSA (mL/m2)                16– 34         35–41          42–48               .48             16– 34         35–41           42– 48              .48

as normal. Three-dimensional echocardiographic normal values have                            guidance, a peak GLS in the range of 220% can be expected in a
been recently reported in different ethnic populations (Table 3).                            healthy person, and the lower the absolute value of strain is below
   Normal values for GLS depend on the definition of the measure-                            this value, the more likely it is to be abnormal.
ment position in the myocardium, the vendor, and the version of
the analysis software, resulting in considerable heterogeneity in the
published literature.27,32,33 It is the consensus of this writing commit-                    3. LV Regional Function
tee that differences among vendors and software packages are still                           3.1 Segmentation of the Left Ventricle
too large to recommend universal normal values and lower limits                              For the assessment of regional LV function, the ventricle is divided
of normal. To provide some guidance, a peak GLS in the range of                              into segments. Segmentation schemes should reflect coronary perfu-
220% can be expected in a healthy person. A selection of recently                            sion territories, result in segments with comparable myocardial mass,
published data is provided in the Appendix together with the lower                           and allow standardized communication within echocardiography and
normal limits (Supplemental Table 6). There is evidence that                                 with other imaging modalities (Figure 3). Accordingly, a 17-segment
women have slightly higher absolute values of GLS than men and                               model is commonly used. Beginning at the anterior junction of the
that strain values decrease with age.32,34 GLS is a valuable and sensi-                      interventricular septum and the RV free wall and continuing counter-
tive tool for follow-up examinations, provided the same equipment,                           clockwise, basal and midventricular segments should be labeled as
tracing methodology, and software are used.                                                  anteroseptal, inferoseptal, inferior, inferolateral, anterolateral, and
                                                                                             anterior. In this 17-segment model, the apex is divided into five seg-
Recommendations                                                                              ments, including septal, inferior, lateral, and anterior segments, as well
LV systolic function should be routinely assessed using 2DE or 3DE                           as the “apical cap,” which is defined as the myocardium beyond the
by calculating EF from EDV and ESV. LV EFs of ,52% for men and                               end of the LV cavity (Figures 3 and 4).35 The 17-segment model may
,54% for women are suggestive of abnormal LV systolic function.                              be used for myocardial perfusion studies or when comparing
Two-dimensional STE-derived GLS appears to be reproducible and                               between different imaging modalities, specifically single photon-
feasible for clinical use and offers incremental prognostic data over                        emission computed tomography, positron emission tomography,
LV EF in a variety of cardiac conditions, although measurements                              and CMR. Figure 5 shows a schematic representation of the perfusion
vary among vendors and software versions. To provide some                                    territories of the three major coronary arteries. When using this
Recommendations for Cardiac Chamber Quantification by Echocardiography in Adults 243
Figure 3 Schematic diagram of the different LV segmentation models: 16-segment model (left),36 17-segment model (center),35 and 18-segment
model (right). In all diagrams, the outer ring represents the basal segments, the middle ring represents the segments at midpapillary muscle level, and
the inner ring represents the distal level. The anterior insertion of the right ventricular wall into the left ventricle defines the border between the
anteroseptal and anterior segments. Starting from this point, the myocardium is subdivided into six equal segments of 608. The apical myocardium in
the 16- and 17-segment models is divided instead into four equal segments of 908. In the 17-segment model an additional segment (apical cap) is added
in the center of the bull’s-eye. (modified from Voigt et al.24).
Downloaded from by guest on March 18, 2016
17-segment model to assess wall motion or regional strain, the 17th average of the scores of all segments visualized. The following
segment (the apical cap) should not be included. scoring system is recommended: (1) normal or hyperkinetic, (2)
Alternative segmentation models treat the apex differently: the hypokinetic (reduced thickening), (3) akinetic (absent or negligible
16-segment model36 divides the entire apex into the same four seg- thickening, e.g., scar), and (4) dyskinetic (systolic thinning or stretch-
ments (septal, inferior, lateral, and anterior; Figure 3, left). Also, some ing, e.g., aneurysm).
segmentation schemes divide the apex into six segments, similar to An aneurysm is a morphologic entity that demonstrates focal dila-
the basal and midventricular levels, resulting in an 18-segment tation and thinning (remodeling) with either akinetic or dyskinetic
model (Figure 3, right) that is simple but results in a slight over- systolic deformation.38 In contrast to the recommendation of previ-
representation of the distal myocardium when scoring. ous guidelines,1,2 this committee refrains from assigning a separate
All segments can be visualized by 2DE. On average, the wall motion score for aneurysm.
two-chamber view and the apical long-axis view intersect with the
four-chamber view at angles of approximately 538 and 1298, respect- 3.3 Regional Wall Motion during Infarction and Ischemia
ively,37 allowing the assessment of the central region of all segments Depending on the regional coronary flow reserve, stress echocardi-
from an apical window, independent of the model used. Although ography may reveal significant coronary artery stenoses by means of
certain variability exists in the coronary artery blood supply to myo- inducing a wall motion abnormality. Myocardial scar may also result in
cardial segments, segments are usually attributed to the three major regional dysfunction of variable severity. Echocardiography can over-
coronary arteries (Figure 5).35 or underestimate the amount of ischemic or infarcted myocardium,
depending on the function of adjacent regions, regional loading con-
3.2 Visual Assessment ditions, and stunning.39 In stress echocardiography, visual recognition
In echocardiography, regional myocardial function is assessed on the of regional dysfunction can be improved with a synchronized
basis of the observed wall thickening and endocardial motion of side-by-side comparison of baseline and stress images using digital
the myocardial segment. Because myocardial motion may be technology.40
caused by adjacent segment tethering or overall LV displacement,
regional deformation (thickening, shortening) should be the focus 3.4 Regional Abnormalities in the Absence of Coronary
of the analysis. However, it must be recognized that deformation Artery Disease
can also be passive and therefore may not always accurately reflect Regional wall motion abnormalities may also occur in the absence of
myocardial contraction. coronary artery disease, in a variety of conditions, such as myocardi-
It is recommended that each segment be analyzed individually in tis, sarcoidosis, and stress-induced (takotsubo) cardiomyopathy. Ab-
multiple views. A semiquantitative wall motion score can be assigned normal motion patterns of the interventricular septum may be found
to each segment to calculate the LV wall motion score index as the postoperatively or in the presence of a left bundle branch block or RV244 R.M. Lang et al.
Downloaded from by guest on March 18, 2016
Figure 4 Orientation of apical four-chamber (A4C), apical two-chamber (A2C), and apical long-axis (ALX) views in relation to the bull’s-eye
display of the LV segments (center). Top panels show actual images, and bottom panels schematically depict the LV wall segments in each view.
epicardial pacing, as well as RV dysfunction caused by RV pressure or deformation rate. Because velocity and motion are measured relative
volume overload. Furthermore, some conduction delays can cause to the transducer, measurements may be influenced by tethering or
regional wall motion abnormalities in the absence of primary myocar- overall heart motion. Accordingly, the use of deformation para-
dial dysfunction. This regional dysfunction is due to the abnormal se- meters, such as strain and strain rate, is preferable.
quence of myocardial activation, which causes heterogeneous The most commonly used deformation parameter is longitudinal
loading conditions and remodeling.41 Ideally, the temporal sequence strain during LV systole. Similar to global strain, with current tech-
of activation and motion should be described. Characteristic motion nology, regional deformation measurements may vary in amplitude,
patterns, which result from abnormal activation sequences, such as depending on the myocardial region being investigated, the measure-
septal bounce (“beaking,” “flash”) or lateral apical motion during ment methodology, the vendor, and sample volume definition.
systole (“apical rocking”) should be reported.42 – 45 Therefore, no specific normal ranges are provided in this document.
These values await the upcoming consensus document of the joint
3.5 Quantification of Regional Wall Motion Using task force of the ASE, EACVI, and the industry for the standardization
Doppler and STE of quantitative function imaging.23,25
Echocardiographic quantification of regional myocardial function is Independent of strain magnitude, characteristic changes in tem-
currently based on DTI or speckle-tracking echocardiographic tech- poral pattern of myocardial deformation can be assessed as well. Lon-
niques.46 – 48 Both techniques provide comparable data quality, gitudinal shortening or radial thickening of the myocardium after
although DTI is known to be angle dependent and prone to under- aortic valve closure (postsystolic shortening or thickening, some-
estimating motion that is not parallel to the ultrasound beam. Com- times referred to as tardokinesis) of .20% of the total deformation
monly used parameters include velocity, motion, deformation, and during the cardiac cycle is a consistent sign of regional functionalRecommendations for Cardiac Chamber Quantification by Echocardiography in Adults 245
Figure 5 Typical distributions of the right coronary artery (RCA), the left anterior descending coronary artery (LAD), and the circumflex
coronary artery (CX). The arterial distribution varies among patients. Some segments have variable coronary perfusion.
Downloaded from by guest on March 18, 2016
inhomogeneity (e.g., ischemia, scar).44 The development of postsys- of LV myocardium, while 3DE can measure it directly. All methods
tolic shortening during a stress test has been proposed as an indicator then convert the volume to mass by multiplying the volume of myo-
of regional ischemia.49 The value of regional deformation parameters cardium by the myocardial density (approximately 1.05 g/mL).
and temporal patterns of strain derived by speckle-tracking from When the entire ventricle is measured from 2D echocardiograph-
either 2D or 3D echocardiographic data sets is the subject of ic images, either the area-length or truncated ellipsoid technique is
ongoing research and remains to be determined.50,51 used.1 Each method for LV mass measurement has advantages, disad-
vantages, and value in specific situations (Table 5).
Recommendations To measure LV mass in an individual patient over time, especially
Different LV segmentation models are used in clinical practice. those with cardiac disease, the 2D echocardiographic methods
The 17-segment model is recommended to assess myocardial per- have advantages compared with the linear dimension technique.1
fusion with echocardiography and other imaging techniques. The There are, however, fewer studies of the prognostic value of LV
16-segment model is recommended for routine studies assessing mass calculated by these methods compared with the linear dimen-
wall motion, because endocardial excursion and thickening of the sion method described below. Unlike the linear dimension or
tip of the apex are imperceptible. To assess wall motion, each M-mode method, the 2D echocardiographic methods can accom-
segment should be evaluated in multiple views and a four-grade modate for the shape of the ventricle and account for changes in
scoring should be applied: (1) normal or hyperkinetic, (2) hypokinetic LV size that might occur along the long axis of the chamber. This is
(reduced thickening), (3) akinetic (absent or negligible thickening), an important consideration, because changes in LV geometry are
and (4) dyskinetic (systolic thinning or stretching). Despite promising common in various cardiac diseases.
data, quantitative assessment of the magnitude of regional LV de- However, when there is a need to screen or study large popula-
formation cannot be recommended at this stage because of lack of tions, the M-mode method has advantages, because it is simple,
reference values, suboptimal reproducibility, and considerable inter- quick, and subject to less measurement variability. There is a large
vendor measurement variability. body of evidence to support the accuracy of this method. Most
studies that relate LV mass to prognosis are based on this
4. LV Mass method.56 However, several caveats need to be mentioned. First, it
LV mass is an important risk factor for, and a strong predictor of, car- is critical that the wall thickness and LV dimensions measured be
diovascular events.52 – 55 There are several methods that effectively truly perpendicular to the long axis of the left ventricle. Therefore,
calculate LV mass from M-mode echocardiography, 2DE, and 3DE 2D-guided M-mode imaging or measurements from 2D echocardio-
(Table 5). All measurements should be performed at the end of dia- graphic images are preferred over blind M-mode imaging. Second, the
stole (the frame before mitral valve closure or the frame in the formula includes a correction for the 20% overestimation that was
cardiac cycle in which the ventricular dimension or volume is found during the original validation studies of the M-mode technique.
largest). Those that use M-mode (either blinded or 2D-guided) and Because direct 2D measures of wall thickness may yield smaller
2D echocardiographic linear measurements of LV diastolic diameter values than the M-mode technique, LV mass calculated using this
and wall thickness rely on geometric formulas to calculate the volume formula may not be directly interchangeable (Table 5). This may be246
Table 5 Recommendations for the echocardiographic assessment of LV mass
Parameter and method Echocardiographic imaging Advantages Limitations
.............................................................................................................................................................................................................................................
Linear method M-mode tracing † Fast and widely used † Based on the assumption that the left ventricle is a
Cube formula † Wealth of published data prolate ellipsoid with a 2:1 long/short axis ratio
† Demonstrated prognostic value and symmetric distribution of hypertrophy
LV mass = 0.8 · 1.04 · [(IVS + LVID + PWT)3
† Fairly accurate in normally shaped † Beam orientation frequently off axis
− LVID3 ] + 0.6 g ventricles (i.e., systemic hypertension, † Since linear measurements are cubed, even small
aortic stenosis) measurement errors in dimensions or thickness
Where IVS is interventricular septum; LVID is LV
† Simple for screening large populations have an impact on accuracy
internal diameter, and PWT is inferolateral wall
† Overestimates LV mass
thickness.
† Inaccurate in the presence of asymmetric
Linear internal measurements of the LV should be
hypertrophy, dilated ventricles and other
acquired from the parasternal approach and carefully
diseases with regional variations in wall thickness
obtained perpendicular to the LV long axis, and
measured at the level of the mitral valve leaflet tips.
M-mode measurements should be obtained from a
targeted SAX or a parasternal LAX view. All
measurements should be performed at end-diastole.
2D † Facilitates orientation perpendicular to † Based on the same geometrical assumptions
the LV long axis as M-mode
† Same limitations as M-mode in patients with
abnormal LV geometry
† Impact of harmonic imaging on the mass
calculations and normal values remains to be
defined
† Normal values are less well established than for
M-mode measurements
2D based formulas † Partial correction for shape distortions † Good image quality and properly oriented
Truncated ellipsoid: † Less dependent on geometrical parasternal short-axis views (no oblique planes)
assumptions than the linear are required
measurements † Good epicardial definition is required
LV mass = 1.05p (b + t)2 † Cumbersome methodology
† Higher measurement variability
2 d3 † Few published normative data
(a + t) + d − † Limited prognostic data
3 3(a + t)2
2 d3
−b2 a + d − 2
3 3a
R.M. Lang et al.
Downloaded from by guest on March 18, 2016Recommendations for Cardiac Chamber Quantification by Echocardiography in Adults
Area-length:
LV mass = 1.05
5
A1 (a + d + t)
6
5
− A2 (a + d)
6
Mean wall thickness is calculated from epicardial (A1) and
endocardial (A2) cross-sectional areas in short-axis view at
the papillary muscle level (top panel, green line) with the
papillary muscles considered part of the LV cavity. The
short axis radius is calculated as:
A2
b
p
Then, mean wall thickness t is calculated as:
A1
t= −b
p
and the cross sectional area of the myocardium (Am) in
short-axis view is:
Am = A1 − A2
LV mass is calculated from these measurements plus the
LV length measured from the level of the short axis plane
to the base (d) and to the apex (a).
Key: a - distance from the minor axis to the endocardium at
the LV apex; b ¼ LV minor radius; d - distance from the
minor axis to the mitral valve plane; t - mean wall thickness.
LV mass ¼ (LV epicardial volume 2 LV endocardial
volume). 1.05 ¼ LV myocardial volume. 1.05
LV mass ¼ (LV epicardial volume 2 LV endocardial
volume). 1.05 ¼ LV myocardial volume. 1.05
3D based formula 3D data set † Direct measurement without † Normal values less well established
geometrical assumptions about cavity † Dependent on image quality
shape and hypertrophy distribution † Patient’s cooperation required
† More accurate than the linear or the
2D measurements
† Higher inter-measurement and test/
re-test reproducibility
† Better discriminates small changes
within a patient
247
Downloaded from by guest on March 18, 2016248 R.M. Lang et al.
a less important consideration if the method is being used to identify
cutoff values for prognosis. It is also important to note that the Table 6 Normal ranges for LV mass indices
formula raises the linear dimensions to the power of 3, and thus Women Men
even small errors in dimensions can have significant effects on the cal- ................................................................................
culated LV mass. Linear method
Most studies that have compared 2D-guided M-mode measure- LV mass (g) 67–162 88– 224
ments of LV mass with the 2D echocardiographic area-length or trun- LV mass/BSA (g/m 2) 43 –95 49– 115
cated ellipsoid methods in normally shaped ventricles have shown Relative wall thickness (cm) 0.22–0.42 0.24– 0.42
subtle differences but no clear advantage of one technique over Septal thickness (cm) 0.6–0.9 0.6– 1.0
the other.57 However, comparison studies have not been performed Posterior wall thickness (cm) 0.6–0.9 0.6– 1.0
in the current era, when tremendous gains in 2D echocardiographic 2D method
image quality have been made. In fact, large population studies con- LV mass (g) 66–150 96– 200
firming or reestablishing normal values for LV mass with harmonic LV mass/BSA (g/m 2) 44 –88 50– 102
imaging are limited.58,59
Because 3DE is the only echocardiographic method that directly Bold italic values: recommended and best validated.
measures myocardial volume, it is an appropriate approach. Numer-
ous validation studies have been performed.60 However, to date,
there have been few studies assessing its practical use, feasibility, vari-
ability, or prognostic value in large-scale clinical environments.61 Ac-
cordingly, it is the consensus of this committee that the 3D
echocardiographic LV mass data available in normal subjects are
not sufficient to recommend normal reference values. It must also
be noted that continuous improvements in the spatial and temporal
resolution of 3D echocardiographic imaging will also influence
Downloaded from by guest on March 18, 2016
normal values and measurement variability.
In patients with upper septal hypertrophy, the linear dimension
methods, which use basal ventricular measurements, result in over-
estimation of the true mass, because the thickest region of the inter-
ventricular septum is incorporated in the measurement. In contrast,
the area-length method, which uses mid-ventricular measurements,
underestimates LV mass, because the thickest part of the interventri-
cular septum is not included in the measurement. In the setting of dis-
crete upper septal or asymmetric hypertrophy, if these methods are
used to serially assess LV mass in a patient, it is critical to use the same
methodology over time and to measure the walls at the same level of
the ventricle. The 3D method has the advantage of accommodating Figure 6 Comparison of RWT. Patients with normal LV mass can
regional differences in wall thickness and therefore can provide the have either concentric remodeling (normal LV mass with increased
most accurate measurements of LV mass in this setting. RWT ≥ 0.42) or normal geometry (RWT ≤ 0.42) and normal LV
The values for LV mass vary according to gender, age, body mass. Patients with increased LV mass can have either concentric
(RWT ≥ 0.42) or eccentric (RWT ≤ 0.42) hypertrophy. These
size, obesity, and region of the world. Therefore, uniform reference
LV mass measurements are based on linear measurements.
values are difficult to define. LV mass is higher in men independent
of body size and increases with body size. Since the publica-
tion of the 2005 recommendations, several studies, mostly using
linear measurements, have reported normal values of LV mass
predict events in obese patients.65,70 However most large population
in normal populations.59,62 – 66 The larger studies reported values
studies reporting LV mass have indexed to BSA.
close to those recommended in the previous guidelines.62,65,66
Finally, calculation of relative wall thickness (RWT) with the
Therefore, the same reference values and abnormality partition
formula (2 × posterior wall thickness)/(LV internal diameter at end-
cutoffs as reported in the previous guidelines continue to be recom-
diastole) permits categorization of an increase in LV mass as either
mended (Table 6). However, characterization of the population being
concentric (RWT .0.42) or eccentric (RWT ≤ 0.42) hypertrophy
studied, and differences in mass between different ethnic populations
and allows the identification of concentric remodeling (normal LV
should be taken into account when determining normal
mass with increased RWT) (Figure 6).
values.10,16,67 – 69
The indexing of LV mass allows comparisons in subjects with differ-
ent body sizes. However, whether to use height, weight, or BSA as the Recommendations
indexing term remains controversial. Studies suggest that indexing to In the normally shaped left ventricle, both M-mode and 2D echocar-
height raised to allometric powers such as 1.7, 2.13, and 2.7 has diographic formulas to calculate LV mass can be used. Normal values
advantages over indexing to BSA, especially when attempting to for these techniques remain unchanged from the previous guidelinesYou can also read