Safe Cities Index 2019 - Urban security and resilience in an interconnected world - The Economist
←
→
Page content transcription
If your browser does not render page correctly, please read the page content below

Safe Cities Index 2019
Urban security and resilience in an interconnected world

                                                           Sponsored by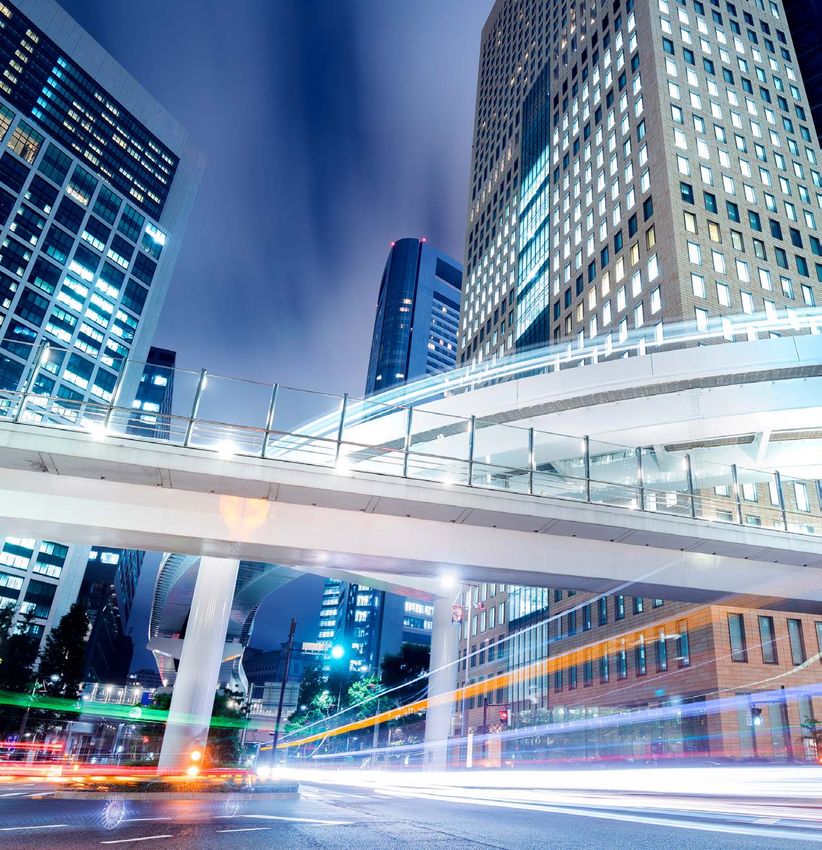
Safe Cities Index 2019
             2
                   Urban security and resilience in an interconnected world

                              About the report
                              The Safe Cities Index 2019 is a report from The Economist Intelligence
                              Unit, sponsored by NEC Corporation. The report is based on the
                              third iteration of the index, which ranks 60 cities across 57 indicators
                              covering digital security, health security, infrastructure security and
                              personal security.

                              The index was devised and constructed by Vaibhav Sahgal and Divya
                              Sharma Nag. The report was written by Paul Kiestra and edited by Naka
                              Kondo and Chris Clague. Findings from the index were supplemented
                              with wide-ranging research and in-depth interviews with experts in the
                              field. Our thanks are due to the following people (listed alphabetically
                              by surname) for their time and insights:
                              l   Siddharth Agarwal, director, Urban Health Resource Centre
                              l   Alioune Badiane, president, The Urban Think Tank Africa (TUTTA),
                                  Senegal
                              l   Thomas Bollyky, senior fellow, Global Health, US Council on Foreign
                                  Relations
                              l   Gregory Falco, cyber research fellow, Stanford University
                              l   Emmanuel Grégoire, deputy mayor, City of Paris
                              l   Lord Bernard Hogan-Howe, former commissioner, London
                                  Metropolitan Police
                              l   Ede Ijjasz-Vasquez, senior director, Social, Urban, Rural and
                                  Resilience Global Practice, World Bank
                              l   Elizabeth Johnston, executive director, European and French Forums
                                  for Urban Security
                              l   Yuriko Koike, governor, Tokyo
                              l   Victor Lam, chief information officer, Government of Hong Kong
                              l   Esteban Leon, chief of risk reduction unit and head of the city
                                  resilience profiling programme, UN-Habitat
                              l   Fumihiko Nakamura, vice-president, Yokohama National University
                              l   Adie Tomer, leader, Metropolitan Infrastructure Initiative, Brookings
                                  Institution
                              l   Gino Van Begin, secretary-general, ICLEI

© The Economist Intelligence Unit Limited 2019
Safe Cities Index 2019
                                                                                              3
                          Urban security and resilience in an interconnected world

Executive summary
Humanity is a predominantly urban species, with over 56% of us living in cities. By 2050 68% will
do so, reflecting a speed of urbanisation even faster than previously predicted. This process is
occurring most visibly in developing countries, some of which struggle to deal with the extent
of change. Indeed, the challenges of urbanisation, if unmet, can entail substantial human and
economic risks. On the other hand, if they are effectively addressed, the growth of cities may
become an essential part of how emerging economies find a way to catch up to those in more
developed countries and how humanity as a whole creates more sustainable ways to live.

Thus, urban management will play a fundamental role in defining the quality of life of most
human beings in the coming years. A key element of this will be the ability of cities to provide
security for their residents, businesses and visitors. Accordingly, The Economist Intelligence
Unit, sponsored by NEC Corporation, maintains the Safe Cites Index (SCI)—a detailed
benchmarking tool that measures a wide range of security inputs and results.

The SCI has always reflected the multifaceted nature of urban safety, with indicators
divided into four distinct pillars: digital, infrastructure, health and personal security. The
2019 version (SCI2019)—which this report accompanies the release of—benefits from a major
revision designed to better measure “urban resilience”. This concept—the ability of cities
to absorb and bounce back from shocks—has had an increasing influence on thinking in
urban safety over the last decade, especially as policymakers worry about the implications
of climate change. Rather than trying to create a fifth distinct pillar of security, the index
now measures new areas within the other four of particular relevance to resilience such
as disaster-risk informed development policies.

The key findings from the expanded and updated SCI this year include:

l   Tokyo again comes first overall, and Asia-Pacific cities make up six of the top ten, but
    geographic region does not have a statistical link with results. As it did in the previous
    SCI, Tokyo has the highest overall score in our index. Other cities in the top ten are Singapore
    (2nd), Osaka (3rd), Sydney (5th), Seoul (tied 8th) and Melbourne (10th). Two European cities are
    in this group, Amsterdam (4th) and Copenhagen (tied 8th), while two from America complete
    it, Toronto (6th) and Washington, DC (7th). However, a closer look at the important correlates
    of security, discussed below, found city safety is not related to global region: Tokyo, Singapore
    and Osaka lead because of their specific strengths, not because they happen to be in Asia.
l   The results in individual index pillars show the importance of getting the basics right.
    Leo Tolstoy famously wrote, “All happy families are alike: each unhappy family is unhappy in its
    own way.” A look at the top five cities in each pillar—digital, health, infrastructure and personal
    security—yields a similar message. In each area, leading cities got the basics right, be it easy
    access to high-quality healthcare, dedicated cyber-security teams, community-based police
    patrolling or disaster continuity planning. Even among the leaders, the weaknesses of those
    not in first place tended to vary from city to city. Those who want to improve need to get the
    basics in place and then consider their own specific situations.

                                                               © The Economist Intelligence Unit Limited 2019
Safe Cities Index 2019
             4
                   Urban security and resilience in an interconnected world

Looking at the index results as a whole provides a number of key insights into urban security:

l   Despite having many elements, city safety is indivisible. The different kinds of security
    covered by the index require distinct interventions, often by different agencies or actors,
    such as health systems for medical care and police for public order. Amid this diversity,
    though, statistical analysis of the SCI2019 results shows that performance in each of the
    pillars correlates very closely with that in every other. In short, cities tend to do well, middling
    or poorly across every security pillar rather than having good results in one and lagging in
    others. This is consistent with expert commentary that, rather than representing clearly
    distinct fields, different kinds of safety are thoroughly intertwined and mutually supportive.
    Service planning and provision must take this into account. Technological investments
    for infrastructure, for example, can bring health benefits, while enhanced cyber-security
    will protect the ability of the city to provide every kind of security, not just protection of
    digital systems.
l   The SCI2019 results are not evenly spread but have a large number of cities clustered
    at the top, with the rest showing much more variation in scores. Just 10 points separate
    the overall scores of the top 24 cities, while the following 36 are over 40 points apart. This
    does not mean that the differences in the leaders’ group are unimportant. Instead, on a scale
    that can measure every index city, the large group of top cities are much more similar to each
    other than to those lagging behind.
l   Higher income sets apart those with better results, but in ways that are less than
    obvious. The index scores correlate strongly with average income in the cities. In part
    this reflects the need to invest sometimes substantial amounts in certain areas essential
    to security, such as high-quality infrastructure or advanced healthcare systems. The more
    surprising contribution to this correlation is that, across our index, those cities with less wealth
    also tend to lack policy ambition. As one interviewee told us, the biggest challenges facing
    Sub-Saharan African cities reflect a lack of effective planning and management. Low-hanging
    (or at least relatively low-cost) fruit exist, which all cities that have not already done so should
    attempt to harvest. Doing so requires focus and perseverance.
l   Transparency matters as much as wealth to urban security. Levels of transparency in
    cities, as measured by the World Bank’s Control of Corruption metric, correlated as closely
    as income with index scores. Correlation does not guarantee causation, but interviewed
    experts stressed the many ways that transparency and accountability are essential in every
    pillar of urban security, from building safer bridges to developing the trust needed for relevant
    stakeholders to share information on cyber-attacks. Well-governed, accountable cities are
    safer cities.

© The Economist Intelligence Unit Limited 2019
Safe Cities Index 2019
                                                                                           5
                         Urban security and resilience in an interconnected world

l   Transparency and a new understanding of the elements of urban safety are essential
    to resilience. Those parts of our index most directly related to resilience indicate that,
    as with safety more generally, higher incomes are associated with better preparedness.
    This is unsurprising: technologically advanced infrastructure, for example, if appropriately
    deployed, can be an important contributor to resilience. In this case, though, transparency
    and accountability seem to be of even greater importance: a poorly governed city will almost
    never be resilient.
    Although not able to offer a general prescription for resilience, our research points to
    a number of key elements, including joint planning by all relevant stakeholders, both
    governmental and non-governmental, to prepare for shocks; a new understanding of
    infrastructure that uses a city’s natural assets as tools to enhance its ability to absorb
    shocks; and the importance of promoting social connectedness among citizens in creating
    communities that will work together in a crisis.

                                                            © The Economist Intelligence Unit Limited 2019
Safe Cities Index 2019
             6
                   Urban security and resilience in an interconnected world

                              Contents
                              7          Introduction: Why urban safety matters to us all
                              7		        A disorderly transition toward ever-greater urbanity

                              10		 The many faces of security
                              10		 The Economist Intelligence Unit’s Safe Cities Index 2019
                              12		 The rise of resilience and enhancements to this year’s index

                              15		 Insights from the index
                              15		 The SCI2019 results
                              16		 Box: Digital security
                              16		 Box: Health security
                              17		 Box: Infrastructure security
                              17		 Box: Personal security
                              19		 Box: Q&A with a city leader—Yuriko Koike, governor, Tokyo
                              20		 Safety is indivisible
                              23		 Box: New technology and non-digital security
                              24		 What sets cities apart?
                              25			 i. Wealth matters, but sometimes in unexpected ways
                              27			 ii. Transparency matters at least as much as money
                              29		 A look at SCI trends: Urban safety is a marathon, not a sprint
                              30		 Box: A look at what has, or has not, changed in Washington, DC
                              32		 Box: Q&A with a city leader—Victor Lam, government chief
                                   information officer, Hong Kong

                              34		       The SCI cities and resilience
                              34		       The challenge in aggregate
                              35		       Risk and readiness in the SCI: Wealth and transparency redux
                              39		       Becoming more resilient
                              43		       Box: Q&A with a city leader—Lord Bernard Hogan-Howe, former
                                         commissioner, London Metropolitan Police
                              45		 Conclusion
                              47		 Appendix

© The Economist Intelligence Unit Limited 2019
Safe Cities Index 2019
                                                                                                                                              7
                                                                Urban security and resilience in an interconnected world

                                Introduction: Why urban safety
                                matters to us all
                                A disorderly transition toward ever-greater urbanity
                                Humanity is a predominantly urban species, having become so a little
                                over a decade ago according to UN Population Division data. And it is
                                becoming even more so: the 56% of the world’s population who live in
                                cities today will rise to 68% by 2050.1

                                More than simply where most humans live, cities are where we do
                                business, producing an outsized proportion of economic output
                                because of a greater efficiency than rural areas. New Climate Initiative,
                                a think-tank, estimated that in 2015 urban areas in total created 85% of
                                the world’s GDP while generating only 71% to 76% of greenhouse gas
                                emissions.2 Accordingly, the success or failure of cities will define the
                                quality of human life in the years ahead.

                                This may seem like old news: urbanisation has been occurring for many
                                decades, and for centuries in some regions. Familiarity with the long-
                                term narrative, however, should not obscure the current challenge’s
                                novelty. First, as Adie Tomer, who leads the Metropolitan Infrastructure
                                Initiative at the Brookings Institution, a think-tank, notes, “We have
                                never seen cities on this scale in human history. Managing populations of
                                15-plus million is something new.”

                                UN data back him up. As late as 2005, only Tokyo had more than 20m
                                residents. Today, nine cities do, and by 2030 that number should have
                                reached 14. Beyond the megacities, the challenge is even more daunting:
                                today’s 30 largest cities are expected to add 45m residents between 2020
                                and 2025, but those sized from 1-5m, because of their greater number,
                                will have aggregate population growth of nearly 100m. Gino Van Begin,
                                secretary-general of ICLEI, Local Governments for Sustainability, a
                                local-government network, observes those “citizens will all need energy,
                                water, jobs, education, food, mobility, housing [and other essentials].”

                                Overall, numbers tell only part of the story. Urbanisation is as uneven
                                and disorderly as it is substantial.

                                On the one hand, the population shift toward cities is largely complete
                                in developed countries: all of Australasia, Northern and Western Europe,
                                the US and Canada, for example, are already more than 80% urban. More

1
   ata on urban populations of regions and populations for specific cities are, unless otherwise indicated, from United Nations Population Division,
  D
  World Urbanisation Prospects, 2018 or Economist Intelligence Unit calculation based on those data.
2
  Seizing the Opportunity, 2015.

                                                                                                             © The Economist Intelligence Unit Limited 2019
Safe Cities Index 2019
8
Urban security and resilience in an interconnected world
generally in wealthier states, over the next ten China (1.4% per year), India (1.4%), and Sub-
years the urban proportion of the population Saharan Africa (1.2%). In absolute terms, the
will stay largely flat, typically rising by 1-2% change will be particularly visible in the first
across that entire period. In some Japanese of these, as its percentage growth starts from
cities, such as Tokyo and Osaka, little inward a bigger numerical base: already more than
migration combined with low birth rates will half of China’s population live in cities. In that
mean a decrease in the total population. Amid country alone, during the next ten years, urban
the relative safety and order of such places, it is populations in aggregate will expand by 143m
easy to look with equanimity on people, or roughly 13%.
the world’s ongoing urbanisation.
If anything, the best demographic estimates
The challenges are far more pressing may be having trouble keeping up with the
elsewhere. The urbanisation of the early 21st speed of urbanisation. In 2014 and 2018 the
century is a phenomenon of the developing UN Population Division projected the likely
world, which already has 25 of the world’s 30 increase in the number of urban residents
largest cities. In particular, the speed of growth between 2020 and 2030. During that four-year
within the increasing number of emerging period, demographers increased their earlier
mega-cities is historically rapid, in some cases estimates for China, India and Sub-Saharan
unprecedented. Thomas Bollyky, senior fellow Africa by 10% to 15%.
for Global Health at the US Council on Foreign
For specific cities, this will mean the already
Relations, notes that during their respective
very large challenges are now expected to be
fastest decades of growth, London saw an
even bigger. New Delhi city planners in 2014, for
increase of just under 100,000 residents per
year and New York City 220,000. By contrast, example, could expect to need to address the
requirements of 6.7m more residents between
he says, over the past ten years Dhaka grew
2020 and 2030. Now, the likeliest figure is 8.7m.
by roughly 450,000 people annually and New
Delhi by 620,000.3 Those arriving to join the burgeoning
populations of developing world cities
Going beyond the largest cities, over the
frequently find conditions far from easy.
next decade the countries and regions with
As Siddharth Agarwal, director of the Urban
the fastest annual relative rise in the urban
Health Resource Centre, an Indian non-
proportion of the population will include
Figure 1
Growth in number of urban Growth in number of urban
residents 2020-30 (2014 residents 2020-30 (2018
estimate, in thousands) estimate, in thousands)
China 124,498 142,771
India 112,312 124,243
Sub-Saharan Africa 185,942 207,495
3
See also, Thomas Bollyky, Plagues and the Paradox of Progress: Why the World is Getting Healthier in Worrisome Ways, 2018.
© The Economist Intelligence Unit Limited 2019Safe Cities Index 2019
9
Urban security and resilience in an interconnected world
government organisation (NGO), points out, urbanisation was something evil. Now it is seen
“in the most rapidly growing cities, the urban as one of the key ingredients which can help
disadvantaged, most of whom provide low- the African continent leapfrog economically.”
cost services, represent the fastest expanding He adds that even amid the obvious, ongoing
segment of the population. Without these low- need large numbers of city dwellers still have
wage workers, living behind urban glamour, for basic services, progress is obvious. “Every
the city’s sheen, infrastructure and services day, the situation is improving. Urbanisation is
cannot grow.” All too often, these individuals spurring development,” he adds. Looking more
lead precarious lives. In China, for example, globally, Mr Bollyky sees similar possibilities.
240m people, or more than one in six of the “Urbanisation is a positive thing,” he says.
total population, live in cities outside of their “No country has become wealthy without
legal province of registration.4 This “floating urbanising first. There are challenges to be
population”, lacking a right even to stay where addressed, but urbanisation itself should not
they are—let alone access to various healthcare be regretted.”
and other local assistance schemes—typically
This is not simply whistling in the dark: even
live with poor employment, social and housing
the unprecedented speed of growth in today’s
conditions.5 They also make up many of the
developing world megacities in itself is a sign
quarter of China’s urban population who live
of hope. The expansion of urban populations
in informal settlements. Outside of China,
in 19th century Europe and the US came
the proportion in slums can be higher still: in
largely from inward migration, as death rates
New Delhi for example, the world’s second
limited the natural increase of city populations
largest city, 49% of residents are in informal
through birth. Today, despite the substantial
settlements, and in Lagos it is over half.
number of new arrivals to urban areas across
It is, however, too easy to see urbanisation the developing world, most urban population
as a looming disaster inflicting widespread growth comes from babies being born in these
neo-Dickensian squalor on much of humanity. cities and surviving.6
Certainly, the unstructured, accelerating
Urbanisation has already shaped the developed
growth of developing world cities raises the
world and is redefining developing countries. It
spectre of vast challenges that, if unmet,
can be a blessing, a curse, or both in individual
could bring substantial human misery.
locations and for human beings as a whole. Its
Simultaneously, though, it holds out the
prospect of a much more hopeful future. effect depends on how well urban governments
Experts interviewed for this study stress the and residents manage the challenges, both
importance of the latter. Alioune Badiane— those common to all cities and specific to
president of The Urban Think Tank Africa particular locations. This study looks at perhaps
(TUTTA) based in Senegal—explains regarding the most fundamental element of urban
his region that “some years ago, people thought management: the ability to provide safety.
4
“Floating Population,” Table 2-3, China Statistical Yearbook, 2018.
5
Zai Liang et al, “Changing Patterns of the Floating Population in China during 2000-2010,” Population Development Review, 2014.
6
Remi Jedwab et al., “Demography, Urbanization and Development: Rural Push, Urban Pull and...Urban Push?” World Bank Policy Research Working Papers,
No. 7333, 2015.
© The Economist Intelligence Unit Limited 2019Safe Cities Index 2019
10
Urban security and resilience in an interconnected world
The many faces of security
The Economist Intelligence Unit’s some of which in turn aggregate multiple data
Safe Cities Index 2019 points. The environmental policy indicator,
for example, looks at: whether or not a
Given urban security’s importance, The
municipal environment department exists
Economist Intelligence Unit, sponsored by NEC
and, if so, the extent of its remit; whether the
Corporation, maintains a regularly updated
city has recently conducted an environmental
index to assess the relevant strengths and
review and, if so, the breadth of its coverage;
weaknesses of leading cities worldwide. This
and how publicly accessible environmental
publication accompanies the release of the
information is. The indicators also balance
SCI2019, its third edition, which covers 60 major
breadth and detail, covering areas as far apart
urban areas.
as perceptions of corruption and the extent of
But, for a city, what does “safe” mean? Rules internet access.
of thumb can provide a useful starting point
The indicators fall into four broad categories,
in framing an answer. Mr Badiane notes that
or pillars: personal, infrastructure, health and
“in any city where you can often see a woman
digital security. Within each pillar, the relevant
walking alone at night, you can bet that is a
indicators are grouped into inputs of safety,
safe city.” On one level, this statement seems
such as policies or personnel dedicated to
a simple one about personal security, in
some aspect of security, and outcomes,
particular a low likelihood of violent attack.
which is anything from air pollution levels to
Looking deeper, though, quickly brings up more
crime rates.7
issues. Walking alone at night also requires
infrastructure, including places to walk where Put simplistically, outputs measure how safe a
one is unlikely to be hit by vehicles and lighting city currently is, while the inputs indicate which
that not only deters violence but also lets our cities are doing the right things to enhance
pedestrian see where she is going. Similarly, safety. Both are essential to understanding the
unhealthy levels of air pollution or a lack of security situation. Not only will policy likely
public health education, which mean fewer enhance safety-related outcomes in the future,
people see the value of walking, could take our but they may also be essential to preserving
notional pedestrian off the street. Finally, Mr them in the present. As Victor Lam, Hong
Badiane’s scene would seem far less safe were Kong’s government chief information officer,
the contactless debit cards in our pedestrian’s says of digital security, “we say we are well
purse charged by someone with a hidden RFC protected, but who knows? There are bound to
reader walking in the other direction. be incidents. There are attacks every day. We
have to be ready to respond very quickly.” Not
Safety then, even when it appears simple, is
surprisingly, the overall input and output scores
multifaceted. Accordingly, our index scores
correlate closely.
draw on 57 distinct factors, or indicators,
7
F or details of the scoring of the indicators and pillars, as well as, in particular, some important caveats describing the limitations of how these data are
used, please see the Appendix at the end of this study.
© The Economist Intelligence Unit Limited 2019Safe Cities Index 2019
11
Urban security and resilience in an interconnected world
SCI2019 pillars and indicators
Digital security • Access to safe and quality food
Inputs • Quality of health services
• Privacy policy
Outputs
• Citizen awareness of digital threats
• Air quality (PM 2.5 levels)
• Public-private partnerships
• Water quality
• Level of technology employed
• Life expectancy years
• Dedicated cyber-security teams
• Infant mortality
Outputs • Cancer mortality rate
• Risk of local malware threats • No. of biological, chemical, radiological
• Percentage of computers infected weapons attacks
• Percentage with internet access • Emergency services in the city
Infrastructure security Personal security
Inputs Inputs
• Enforcement of transport safety • Level of police engagement
• Pedestrian friendliness • Community-based patrolling
• Disaster management/business continuity plan • Available street-level crime data
• Use of data-driven techniques for crime
Outputs • Private security measures
• Deaths from natural disasters • Gun regulation and enforcement
• Road traffic deaths • Political stability risk
• Percentage living in slums • Effectiveness of the criminal justice system
• Number of attacks on facilities/infrastructure • Hazard monitoring
• Institutional capacity and access to resources
• Catastrophe insurance Outputs
• Disaster-risk informed development • Prevalence of petty crime
• Air transport facilities • Prevalence of violent crime
• Road network • Organised crime
• Power network • Level of corruption
• Rail network • Rate of drug use
• Cyber-security preparedness • Frequency of terrorist attacks
• Severity of terrorist attacks
Health security • Gender safety (female homicide)
Inputs • Perceptions of safety
• Environmental policies • Threat of terrorism
• Access to healthcare • Threat of military conflict
• No. of beds per 1,000 population • Threat of civil unrest
• No. of doctors per 1,000 population
© The Economist Intelligence Unit Limited 2019Safe Cities Index 2019
12
Urban security and resilience in an interconnected world
100
Fitted Actual
80
60
40
20
0
0 20 40 60 80 100
The rise of resilience and Until recently, says Ede Ijjasz-Vasquez, senior
enhancements to this year’s index director of the World Bank’s Social, Urban,
Rural and Resilience Global Practice, shocks
Any index that measures over time needs
to a city “have been seen from a sectoral
to evolve along with the field it covers. The
perspective: health emergencies have been
conventional wisdom among those involved
dealt with by the health services; floods by
in urban safety increasingly holds that not
drainage departments; refugees by housing
only do a wide variety of factors matter in this
departments.” Now, though, many cities
field, but so too does their interaction. “A city
are moving toward planning based around
is composed of urban systems,” says Esteban
“resilience”—a concept that moves away from
Leon, chief of the risk reduction unit and head
purely after-the-fact response to include
of the city resilience profiling programme at
system-wide preparedness and risk reduction
UN-Habitat. This understanding of a city is
as well. Mr Leon adds that “the evolution in
reshaping how an increasing number of urban
thinking toward resilience has been quite
governments approach low-frequency, high-
steep in the last few years. Before we would
risk events, whether involving acute disasters
analyse disasters and challenges, but not from
or longer-term threats, notably climate change
the perspective of urban systems.” He uses the
and chronic social stresses.
analogy of the city as a healthy body. Any given
© The Economist Intelligence Unit Limited 2019Safe Cities Index 2019
13
Urban security and resilience in an interconnected world
system might be able, or need, to contribute is certainly “an emergent trend, but not
in a different way to facing a diverse range of something ingrained” in urban governance.
negative events.
Although discussions of resilience tend to focus
A lack of agreement on precisely what on preparedness for disaster, the benefits
resilience means reflects its novelty as a are far wider: a resilient city has the ability to
working model. A recent literature review perform when the world is watching. Yuriko
found that some use the term to emphasise Koike, governor of Tokyo, explains that, as her
how well a city responds after a disaster, city welcomes the Rugby World Cup 2019™
while others stress how well it absorbs shocks. and the Olympic and Paralympic Games Tokyo
Similarly, some argue that the goal after 2020, resilience matters not only for how it
a shock should be to restore the situation enhances security but also for the improved
preceding the event as quickly as possible and ability it gives the city to address the challenges
others to use the opportunity for improvement the many visiting fans and athletes might face
over the preceding status quo.8 should a heatwave occur.
Although these distinctions have some policy Previous editions of the SCI have included
implications, in practice the basic concept indicators relevant to the danger of natural
is clear. As Mr Ijjasz-Vasquez says of the and man-made shocks. In order to advance
World Bank, “we are beginning to define thinking on resilience, we have bolstered the
urban resilience as the ability of households, number of indicators that deal with different
communities and cities to bounce back.” This, aspects of it. The 2019 index measures for the
says Mr Leon, is “completely complementary to first time things like the existence and speed
urban security.” of city emergency services; the existence of a
disaster plan; the institutional capacity of those
Nevertheless, Elizabeth Johnston, executive tasked with disaster response; the availability
director of both the European and French of disaster insurance; the ability to defend
Forums for Urban Security, believes that infrastructure against cyber-attacks; and the
resilience is still not as integrated as it could extent of hazard monitoring.
be in urban safety considerations. There
remains, she says, “a huge divide between Although they come from different pillars, for
planning for natural and man-made disasters. analysis later in this study, the resilience-related
Cities have policies that are developed on indicators have been recombined into three
the preparedness for the latter but not new categories:
necessarily on climate change or, if they do
• Damage and threat multipliers: damage
have such policies, they are not co-ordinated.
experienced from shocks—specifically
Only recently has terrorist preparedness
natural disasters and terrorism—as well
started to include natural disasters and vice
as city attributes that can exacerbate the
versa.” She adds that looking at these issues
severity of shocks.
together within the context of overall resilience
8
Adriana Sanchez et al. “The city politics of an urban age: urban resilience conceptualisations and policies,” Palgrave Communications,
© The Economist Intelligence Unit Limited 2019Safe Cities Index 2019
14
Urban security and resilience in an interconnected world
• Relevant assets: the quality and extent monitoring with an eye to preventing,
of general assets that are useful in the minimising or preparing for shocks.
event of a shock, such as different kinds The accompanying chart lists which indicators
of infrastructure, healthcare, emergency have been included, as well as showing the new
services and cyber-security awareness. indicators for 2019 that have been brought in
• Preparation: specific planning and specifically to understand resilience better.
SCI2019 resilience categories
Damage and multipliers • Quality of health services
• Percentage of computers infected • Emergency services in the city*
• No. of biological, chemical, radiological • Air transport facilities*
weapons attacks • Road network
• Deaths from natural disaster • Power network
• Percentage living in slums • Rail network*
• Number of attacks on facilities/infrastructure • Community-based patrolling
• Frequency of terrorist attacks
Preparedness
• Severity of terrorist attacks
• Environmental policies
• Threat of terrorism
• Disaster management/business continuity plan
• Threat of military conflict
• Institutional capacity and access to resources*
• Threat of civil unrest
• Catastrophe insurance*
Relevant assets • Disaster-risk informed development*
• Citizen awareness of digital threats • Cyber-security preparedness*
• Public-private partnerships • Hazard monitoring*
• Dedicated cyber-security teams
• Access to healthcare *New indicator for 2019.
© The Economist Intelligence Unit Limited 2019Safe Cities Index 2019
15
Urban security and resilience in an interconnected world
Insights from the index
The SCI2019 results
The complete scores are as follows:
1 Tokyo 92.0 1 Tokyo 94.4 1 Osaka 88.5 1 Singapore 96.9 1 Singapore 95.3
1 1Tokyo 2 Singapore
92.0 1 91.5
Tokyo 2 Singapore
94.4 93.1
1 Osaka 12Osaka Tokyo 88.5 87.5 1 Singapore 2 Osaka 96.9 94.5 2 Copenhagen
1 Singapore 93.6
Tokyo 3 Osaka92.0 1 Tokyo 3 Chicago
90.9 94.4 92.9 3 Seoul 85.2 88.5 3 Barcelona1 Singapore 94.4 96.9 Kong
3 Hong 95.31 95.3
Singapore
91.9
2 Singapore 91.5 2 Singapore 93.1 2 Tokyo 87.5 2 Osaka 94.5 2 Copenhagen 93.6
2 Singapore
3 Osaka 90.9
91.5
4 Amsterdam
3
2
88.0
Chicago
Singapore4 Washington, DC93.1 92.2
92.9 3 Seoul
2
=4 Tokyo
Amsterdam
85.2
81.6 87.5 4 Tokyo 2 Osaka
3 Barcelona 94.4
94.3 94.5
4 Tokyo
3 Hong Kong
93.62 Copenhagen
91.7
91.9
5 Sydney 87.9 =5 Los Angeles 92.9 91.4 =4 Stockholm 81.6 85.2 5 Madrid3 Barcelona 94.2 5 Wellington 91.5
43Amsterdam
Osaka 88.090.9
6 Toronto 4 3 Chicago
Washington,
87.8 DC 92.2
=5 San Francisco =491.4
Amsterdam 3 Seoul
6 Frankfurt 81.6 81.2 4 Tokyo6 Frankfurt 94.3 93.7 4 Tokyo94.4
6 Stockholm
91.93 91.7
Hong
91.3
Kong
4 Amsterdam
5 Sydney 87.9 88.0
7 Washington, =5
DC 4Angeles
Los87.6 Washington,
7 DallasDC
91.4 92.2=491.3Stockholm
=4 7Amsterdam
Washington, 81.6
DC 81.1 581.6
Madrid
=7 Melbourne 4 Tokyo 94.2 93.5 94.3
5 Wellington
7 Osaka 91.74 91.5
Tokyo
91.1
65Toronto
Sydney 87.8 87.9 =5
=8 Copenhagen San=5 Los Angeles
Francisco
87.4 91.4
8 New York 91.4 691.1Frankfurt
=48Stockholm
Singapore 81.2 80.9 681.6 =7 Sydney5 Madrid 93.7 93.5
Frankfurt 94.2
6 Stockholm
8 Toronto 91.55 91.3
Wellington
90.8
76Washington,
Toronto DC =8 Seoul
87.6 87.8 7 87.4 San Francisco
=5
Dallas 9 Toronto
91.3 91.4 90.6
7 Washington, 69Frankfurt
Zurich
DC 81.1 80.8=781.2 9 Wellington
Melbourne 6 Frankfurt93.5 93.2 9 Amsterdam
7 Osaka93.7 91.36 89.4
Stockholm
91.1
Washington, DC10
=87Copenhagen Melbourne
87.4 87.6
11 Chicago
8 New87.3York
7
86.7
Dallas 10 London 91.1
=11 Melbourne
91.3 90.2
8 Singapore710Washington,
89.4
Taipei 80.9 DC 80.2=781.1 Sydney10 Washington, DC
=7 Melbourne93.5 93.1 10 Sydney
8 Toronto
93.5 89.1
90.8
7 88.9
91.1 Osaka
=8 Seoul
=8 Copenhagen 12 Stockholm 87.4 87.4 9 Toronto
8 New York 90.6 9 Zurich =11
91.1 89.4
Copenhagen
8 Singapore 80.8 79.8 9 Wellington
11 Chicago 93.2 93.0 11 Abu Dhabi
9 Amsterdam 89.4
86.5 =11 Osaka =11 Sydney 79.8 80.9 =12 New =7 YorkSydney 92.5 93.5
12 Dubai 90.88 88.6
Toronto
10 Melbourne 87.3 10 London 90.2 10 Taipei 80.2 10 Washington, DC 93.1 10 Sydney 89.1
=8 Seoul 87.4
13 San Francisco 9 Toronto
85.9 =11 Sydney 90.6 89.4 9 Zurich
=13 Brussels 79.3 80.8 =12 Toronto9 Wellington 92.5 93.2
13 Zurich 89.49 87.8
Amsterdam
11 Chicago 86.7
14 London =11 Melbourne
85.7 89.4 =11 Copenhagen 79.8 11 Chicago 93.0 11 Abu Dhabi 88.9
10 Melbourne
12 Stockholm 87.3
86.5 York =11 10 London14 Amsterdam
Osaka 89.4 90.2 89.0
=1187.3
=13 Melbourne
Sydney 1015Taipei 79.8
79.3 80.2 14 Seoul 10 Washington,92.4
=12 New York DC
92.5 92.2
14 Frankfurt
12 Dubai 93.1 87.7
1088.6
89.1 Sydney
15 New 85.5 15 Copenhagen Paris 78.7 15 Los Angeles 15 Seoul 87.5
1311San
Chicago
Francisco 85.9 86.7 =11
16 Frankfurt =11
85.4 Melbourne
Sydney 89.4
16 Stockholm 89.4
=1385.5
Brussels=1116Copenhagen
London 79.3 =1279.8
78.0 Toronto 11 Chicago 92.5 92.0
16 Amsterdam 13 Zurich93.0
16 Melbourne 11 87.8
88.9 Abu Dhabi
86.8
12 Stockholm
14 London 86.5
85.7Angeles
17 Los 14 =11
85.2 Osaka 17 Seoul89.0
Amsterdam 89.4
=1384.7 =1117Sydney
Melbourne Toronto 79.3 77.41479.8
Seoul17 San=12 New York
Francisco 92.4 91.7 92.5
14 Frankfurt
17 Brussels 12 87.7
88.6 Dubai
86.3
1513New
SanYork
Francisco=18 Wellington
85.5 85.9 15 =11
84.5 Sydney18 Zurich87.3
Copenhagen 89.41580.8Paris =1318Brussels
San Francisco
78.7 77.21579.3 18 Hong
Los Angeles =12KongToronto 92.2 91.1 92.5
18 Madrid
15 Seoul 13 87.5
87.8 Zurich
86.2
=18 Zurich 84.5 19 Wellington 80.2 19 Chicago 78.0 77.116 Amsterdam
19 London
1614Frankfurt
London 85.4 85.7
20 Hong Kong
16 Stockholm
14 Amsterdam
83.7 20 Paris
85.5 16
89.0 80.0London =13 Melbourne
=20 Madrid 76.1
79.3 20 Copenhagen 14 Seoul 92.0 90.4 19 Barcelona
16 Melbourne
92.4 87.7 86.0
1486.8
Frankfurt
1715Los Angeles
New York 85.2 17 Seoul 84.7 87.31778.9Toronto=20 77.4 17 San Francisco 91.7 89.0 20 Taipei
17 Brussels 85.8
15 86.3
21 Dallas85.5 15 Copenhagen
83.1 21 Frankfurt 15 Paris
New York 76.1 78.7 21 Brussels 15 Los Angeles 88.9 92.2
21 Paris 87.5 Seoul
85.2
=18 Wellington 84.5 18 Zurich 80.8
16 Frankfurt 22 Taipei85.4 16 Stockholm
82.5 22 Hong Kong 85.51878.8San Francisco
1622London
Dallas
77.2 18 Hong Kong
75.9 78.0 22 Zurich16 Amsterdam 88.5
91.1 18 Madrid
92.0
22 London
86.2
16 84.3
86.8 Melbourne
=18 Zurich 84.5 19 Wellington 80.2 19 Chicago 77.1 19 London 90.4 19=23
Barcelona 86.0
17 Los Angeles 23 Paris
20 Hong Kong 83.7
85.2 20 82.4
17 Seoul 23 Taipei80.0
Paris
84.7 77.0
=2074.1
1723Toronto
Los Angeles
Madrid 24 Barcelona 76.1
75.8 77.4 23 Stockholm 17 San Francisco 87.5 Shanghai
91.7 84.0
17 85.8
86.3 Brussels
24 Brussels 82.1 =24 Abu Dhabi 75.220 Copenhagen
24 Taipei 89.0 87.1 20=23
Taipei
Washington, DC 84.0
=18 Wellington
21 Dallas 83.1
25 Madrid 84.5 21 18 Zurich
Frankfurt
81.4 =24 Dubai78.9 80.8
=2074.1New York 1825San
Rome Francisco
76.1 75.12177.2 25 Paris 18 Hong Kong
Brussels 88.9 85.9 21 Paris 91.1
25 Beijing 18 85.2
86.2 Madrid
83.9
=18 Zurich
22 Taipei 82.5 84.5
26 Barcelona 22 Hong19 Kong
81.2 Wellington 78.8
26 Brussels 80.22274.0Dallas 1926Chicago
Milan 75.9 74.92277.1
Zurich
=26 Abu Dhabi19 London 88.5 83.2 22 London90.4
26 Chicago 19 84.3
86.0 Barcelona
83.8
20 Hong
23 Paris Kong 27 Abu
82.4 83.7
Dhabi 23 20 Paris 27 Milan77.0
79.5
Taipei 80.02372.5Los Angeles
=2027Madrid
Hong Kong75.8 73.22376.1 =26 Dubai20 Copenhagen
Stockholm 87.5 83.2 =23=27 89.0
Dallas
Shanghai 20 84.0
85.8 Taipei
83.3
28 Dubai 79.1Dhabi =28 Barcelona
2421Brussels
Dallas 82.1 83.1 =24
29 Milan
Abu 21 Frankfurt
78.1 =28 Madrid
74.1 78.92469.2
69.2
=2028
Barcelona Wellington75.2
New York
29 Abu Dhabi
72.924 Taipei28 Rome
71.8
76.1 29 Milan 21 Brussels 87.1 82.8 83.1 =23=27 San Francisco
Washington,
88.9
29 Milan
DC 21 84.0
85.2 83.3
Paris
82.4
25 Madrid
22 Taipei 81.4 =24 Dubai 74.1 78.82567.5Rome 2230Dallas 75.1 25 Paris 85.9 25 Beijing 22 83.9
30 Rome82.5 22 Hong Kong
76.4 30 Rome Moscow 71.5 75.9 30 Dallas22 Zurich 81.9 88.5York
30 New 84.3 London
82.2
2623Barcelona
Paris 81.2 82.4
Average 26 Brussels
23 Taipei Average
71.2 74.0 77.02667.2Milan 2331Los DubaiAngeles74.9 =2675.8
70.5 Abu Dhabi 23 Stockholm
31 Istanbul 83.2 75.8 26 Chicago
87.5 Lumpur =23 81.8
31 Kuala 84.0 83.8
Shanghai
27 Abu Dhabi 79.5
31 Beijing 27 Milan
70.5 Abu Dhabi
31 Buenos72.5
Aires 74.127 Hong Kong
65.0 73.2 =26 Dubai32 Moscow 83.2 73.6 =27 Dallas Angeles =23 83.3
24 Brussels 82.1 =24 2432Barcelona
Buenos Aires 69.8 75.2 24 Taipei 32 Los
87.1 84.0 81.3
Washington, DC
28 Dubai 79.1
32 Shanghai =28 Barcelona
70.2 69.2
32 Santiago 28 Wellington
64.6 33 Beijing 72.9 68.028 Rome Average 83.1 72.5 =27 San Francisco
33 Kuwait City 83.3
80.4
25 Madrid
29 Milan 78.1 81.4
33 Santiago =28 =24
Madrid
69.8 Dubai 69.2
33 Istanbul 74.1
2961.9 25 Rome
Abu Dhabi Average 71.8 75.1
68.029 Milan33 Beijing 25 Paris 82.8 72.1 29 Milan 85.9
34 Rome 25
83.9 Beijing
82.4
79.8
3026Rome
Barcelona 76.4 81.2
34 Buenos Aires 30 Rome26
69.7 Brussels34 Johannesburg
67.5 74.0 60.2
30 Moscow 26 34Milan
Shanghai 71.5 67.5 74.9
30 Dallas 34 =26
Shanghai Abu Dhabi
81.9 72.0 83.2
35 Santiago
30 New York 26 82.2
83.8 Chicago
79.4
27Average
Abu Dhabi 35 Kuala
71.2 79.5
Lumpur 27 Milan 35 Mexico
66.3
Average City
67.2 72.53158.4Dubai 2735HongKuwaitKong
City70.5 64.83173.2 =26Aires
35 Buenos
Istanbul Dubai 75.8 71.2 36 Ho
31 Kuala 83.2
Chi Minh City
Lumpur =27 81.8
83.3 Dallas
78.7
36 Istanbul 66.1 Aires 36 Beijing
28Beijing
31 Dubai 70.5 79.1 31 =28
Buenos Barcelona 65.0 69.23258.1Buenos 28
=36 Rio de Janeiro
Wellington
Aires 69.8 64.732 Moscow
72.9 36 Santiago 28 Rome 73.6 71.0 32 LosAverage
83.1
Angeles 77.0
=27 81.3
83.3 San Francisco
37 Moscow 65.8 37 Shanghai 57.4 =36 Sao Paulo 64.7 37 Kuala Lumpur 64.7 37 Mumbai 76.2
32 Shanghai
29 Milan 70.2 City 32
38 Kuwait78.1
Santiago
=28
64.5 Madrid38 Riyadh
64.6 69.23356.5Beijing 29
=38AbuKualaDhabi
68.0
Lumpur
Average
64.4 71.8 38 Mexico Milan 72.5 61.5
29City 33 Kuwait82.8City
38 Riyadh 2980.4
82.4 Milan
75.9
3330Santiago
Rome 69.8 76.4
39 Riyadh 33 Istanbul 61.9
30 Rome 39 Kuwait City 67.5 56.4
62.5 Average 30
=38Moscow
Santiago 68.0 33 Beijing
64.4 71.5 39 Johannesburg30 Dallas 72.1 57.8 34 Rome 81.9
39 Moscow 30 79.8
82.2 New York
75.3
34 Buenos Aires 69.7 City 34 Johannesburg 60.2
Average 40 Mexico 71.2 61.6 Average 40 Bangkok 67.23456.2Shanghai3140Dubai
Mexico City67.5 64.13470.5
Shanghai
40 Rio de31 Istanbul 72.0 57.7
Janeiro 35 Santiago
40 Manila
75.8 79.4
74.7
31 Kuala Lumpur
81.8
35 Kuala Lumpur 66.3de Janeiro 35
41 Rio Mexico
60.9 City 41 Bogota 58.4 3554.7
Kuwait City 41 Baku 64.8 64.035 Buenos Aires
41 Sao Paulo 71.2 57.2 36 Ho Chi Minh
41 New Delhi City 78.7
73.6
3631Istanbul
Beijing 70.5 36
66.1Paulo
42 Sao 31 Buenos42Aires
Beijing
59.7 Quito58.1 65.0
=3654.5 3242Buenos
Rio de Janeiro Riyadh Aires
64.7 62.936 69.8 42 Kuwait32City
Santiago Moscow 71.0 56.4 73.6 Aires 3277.0
Average
42 Buenos 81.3 Los Angeles
72.9
32 Shanghai
37 Moscow 43 65.8 70.2
Manila 37 32 Santiago
59.2
Shanghai Lumpur 64.6
43 Kuala57.4 =3654.4Sao Paulo3343Beijing
Istanbul 64.7 61.73768.0
Kuala43Lumpur
Ho Chi MinhAverage
City 64.7 55.4 43 72.5
Jakarta
37 Mumbai 33
80.4 Kuwait
71.7
76.2 City
3833Kuwait
SantiagoCity 64.569.8
44 Johannesburg 38 33 Istanbul
58.6
Riyadh Janeiro 61.9
44 Rio de56.5 =3852.7Kuala Lumpur44Average
Lima 64.4 60.73868.0
Mexico Riyadh33 Beijing 61.5 54.8
44 City 72.1
44 Casablanca
38 Riyadh 34 75.9
79.8 Rome
69.5
39 Buenos Aires =45 Lima
34Riyadh 62.5 69.7 39 58.2
City 45 Manila56.4
34 Johannesburg
Kuwait =3852.1
60.2 Santiago3445Shanghai
Bangkok
64.4 59.9
3967.5 45 Bogota
Johannesburg 34 Shanghai57.8 53.9 45 Lima
39 Moscow72.0 69.3
35 75.3
79.4 Santiago
=45 Mumbai 58.2 46 Baku 51.7 46 Quito 59.4 46 Manila 53.6 46 Rio de Janeiro 68.4
4035Mexico
KualaCity 61.6 66.3
Lumpur=47 Bangkok 40 Bangkok
35 Mexico
57.6 =47City
Mumbai
56.2 58.44051.0Mexico City
3547Kuwait
Bogota City
64.1 40 Rio de Janeiro
59.1 64.8 47 Lima 35 Buenos Aires53.0
57.7 40 Manila
47 Sao71.2Paulo 36 74.7
78.7 Ho Chi Minh City
67.5
41 Rio de
36 Istanbul Janeiro 60.9Chi66.1
=47 Ho 41
Minh City Bogota
36 Beijing
57.6 54.7
=47 New Delhi 41 Baku
58.1 51.0 =3648Rio 64.0 41 Sao
de Janeiro 56.6 64.7 48 Bangkok
Manila Paulo 36 Santiago 57.2 52.5 41 New Delhi
71.0
48 Istanbul 77.0 73.6
Average
65.2
4237Sao Paulo
Moscow 59.7 65.8
49 Baku 42 Quito
56.4
37 Shanghai 49 Lima 54.5 57.44249.8Riyadh=3649SaoHo Chi 62.9
Minh
Paulo City 56.34264.7
Kuwait49 City 56.4 52.3
Jakarta37 Kuala Lumpur 42 Buenos64.7Aires
49 Baku 37 72.9
76.2 63.7
Mumbai
43 Manila 59.2
50 Quito 43 Kuala
55.3 Lumpur50 Sao Paulo
54.4 43 Istanbul 50 Mumbai 61.7
49.4 55.843 Ho Chi 50 Minh
Mumbai City 55.4 50.0 43 Jakarta
50 Johannesburg 71.7
63.2
38 Kuwait City 51 Bogota 64.5 38 Riyadh51 Casablanca 56.5 44.9 =3851Kuala Lumpur 54.6 64.4 51 Quito38 Mexico City 49.9 61.5 38
75.9 Riyadh
44 Johannesburg 58.6 44 Rio55.1
de Janeiro 52.7 44 Lima New Delhi60.7 44 Riyadh 54.8 44 Casablanca
51 Mexico City 69.5
62.3
39
=45 LimaRiyadh 52 New
58.2 62.5
Delhi 45 39 Kuwait52City
55.0
Manila Karachi
52.1 56.44543.1Bangkok
=3852Santiago
Johannesburg
59.9 53.245 64.4
Bogota 39 Johannesburg
52 Casablanca 53.9 49.6 57.8
52 Bangkok
45 Lima 39 69.3
75.3 Moscow
61.8
=4540Mumbai
Mexico City 53 Jakarta58.2 61.6 46 40 Bangkok
54.5
Baku 53 Caracas51.7 56.24642.9Quito 4053Mexico
Jakarta City
59.4 51.74664.1
Manila53 Cairo40 Rio de Janeiro
53.6 48.2 57.7Janeiro
53 Cairo
46 Rio de 4068.4
74.7 Manila
59.3
Rio de Janeiro 54 Casablanca
=4741Bangkok 57.660.9 =47
53.5
41 Bogota54 Moscow
Mumbai 51.0 54.74742.8Bogota 4154Baku
Casablanca
59.1
50.0
4764.0
Lima
54 Baku
41 Sao Paulo 53.0
46.3 54 Quito
47 Sao 57.2
Paulo
57.5
41 67.5
73.6 New Delhi
55 Cairo 48.6 55 Jakarta 42.3 55 Caracas 48.1 55 Karachi 46.1 55 Dhaka 57.4
=4742Ho SaoChiPaulo 57.6 59.7 =47
Minh City 56 Dhaka New 42Delhi
44.6 Quito 56 Lagos51.0 54.54842.2Manila 4256Riyadh
Cairo 56.6 46.14862.9
Bangkok
56 Yangon 42 Kuwait City 52.5 45.3 56.4
48 Istanbul
56 Bogota 42 65.2
72.9 Buenos Aires
52.8
4943Baku
Manila 56.4 59.2
57 Karachi 49 Lima43
43.5 Kuala Lumpur
57 Dhaka 49.8 54.449 Ho
41.9 Chi Minh
43 City
Istanbul
57 Dhaka 56.3 45.149 Jakarta
61.7 43
57 New Delhi Ho Chi 52.3
Minh City
40.7 49 Baku 55.4
57 Yangon 43 63.7
71.7 Jakarta
52.3
50
44Quito
Johannesburg 58 Yangon 55.3 58.6 50 Sao44Paulo
41.9 Rio de 58 Cairo49.4
Janeiro 52.75040.7Mumbai4458LimaYangon 55.8 42.35060.7
Mumbai58 Lagos44 Riyadh 50.0 37.4 50 Johannesburg
58 Karachi
54.8 44 63.2
69.5 45.9
Casablanca
51 Bogota 55.1
59 Caracas 51 Casablanca
40.1 59 Ho Chi44.9
Minh City 51 New Delhi59 Karachi 54.6
40.2 39.051 Quito59 Dhaka 49.9 34.2 51 Mexico
59 Caracas City 62.3
42.1
=45 Lima 60 Lagos
58.2 45 Manila60 Yangon
38.1
52.1 27.8 4560Bangkok
Lagos
59.9 60 Caracas
34.152 Casablanca
45 Bogota 53.9 45 38.7
69.3 Lima
52 New Delhi 55.0 52 Karachi 43.1 52 Johannesburg 53.2 49.6 27.3 60 Lagos
52 Bangkok 61.8
=45 Mumbai
53 Jakarta 54.5 58.2 53 46
Caracas Baku 42.9 51.7
53 Jakarta 46 Quito 51.7 59.4
53 Cairo 46 Manila 48.2 53 Cairo 53.6 46
68.4 59.3 de Janeiro
Rio
=47 Bangkok
54 Casablanca 53.5 57.6 54 =47 Mumbai
Moscow 42.8 51.054 Casablanca 47 Bogota 50.0 5459.1
Baku 47 Lima 46.3 54 Quito 53.0 47 57.5
67.5 Sao Paulo
=47 Ho Chi Minh City 48.6 57.6 55
55 Cairo =47 New Delhi 42.3
Jakarta 51.055 Caracas48 Manila 48.1 5556.6
Karachi 48 Bangkok46.1 55 Dhaka 52.5 48 57.4
65.2 Istanbul
5649Dhaka
Baku 44.6 56.4 56 49 Lima
Lagos 42.2 49.856 Cairo 49 Ho Chi Minh 46.1 City 5656.3 Yangon 49 Jakarta 45.3 56 Bogota52.3 49 52.8
63.7 Baku
5750Karachi
Quito 43.5 55.3 57 Dhaka
50 Sao Paulo 41.9 49.457 Dhaka 50 Mumbai 45.1 5755.8
New Delhi 50 Mumbai40.7 57 Yangon50.0 50 52.3
63.2 Johannesburg
5851Yangon
Bogota 41.9 55.1 58 Cairo
51 Casablanca 40.7 44.958 Yangon 51 New Delhi 42.3 5854.6
Lagos 51 Quito 37.4 58 Karachi
49.9 51 45.9
62.3 Mexico City
59 Caracas 40.1
52 New Delhi 55.0 59 Ho Chi Minh City
52 Karachi 40.2
43.159 Karachi 52 Johannesburg 39.0 59 Dhaka
53.2 52 Casablanca 34.2 59 Caracas
49.6 52 42.1
61.8 Bangkok
60 Lagos 38.1 60 Yangon 27.8 60 Lagos 34.1 60 Caracas 27.3 60 Lagos 38.7
53 Jakarta 54.5 53 Caracas 42.9 53 Jakarta 51.7 53 Cairo 48.2 53 Cairo 59.3
54 Casablanca 53.5 54 Moscow 42.8 54 Casablanca 50.0 54 Baku 46.3 54 Quito 57.5
55 Cairo 48.6 55 Jakarta 42.3 55 Caracas 48.1 55 Karachi 46.1 55 Dhaka 57.4
56 Dhaka 44.6 56 Lagos 42.2 56 Cairo 46.1 56 Yangon 45.3 56 Bogota 52.8
57 Karachi 43.5 57 Dhaka 41.9 57 Dhaka 45.1 57 New Delhi 40.7 57 Yangon 52.3
58 Yangon 41.9 58 Cairo 40.7 58 Yangon 42.3 58 Lagos 37.4 58 Karachi 45.9
59 Caracas 40.1 59 Ho Chi Minh City 40.2 59 Karachi 39.0 59 Dhaka © The Economist
34.2 Intelligence Unit Limited 2019
59 Caracas 42.1
60 Lagos 38.1 60 Yangon 27.8 60 Lagos 34.1 60 Caracas 27.3 60 Lagos 38.7Safe Cities Index 2019
16
Urban security and resilience in an interconnected world
Four boxes across the following pages look on insights for cities from the overall picture—
more closely at the individual pillar results. The an area that has received less attention in
rest of the discussion in the main text focuses previous SCI reports.
Digital security Health security
The top five: The top five:
1. Tokyo 1. Osaka
2. Singapore 2. Tokyo
3. Chicago 3. Seoul
4. Washington, DC 4 = Amsterdam
5 = Los Angeles 4 = Stockholm
5 = San Francisco
What these leaders have in common: these
What these leaders have in common: all leaders get the basics right, scoring well—
get full marks on every digital security input including often getting full marks—for areas like
indicator. As a result, they have low levels of healthcare access and quality, safe food, water
infection by computer viruses and malware. and air, and speed of emergency services.
Where they differ: the only thing that sets Where they differ: a key difference is the much
these cities apart is the percentage of residents higher number of beds per head in the Asian
with internet access, which ranges from 76% in cities in this list compared with European ones.
Los Angeles and San Francisco to 91% in Tokyo. Given similarities in terms of healthcare access
and quality, this may reflect differing medical
Of interest: getting security right before
cultures rather than a fundamental weakness in
expanding access seems to be the best
Amsterdam or Stockholm.
approach. Kuwait City has the highest level
of internet access (98%), but weaknesses in Of interest: healthcare outcomes reflect the
privacy policy, citizen awareness of cyber- disease burden as much as quality of health
security, and dedicated cyber-security teams systems: four of these cities score around 70 out
help explain how between 20% and 30% of the of 100 for cancer mortality, and Amsterdam does
city’s computers are infected and its low score much worse. The top cities on this indicator,
on the presence of malware. those from Arab states, benefit from fewer cases
of cancer rather than a superior ability to deal
with those that arise.
© The Economist Intelligence Unit Limited 2019Safe Cities Index 2019
17
Urban security and resilience in an interconnected world
Infrastructure security Personal security
The top five: The top five:
1. Singapore 1. Singapore
2. Osaka 2. Copenhagen
3. Barcelona 3. Hong Kong
4. Tokyo 4. Tokyo
5. Madrid 5. Wellington
What these leaders have in common: Again, What these leaders have in common: They
good policy is essential to become a leader in this are strong on personal security inputs, with
pillar, with every one of the top five scoring full all scoring between 92 and 96 points out of
marks for their continuity management plans, 100. In particular, each gets full marks for the
pedestrian friendliness, institutional capacity policing-related indicators: level of engagement,
and disaster-risk informed development. community-based patrolling and use of data-
driven techniques.
Where they differ: Beyond first place
Singapore, the other cities have a mixed record Where they differ: those trying to reach the
on the quality of their infrastructure. Although top of this pillar face different challenges. For
none do poorly—the worst is Osaka’s 22nd place Hong Kong and Tokyo, corruption and organised
for its air travel links—each of these four lags crime are still a problem, although they are
behind leading peers in at least one area. typically better than in most other index cities.
For Wellington, the most visible weakness in the
Of interest: infrastructure is the area that sees
index is illegal drug use, for which it comes 56th.
the widest variations in scores—and therefore
the greatest possibility for improvement. Of interest: citizens don’t look at policies but
Singapore’s 96.9 points is the highest figure for at results. The index’s perceptions of safety
any city in an individual pillar and Caracas’ 27.3 score correlates closely with levels of violent
the lowest. and petty crime, but shows no statistical link to
input scores.
© The Economist Intelligence Unit Limited 2019Safe Cities Index 2019
18
Urban security and resilience in an interconnected world
At this overall level, the 2019 leader, for the infrastructure and personal safety). Mr Tomer
third time running, is Tokyo, with a broad array is not unusual in noting that “by many
of strengths. It ties for first place on indicators accounts, Tokyo is one of the world’s best
as diverse as low crime levels (both violent and run cities.” Governor Koike, adds that safety
petty), infrastructure designed to withstand has been a long-term, leading focus of the
natural shocks, and low risk of computer metropolitan government for many years, and
malware. Meanwhile, its lowest pillar score is that Tokyo has not finished its innovation in
still a very respectable fourth place (for both this area (see box).
© The Economist Intelligence Unit Limited 2019Safe Cities Index 2019
19
Urban security and resilience in an interconnected world
Q&A with a city leader—Yuriko Koike, governor, Tokyo
The Economist Intelligence Unit: Tokyo has come first in The One idea is that of “self-help, mutual help and public assistance.”
Economist Intelligence Unit’s Safe Cities Index in 2015, 2017 and The hope is that residents should take the initiative to help
now again in 2019. Why do you think Tokyo has been so successful? themselves when needed. And they should then work together to
help others. The administration should be there to provide backup.
Governor Koike: Given that earthquakes are endemic to Japan
and we are also witnessing major climate change around the In terms of self-help, we are promoting the use of rescue kits that
world, it is utterly critical that Tokyo protects residents and the residents can have on hand for emergencies, including spare
city from natural disasters. To do so, we have pursued a range water, rations, portable toilet equipment and the like for use in
of reforms, both on the infrastructure and the intangible side, flooding, earthquakes, or other disasters. Mutual help refers to
expending a large budget. Tokyo’s having received high acclaim as local residents practicing and training together and considering
a safe city results in part from the steady and consistent way we how to provide relief for, and by themselves in the event of an
have pushed forward these initiatives over the years. earthquake. Public assistance is what we in the administration
do, as discussed earlier, such as projects to reduce the impact of
The Economist Intelligence Unit: Where are some of the city’s
flooding, and to educate the public on disaster prevention.
largest current efforts around safety and resilience?
We recently developed something called Tokyo My Timeline. This
Governor Koike: Last year, we had heavy rains. Flooding and
functions as a kit and contains equipment to prepare for a flood.
water damage caused many incidents involving landslides and
This presents a timeline of response efforts to review: when flooding
the loss of human lives in Japan. Tokyo is surrounded by several
or sudden heavy rains occur, what to do, in what order. Children
rivers, so there are also infrastructural concerns to consider in
use stickers in this handbook to learn, as though playing a game,
such situations.
what the right response is. This kit is designed to help residents
We therefore created a vast underground reservoir. It is quite learn independently how a proper response should be carried out.
a cost-intensive project, but if you take into account the much Teaching this in schools is effective, because the children go home and
greater cost of flood damage—including loss of life and assets—as share what they learned with their family, which helps disseminate
well as the need to rebuild thereafter, taking preventive measures the information further. This is just one of several booklets we are
is ultimately more cost-effective. distributing to help people know what to do in the event of a disaster.
Another issue is the profusion of utility poles around Tokyo. We are This is just one of several booklets we are distributing to help
moving forward to bury these. The tangle of cables is not attractive, people know what to do in the event of a disaster.
and they can topple in earthquakes, impeding rescue vehicles. As
Beyond disaster response, each region in Tokyo has spent many
for infrastructure including buried objects like old water pipes, we
years developing fire departments both at the administrative level,
have to take various measures to replace them or shore them up.
through the Fire and Disaster Management Agency, and through
The Economist Intelligence Unit: Recent research indicates that volunteer firefighters’ groups. This allows local residents to be aware
social connections and voluntary action play a major role in of the location of thesources of water and practice to a high degree of
enhancing the safety of a city. What is Tokyo doing to respond to precision using hoses to draw water in the event of a fire. Sometimes
this insight? they have local contests to further refine their skills, with the volunteer
groups and agency working together to greatly increase local safety.
© The Economist Intelligence Unit Limited 2019You can also read